Article

What Is Most Desirable for Nature? An Analysis of Azorean Pupils’ Biodiversity Perspectives When Deciding on Ecological Scenarios

by
Flora Piasentin
1,2,*,†,
Rosalina Gabriel
3,*,†,
Ana M. Arroz
3,
Alexandra R. Silva
1,3 and
Isabel R. Amorim
3
1
Interactive Technologies Institute (ITI/LARSyS), Polo Científico e Tecnológico da Madeira, Caminho da Penteada, piso-2, 9020-105 Funchal, Portugal
2
Centro de Ciências Agrárias, Ambientais e Biológicas, Federal University of Recôncavo da Bahia, Rua Rui Barbosa 710, Cruz das Almas 44380-000, BA, Brazil
3
cE3c—Centre for Ecology, Evolution and Environmental Changes/Azorean Biodiversity Group and University of the Azores, Rua Capitão João d’Ávila, 9700-042 Angra do Heroísmo, Portugal
*
Authors to whom correspondence should be addressed.
These authors contributed equally to this work.
Sustainability 2021, 13(22), 12554; https://doi.org/10.3390/su132212554
Submission received: 16 June 2021 / Revised: 5 November 2021 / Accepted: 11 November 2021 / Published: 13 November 2021
(This article belongs to the Special Issue Biodiversity Education for Sustainable Development)

Abstract

:
Understanding pupils’ biodiversity perspectives is essential to developing educators’ sensitivity to students’ multi-faceted views of the world, thus increasing teaching effectiveness. In this study, we asked 1528 school pupils in the Azores to choose between alternative schemes in three ecological scenarios and to justify their decisions. The study’s objectives were to understand biodiversity perspectives underlying pupils’ choice of the most desirable schemes for nature and to examine whether gender and school level (middle school/high school) influenced their choices. Quantitative (frequency analysis and Chi-square statistics) and qualitative (thematic analysis) methods were applied for data analysis. The majority of pupils made appropriate choices, arguing from different biodiversity perspectives, which were classified in 10 categories and 24 subcategories. High school pupils did not exhibit significant differences among the main arguments employed, and mostly referred to ecological concepts, while middle school pupils exhibited different choices according to gender, emphasizing richness over the threats posed by introduced species. Biodiversity education should thus be strengthened, especially at the middle school level, where different complex issues would benefit from classroom discussion and systematization. The chosen methodological strategy proved to be effective in assessing pupils’ biodiversity perspectives, which may be useful to deal with other ill-structured problems.

1. Introduction

Given the increasing loss of biodiversity and destruction of ecosystems worldwide, appropriate environmental management to achieve biological conservation is an important global issue that needs urgent attention [1]. It is increasingly recognized that decision-making in environmental management should be participatory and transparent, and that the participation of stakeholders is beneficial to the quality and fairness of environmental conservation decisions [2,3]. However, participatory decision-making in environmental management is a complex process, in which there is no clear solution or a single right answer, and where trade-offs between the interests and priorities of multiple stakeholders have to be made [4,5]. The resolution of trade-offs is usually not easy and depends on the stakeholders in the negotiation, who may hold multiple worldviews and understandings about nature [2,3,6].
To participate as full citizens in environmental management decision-making, people should be ecologically literate, which implies being capable of assessing scientific ecological claims and understanding key ecological concepts and processes, as well as comprehending the interconnectedness between ecological systems and human activities [4,7,8,9]. Ecological literacy also involves the ability to properly apply knowledge to make informed decisions regarding environmental management [7,10].
Biodiversity is a key concept within ecological literacy that has been defined as “the variability among living organisms from all sources and the ecological complexes of which they are part...” [11]. Primarily, it considers three levels: within species, between species, and within ecosystems. However, there are different perspectives regarding this term, which may diverge from the dominant one [3,12]. Biodiversity perspectives will be defined in this study as mental organizational structures that are developed by individuals as they observe nature, interact with significant others and receive scientific knowledge instruction [12,13]. Even though ecological literacy is increasingly recognized as an important element within all educational levels, studies show that even in developed regions like the United States of America and the European Union, most citizens do not possess sufficient understanding of key ecological concepts [8,14]. In Europe, a survey conducted in 2013 with 25,537 citizens showed that more than half of the participants declared either that they did not know (30%) or had never heard about (26%) the term “biodiversity”. Furthermore, more than half of the Europeans (54%) perceived that they were not informed about the drivers of biodiversity loss [14].
Schooling is vital for the acquisition of ecological knowledge and understanding. In fact, higher levels of education are positively related to perceived knowledge of biodiversity and biodiversity loss, and to the knowledge and understanding of ecological processes [14,15,16]. A questionnaire study with 44 university students in Cyprus identified that second-year students’ perception of biodiversity knowledge was significantly higher than first-year students [15]. In South Australia, a multiple-choice test assessing 1003 adults’ ecological knowledge and understanding showed that average scores increased with higher levels of education, and more specifically with completed formal education past high school [16]. Therefore, high schoolers are expected to display greater ecological literacy than middle schoolers. In addition, the impact of education on ecological literacy is expected to be greater in individuals who follow a science-based high school education than in those enrolled in other fields of study [16].
There is evidence that a person’s gender has considerable influence on their ecological understanding and their views and attitudes regarding biodiversity. In a survey with 1010 individuals in South Australia, adults’ ecological literacy levels were related to gender, men having higher levels [16], while in a study with 428 pupils (8–18 years old) in Austria, Kelemen-Finan et al. (2018) found out that boys agreed more strongly with negative statements about biodiversity than girls [17].
To date, several studies have examined individual perspectives on biodiversity [12,18,19,20,21,22]. For instance, Dikmenli [20], studying 130 biology students in Turkey, found eight conceptual categories associated with the biodiversity terms: “Ecosystem Diversity”, “Species Diversity”, “Biological Kingdoms”, “Genetic Diversity”, “Environmental Problems”, “Taxonomic ranks”, “Technology” and “Scientists”, in descending order of relevance. A study of 243 Azorean teachers emphasized the species-level and conservation relevance of “biodiversity” as detrimental to the ecosystem and genetic dimensions [22]. A more limited number of studies have investigated how pupils’ perspectives regarding ecology and biodiversity are applied in a simulated environmental decision-making context [4,5,13,23,24]. A study carried out by Jimenez-Alexandre [23], for instance, determined that high school pupils used different types of warrants (general assumptions that connect evidence to claims) to support their environmental decisions, which were linked to ecological concepts, landscape impacts, technical features of the project and values hierarchy. Other studies have shown that the criteria underlying pupils’ decisions to protect endangered species were diverse, ranging from aesthetic considerations (physical appearance and visual attractiveness) to anthropocentric (usefulness to human beings) and ecocentric (role in maintaining nature’s balance) motives [12]. Moreover, it is recognized that relevant ecological conceptual knowledge and value judgements play an important role in pupils’ choices leading to reasoned environmental decisions [4,5,23].
In this study, we aim to explore Azorean pupils’ biodiversity perspectives by investigating how they make decisions about the desirability of hypothetical scenarios for nature and how they justify their decisions. Understanding pupils’ biodiversity perspectives and how these vary according to school level and gender may enhance biodiversity education effectiveness by increasing educators’ sensitivity to pupils’ views and their previous conceptual knowledge or misconceptions. Thus, this study was guided by the following questions:
-
Which biodiversity perspectives underlay pupils’ selection of the most desirable hypothetical schemes for nature within different ecological scenarios?
-
Which arguments did pupils use to justify the “desirability for nature” of hypothetical schemes within those ecological scenarios?
-
What was the impact of pupils’ gender and school level on their scheme selection and justifying arguments?
The paper is organized into four main sections. This introductory section is followed by a description of the materials and methods used. Then the results are presented, followed by a discussion of the main findings regarding how pupils from different gender groups (boy/girl) and school levels (middle/high school) decide and argue in multiple and even contrasting ways, ending with some recommendations for biodiversity education.

2. Materials and Methods
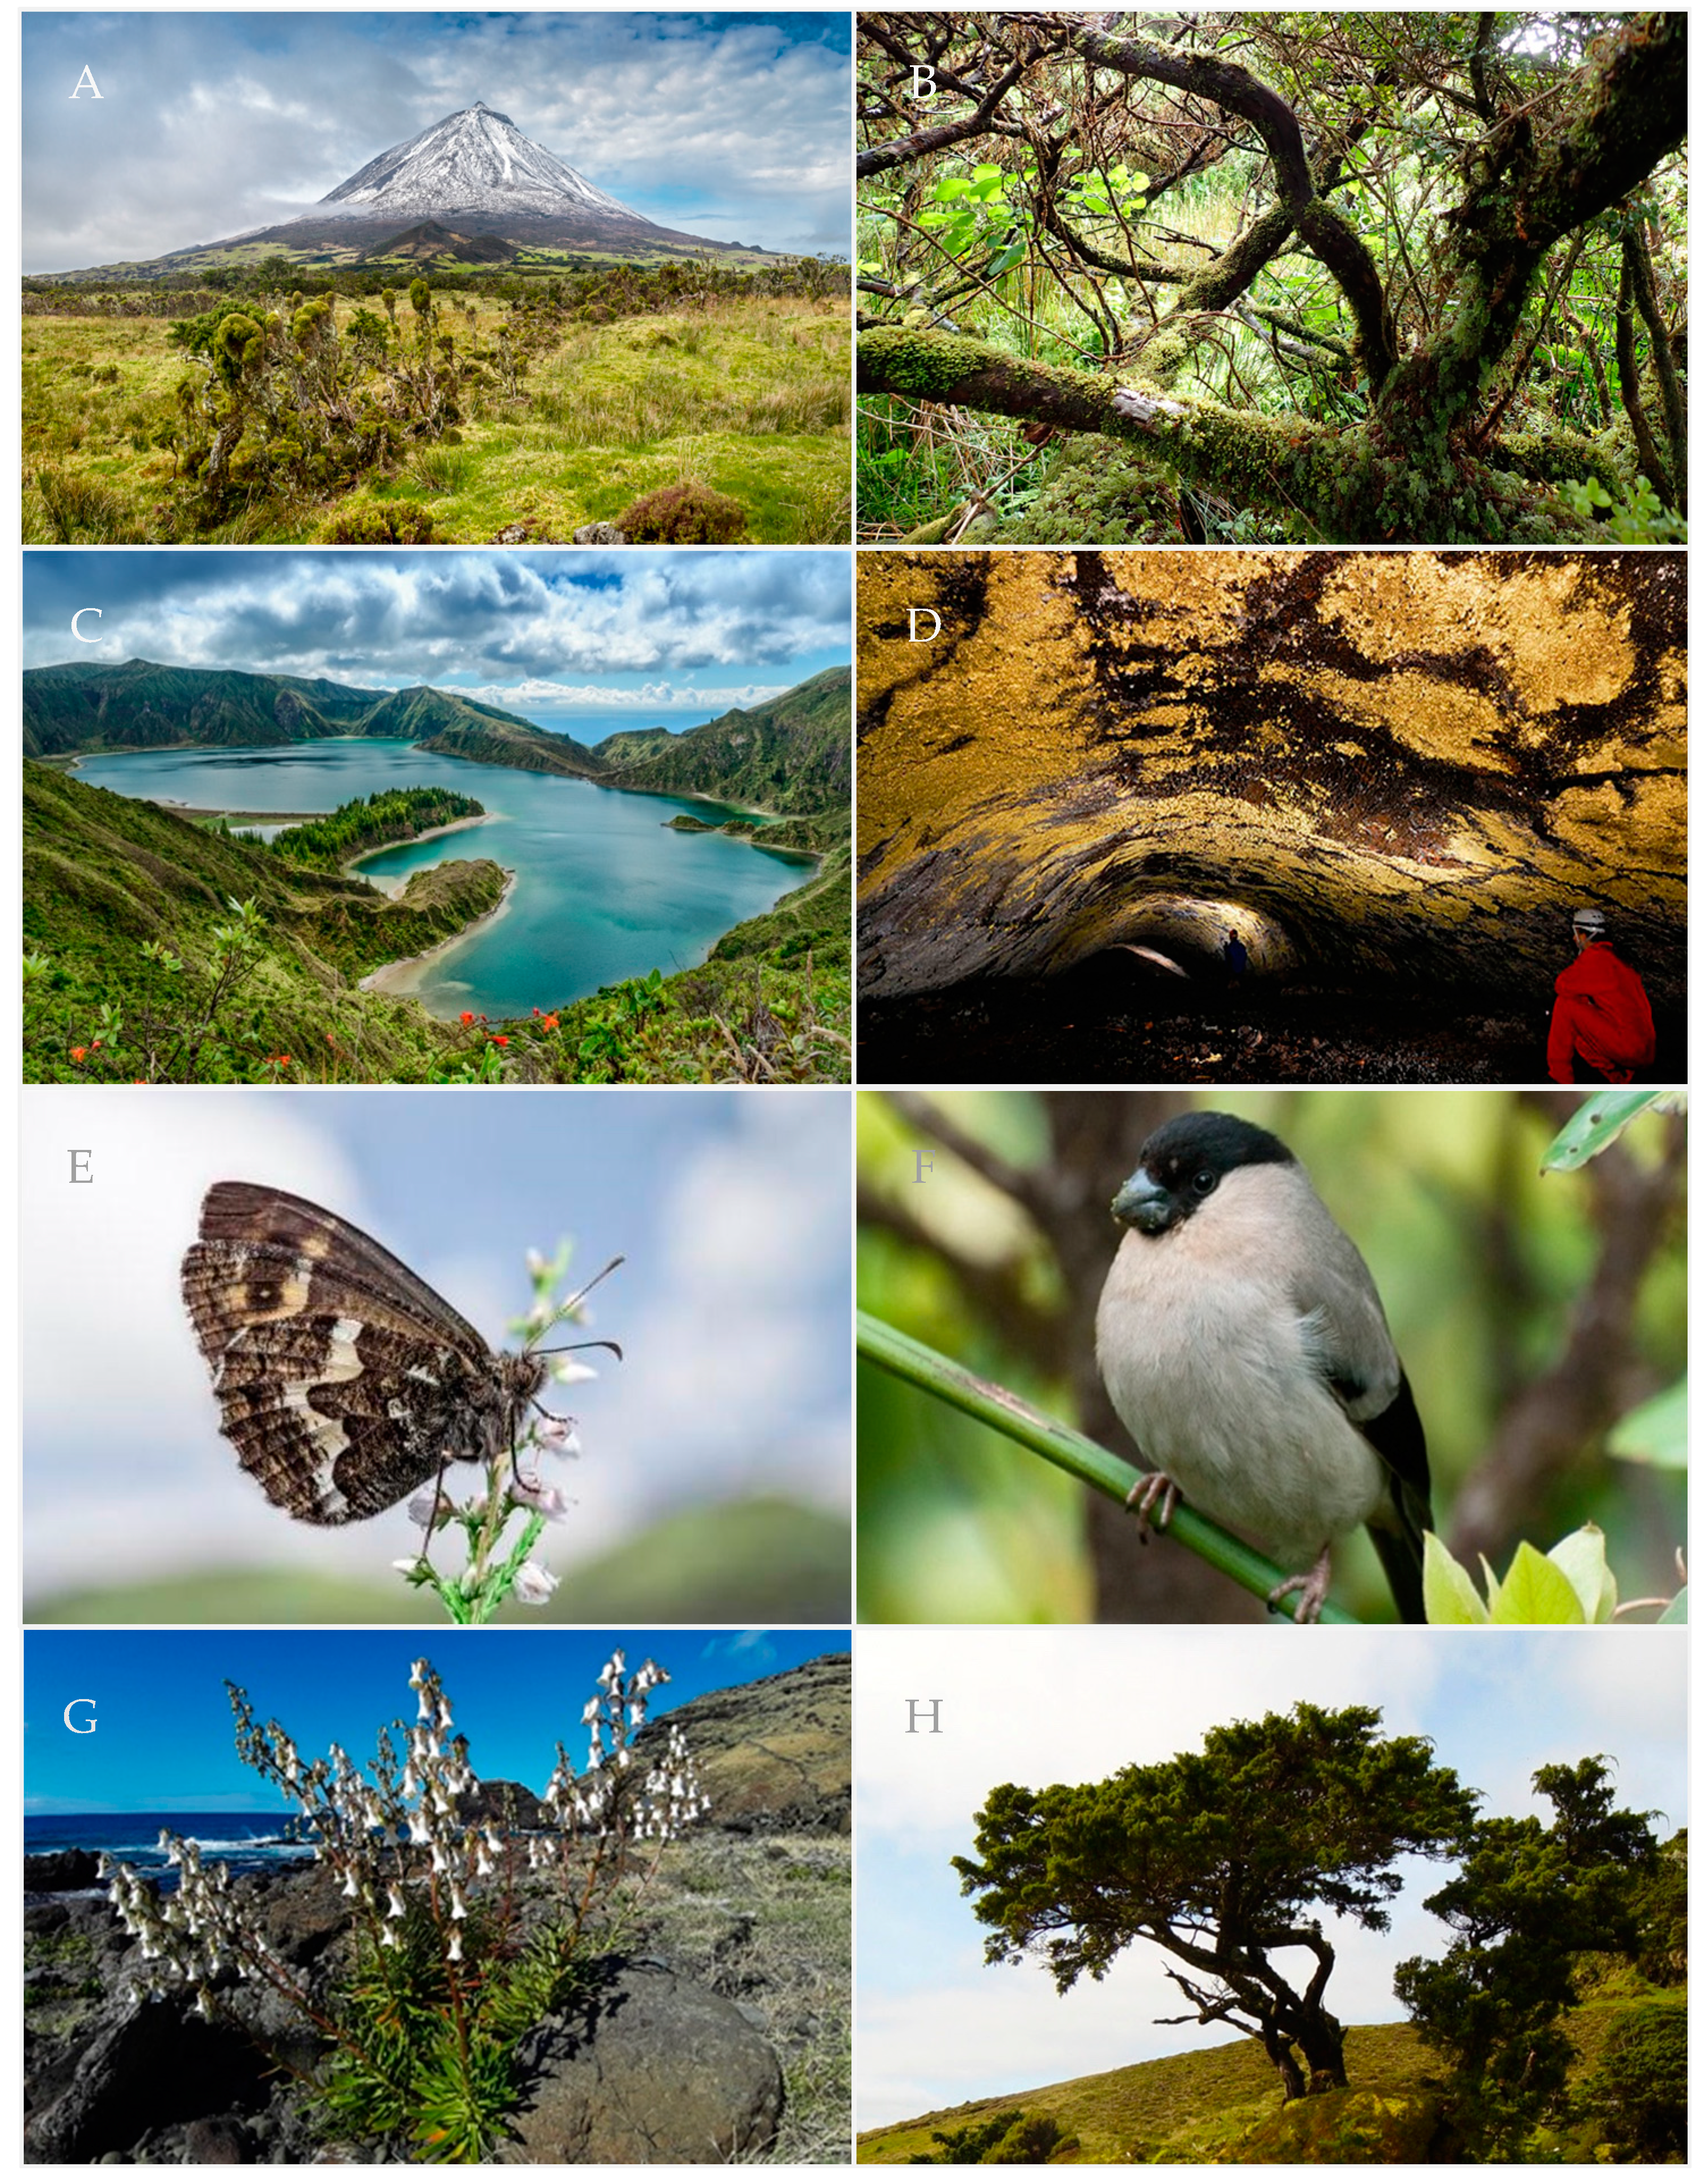
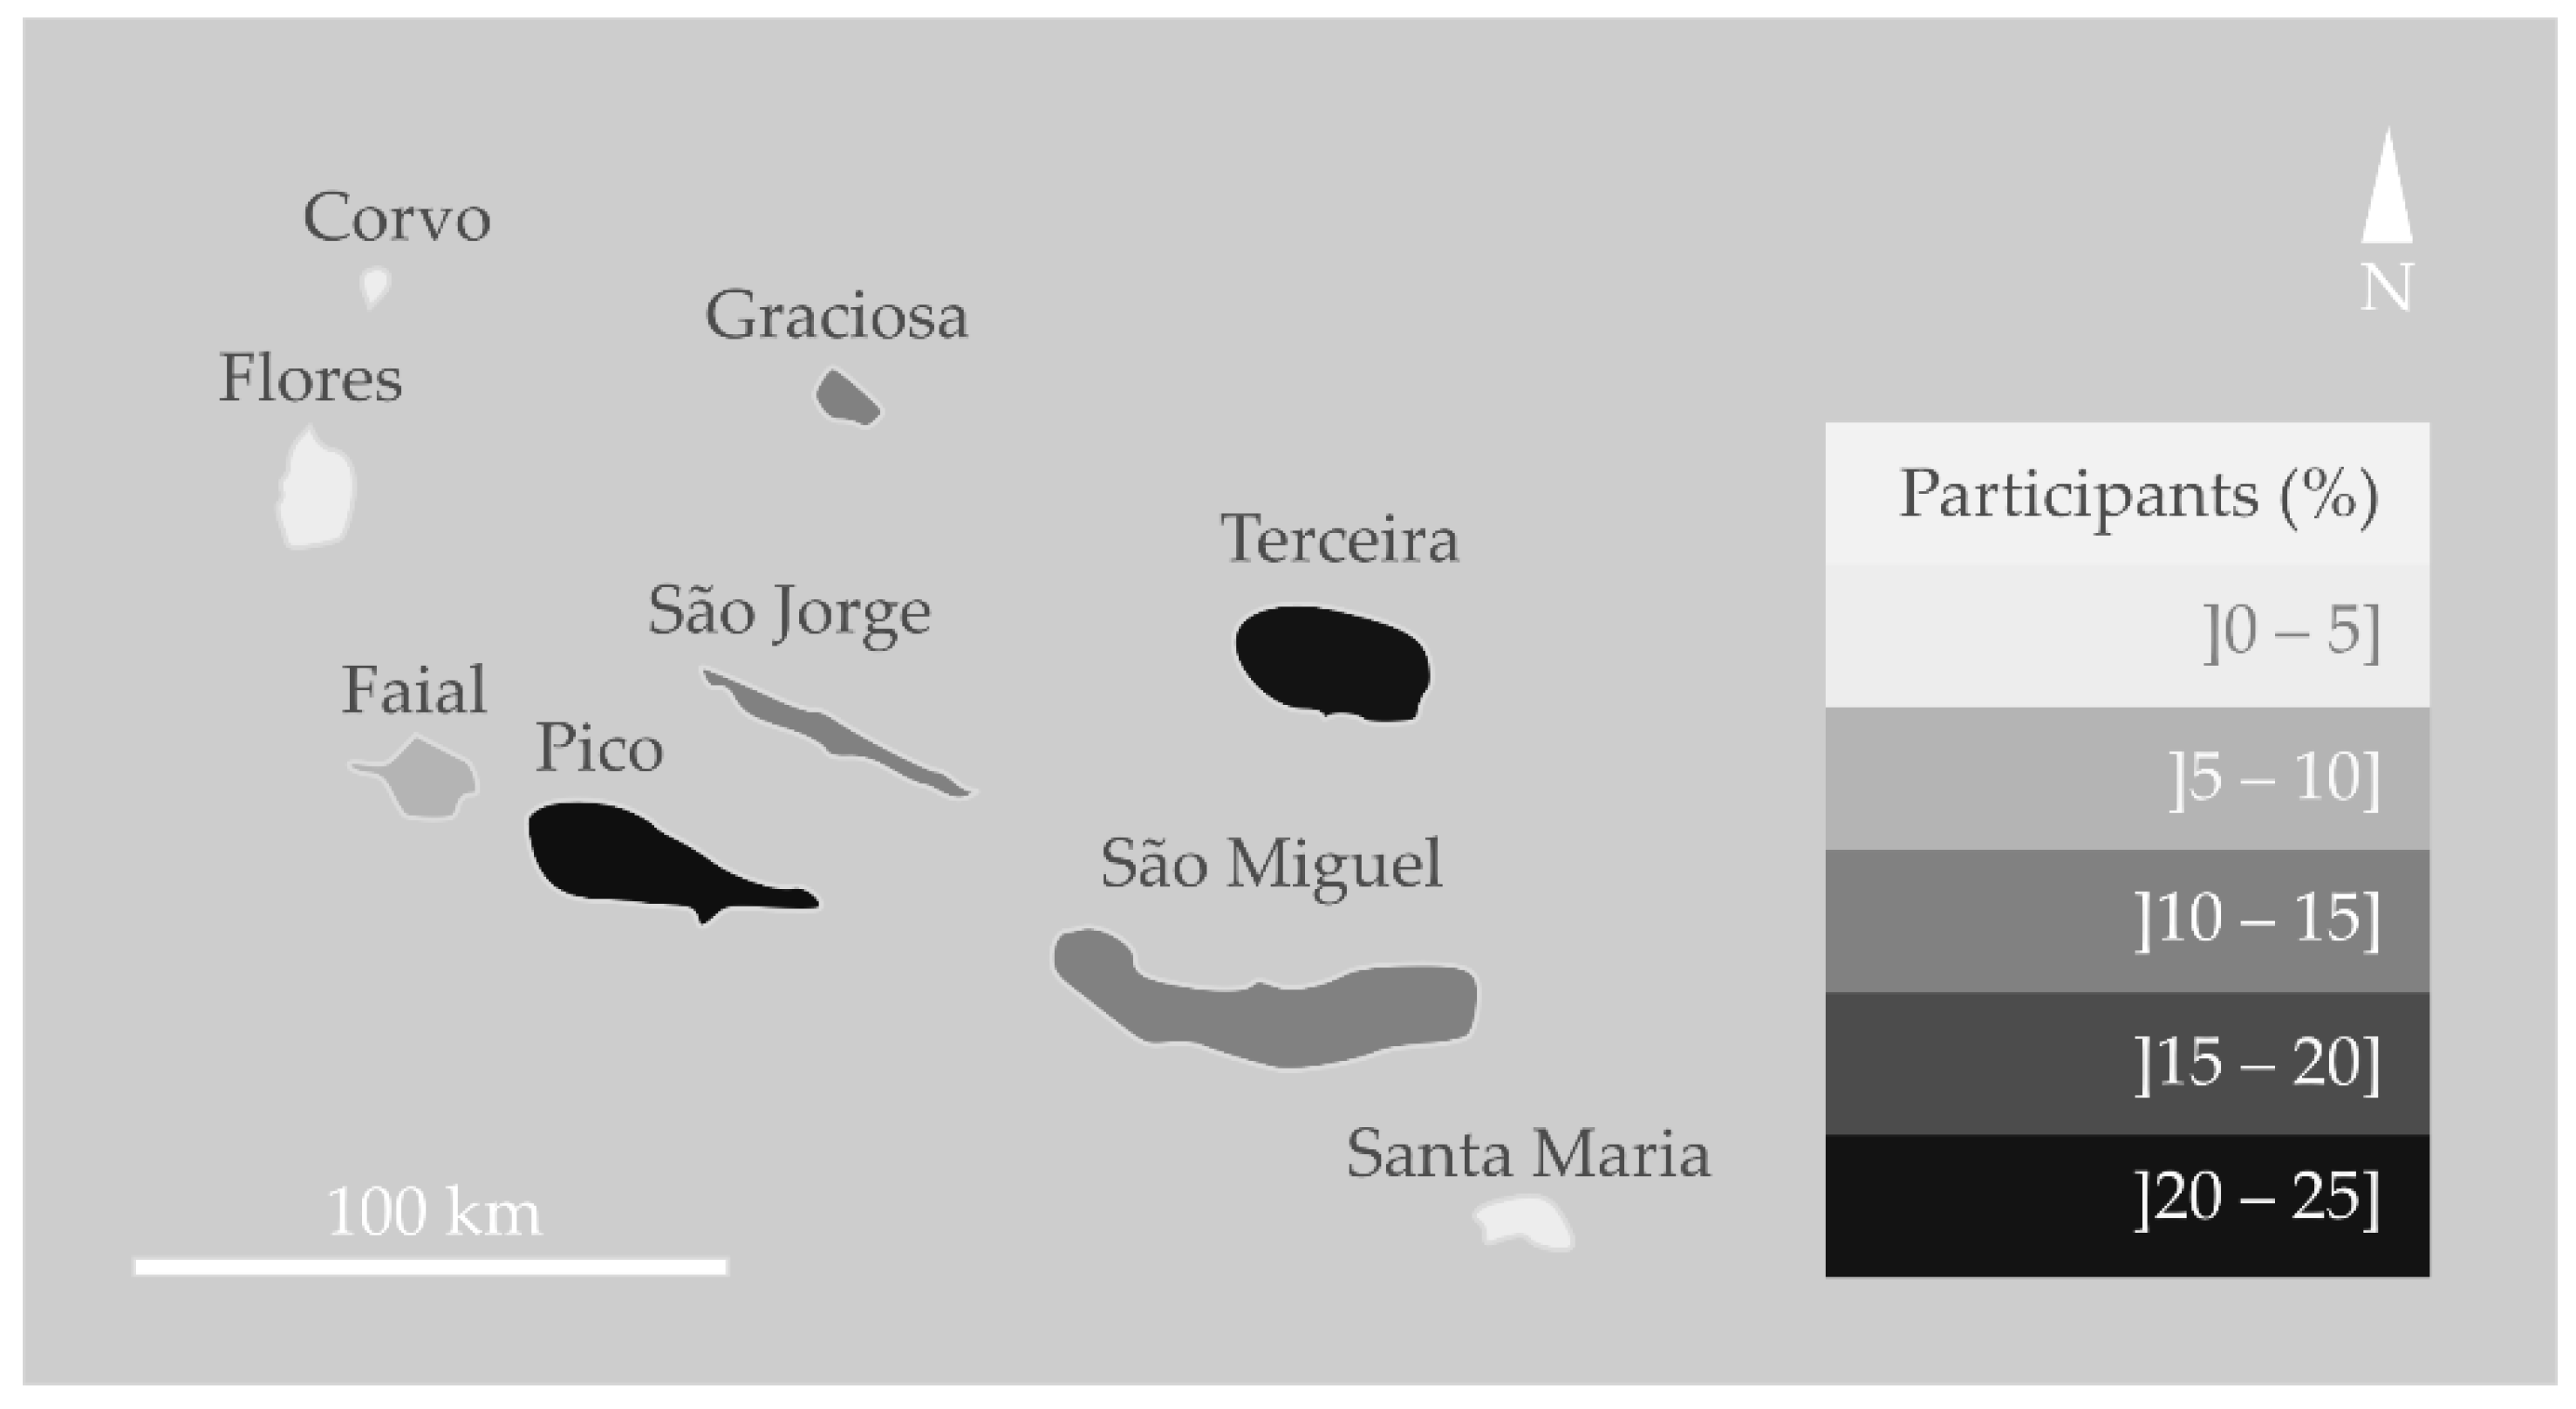
2.1. Study Area

The Azores (Figure 1) is a Portuguese autonomous archipelago formed of nine main islands geographically organized in three groups: Corvo and Flores (Western group), Faial, Pico, São Jorge, Graciosa and Terceira (Central group), and São Miguel and Santa Maria (Eastern group). The islands are located in the North Atlantic Ocean between 36–43° North and 25–31° West. The Azores has a total area of 2333 km2 and 242,846 inhabitants [25], unequally distributed among the islands.
Due to their rich biodiversity, the Azores and all the other Macaronesian archipelagos are included in the Mediterranean Hotspot of Biodiversity [26]. In fact, there are more than 400 Azorean endemic species, and many single-island endemics, including arthropods (266 taxa), mollusks (49 taxa), chordates (especially birds and bats [12 + 1 taxa]), and vascular plants and bryophytes (73 + 7 taxa) [27]. Besides this impressive number of unique species, the Azores also harbors important areas of diversity, which form the core of the nine terrestrial Natural Parks and the Marine Natural Park of the Azores. Figure 2 illustrates the regional context wherein the pupils are brought up, with four of the most paradigmatic natural areas (volcanic mountains, laurissilva forests, lagoons and lava tubes) and four endemic species of the Azores (butterfly, bullfinch, bellflower, juniper).
Conservation-wise, protected areas are organized in the Regional Network of Protected Areas, harboring most of the endemic species, which are protected by law. The economy of the region is largely based on natural resources, depending mostly on agriculture, livestock (mainly dairy cattle), fishing, and industries linked to food processing (milk, cheese). More recently, adventure and ecological tourism have emerged as promising economic activities [28,29].

2.2. Biodiversity Education in Portuguese and Azorean Educational Curricula

Over the twelve years of Portuguese compulsory education, pupils are introduced to content related to the natural environment, ecology, and nature conservation. In the first four years of education, children are encouraged to explore the natural world and the relationships between living beings and abiotic factors. By educating them on local economic activities, they are also introduced to the negative impacts of humans on species and natural resources, and the role of protected areas. Educational content more specific to biodiversity and ecological processes is explored in the fifth, and briefly in the sixth, grades, at an introductory level, and later, more fully in the eighth grade, where notions of sustainable development, ecosystem services and ecosystem dynamic equilibrium are introduced. The consequences of human activities on ecosystems (such as biological invasions) and the importance of nature conservation and protected areas are also discussed in middle school. With a whole section dedicated to “Sustainability on Earth” in the eighth grade, pupils who complete middle school education are expected to know about the negative impacts of human actions on species and ecosystems, and how to protect them. However, biodiversity and the complex ecological processes that regulate ecosystems are only explored in depth at high school, and only by those students who choose to embark, specifically, on a science and technology course [30].
In the Azores, the elementary and middle school curricula are adapted to the region’s socioeconomic and environmental context [31], i.e., while exploring the national curricula on biodiversity and ecological processes, pupils also receive specific information about Azorean biodiversity, Azorean protected areas and other regional-specific environmental issues. However, more complex knowledge about biodiversity and ecosystem interactions is only taught to students who choose biology in high school. Similarly, content about evolution is briefly mentioned in the fifth grade but only taught in depth in the second and third years of high school.
The middle (7th to 9th grades) and high (10th to 12th grades) school system in the Azores is formed of 35 schools, of which 13 provide only middle school education, distributed among the nine islands.

2.3. Data collection Design and Scenarios Description

Data collection consisted of a questionnaire-based inquiry. In June and October 2012, a paper-and-pencil questionnaire was distributed to all 35 Azorean middle and high schools, with two replicates per education level per school. The questionnaire contained four sections with 21 survey items assessing pupils’ perceptions, beliefs, and attitudes regarding ecological and biological issues, as well as demographic and background information. Pupils could opt out of participating in the survey. Within the questionnaire items, there were three problem situations involving scenarios with two alternative schemes (Figure 3).
Scenarios are useful teaching resources in which pupils are called upon to apply their prior knowledge, experiences, personal values, and critical thinking skills to solve a problem or to decide regarding a specific subject [32]. Scenarios represent ill-structured problems; complex problems that can be interpreted in different ways and have many possible solutions [33].
For each scenario, pupils were requested to decide on which of the two environmental schemes was the most desirable for nature and to provide arguments justifying their decision.
The following questions were posed in each scenario: “In your opinion, which of the following environmental schemes is the most desirable for nature?”, and “Why?” By asking to justify their selection through an open-ended question, pupils were encouraged to reflect on their decision, which provided a way to assess their understanding about the ecological concepts/processes in place. This methodology ensured sensitivity to the whole scope of meanings of the participants, collecting all arguments, enunciated according to their different cultural backgrounds. Each of the three scenarios is briefly described below (see also Table 1 for ecological indexes):
Scenario 1: both environmental schemes A and B had equal species richness and numbers of individuals; however, environmental scheme A had higher species evenness in comparison to B, wherein one of the species dominated.
Species richness refers to the number of species present in an area while species evenness measures the equitability of the relative abundance of the species, and is an important biodiversity component affecting key ecological processes and contributing to ecosystem stability [34]. Therefore, since higher species evenness is important for biodiversity conservation, other components being equal, A is the most suitable scheme.
Scenario 2: both environmental schemes C and D had similar species evenness and numbers of individuals but differed in species richness and abundance. Species abundance refers to the number of individuals per species. Scheme C had higher species richness while D had higher species abundance. Given the importance of species richness to key ecosystem processes and biodiversity conservation, C is the most appropriate scheme. However, given the fact that larger populations are more resilient to environmental pressures than smaller ones, D may also be an adequate option, as long as an appropriate justifying argument is used. In fact, abundant species are more likely to succeed (survival and evolution) and less likely to become extinct after disturbances [34].
Scenario 3: environmental schemes E and F had similar species evenness, but differed in species richness and colonization mode (with or without human intervention, respectively). Scheme E had higher species richness (seven species), but exotic species predominated over natives (four vs. three), whereas scheme F had fewer species (three), but all of them were native. This scenario introduced a new factor: colonization type (native vs. introduced) associated with the potential problem of invasive species. Species introduced from other places may become invasive and adversely affect species previously present in the environment, ultimately impacting the entire ecosystem; this is especially harmful on islands [35]. Scheme F is therefore the most desirable one.

2.4. Data Analysis

Data collected from the paper-and-pen questionnaires were inserted into an Excel file, from where descriptive, descriptive–interpretive and inferential statistical analyses were computed. Frequencies, percentage indices and charts were the main forms of statistical descriptive analyses, while the Chi-square test was calculated to measure the relationship existing between the two independent variables, gender (boy/girl) and school level (middle school [MS]/high school [HS]) and the choice of schemes among the three scenarios.
Toulmin’s Model of Argumentation [36] was used to analyze pupils’ arguments in their decision-making on biodiversity conservation scenarios. From the six elements that Toulmin identifies in an argument, we used the three that are essential to any argument—claim, grounds, and warrant, which in our case were: the claim—the chosen ecological scheme; the grounds—the data selected from the visual evidence made available in the scheme selected and used in the answer for supporting the claim; and the warrant (implied or stated)—the assumptions (or reasons) that link the grounds to the claim (e.g., ecological criteria).
Pupils’ selection of environmental schemes was analyzed through quantitative analysis (analysis of frequency). The association of the independent variables gender and school level, and the dependent variables pupils’ responses (selection of environmental scheme and justifying argument categories), was tested for statistical significance. Pearson’s Chi-square statistic was chosen to test whether there is an association between categorical variables, that is, if they are dependent among themselves.
A descriptive interpretive approach was adopted, in which the criteria and not the scientific legitimacy of pupils’ responses were explored. The responses were categorized with thematic analysis adopting an inductive approach, where a posteriori themes and codes emerge from the data. Thematic analysis [37] is a useful method for examining the perspectives of different research participants, leading to the identification of patterns of similarities and differences in a dataset. There were two types of responses that were not included in the thematic analysis: when the respondent left the answer blank (non-response), and when the meaning of the arguments presented could not be identified or was incoherent (non-quotable). The remaining quotable responses were analyzed by identifying the grounds and warrants contained in each justification in connection to claims. An argument contained just one claim (the scheme selected previously) and one or more grounds and/or warrants (in this study up to three). For instance, many pupils erroneously used the term “species” to mean “individuals” and vice-versa. As a result, we had to deduce grounds and/or warrants by taking into consideration the claim made (the scheme selected). The argument elements (grounds and warrants) identified in pupils’ justifications were classified into ten main thematic categories (in alphabetical order): Aesthetics, Authoritarianism, Conservation, Diversity, Don’t Know, Ecological Dynamics, Egocentrism, Ethics, Evolution, and Social Dynamics. Within these 10 categories, a total of 24 subcategories were typified (Appendix A, Table A1). The first scenario scored 1089 warrants and/or grounds, based on the answers of 976 pupils; the second scenario 898, based on 827 answers, and the third scenario 978, based on 821 answers.
The coding process was tested and validated through interrater reliability using the Kappa statistic [38,39]. Three of us coded the same 150 answers (5.4% of all answers) independently, according to the category system defined (Appendix A, Table A1). Interrater reliability before comparison of coding and discussion of disagreements for new coding among raters was almost perfect for Scenario 1 (free marginal kappa (K) = 0.92), and was strong for Scenario 2 (free marginal kappa (K) = 0.84) and Scenario 3 (free marginal kappa (K) = 0.81), considering a 95% confidence interval. Afterwards, the coded data were analyzed quantitatively and further examined qualitatively by employing an interpretative approach.
The biodiversity perspectives’ construct validity was based on the thematic analysis of pupils’ answers, which started with the content analysis of pupils’ justifications by looking at the scheme selected, interpreting them and coding them. Afterwards, similar codes were grouped and categories were identified a posteriori based on the codes generated, without imposing predefined categories. The classification of responses into different categories was carried out independently by three researchers, who then compared their answers and discussed their interpretations to reach a consensus on the final categorization through triangulation.

2.5. Sample Characteristics

A total of 1528 pupils from 21 schools from all Azores islands returned the questionnaires; 940 in June and 588 in October of 2012. This sample represented 5% of all pupils enrolled at middle and high schools in the 2012 school year in the Azores.
Table 2 displays the main sample descriptors. The islands with the highest number of participating schools (five) were Terceira and São Miguel, followed by Pico (four) and São Jorge (three). Pupils’ participation in the inquiry was unequal among islands and island groups, with the greatest number of participants coming from the Central Group Islands (76.8%), namely, Terceira (24.67%) and Pico (19.70%) (Figure 1).
In our sample, girls represented more than half (56%) of the participants. Pupils ranged in age from 11 to 23, with an average of 14.52 (±1.94 year) and a mode of 14 years. About two thirds (68%) of the pupils were enrolled in MS, while the remaining attended HS. The application of the questionnaires in June coincided with the period of obligatory external exams for certain grades, such as 11th and 12th grades, and therefore these grades were slightly underrepresented in our sample.

3. Results

3.1. Pupils’ Selection of the Most Desirable Schemes for Nature

The results obtained for the selection of the schemes chosen as the most desirable for nature in each scenario are shown in Table 3. Additional information may be found in the Supplementary Materials (Table S1, regarding gender; Table S2 regarding school level).
The first scenario obtained the highest response rate in the selection of schemes, while for the second and third scenarios, response rates were slightly lower. The majority of pupils chose environmental scheme A over B and scheme C over D, while for the third scenario, scheme F obtained a slightly greater preference over E. A few pupils recognized that they did not know which scheme to select, while more than one fifth of the pupils did not respond to the questions for the three scenarios.
More than three quarters of pupils made adequate biodiversity conservation decisions in Scenarios 1 and 2, favoring the environmental schemes with greater species evenness and richness, respectively. However, in Scenario 3, there was less consensus on the most desirable scheme, between one with fewer species, all native (F), and another with a higher number of species, mostly exotic (E). These results may be better understood by looking at pupils’ main justifications presented to support their decisions (Section 3.3).

3.2. The Influence of Gender and School Level on Scheme Selection

For all scenarios, girls responded more often than boys (Scenario 1 [X2 = 13.62 df = 1, p < 0.001, N = 1344], Scenario 2 [X2 = 8.69 df = 1, p = 0.003, N = 1344], and Scenario 3 [X2 = 11.34 df = 1, p < 0.001, N = 1344]), and HS pupils responded more often than MS pupils
The results of the Chi-square test show that there were some significant associations between the independent variables of pupils’ school level and gender and scheme selection (Table 4). HS pupils chose schemes A and F more often than MS pupils, while girls tended to choose scheme C more often than boys. It is noteworthy that when analyzing the selection of schemes among HS pupils there were no significant differences between genders, whereas among MS pupils, girls preferred schemes C and E, both exhibiting higher richness, although the significance of the latter exhibited only a marginal significance.

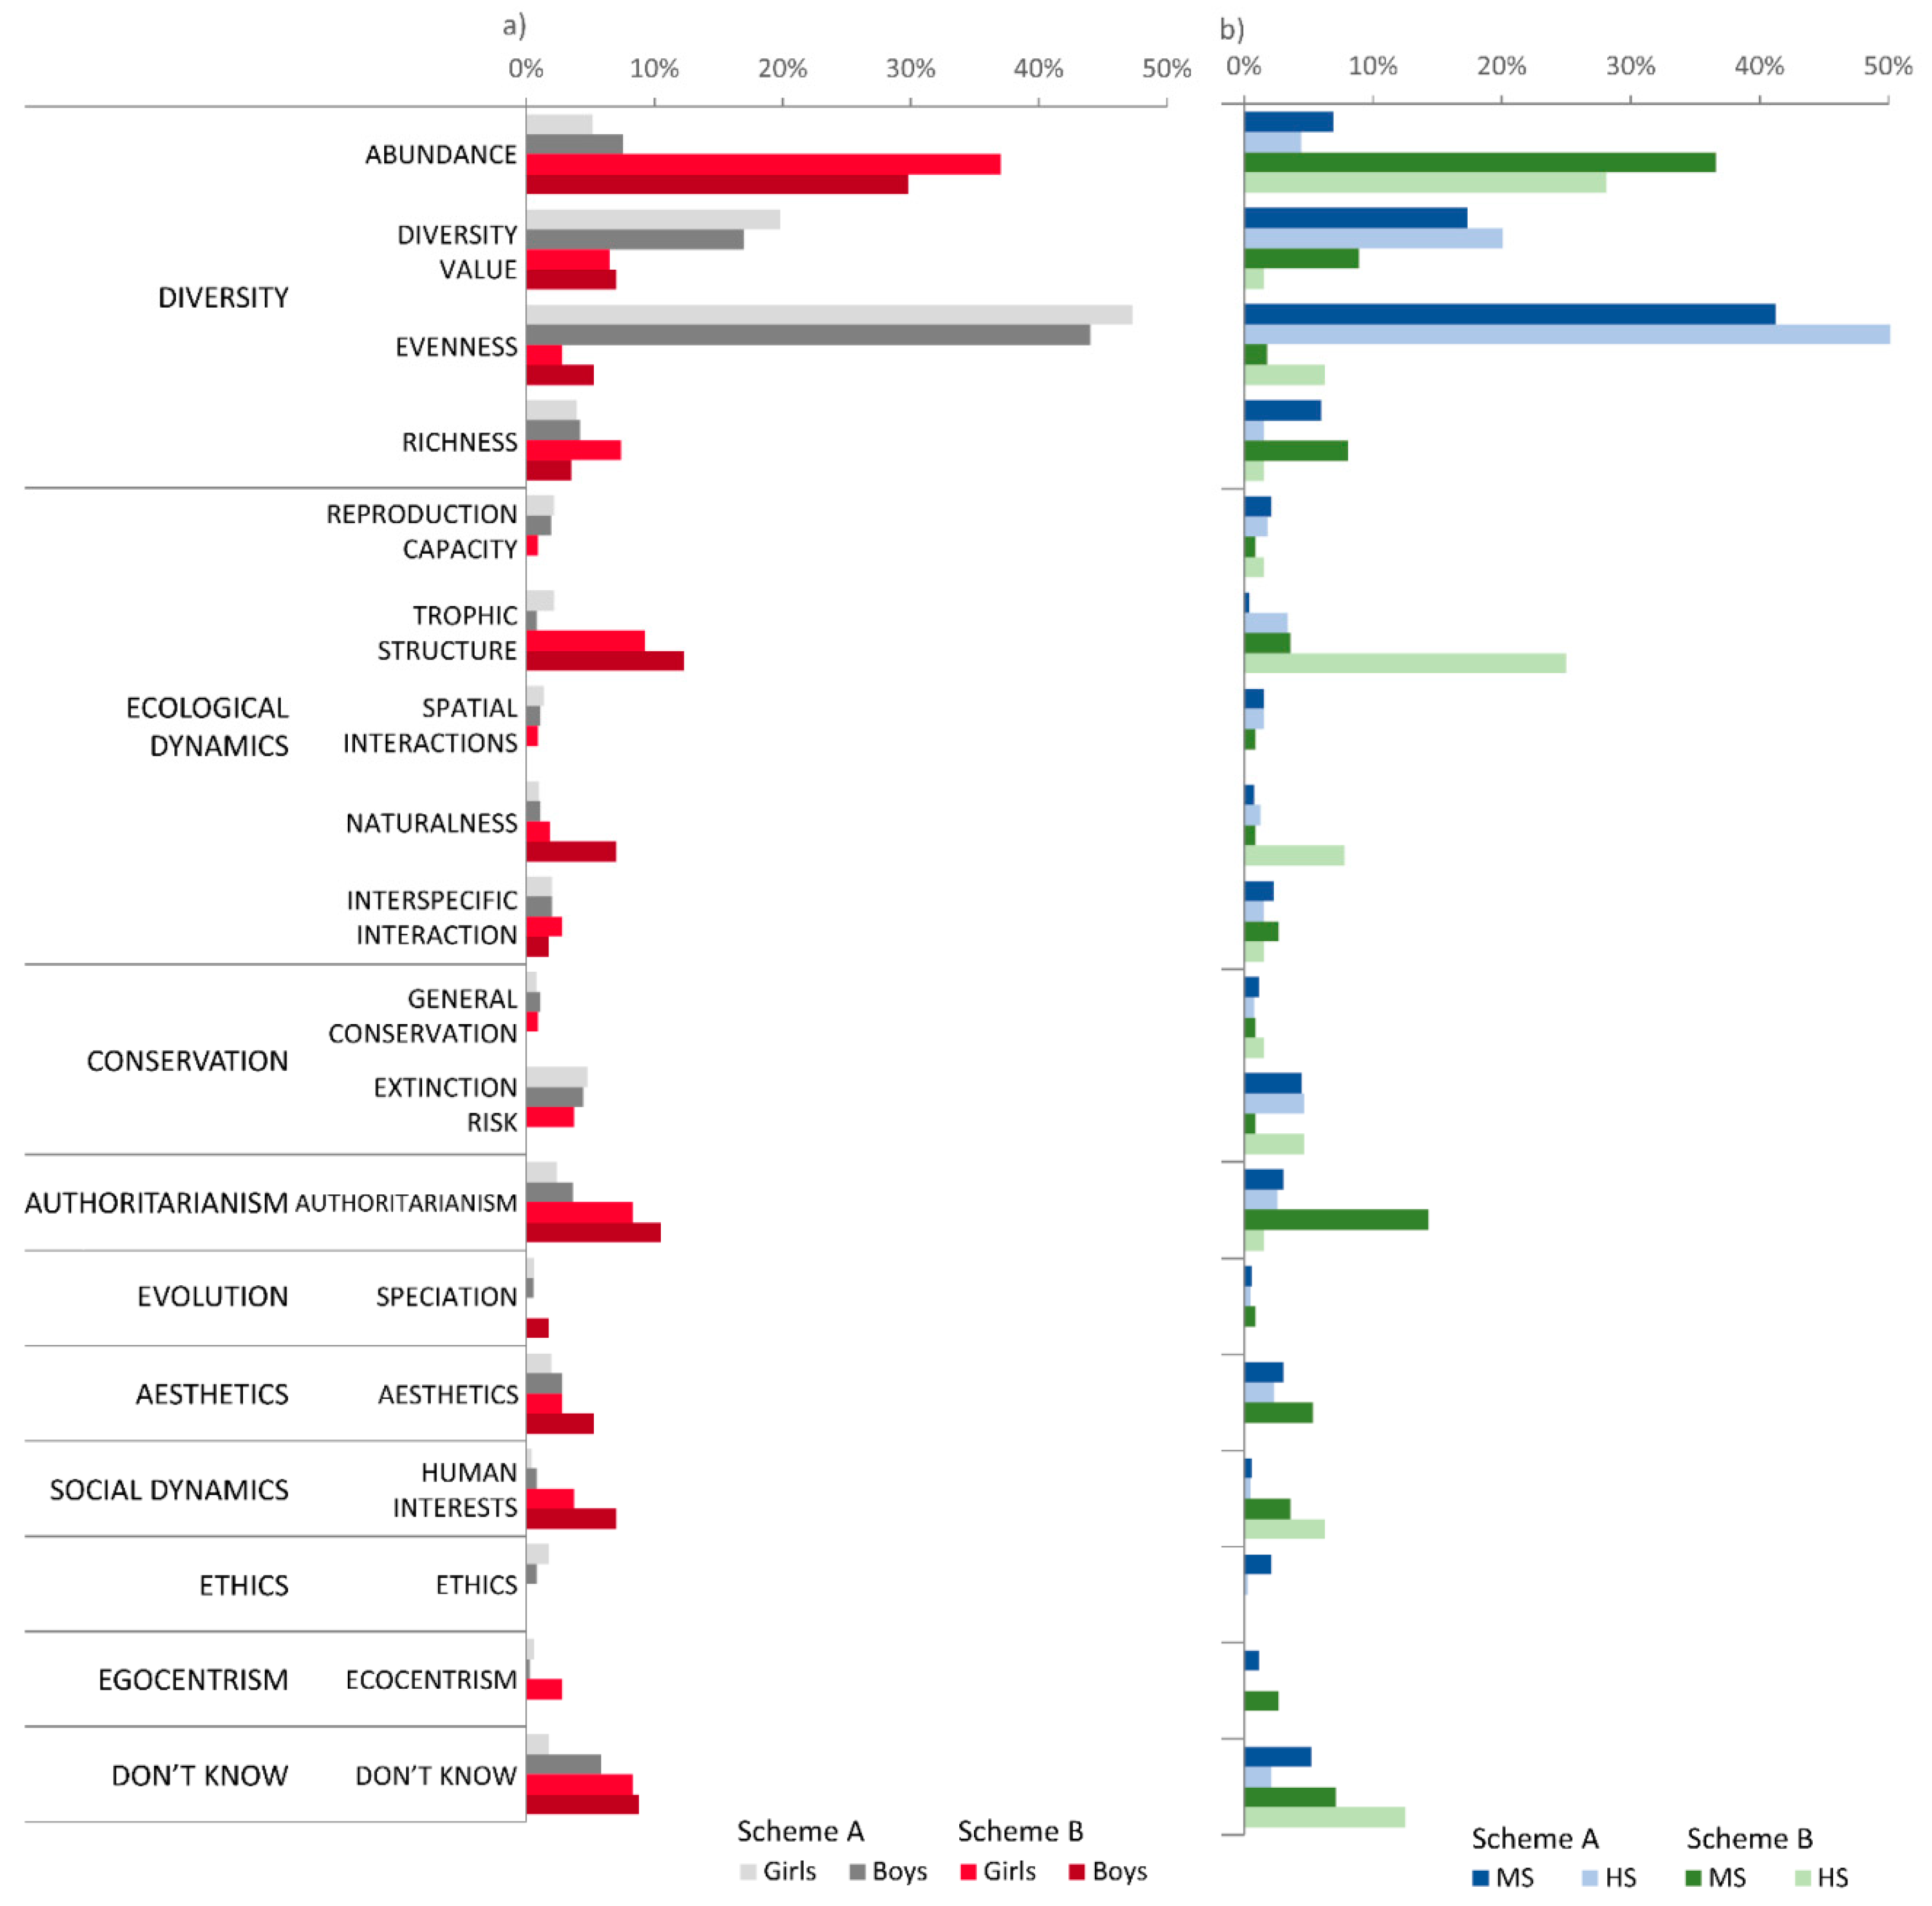
3.3. Pupils’ Main Justifications for Scheme Selections

A diverse range of themes was identified in the justifications provided by pupils, classified in ten categories and 24 subcategories for the three scenarios (Appendix A: Table A1; Figure 4, Figure 5 and Figure 6). By a great difference, most arguments identified were classified within the Diversity category, with an average of 57.7% for the three scenarios, followed by the Ecological Dynamics (13.9%) and Conservation (7.4%) categories.
Pupils who acknowledged not knowing why they chose a certain scheme (Don’t Know category) averaged 7.1% for the three scenarios. The remaining categories obtained lower frequencies (less than 5% each).
Across the three scenarios, MS and HS pupils showed marked differences in their responses to the second question following the choice of scheme “Why?” MS pupils, and within this study level most often boys, provided non-responses more often than HS pupils, as well as more justifications classified as Don’t Know, Authoritarianism and Aesthetics. On the other hand, HS pupils provided complete arguments (containing two to three argument elements) and justifications classified within the Ecological Dynamics and Conservation categories more often than MS pupils. Even though MS and HS pupils used arguments from the Diversity category in similar proportions, within this category, MS pupils resorted more often to the Species richness subcategory.
The main categories and subcategories of argument elements identified for each scenario are presented below.

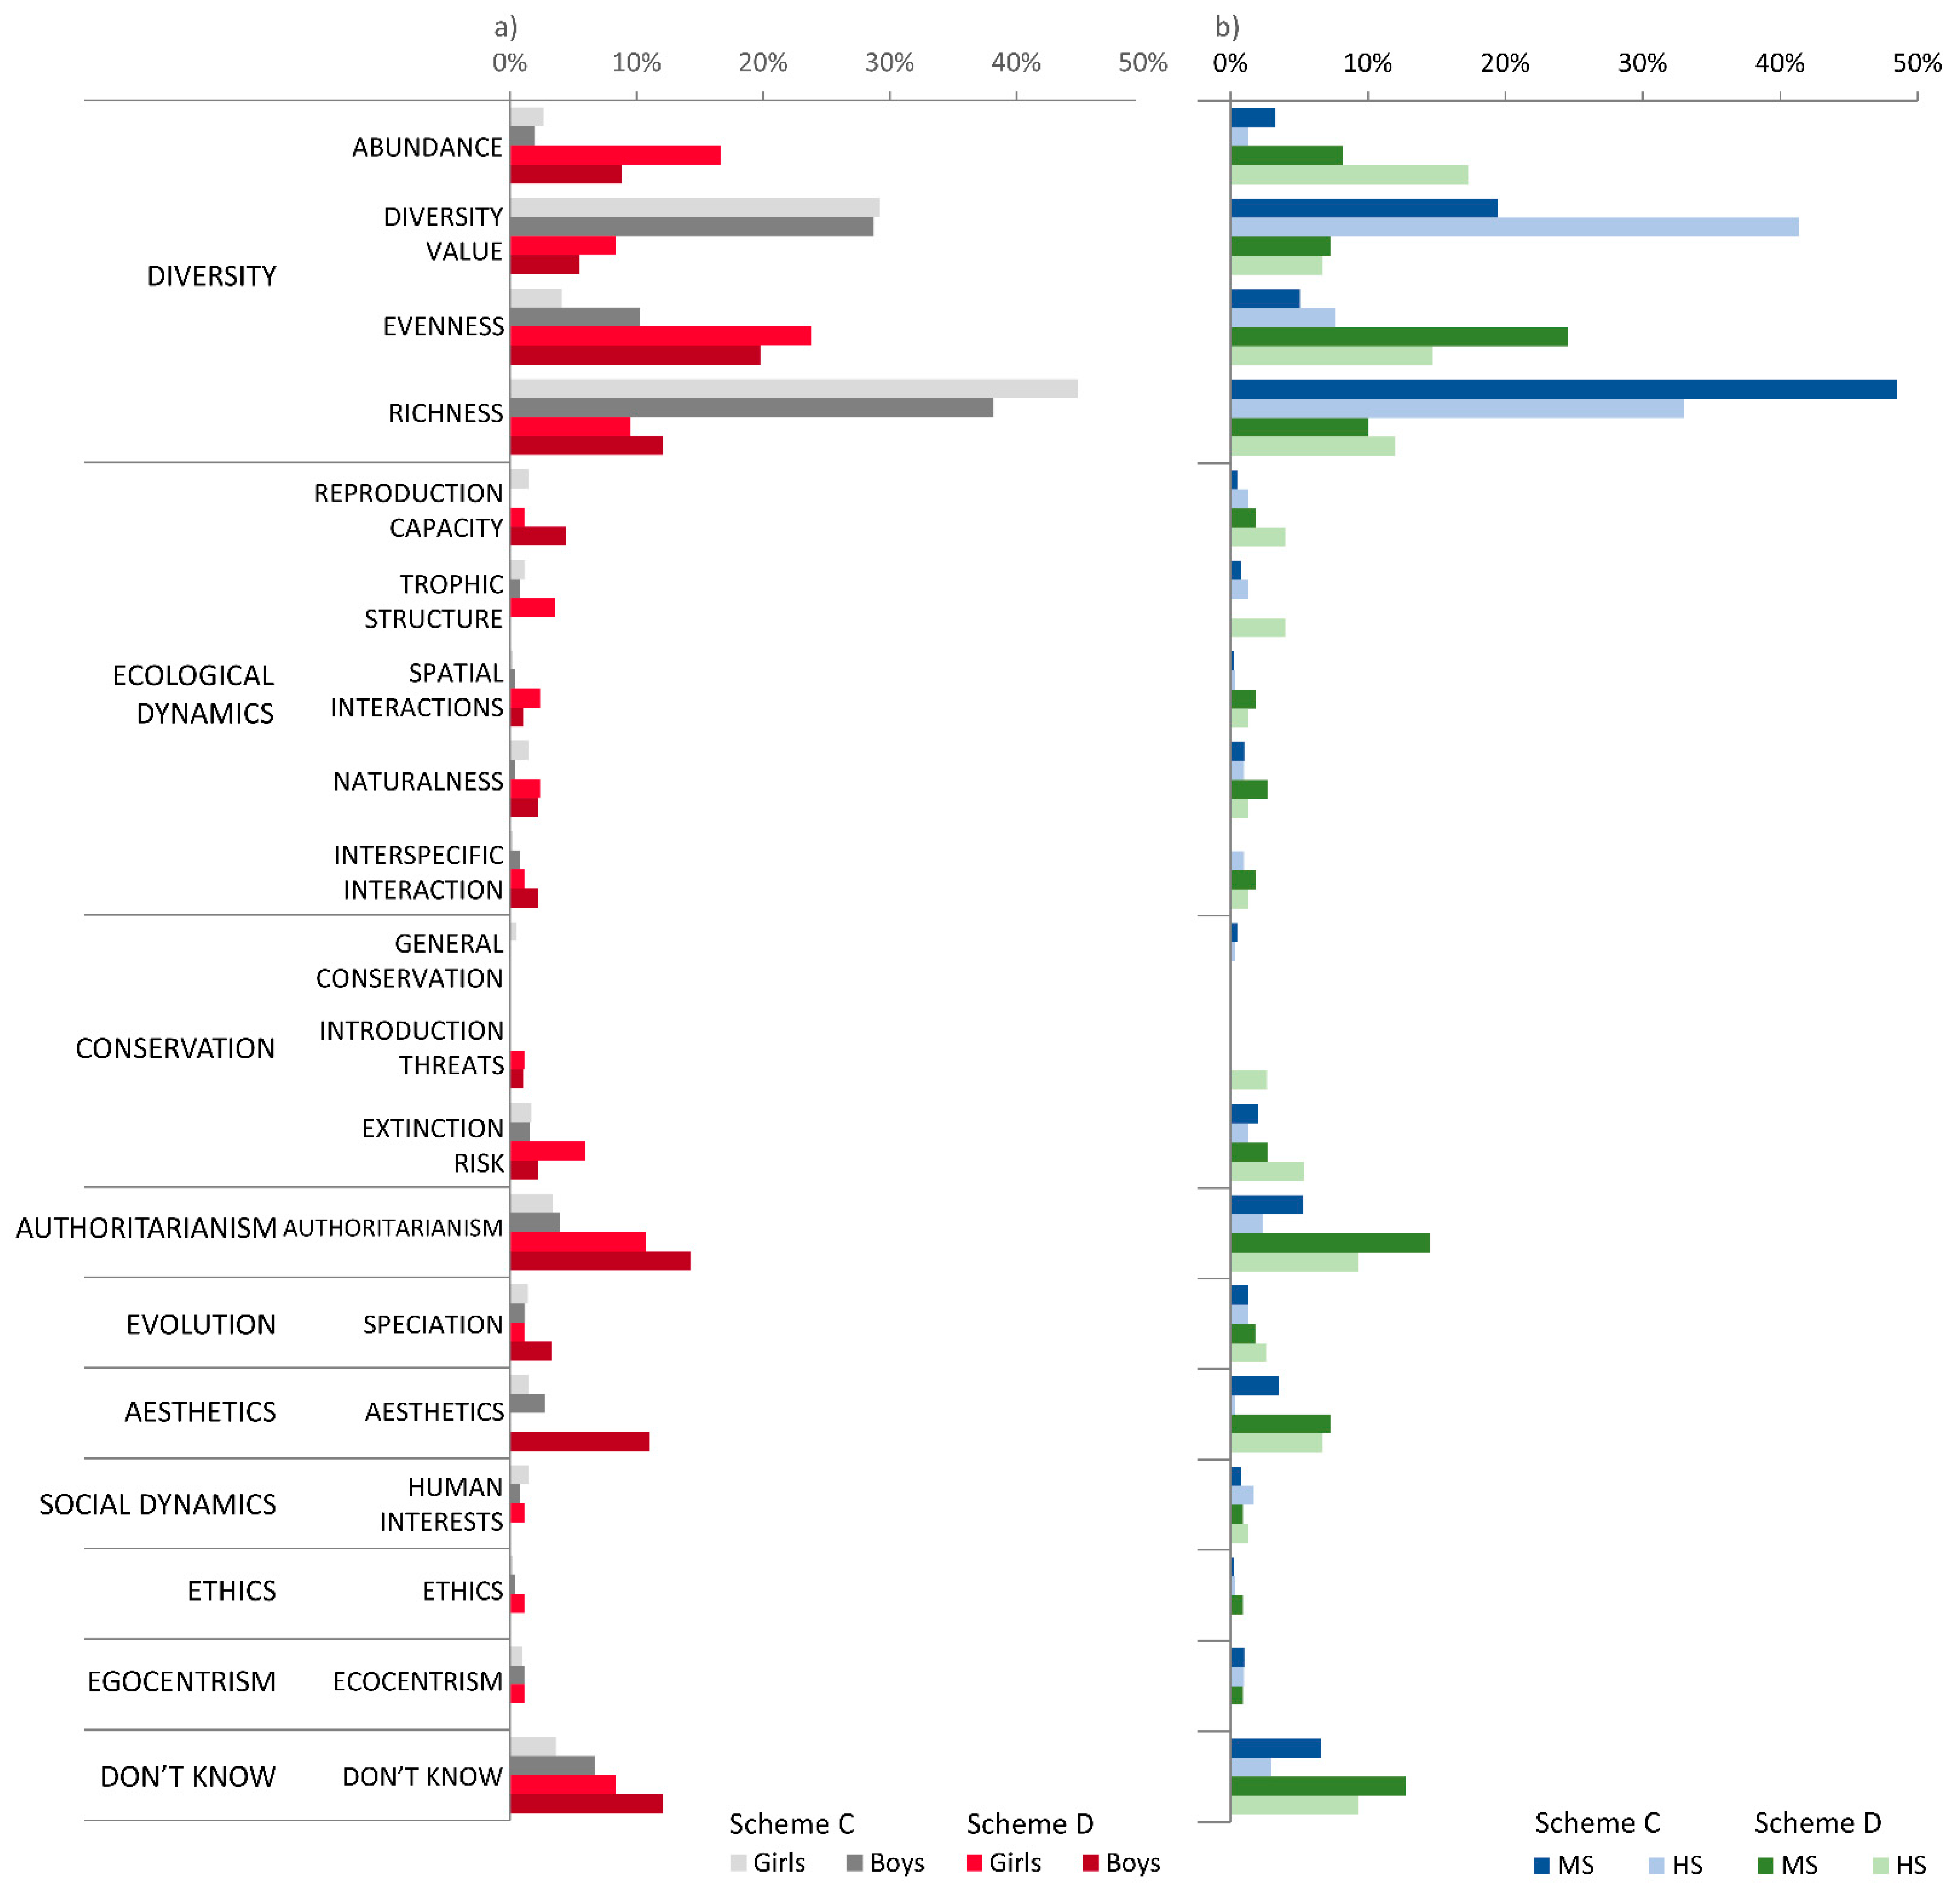
3.3.1. Scenario 1: Same Species Richness, Different Evenness

For Scenario 1, a total of 18 subcategories were identified in pupils’ justifications. Figure 4 represents the percentage of argument subcategories used by pupils to justify either scheme A or B in Scenario 1 according to gender and school level.
Diversity and Ecological Dynamics were the first- and second-most used categories for the justification of both schemes. Scheme A was mainly justified by the subcategories Evenness, Diversity Value, and Abundance, while scheme B was mainly justified by the subcategories Abundance, Trophic Structure, and Authoritarianism.
There were no marked differences between the frequencies of subcategories used by girls and boys and those used by MS and HS pupils in association with scheme A, except for Evenness, which was used in greater proportion by HS pupils. Only a small percentage of pupils (11.3%) whose justification included the Evenness argument subcategory provided further reasoning by explaining, for instance, that a more balanced number of individuals among species would: (a) reduce its extinction risk (n = 14); (b) promote greater diversity (n = 12); (c) lead to less antagonistic and/or more beneficial interactions between species (n = 8); (d) promote a balanced food chain (n = 7); or (e) improve species’ reproduction capacity (n = 6).
When justifying scheme B, the use of Trophic Structure, Abundance and Authoritarianism arguments differed between MS and HS pupils but not between girls and boys. MS pupils used Authoritarianism and Abundance arguments more often than HS pupils, while HS pupils more frequently employed the Trophic Structure argument.
Within the Abundance subcategory, pupils usually referred to the number of individuals of the species represented by filled circles, indicating that scheme B had more species. Within the Authoritarianism subcategory, pupils based their answer on their own opinion as the only justifying criterion, without providing any further reason.
An unforeseen result was that some of the participants (n = 20) interpreted the schemes’ graphical representation as a trophic chain, where species represented different trophic levels instead of species in an ecological guild. In this case, the selection of scheme B was justified with the Trophic Structure argument, where mostly HS pupils reasoned that for a balanced trophic chain, one of the species—the species at the base of the trophic pyramid—should be more abundant than those at the other levels. Given this justification, this alternative answer was also considered appropriate.

3.3.2. Scenario 2: Different Species Richness, Similar Evenness

For Scenario 2, a total of 19 argument subcategories were identified in the justifications provided by pupils. Figure 5 represents the percentage of argument subcategories used by pupils to justify either scheme C or D in Scenario 2 according to gender and school level.
Most of the justifications were classified in the Diversity category. This category was followed by the poorly reasoned argument categories Authoritarianism and Don’t Know in the justification of both schemes.
Scheme C was mainly justified by Richness, Diversity Value, and Evenness argument subcategories, while for scheme D, the main argument subcategories used in the justifications were Evenness, Authoritarianism, and Abundance.
Marked differences in the frequencies of the subcategories used for justifying schemes C and D were found between MS and HS pupils, but not between girls and boys. Richness was the main subcategory used by MS pupils, and within this group mostly by girls, to justify the selection of scheme C. A few of the pupils whose justifications fall within this subcategory provided further explanations, such as: (a) promoting greater diversity (n = 12), (b) giving origin to new species (n = 2), (c) reducing species’ extinction risk (n = 2), and (d) improving species’ reproduction capacity (n = 2).
The Diversity Value subcategory was used at a much higher frequency by HS than MS pupils, and in similar proportions by both genders. The selection of scheme D when combined with a plausible justification was also considered an adequate answer. However, only 4.3% of pupils (n = 12), mostly at the HS level, who chose scheme D provided reasoned justifications. Of those who used Abundance as a justification, only a few pupils provided further explanations for why a more abundant species was desirable for nature, by mentioning its importance to: (a) improving its reproduction capacity (n = 5); (b) increasing its evolution chances (n = 2); or (c) reducing its extinction risk (n = 5).
Evenness was the main justification used to choose scheme D by MS pupils (especially girls), and at a much higher frequency than HS pupils. However, given that the evenness indexes of schemes C and D were similar, this reasoning was not appropriate to justify the selection of either scheme.

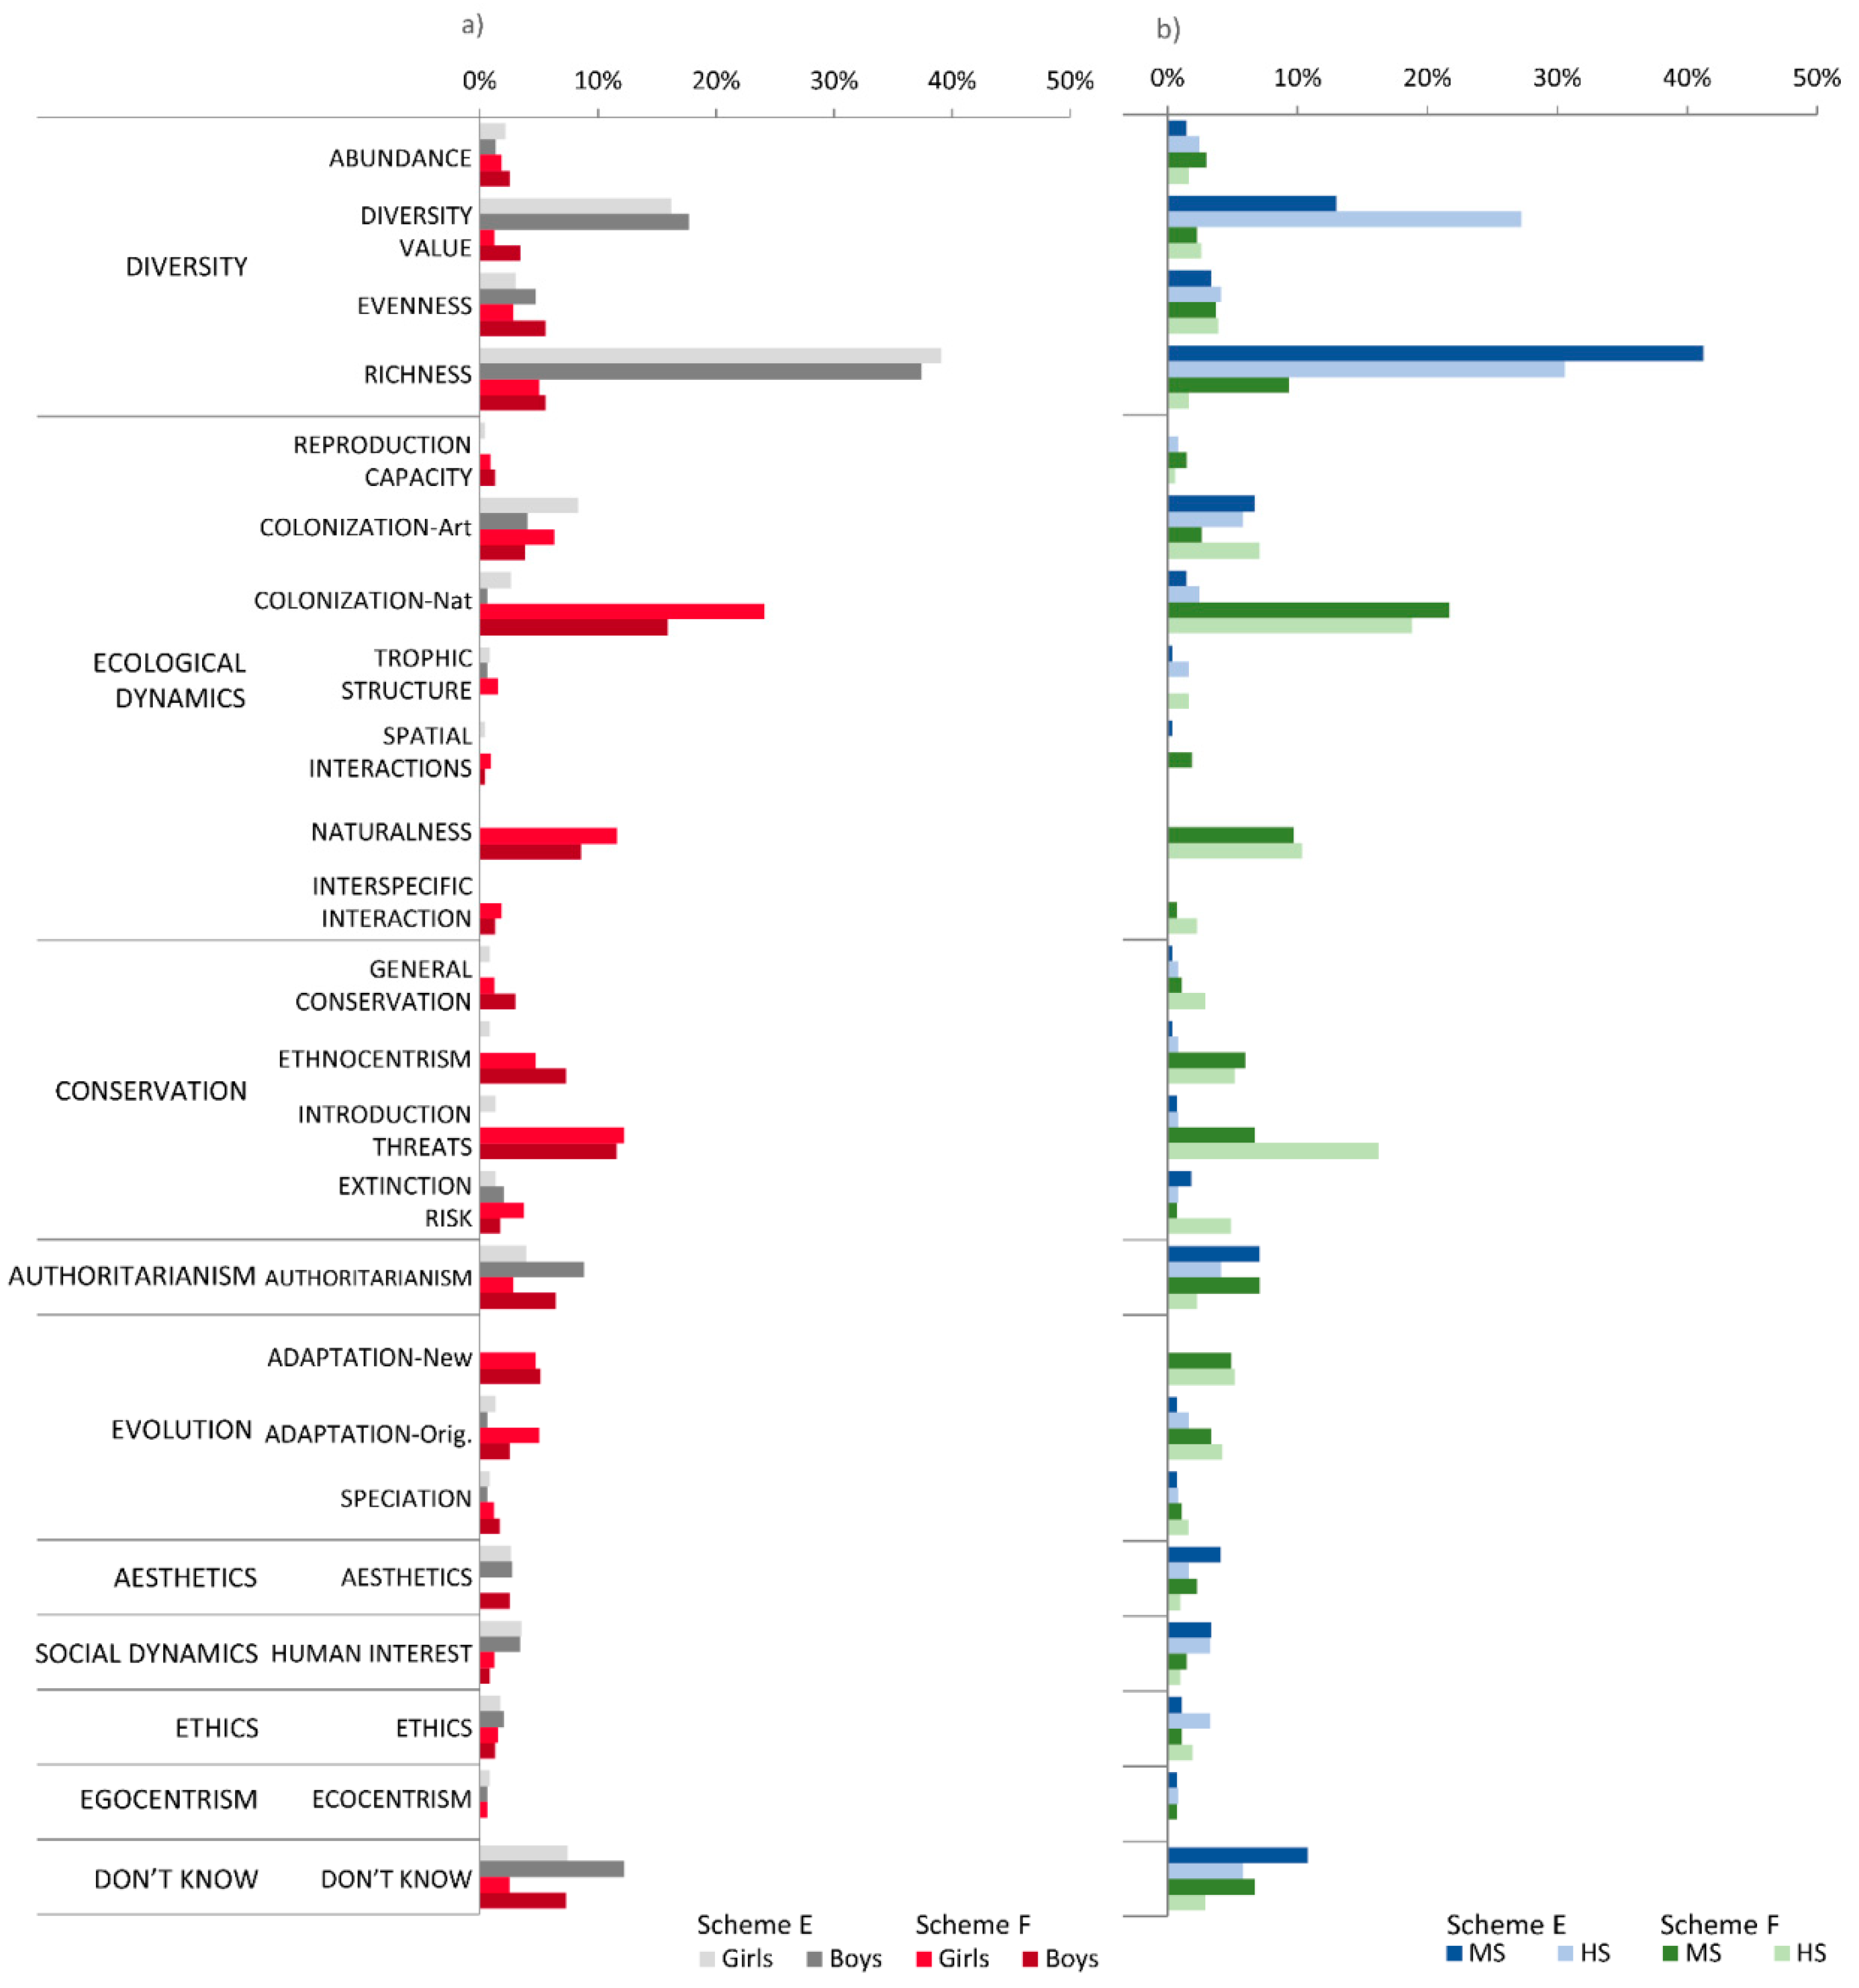
3.3.3. Scenario 3: Different Species Richness, Similar Evenness, Different Colonization Mode

For Scenario 3, all the 24 argument subcategories were identified in the justifications provided by pupils. Figure 6 represents the percentage of arguments subcategories used by pupils to justify either scheme E or F in Scenario 3, according to gender and school level.
Compared to the previous scenarios, the Diversity category was not as prominent, while the Ecological Dynamics and Conservation categories were more frequent. MS and HS pupils diverged significantly in their preference for the two schemes: MS pupils, more specifically girls, mostly favored scheme E, while most HS pupils preferred scheme F. The most frequent argument subcategories used to justify the choice of scheme E were Richness, Diversity Value and Artificial Colonization, while those stated to justify the selection of scheme F were Natural Colonization, Species Introduction Threats and Naturalness.
There were no marked differences between the frequencies of subcategories used by girls and boys in relation to both schemes E and F. On the other hand, MS and HS pupils showed greater differences in the use of argument subcategories when justifying both schemes. MS pupils used Richness more frequently than HS pupils to justify scheme E selection, while the latter used the Diversity Value argument more often than MS pupils. The Species Introduction Threat subcategory was used more often by HS pupils. The Extinction Risk argument subcategory was employed more by HS than MS pupils when justifying scheme F. The subcategory “Ethnocentrism” was expressed only in this scenario, and mostly in connection with scheme F.

4. Discussion

4.1. Most Pupils Made Appropriate Scheme Selections

Considering that environmental conservation demands that decisions are made, even when faced with uncertainties [4,40], it is important to explore whether pupils, as future full citizens, are able to make appropriate environmental choices, and which perspectives they resort to [41]. In this study, we aimed to understand the biodiversity perspectives of 1528 Azorean pupils (11–23 years old) guiding their decisions about which hypothetical schemes they deemed most desirable for nature, and whether these are influenced by pupils’ school level and gender.
More than seven out of ten pupils participating in the study made decisions that agree with the guidelines promoted by experts in ecology and conservation, favoring environmental schemes that were “more balanced” (species evenness), had “a higher number of species” (species richness) and had “species not brought by people” (natural colonization mode).
Fewer pupils chose schemes considered less appropriate for biodiversity conservation goals, such as those showing greater dominance of a single species or introduced (exotic) species, especially in the first two scenarios. However, among those who chose the best schemes, a more limited number of pupils were able to justify their choice in an appropriate way.

4.2. Main Biodiversity Perspectives Underlying Pupils’ Choices Focused on Diversity

Pupils’ choices were guided by multiple biodiversity perspectives, as shown by the diverse range of justifications used.
Diversity was the main argument category employed, which included Richness, Evenness, Abundance and Diversity Value subcategories. Previous studies have also shown how biodiversity is often equated with species diversity and the overall diversity of living organisms, with limited consideration given to other dimensions, such as genetic and ecosystem diversity [12,21,42], as well as to ecological and social dimensions. Other relevant biodiversity perspectives were based on Ecological Dynamics and Conservation arguments. Less relevant were Authoritarianism, Evolution, Aesthetics, Social Dynamics, Ethics, and Egocentrism arguments. Previous studies have also found that pupils use multiple types of arguments when making decisions on ill-structured problems involving the environment, which are not only related to strictly biological and ecological conceptual knowledge, but are also based on reasons related to utility, concerns about uncertainty, economy, practical considerations, technical features, aesthetics, ethics and values [4,5,24]. A more recent study identified three main thematic categories in HS pupils’ arguments regarding biodiversity scenarios: “Variety”, “Type”, and “Balance”, subdivided into a total of 11 subcategories, where the species richness subcategory prevailed [13]. Compared to previous studies, a greater diversity of thematic categories was found in our study, which may be connected to our larger sample size and a wider age range of pupils.

4.3. Pupils’ Gender and School Level Influences Response Rates and Biodiversity Perspectives

Our study has shown that significant differences in biodiversity perspectives can occur depending on school level and gender. Differences between genders were especially marked at the MS level (12–15 years old). When justifying the selection of scheme E, MS pupils’ biodiversity perspectives placed greater emphasis on species richness, while the diversity value was most important among HS pupils. MS girls’ greater preference for schemes C and E compared with MS boys may be explained by the particular emphasis placed by the former group on species richness. This finding agrees with several studies that revealed that biodiversity perspectives are still largely centered on species richness/diversity, neglecting other important dimensions of the concept [12,13,21,22,23]. HS pupils’ (of both genders) predilection for scheme F may be attributed to the importance attached to a natural colonization mode, and their greater knowledge and awareness of invasive species and associated threats compared with MS pupils.
Furthermore, in relation to HS pupils, MS pupils showed more diverse biodiversity perspectives, which were less related to ecological conceptual knowledge and associated more with other types of knowledge, such as those shown in Aesthetics, Authoritarianism, Egocentrism and Ethics argument subcategories. This finding agrees with Cobern’s study, which showed that an increase in schooling leads to less diverse perspectives of the natural world and more focused views, related to science [18].
In addition, boys, at both study levels, were more likely to provide non-responses and to acknowledge that they did not know the answers than girls. However, with the passage from middle to high school, pupils from both genders were more likely to choose and argue in appropriate ways for biodiversity conservation, providing complete and valid arguments (where the warrant linked the grounds to the claim), and applying relevant ecological concepts to make reasoned choices.
The biodiversity perspective differences found between pupils, from different gender groups and school levels, may be related to their different life and schooling experiences. Differences according to gender may be understood by considering how society in a certain cultural context shapes female and male identities [13]. Even though at the MS level, previous studies have shown that girls possess lower levels of environmental knowledge compared with boys, girls have also been shown to more often exhibit pro-environmental attitudes and higher levels of cognitive skills [17,43]. In our study, girls, at both study levels, were more likely to choose and argue in more appropriate ways for nature conservation. At the HS level, pupils’ biodiversity perspectives differed less according to gender than at the MS level. On the other hand, differences according to school level may be related to the fact that, compared to MS pupils, HS pupils have been exposed to and acquired a greater amount of relevant ecological knowledge, since biodiversity conservation content is taught in greater depth in later HS years in the Portuguese educational system. In addition, most HS pupils in our sample (70.2%) were enrolled in a science and technology course, possibly contributing to a greater knowledge of ecological topics.

4.4. Capturing Pupils’ Perspectives about Ecological Issues

When faced with complex ill-structured ecological problems, most pupils were able to apply their biodiversity perspectives in making adequate conservation choices. The results of this study suggest that ecological scenarios are a viable approach to assessing pupils’ biodiversity perspectives. Bermudez and Lindemann-Matthies [13] also applied a set of ten scenarios in questionnaires that proved useful in assessing HS pupils’ perspectives on biodiversity. Other previous studies adopted interviews and group discussions as the main research methods to explore pupils’ perspectives applied to environmental decision-making [4,5,12,21]. In relation to these methods, the use of scenarios within questionnaires possesses the advantage of obtaining a snapshot of the perspectives towards an environmental issue among a wider audience in a shorter time period. Furthermore, identifying and exploring pupils’ perspectives on biodiversity according to gender and school level through this method may be useful for educators when they design instructional content that is tailored to pupils’ views and needs [21].
Moreover, a relevant issue emerging from this study is the wider scope of arguments elicited in the third scenario, about the dilemma of exotic versus native species. In fact, this ill-structured problem led to lower consensus surrounding its solutions, greater diversity of arguments, and more polarization among pupils. This study suggests that pupils’ biodiversity perspectives, especially those of MS pupils, need to be strengthened by a more complete inclusion of such ecological concepts as species and speciation, food chains and invasive species, as well as knowledge on the different dimensions of biodiversity and the adverse consequences of exotic invasive species in natural ecosystems. This could be achieved by exposing pupils in earlier grades to basic ecological conceptual knowledge, which can then be integrated into their different biodiversity perspectives. In addition, the exposure to and discussion of such problematic issues in the classroom in greater depth may stimulate pupils to think more critically and to assess their perspectives to apply them in the resolution of ecological dilemmas in a more appropriate manner [44].
Given that the problem of invasive species is one of the most serious environmental problems in the Azores archipelago [45], and that the data for this study were collected in 2012, new studies would be needed in order to assess the current Azorean pupils’ biodiversity perspectives regarding invasive species, and whether the trend of centrism in MS pupils’ biodiversity perspectives on species richness combined with a lack of awareness of invasive species risks revealed by this study remains a concern.
All this being said, the recent efforts of the Azorean Regional Government to improve pupils’ ecological literacy should be acknowledged. An example is the recently created subject “Azores History, Geography and Culture”, starting in 2019–2020, that focuses, among other things, on local biodiversity and biological invasions [46]. As a result of changes in the formal Portuguese curriculum and the emergence of new educational approaches adopted by educators [22], among other factors, it is expected that Azorean pupils’ biodiversity perspectives will have changed in the last nine years. However, how much they have changed and contributed to raising ecological literacy levels and engagement in environmental citizenship remains to be studied.

Supplementary Materials

This part is available online at https://www.mdpi.com/article/10.3390/su132212554/s1, Table S1: Frequency results considering the argument categories and gender; Table S2: Frequency results considering the argument categories and school level.

Author Contributions

Conceptualization, A.M.A., R.G. and I.R.A.; methodology, R.G., A.M.A. and I.R.A.; formal analysis, R.G. and F.P.; investigation, R.G., A.M.A. and I.R.A.; data curation, R.G.; writing—original draft, F.P., I.R.A. and A.R.S.; review and editing, I.R.A., A.R.S., A.M.A. and R.G.; visualization, R.G., F.P., I.R.A. and A.R.S.; supervision, R.G.; project administration, I.R.A.; funding acquisition, R.G., A.M.A. and I.R.A. All authors have read and agreed to the published version of the manuscript.

Funding

The research was financially supported by THE PORTUGUESE FOUNDATION FOR SCIENCE AND TECHNOLOGY (FUNDAÇÃO PARA A CIÊNCIA E A TECNOLOGIA-FCT) through the projects PTDC/CED-EDG/31182/2017, PTDC/BIA-BEC-104571/2008; IRA was funded by Portuguese funds through FCT under the Norma Transitória-DL57/2016/CP1375/CT0003.

Institutional Review Board Statement

The study was conducted according to the research guidelines of Portuguese legislation (D.L. nº 125/99).

Informed Consent Statement

Informed consent was obtained from all subjects involved in the study.

Data Availability Statement

The data presented in this study are not publicly available due to anonymization of respondents. However, it is accessible on request from the corresponding author.

Acknowledgments

The authors would like to thank all pupils and teachers who kindly participated in this study for their time and effort. We would also like to thank Sandra Silva from the Azorean Education Directorate (SREC/DRE) for providing important information regarding the Azorean educational system, Ana Luísa C. Picanço (cE3c/GBA) for suggesting improvements regarding the Azorean educational curriculum, Paulo A.V. Borges (cE3c/GBA) for helping in ecological matters, and three anonymous referees and the academic editor for their constructive comments.

Conflicts of Interest

The authors declare no conflict of interest. The funders had no role in the design of the study, in the collection, analyses, or interpretation of data, in the writing of the manuscript, or in the decision to publish the results.

Appendix A. Category System

Table A1. Category system (in alphabetical order) based on pupils’ justifications for their selection of environmental schemes for each scenario with definitions and examples (grounds and warrants).
CategorySubcategoryDefinitionExamples
AESTHETICSAestheticsWhen the argument is based on pupils’ sensitivity and is related to the appreciation of beauty in the graphical representation.Because it is the most beautiful; it is more symmetrical.
AUTHORITARIANISMAuthoritarianismWhen the argument does not admit a reply, imposing the pupil’s idea.Because it is the best; just because.
CONSERVATIONEthnocentrismRefers to valuing local species and devaluing exotic species for not belonging to the endogroup.Because only native species should be kept; “Foreign” species can threaten endemic biodiversity.
Extinction riskRefers to the probability of disappearance of a species from a certain location or overall.Because then it is less likely for species to become extinct; these species are more likely to survive.
General conservationRefers to the environmental conservation process and goals, and the promotion of sustainability. It refers not to species, but to the ecosystem as a whole, to nature or the planet.Because this way the species are better protected; because it seems to be the most sustainable.
Species
introduction threats
Refers to the negative impacts of species introductions into systems where they are alien (e.g., diseases, competition for food, extinction of local species, etc.).The introduction of species can harm existing species in the location, becoming authentic pests; because the species in scenario E can become invasive and destroy the food resources of the most present species and lead to extinction (proliferation).
DIVERSITYAbundanceRefers to the number of individuals per species.One of the species is more frequent than the other species; there are more individuals.
Diversity valueRefers to the variability introduced in the system by individuals or species, where the focus is not the total number of individuals or species.It has more biodiversity; because diversity is higher.
EvennessRefers to the relative abundance of the various species present in a system.Because they [species] have the same number of individuals; because it has a greater equilibrium.
RichnessRefers to the number of species present in a system.Because it is better to have more species than fewer species; there are more species.
ECOLOGICAL
DYNAMICS
Natural
colonization mode
Refers to species colonization with no human intervention.(Because) They came willingly; because it is a species that appears naturally.
Artificial
colonization mode
Refers to species colonization with human intervention (intentional and/or non-intentional).People are the ones who bring the species; most of them were brought from other places by people.
Interspecific
interaction
Refers to the non-trophic relationships among distinct species. These can be antagonistic (e.g., competition) or beneficial (e.g., cooperation).Because when animals attack each other they should have the same number of their kind, as the other; the species being in the same number were able to secure water and survive better.
NaturalnessWhen the argument involves a comparison of what occurs in environments without human intervention, and favoring the interests of species or nature.It is part of the natural cycle; because it is not normal to have the same number of species in the same habitat, it varies.
Reproduction capacityRefers to the possibility of species propagation, ensuring future generations (includes breeding behavior, opportunity for encountering breeding partner; unbalanced sex ratio; …).Because there are always species that reproduce more than others; because even though there are more species in smaller numbers, they can reproduce themselves.
Spatial interactionRefers to space occupation by species and to neighborhood notions between species or individuals.The individuals are not all together; because each species is spread over several sites
Trophic structureRefers to feeding interactions among individuals from different species.Because it is necessary to have more species at the bottom of the food chain, as they provide food for a greater variety of species; because the “species” (balls) can be preyed upon, and then they have to be in greater numbers to maintain biodiversity.
EGOCENTRISMEgocentrismWhen the argument emphasizes the subject’s power of choice.I feel like it; it’s my opinion.
ETHICSEthicsRefers to justice, morals, right to live, among other rights.People must take care of nature; because human beings must not interfere with the natural cycle of species, but try to save them.
EVOLUTIONSpeciationRefers to the development of new species.Can give origin to new species; for new species to establish (themselves) and give rise to others.
Adaptation to
original habitat
Refers to species adaptation to the biotic, geographical and/or climatic conditions of the region where they are originally from.Because one should not bring species from other places, because they are already used to their environment; because it is easier for the species existing on the site to adapt than those that are introduced.
Adaptation to
new habitat
Refers to the possible lack of species adaptation to the new biological, geographical and/or climatic conditions of the new location into which the species were introduced.I think that animals that were born in a certain area should not move to another area because they may not get used to it and may end up dying; animals brought in by people when changing climate from their natural habitat may die.
SOCIAL DYNAMICSSatisfaction of
human interests
Refers to human intentional ecosystem modifications for their own benefit (e.g., agriculture, livestock, tourism).Because if the species in scenario A are taken as edible, we would have a greater variety of food; they may be needed in different ways, so that one species is more useful or needed than another.
DON’T KNOWDon’t knowWhen the respondent admits that he/she does not know how to justify the scheme chosen.I don’t know; I can’t explain.

References

  1. Lindenmayer, D.; Hobbs, R.; Montague-Drake, R.; Alexandra, J.; Bennett, A.; Burgman, M.; Cale, P.; Calhoun, A.; Cramer, V.; Cullen, P.; et al. A checklist for ecological management of landscapes for conservation. Ecol. Lett. 2007, 11, 78–91. [Google Scholar] [CrossRef]
  2. McShane, T.O.; Hirsch, P.D.; Trung, T.C.; Songorwa, A.; Kinzig, A.; Monteferri, B.; Mutekanga, D.; Van Thang, H.; Dammert, J.L.; Pulgar-Vidal, M.; et al. Hard choices: Making trade-offs between biodiversity conservation and human well-being. Biol. Conserv. 2011, 144, 966–972. [Google Scholar] [CrossRef]
  3. Pascual, U.; Adams, W.M.; Díaz, S.; Lele, S.; Mace, G.M.; Turnhout, E. Biodiversity and the challenge of pluralism. Nat. Sustain. 2021, 4, 567–572. [Google Scholar] [CrossRef]
  4. Hogan, K. Small groups’ ecological reasoning while making an environmental management decision. J. Res. Sci. Teach. 2002, 39, 341–368. [Google Scholar] [CrossRef]
  5. Grace, M.M.; Ratcliffe, M. The science and values that young people draw upon to make decisions about biological conservation issues. Int. J. Sci. Educ. 2002, 24, 1157–1169. [Google Scholar] [CrossRef]
  6. Reed, M.S. Stakeholder participation for environmental management: A literature review. Biol. Conserv. 2008, 141, 2417–2431. [Google Scholar] [CrossRef]
  7. Jordan, R.; Singer, F.; Vaughan, J.; Berkowitz, A. What should every citizen know about ecology? Front. Ecol. Environ. 2009, 7, 495–500. [Google Scholar] [CrossRef]
  8. McBride, B.B.; Brewer, C.A.; Berkowitz, A.R.; Borrie, W.T. Environmental literacy, ecological literacy, ecoliteracy: What do we mean and how did we get here? Ecosphere 2013, 4, 67. [Google Scholar] [CrossRef]
  9. McBride, B.B. Essential Elements of Ecological Literacy and the Pathways to Achieve it: Perspectives of Ecologists. Ph.D. Thesis, The University of Montana, Missoula, MT, USA, 2011. [Google Scholar]
  10. Pitman, S.D.; Daniels, C.B.; Sutton, P.C. Ecological literacy and socio-demographics: Who are the most eco-literate in our community, and why? Int. J. Sustain. Dev. World Ecol. 2016, 25, 9–22. [Google Scholar] [CrossRef]
  11. Secretariat of the Convention on Biological Diversity (CBD). Convention Text. Available online: https://www.cbd.int/convention/articles/?a=cbd-02 (accessed on 10 June 2021).
  12. Kilinc, A.; Yeşiltaş, N.K.; Kartal, T.; Demiral, Ü.; Eroğlu, B. School Students’ Conceptions about Biodiversity Loss: Definitions, Reasons, Results and Solutions. Res. Sci. Educ. 2013, 43, 2277–2307. [Google Scholar] [CrossRef]
  13. Bermudez, G.M.A.; Lindemann-Matthies, P. “What Matters Is Species Richness”—High School Students’ Understanding of the Components of Biodiversity. Res. Sci. Educ. 2020, 50, 2159–2187. [Google Scholar] [CrossRef]
  14. European Commission. Special Eurobarometer 379—Attitudes of Europeans towards Biodiversity; European Commission: Bruxelles, Belgium, 2013. [Google Scholar]
  15. Nisiforou, O.; Charalambides, A.G. Assessing Undergraduate University Students’ Level of Knowledge, Attitudes and Behaviour Towards Biodiversity: A case study in Cyprus. Int. J. Sci. Educ. 2012, 34, 1027–1051. [Google Scholar] [CrossRef]
  16. Pitman, S.D.; Daniels, C.B.; Sutton, P.C. Characteristics associated with high and low levels of ecological literacy in a western society. Int. J. Sustain. Dev. World Ecol. 2017, 25, 227–237. [Google Scholar] [CrossRef]
  17. Kelemen-Finan, J.; Scheuch, M.; Winter, S. Contributions from citizen science to science education: An examination of a biodiversity citizen science project with schools in Central Europe. Int. J. Sci. Educ. 2018, 40, 2078–2098. [Google Scholar] [CrossRef]
  18. Cobern, W.W. Everyday thoughts about Nature: A Worldview Investigation of Important Concepts Students Use to Make Sense of Nature with Specific Attention of Science; Springer: Dordrecht, The Netherlands, 2000. [Google Scholar] [CrossRef]
  19. Fischer, A.; Young, J.C. Understanding mental constructs of biodiversity: Implications for biodiversity management and conservation. Biol. Conserv. 2007, 136, 271–282. [Google Scholar] [CrossRef]
  20. Dikmenli, M. Biology student teachers’ conceptual frameworks regarding biodiversity. Education 2010, 130, 479–488. [Google Scholar]
  21. Schneiderhan-Opel, J.; Bogner, F.X. Between Environmental Utilization and Protection: Adolescent Conceptions of Biodiversity. Sustainability 2019, 11, 4517. [Google Scholar] [CrossRef] [Green Version]
  22. Picanço, A.; Arroz, A.M.; Amorim, I.R.; Matos, S.; Gabriel, R. Teachers’ perspectives and practices on biodiversity web portals as an opportunity to reconnect education with nature. Environ. Conserv. 2021, 48, 25–32. [Google Scholar] [CrossRef]
  23. Jime’nez-Aleixandre, M.-P. Knowledge producers or knowledge consumers? Argumentation and decision making about environmental management. Int. J. Sci. Educ. 2002, 24, 1171–1190. [Google Scholar] [CrossRef]
  24. Menzel, S.; Bögeholz, S. The Loss of Biodiversity as a Challenge for Sustainable Development: How Do Pupils in Chile and Germany Perceive Resource Dilemmas? Res. Sci. Educ. 2009, 39, 429–447. [Google Scholar] [CrossRef] [Green Version]
  25. Regional Statistical Service of the Azores—Serviço Regional de Estatística dos Açores (SREA). Demografia 2018 (Report). Available online: https://srea.azores.gov.pt (accessed on 10 January 2021).
  26. Myers, N.; Mittermeier, R.A.; Mittermeier, C.G.; Da Fonseca, G.A.; Kent, J. Biodiversity hotspots for conservation priorities. Nature 2000, 403, 853–858. [Google Scholar] [CrossRef]
  27. Borges, P.A.V.; Costa, A.; Cunha, R.; Gabriel, R.; Gonçalves, V.; Martins, A.F.; Melo, I.; Parente, M.; Raposeiro, P.; Santos, R.S.; et al. (Eds.) A List of the Terrestrial and Marine Biota from the Azores, 1st ed.; Princípia: Cascais, Portugal, 2010. [Google Scholar]
  28. Queiroz, R.E.; Guerreiro, J.; Ventura, M.A. Demand of the tourists visiting protected areas in small oceanic islands: The Azores case-study (Portugal). Environ. Dev. Sustain. 2014, 16, 1119–1135. [Google Scholar] [CrossRef]
  29. Ponte, J.C.; De Maneio, P.D.F.; Couto, G.; Pimentel, P.; Oliveira, A. Tourism activities and companies in a sustainable adventure tourism destination: The Azores. Tour. Manag. Stud. 2018, 14, 25–38. [Google Scholar] [CrossRef]
  30. Ministry of Education-Department of Secondary Education. Biology and Geology Program. Available online: http://www.dge.mec.pt/sites/default/files/Secundario/Documentos/Documentos_Disciplinas_novo/Curso_Ciencias_Tecnologias/Biologia_Geologia/biologia_geologia_10.pdf. (accessed on 2 June 2021).
  31. Regional Regulatory Decree no. 17/2011/A. Presidency of the Government of the Autonomous Region of the Azores. Official Gazette. Available online: https://data.dre.pt/eli/decregulreg/17/2011/08/02/a/dre/pt/html (accessed on 21 May 2021).
  32. Sorin, R. Scenario-based learning: Transforming tertiary teaching and learning. In Proceedings of the 8th QS Asia Pacific Professional Leaders in Education Conference, Bali, Indonesia, 14–16 November 2012; pp. 71–81. [Google Scholar]
  33. Dreyfus, A.; Wals, A.E.J.; Weelie, D.V. Biodiversity as a postmodern theme for environmental education. Can. J. Environ. Educ. 1999, 4, 155–175. [Google Scholar]
  34. Gaston, K.J.; Spicer, J.I. Biodiversity: An introduction, 2nd ed.; Wiley-Blackwell: Oxford, UK, 2004; p. 208. [Google Scholar]
  35. Borges, P.A.V.; Lobo, J.M.; de Azevedo, E.B.; Gaspar, C.S.; Melo, C.; Nunes, L.V. Invasibility and species richness of island endemic arthropods: A general model of endemic vs. exotic species. J. Biogeogr. 2006, 33, 169–187. [Google Scholar] [CrossRef] [Green Version]
  36. Karbach, J. Using Toulmin’s model of argumentation. J. Teach. Write 1987, 6, 81–91. [Google Scholar]
  37. Braun, V.; Clarke, V. Using thematic analysis in psychology. Qual. Res. Psychol. 2006, 3, 77–101. [Google Scholar] [CrossRef] [Green Version]
  38. MacQueen, K.M.; McLellan-Lemal, E.; Kay, K.; Milstein, B. Codebook Development for Team-Based Qualitative Analysis. CAM J. 1998, 10, 31–36. [Google Scholar] [CrossRef]
  39. Randolph, J.J. Online Kappa Calculator [Computer Software] 2008. Available online: http://justusrandolph.net/kappa/ (accessed on 28 January 2021).
  40. Gabriel, R. Biodiversidade: Breve apresentação. In Nos Trilhos dos Açores: Educação Para a Cidadania, 1st ed.; Bettencourt, A.M., Gomes, M.C., Eds.; Tinta-da-China: Lisboa, Portugal, 2014; pp. 149–151. [Google Scholar]
  41. Guerrero, A.M.; Barnes, M.; Bodin, Ö.; Chadès, I.; Davis, K.J.; Iftekhar, S.; Morgans, C.; Wilson, K.A. Key considerations and challenges in the application of social-network research for environmental decision making. Conserv. Biol. 2020, 34, 733–742. [Google Scholar] [CrossRef]
  42. Buijs, A.E.; Fischer, A.; Rink, D.; Young, J. Looking beyond superficial knowledge gaps: Understanding public representations of biodiversity. Int. J. Biodivers. Sci. Manag. 2008, 4, 65–80. [Google Scholar] [CrossRef]
  43. Stevenson, K.T.; Peterson, M.N.; Bondell, H.; Mertig, A.G.; Moore, S.E. Environmental, Institutional, and Demographic Predictors of Environmental Literacy among Middle School Children. PLoS ONE 2013, 8, e59519. [Google Scholar] [CrossRef] [PubMed]
  44. Papadopoulos, A. Integrating the Natural Environment in Social Work Education: Sustainability and Scenario-based Learning. Aust. Soc. Work. 2019, 72, 233–241. [Google Scholar] [CrossRef]
  45. Borges, P.A.; Gabriel, R.; Fattorini, S. Biodiversity erosion: Causes and consequences. In Life on Land. Encyclopedia of the UN Sustainable Development Goals; Leal Filho, W., Azul, A., Brandli, L., Özuyar, P., Wall, T., Eds.; The Springer Nature: Dordrech, The Netherlands, 2019. [Google Scholar] [CrossRef]
  46. Regional Legislative Decree no. 16/2019/A. Legislative Assembly of the Autonomous Region of the Azores. Official Gazette. Available online: https://data.dre.pt/eli/declegreg/16/2019/07/23/a/dre (accessed on 22 May 2021).
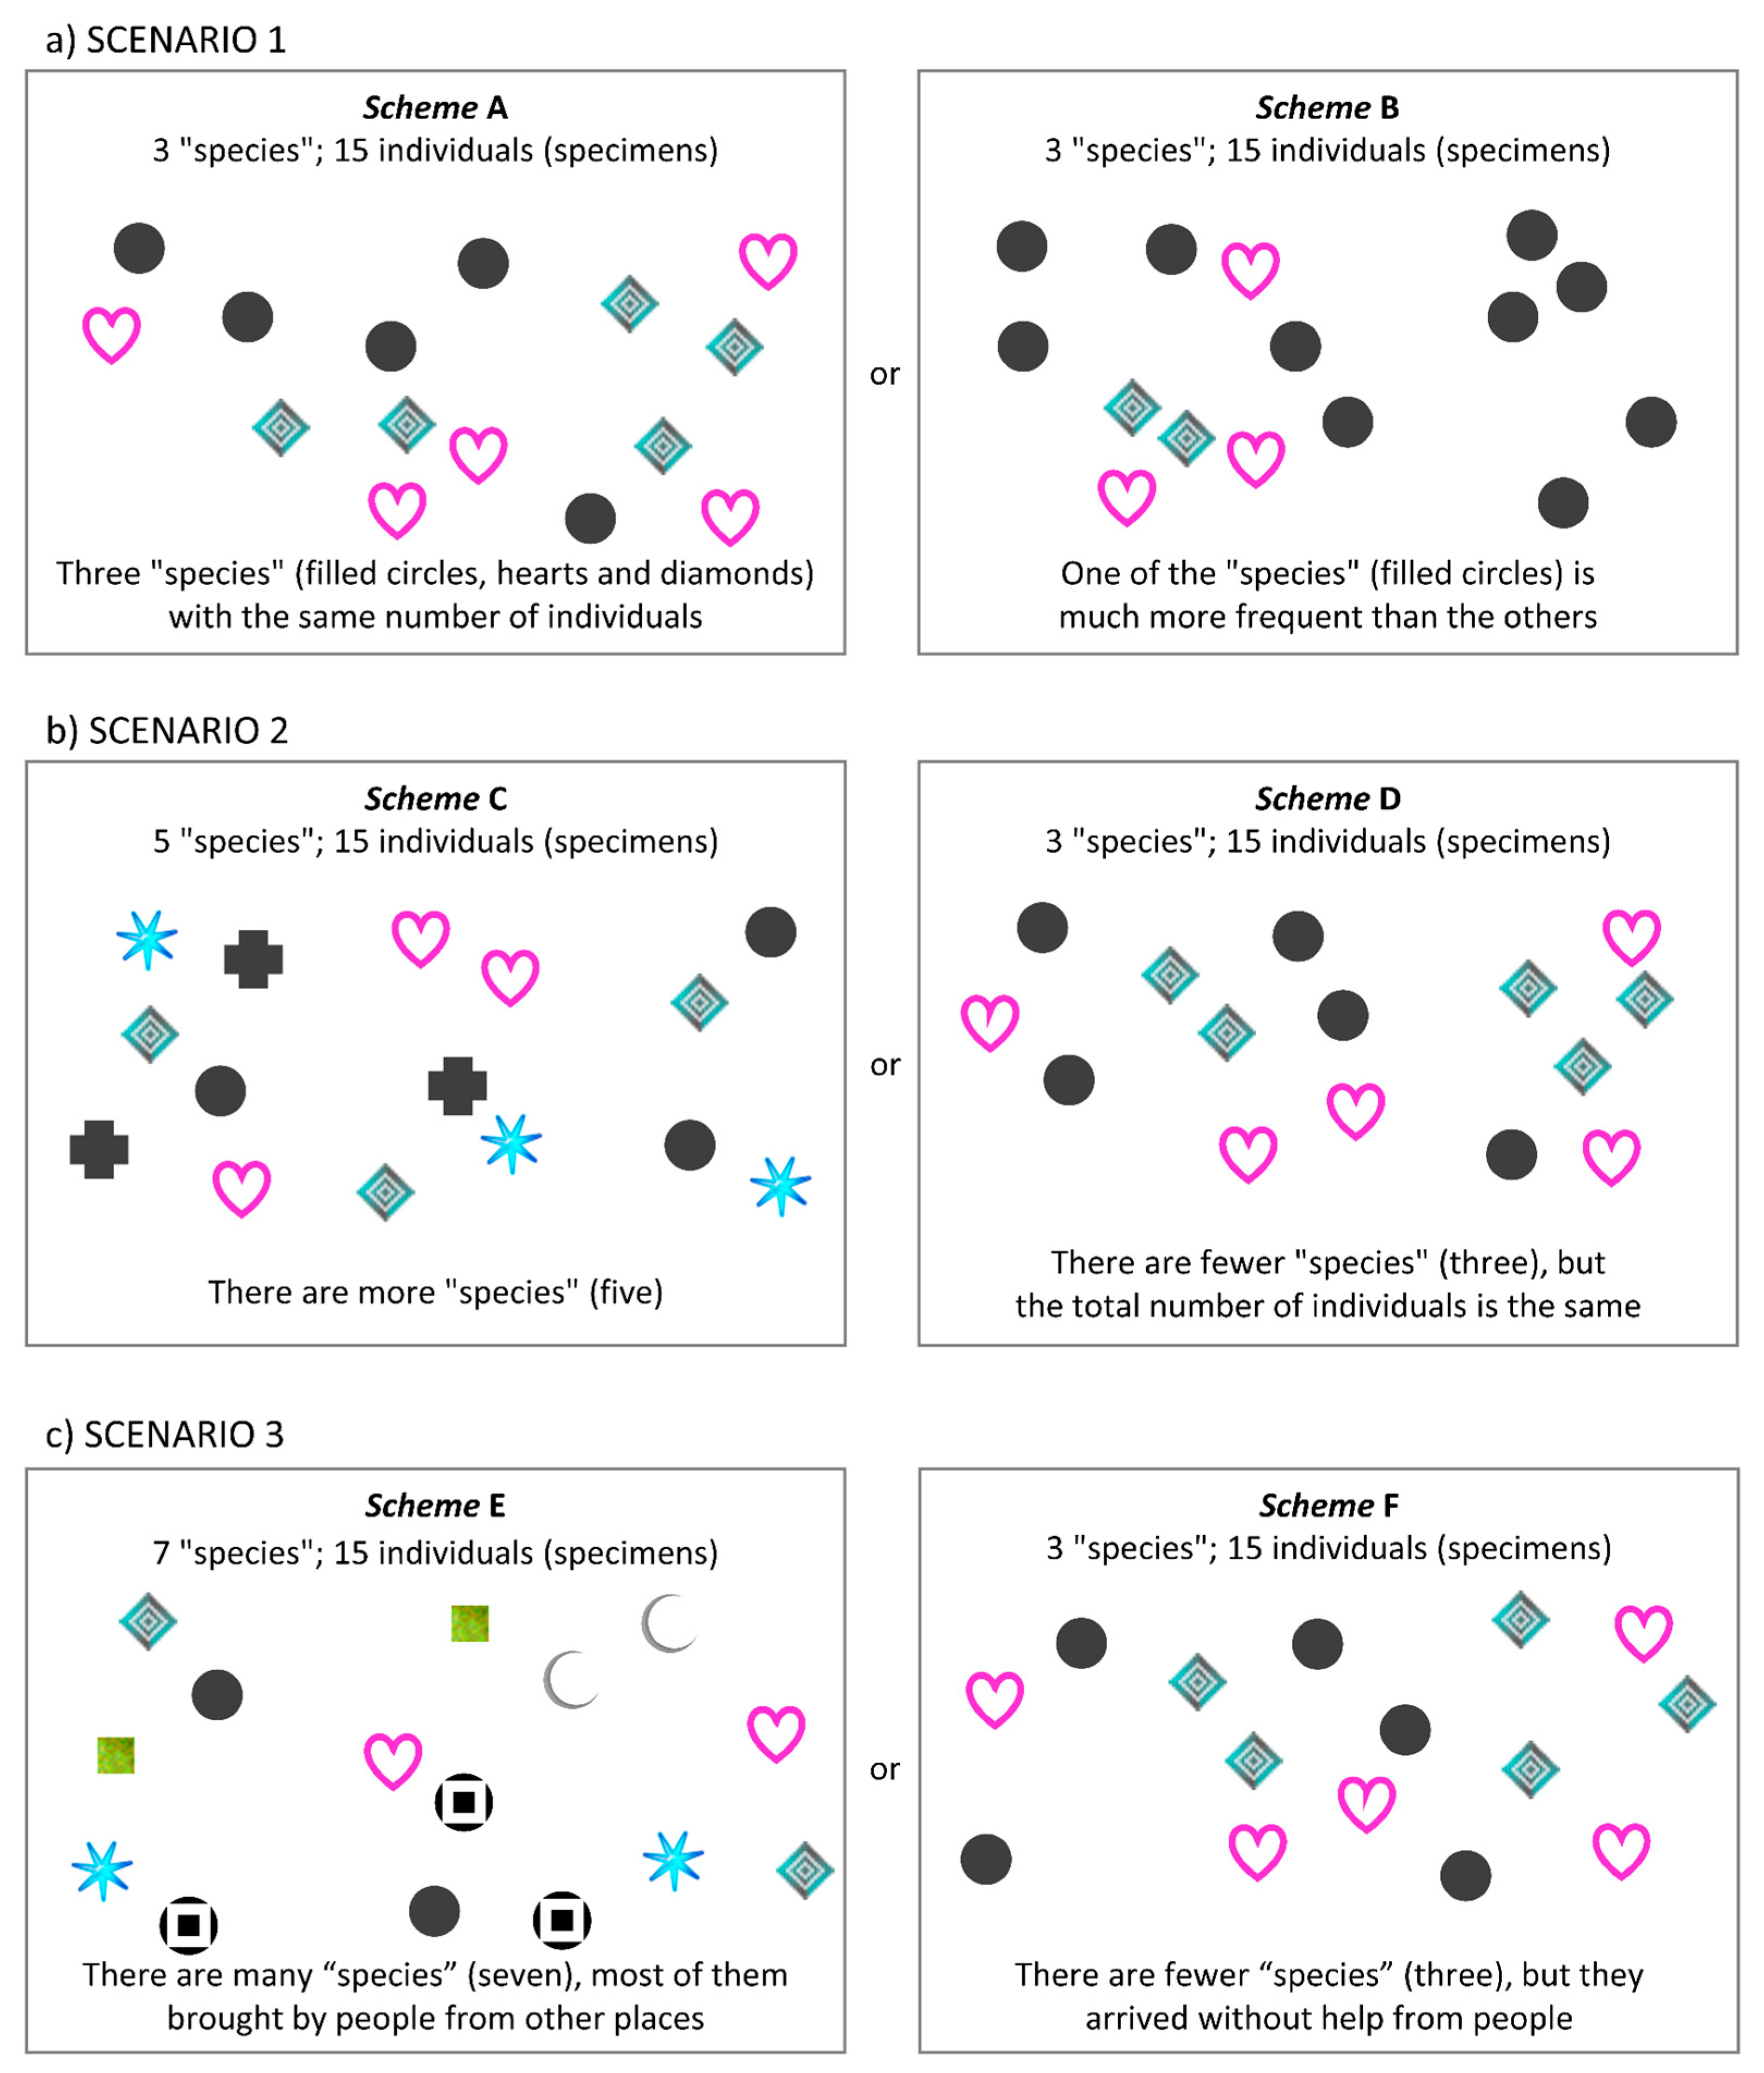
Figure 1. The nine islands of the Azores. Distribution of the 1528 participants in each island. The islands’ positions are not proportional to their real geographic location; scale applies only to the islands’ size.
Sustainability 13 12554 g001
Figure 2. Biodiversity of the Azores: illustration of landscapes and endemic species. (A) Pico Mountain and semi-natural grasslands; (B) Caveiro’ native forest, Pico Island; (C) Crater Lake, Lagoa do Fogo, São Miguel Island; (D) Lava tube, with bacterial mats, Terceira Island; (E) Azorean grayling (Hipparchia azorina); (F) Azores bullfinch (Pyrrhula murina); (G) Azorean bellflower (Azorina vidalli); (H) Short leaved juniper (Juniperus brevifolia). Credits: P. A. V. Borges (Photos A, C, F), R. Gabriel (Photo B), P. Cardoso (Photo D), J. Torrent (Photo E), R. B. Elias (Photo G), F. Pereira (Photo H).
Sustainability 13 12554 g002
Figure 3. Graphical representation of the three scenarios conveying different biodiversity conservation dilemmas regarding: (a) species evenness vs. dominance—Scenario 1; (b) species richness vs. abundance—Scenario 2; and (c) exotic vs. native species—Scenario 3.
Sustainability 13 12554 g003
Figure 4. Percentage of argument subcategories used by girls and boys (a) and by MS and HS pupils (b) for each scheme, A and B, in scenario 1. Frequencies displayed for each subcategory on the x-axis are related to the sum of all pupils’ arguments in Scenario 1 according to gender (Na = 1157) and school level (Na = 1238).
Sustainability 13 12554 g004
Figure 5. Percentage of argument subcategories used by girls and boys (a) and by MS and HS pupils (b) for each scheme, C and D, in Scenario 2. Frequencies displayed for each subcategory on the x-axis are related to the sum of all pupils’ arguments in Scenario 2 according to gender (Na = 1095) and school level (Na = 1168).
Sustainability 13 12554 g005
Figure 6. Percentage of argument subcategories used by girls and boys (a) and by MS and HS pupils (b) for each scheme, E and F, in Scenario 3. Frequencies displayed for each subcategory on the x-axis are related to the sum of all pupils’ arguments in Scenario 2 according to gender (Na = 1102) and school level (Na = 1166). (Colonization-Art: artificial colonization mode; Colonization-Nat: natural colonization mode; Adaptation-New: adaptation to new habitat; Adaptation-Orig.: adaptation to original habitat; Human interest: satisfaction of human interest).
Sustainability 13 12554 g006
Table 1. Biodiversity components per scheme for the three scenarios (sp.: species; rich.: richness; even., evenness; col. mod.: colonization mode).
ScenarioBiodiversity ComponentsSchemeRichness
(N° of Species)
Evenness
(Berger–Parker)
Total Number of IndividualsColonization ModeExpected Answer
1Same species richness,
different evenness
A30.33315-A
B30.66715-
2Different species richness, similar evennessC50.20015-C
D30.33315-
3Different species richness, similar evenness, different colonization modeE70.20015ArtificialF
F30.33315Natural
Table 2. Sample description regarding participants’ gender, age group, school level and school island group (N = 1528).
CharacteristicDescriptionNumber (N) and Percentage (%)
GenderGirl757 (56.03%)
Boy587 (43.45%)
No answer184 (0.52%)
Age group11–15 years935 (61.19%)
16–23 years406 (26.57%)
No answer187 (12.23%)
School levelMiddle School1038 (67.93%)
7th377 (24.67%)
8th361 (23.63%)
9th300 (19.63%)
High School490 (32.07%)
10th272 (17.80%)
11th121 (7.92%)
12th97 (6.35%)
School’s island groupWestern Group71 (4.65%)
Corvo9 (0.59%)
Flores62 (4.06%)
Central Group1174 (76.83%)
Faial113 (7.40%)
Pico301 (19.70%)
São Jorge214 (14.01%)
Graciosa169 (11.06%)
Terceira377 (24.67%)
Eastern Group283 (18.52%)
São Miguel215 (14.07%)
Santa Maria68 (4.45%)
Table 3. Pupils’ answers, number and percentage, to the question: “In your opinion, which of the following environmental schemes is the most desirable for nature?”, according to gender and school level. (DK, do not know; NR, non-responses) (NTotal = 1528).
Scenario
Scheme
GenderSchool LevelTotal
GirlBoyNRMSHS
1A536 (70.8%)392 (66.8%)63 (34.2%)374 (76.3%)617 (59.4%)991 (64.9%)
B139 (18.4%)90 (15.3%)18 (9.8%)65 (13.3%)182 (17.5%)247 (16.2%)
DK5 (0.7%)5 (0.9%)0 (0.0%)4 (0.8%)6 (0.6%)10 (0.7%)
NR77 (10.2%)100 (17.0%)103 (56.0%)47 (9.6%)233 (22.4%)280 (18.3%)
2C508 (67.1%)328 (55.9%)52 (28.3%)325 (66.3%)563 (54.2%)888 (58.1%)
D132 (17.4%)127 (21.6%)21 (11.4%)97 (19.8%)183 (17.6%)280 (18.3%)
DK5 (0.7%)9 (1.5%)0 (0.0%)4 (0.8%)10 (1.0%)14 (0.9%)
NR112 (14.8%)123 (21.0%)111 (60.3%)64 (13.1%)282 (27.2%)346 (22.6%)
3E309 (40.8%)204 (34.8%)28 (15.2%)142 (29.0%)399 (38.4%)541 (35.4%)
F336 (44.4%)253 (43.1%)36 (19.6%)277 (56.5%)348 (33.5%)625 (40.9%)
DK5 (0.7%)6 (1.0%)2 (1.1%)3 (0.6%)10 (1.0%)13 (0.9%)
NR107 (14.1%)124 (21.1%)118 (64.1%)68 (13.9%)281 (27.1%)349 (22.8%)
Table 4. Chi-square results for comparisons of pupils’ gender and school level, and gender within school level, with scheme selected per scenario: Scenario 1, schemes A and B; Scenario 2, schemes C and D; Scenario 3, schemes E and F. (N, number of students; d.f., degrees of freedom).
SchemesX2d.f.p-ValueN
GenderA vs. B0.6510.4191157
C vs. D7.8210.0051095
E vs. F1.1510.2841102
School levelA vs. B11.2710.0011238
C vs. D0.3510.5521168
E vs. F41.1410.0001166
MS and GenderA vs. B0.3210.570740
C vs. D3.8710.049702
E vs. F3.7610.053699
HS and GenderA vs. B0.4610.497417
C vs. D2.8310.092403
E vs. F0.4810.487403
(Scenario 1 [X2 = 36.75 df = 1, p < 0.001, N = 1528], Scenario 2 [X2 = 37.81 df = 1, p < 0.001, N = 1528], and Scenario 3 [X2 = 32.87 df = 1, p < 0.001, N = 1528]).
Publisher’s Note: MDPI stays neutral with regard to jurisdictional claims in published maps and institutional affiliations.

