
Identifying the Policy Direction of National R&D Programs Based on Data Envelopment Analysis and Diversity Index Approach


Abstract
1. Introduction
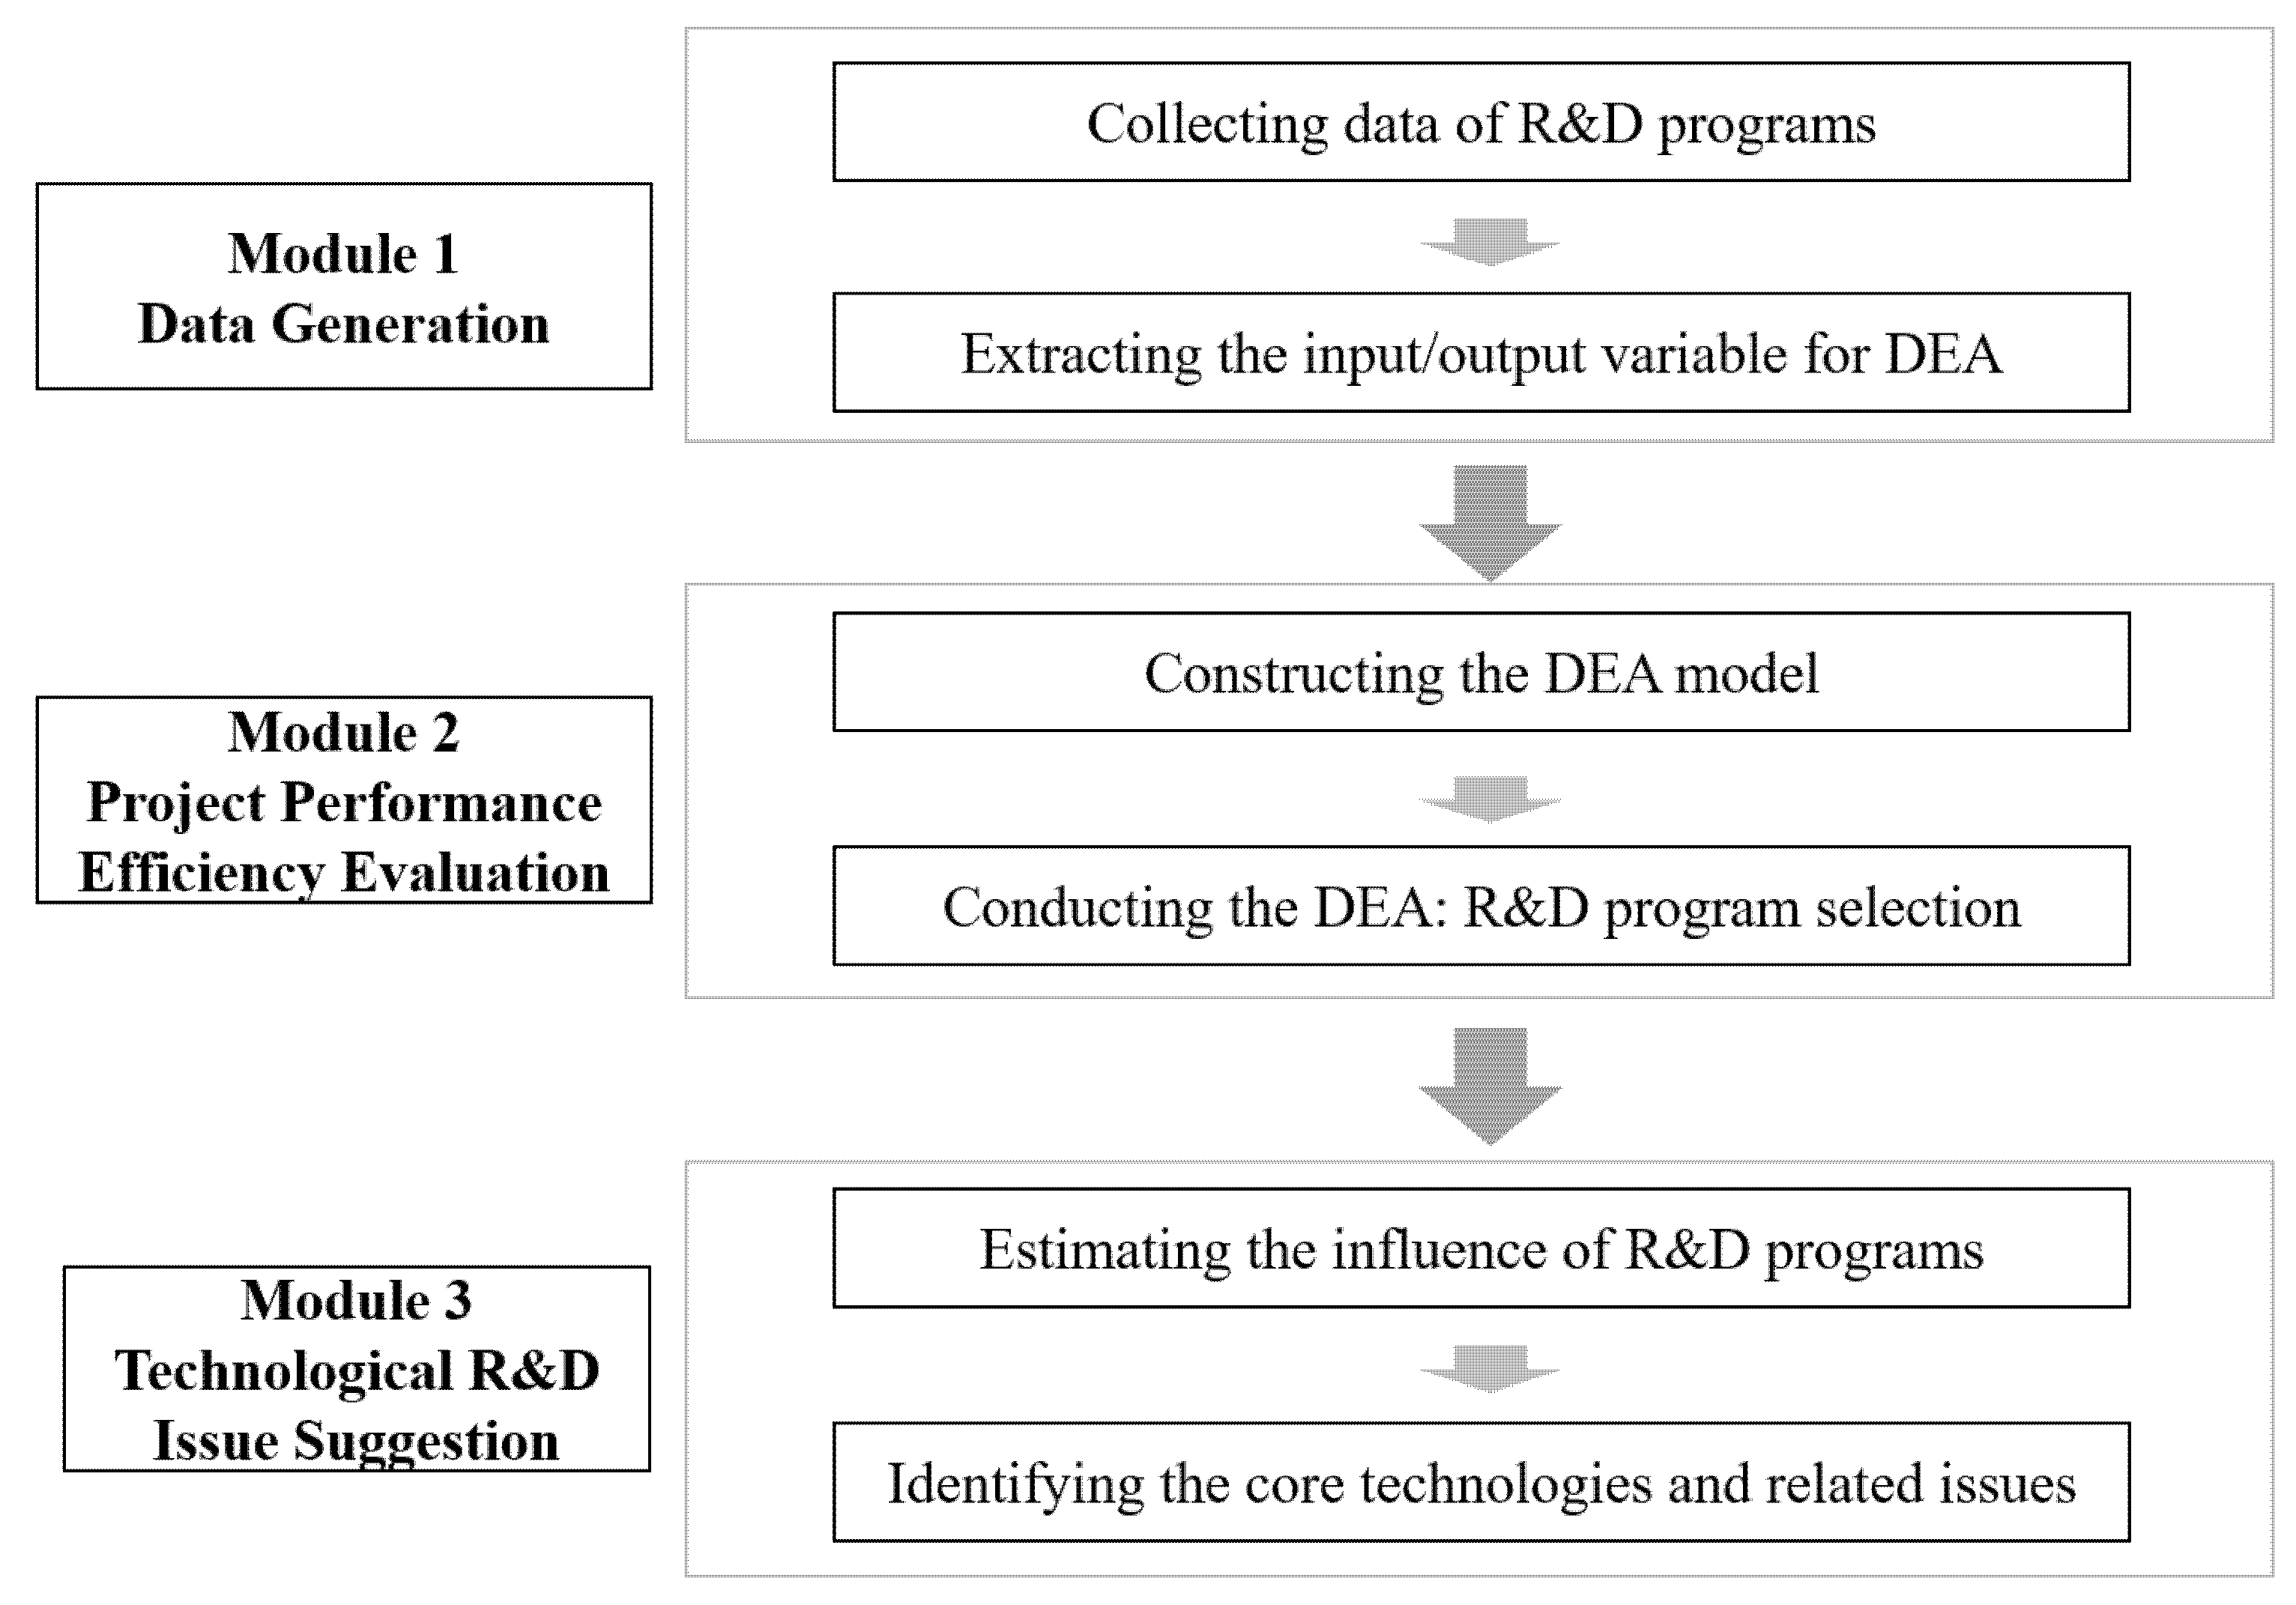
2. Methods
2.1. Data Generation
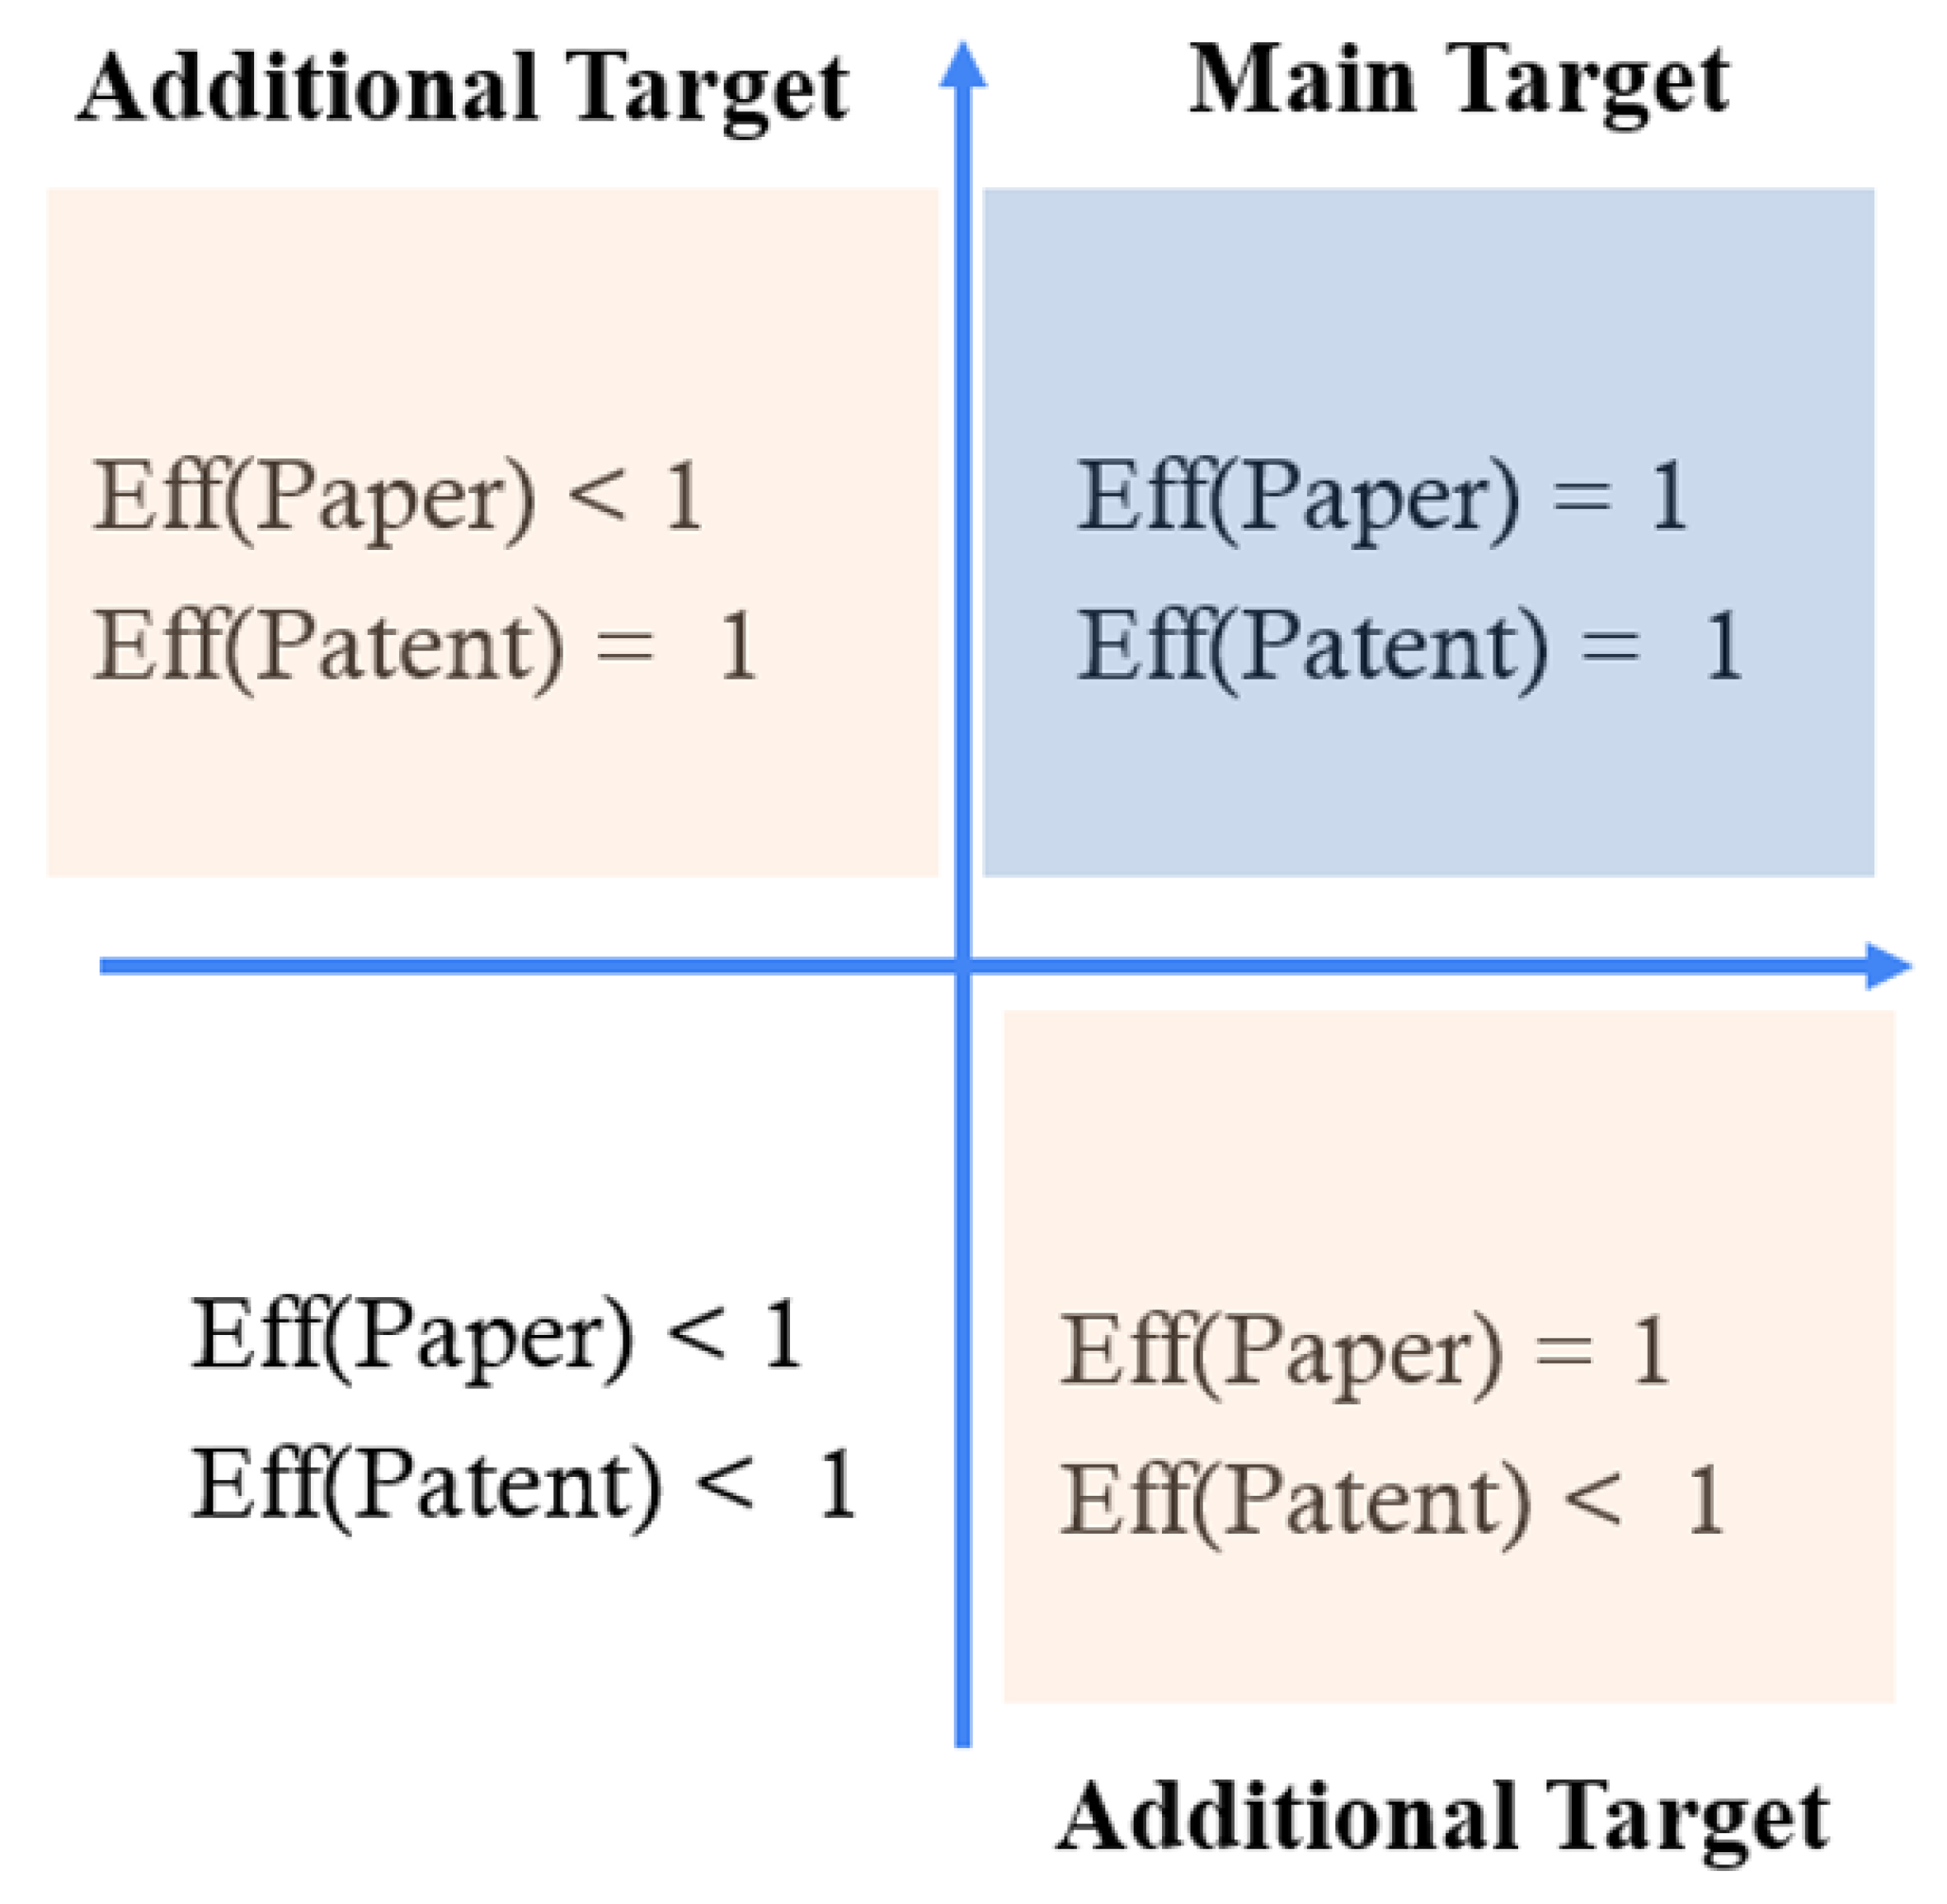
2.2. Program Performance Efficiency Evaluation
2.3. Technological R&D Issue Suggestion
3. Results and Discussion
3.1. Data Generation
3.2. Program Performance Efficiency Evaluation
3.3. Technological R&D Issue Suggestion
4. Conclusions
Author Contributions
Funding
Institutional Review Board Statement
Informed Consent Statement
Data Availability Statement
Acknowledgments
Conflicts of Interest
References
- Kim, S.S.; Choi, Y.S. The innovative platform programme in South Korea: Economic policies in innovation-driven growth. Foresight STI Gov. 2019, 13, 13–22. [Google Scholar] [CrossRef]
- Kim, G.-P.; Kang, G.S.; Kim, J.; Oh, T.; Lee, H.J.; Son, W. Innovative Growth Strategy in the US, Europe and Japan. KIEP 2020, 10, 1–7. Available online: https://hdl.handle.net/11540/12153 (accessed on 12 September 2021).
- Lee, J.-I. An econometric model for evaluating success/failure of an R&D project: The case of Korea. Int. J. Inf. Technol. Manag. 2011, 10, 69–79. [Google Scholar] [CrossRef]
- Hwang, B.Y.; Park, S.H.; Kim, D.C. Efficiency of Public R&D Management Agency and Its Improvement toward Open Innovation. J. Open Innov. 2021, 7, 200. [Google Scholar] [CrossRef]
- Xu, P.; Zhang, M.; Gui, M. How R&D Financial Subsidies, Regional R&D Input, and Intellectual Property Protection Affect the Sustainable Patent Output of SMEs: Evidence from China. Sustainability 2020, 12, 1207. [Google Scholar] [CrossRef]
- Pishdar, M.; Shakib, M.D.; Antucheviciene, J.; Vilkonis, A. Interval Type-2 Fuzzy Super SBM Network DEA for Assessing Sustainability Performance of Third-Party Logistics Service Providers Considering Circular Economy Strategies in the Era of Industry 4.0. Sustainability 2021, 13, 6497. [Google Scholar] [CrossRef]
- Drew, J.; Kortt, M.; Dollery, B. What determines efficiency in local government? A DEA analysis of NSW local government. Econ. Pap. 2015, 34, 243–256. [Google Scholar] [CrossRef]
- Xia, Q.; Jin, M.; Wu, H.; Yang, C. A DEA-based decision framework to determine the subsidy rate of emission reduction for local government. J. Clean. Prod. 2018, 202, 846–852. [Google Scholar] [CrossRef]
- Park, J.H.; Shin, K. Efficiency of government-sponsored R&D projects: A metafrontier DEA approach. Sustainability 2018, 10, 2316. [Google Scholar] [CrossRef]
- Luna, D.E.; Gil-Garcia, J.R.; Luna-Reyes, L.F.; Sandoval-Almazan, R.; Duarte-Valle, A. Improving the performance assessment of government web portals: A proposal using data envelopment analysis (DEA). Inf. Polity 2013, 18, 169–187. [Google Scholar] [CrossRef]
- Andersen, P.; Petersen, N.C. A procedure for ranking efficient units in data envelopment analysis. Manag. Sci. 1993, 39, 1261–1264. [Google Scholar] [CrossRef]
- Banker, R.D. Estimating most productive scale size using data envelopment analysis. Eur. J. Oper. Res. 1984, 17, 35–44. [Google Scholar] [CrossRef]
- Gattoufi, S.; Oral, M.; Reisman, A. Data envelopment analysis literature: A bibliography update (1951–2001). J. Socio-Econ. Plan. Sci. 2004, 38, 159–229. [Google Scholar] [CrossRef][Green Version]
- Rao, C.R. Diversity and dissimilarity coefficients: A unified approach. Theor. Popul. Biol. 1982, 21, 24–43. [Google Scholar] [CrossRef]
- Van Rijnsoever, F.J.; van Den Berg, J.; Koch, J.; Hekkert, M.P. Smart innovation policy: How network position and project composition affect the diversity of an emerging technology. Res. Policy 2015, 44, 1094–1107. [Google Scholar] [CrossRef]
- Stirling, A. A general framework for analysing diversity in science, technology and society. J. R. Soc. Interface 2007, 4, 707–719. [Google Scholar] [CrossRef] [PubMed]
- Bordons, M.; Bravo, C.; Barrigón, S. Time-tracking of the research profile of a drug using bibliometric tools. J. Am. Soc. Inf. Sci. 2004, 55, 445–461. [Google Scholar] [CrossRef]
- Jeong, J.Y.; Kang, I.; Choi, K.S.; Lee, B.-H. Network analysis on green technology in national research and development projects in Korea. Sustainability 2018, 10, 1043. [Google Scholar] [CrossRef]
- Lee, J.Y.; Kumari, R.; Jeong, J.Y.; Kim, T.-H.; Lee, B.-H. Knowledge Discovering on Graphene Green Technology by Text Mining in National R&D Projects in South Korea. Sustainability 2020, 12, 9857. [Google Scholar] [CrossRef]
- Lee, H.Y.; Park, Y.T. An international comparison of R&D efficiency: DEA approach. Asian J. Technol. Innov. 2005, 13, 207–222. [Google Scholar] [CrossRef]
- Kocher, M.G.; Luptacik, M.; Sutter, M. Measuring productivity of research in economics: A cross-country study using DEA. Socio-Econ. Plan. Sci. 2006, 40, 314–332. [Google Scholar] [CrossRef]
- Cooper, W.W.; Seiford, L.M.; Tone, K. Data Enveloment Analysis: A Comprehensive Text with Models, Applications References and DEA-Slover Software; Springer: Berlin/Heidelberg, Germany, 2007. [Google Scholar]
- Wang, E.C.; Huang, W. Relative efficiency of R&D activities: A cross-country study accounting for environmental factors in the DEA approach. Res. Policy 2007, 36, 260–273. [Google Scholar]
- Cullman, A.; Schmidt-Ehmcke, J.; Zloczysti, P. Innovation, R&D Efficiency and the Impact of the Regulatory Environment: A Two-Stage Semi-Parametric DEA Approach. Econstor 2009. DIW Discussion No.883. Available online: https://www.econstor.eu/bitstream/10419/29763/1/599519827.pdf (accessed on 23 August 2021).
- Zhao, H. The Empirical Study on R&D Efficiency of High-Tech Industry in China. Int. J. Trade Econ. Financ. 2015, 6, 49. [Google Scholar]
- Zhou, Y.; Dong, F.; Liu, Y.; Li, Z.; Du, J.; Zhang, L. Forecasting emerging technologies using data augmentation and deep learning. Scientometrics 2020, 123, 1–29. [Google Scholar] [CrossRef]
- Toloo, M.; Nalchigar, S. A new integrated DEA model for finding most BCC-efficient DMU. Appl. Math. Model. 2009, 33, 597–604. [Google Scholar] [CrossRef]
- Butler, T.W.; Li, L. The utility of returns to scale in DEA programming: An analysis of Michigan rural hospitals. Eur. J. Oper. Res. 2005, 161, 469–477. [Google Scholar] [CrossRef]
- Banker, R.D.; Charnes, A.; Cooper, W.W. Some models for estimating technical and scale inefficiencies in data envelopment analysis. Manag. Sci. 1984, 30, 1078–1092. [Google Scholar] [CrossRef]
- Mankins, J.C. Technology readiness levels. White Pap. 1995, 1995, 6. [Google Scholar]
- Jou, G.T.; Yuan, B.J. Utilizing a novel approach at the fuzzy front-end of new product development: A case study in a flexible fabric supercapacitor. Sustainability 2016, 8, 740. [Google Scholar] [CrossRef]
- Fan, J.-L.; Zhang, X.; Zhang, J.; Peng, S. Efficiency evaluation of CO2 utilization technologies in China: A super-efficiency DEA analysis based on expert survey. J. CO2 Util. 2015, 11, 54–62. [Google Scholar] [CrossRef]
- Rusydiana, A.S.; Sanrego, Y.D. Measuring the performance of Islamic banking in Indonesia: An application of Maslahah-efficiency quadrant (MEQ). J. Islamic Monet. Econ. Financ. 2018, 3, 79–98. [Google Scholar] [CrossRef]
- Falagas, M.E.; Kouranos, V.D.; Arencibia-Jorge, R.; Karageorgopoulos, D.E. Comparison of SCImago journal rank indicator with journal impact factor. FASEB J. 2008, 22, 2623–2628. [Google Scholar] [CrossRef]
- Li, B.; Han, L. Distance Weighted Cosine Similarity Measure for Text Classification. In Proceedings of the International Conference on Intelligent Data Engineering and Automated Learning, Hefei, China, 20–23 October 2013; pp. 611–618. [Google Scholar]
- Spellerberg, I.F.; Fedor, P.J. A tribute to Claude Shannon (1916–2001) and a plea for more rigorous use of species richness, species diversity and the ‘Shannon–Wiener’Index. Glob. Ecol. Biogeogr. 2003, 12, 177–179. [Google Scholar] [CrossRef]
- Al-Fedaghi, S. A conceptual foundation for the Shannon-Weaver model of communication. Int. J. Soft Comput. 2012, 7, 12–19. [Google Scholar] [CrossRef]
- Magnussen, S.; Boyle, T. Estimating sample size for inference about the Shannon-Weaver and the Simpson indices of species diversity. For. Ecol. Manag. 1995, 78, 71–84. [Google Scholar] [CrossRef]
- Choi, H.; Koo, Y. Effectiveness of battery electric vehicle promotion on particulate matter emissions reduction. Transp. Res. Part D Transp. Environ. 2021, 93, 102758. [Google Scholar] [CrossRef]
- Kwon, L.-N.; Park, J.-H.; Moon, Y.-H.; Lee, B.; Shin, Y.; Kim, Y.-K. Weak signal detecting of industry convergence using information of products and services of global listed companies-focusing on growth engine industry in South Korea. J. Open Innov. Technol. Mark. Complex. 2018, 4, 10. [Google Scholar] [CrossRef]
- Ki, J. A Comparative Analysis of Autonomous Vehicle Policies among Korea, Japan, and France. 2020. Available online: https://hal.archives-ouvertes.fr/hal-02562482/document (accessed on 12 September 2021).
- Yuan, K.; Song, Y.; Shao, Y.; Sun, C.; Wu, Z. A charging strategy with the price stimulus considering the queue of charging station and EV fast charging demand. Energy Procedia 2018, 145, 400–405. [Google Scholar] [CrossRef]


| Information Part | Gathered Information | |
|---|---|---|
| Program description | Title, abstract, keyword, the number of researchers, R&D budget | |
| Program output | Patent | Title, application/granted, assignee, IPC code, contribution |
| Paper | Title, keyword, journal, contribution | |
| Research | Unit | Input Variable | Output Variable |
|---|---|---|---|
| Lee and Park et al. (2005) [20] | Nation | R&D expenditure, researchers | Patent, paper |
| Kocher et al. (2006) [21] | Nation | R&D expenditure, researchers | Paper |
| Coccia et al. (2007) [22] | Institution | researchers, public fund | Publication |
| Wang and Huang et al. (2007) [23] | Nations | R&D stocks, researchers | Patent, paper |
| Cullman et al. (2009) [24] | Nations | R&D expenditure, researchers | Patent |
| Zhao et al. (2015) [25] | Province | Researchers, R&D product, development costs | Patent, number of new products |
| Park and Shin (2018) [9] | Institution | Researchers, R&D fund | Patent, paper |
| Feature | Type | Variables |
|---|---|---|
| Development Capability | Paper | Citation, impact factor |
| Patent | Forward citation | |
| Scope and Coverage | Paper | Impact factor (indirect) |
| Patent | Family size | |
| Information Exchange | Paper | - |
| Patent | Backward citation | |
| Intensity | Paper | Frequency (weighted) |
| Patent | Frequency (weighted) |
| Information Part | Variable | Description | |
|---|---|---|---|
| Input variable | R&D budget | Government R&D budget allocation for strategic investments in government R&D programs | |
| Workforce | The number of researchers was classified based on the academic background of the researchers | ||
| Output variable | Patent | Frequency (weighted by contribution) | The number of applied patents during the R&D program |
| Number of forward citations | The number of other patents cited a specific patent | ||
| Number of backward citations | The number of reference patents that are cited by a specific patent | ||
| Number of family patents | The number of patents for similar publications in different countries | ||
| Paper | Frequency (weighted by contribution) | The number of papers applied during the R&D program | |
| Impact factor | The yearly mean number of citations of articles published in the last two years in a given journal | ||
| Number of citations | The number of times that a publication has been cited by other publications | ||
| Variable | # of Data | Average | Standard Deviation | |
|---|---|---|---|---|
| Input | Workforce | 17 | 273.48 | 289.36 |
| R&D budget (100 million/won) | 17 | 145.55 | 292.34 | |
| Output (paper) | Frequency | 17 | 22.16 | 23.75 |
| Citation | 17 | 870.89 | 913.81 | |
| Impact factor | 17 | 205.29 | 215.64 | |
| Output (Patent) | Frequency | 17 | 69.69 | 144.08 |
| Backward citation | 17 | 383.41 | 820.10 | |
| Forward citation | 17 | 61.84 | 127.61 | |
| Family patent | 17 | 91.41 | 233.76 | |
| Input Variable Output Variable | Workforce | R&D Budget | |
|---|---|---|---|
| Paper | Frequency | 0.206 | 0.255 |
| Citation | 0.038 | 0.092 | |
| Impact factor | 0.416 * | 0.479 ** | |
| Patent | Frequency | 0.956 *** | 0.983 *** |
| Backward citation | 0.951 *** | 0.972 *** | |
| Forward citation | 0.936 *** | 0.970 *** | |
| Family patent | 0.958 *** | 0.980 *** |
| Program | Paper | Patent | Quadrant | ||
|---|---|---|---|---|---|
| CRS | VRS | CRS | VRS | ||
| P01 | 1 | 1 | 1 | 1 | I |
| P02 | 0.007 | 0.083 | 0.137 | 0.569 | III |
| P03 | 0.274 | 1 | 0.631 | 1 | I |
| P04 | 0.112 | 0.546 | 0.247 | 0.498 | III |
| P05 | 1 | 1 | 1 | 1 | I |
| P06 | 0.174 | 0.717 | 0.226 | 0.227 | III |
| P07 | 0.009 | 0.443 | 0.197 | 1 | II |
| P08 | 0.008 | 0.115 | 0.091 | 0.303 | III |
| P09 | 0.005 | 0.072 | 0.098 | 0.410 | III |
| P10 | 0.152 | 0.339 | 1 | 1 | I |
| P11 | 0.004 | 0.180 | 0.092 | 0.483 | III |
| P12 | 0.011 | 0.091 | 0.127 | 0.386 | III |
| P13 | 0.173 | 0.900 | 1 | 1 | II |
| P14 | 0.005 | 0.744 | 0.207 | 1 | II |
| P15 | 0.136 | 0.537 | 0.624 | 0.839 | III |
| P16 | 0.045 | 0.106 | 0.880 | 0.980 | III |
| P17 | 0.679 | 1 | 1 | 1 | I |
| Quadrant | Program | Paper | Patent | ||
|---|---|---|---|---|---|
| Shannon–Weaver | Cosine Distance | Shannon–Weaver | Cosine Distance | ||
| Quadrant I | P01 | 1.763 | 0.650 | 1.321 | 0.162 |
| P03 | 2.659 | 0.740 | 1.900 | 0.575 | |
| P05 | 1.512 | 0.643 | - | 0.542 | |
| P17 | 2.591 | 0.641 | 2.008 | 0.452 | |
| Quadrant II | P07 | 1.931 | 0.660 | 2.134 | 0.554 |
| P10 | 2.322 | 0.527 | 1.081 | 0.111 | |
| P13 | 2.091 | 0.696 | 2.174 | 0.486 | |
| P14 | 2.699 | 0.632 | 2.784 | 0.578 | |
| Field | Program | Issue (Keyword) |
|---|---|---|
| T01 | P07 | Driving motor (heavy rare earth, magnet, coercivity) |
| P14 | Driving power distribution (power distribution control, powertrain, electromagnetic transmission) | |
| T02 | P03 | Material (heat-exchanger, phase change heat transfer) Driving heat management (driving performance, battery thermal management) |
| T03 | P03 | Energy density (electroactive material, anode material, separator) |
| P14 | Battery management system (cylindrical cells, high safety, high voltage battery) | |
| T04 | P07 | Hydrogen storage system (solid hydrogen storage system, metal hydride) |
| P17 | Fuel cell (DME (dimethyl ether) hydrogen reformer, micro-sensor) Catalyst (reformer catalyst) | |
| T05 | P14 | Hydrogen supply (hydraulic piston type compressor, tube trailer) Hydrogen storage (balance of tank, regulator, receptacle) |
Publisher’s Note: MDPI stays neutral with regard to jurisdictional claims in published maps and institutional affiliations. |
© 2021 by the authors. Licensee MDPI, Basel, Switzerland. This article is an open access article distributed under the terms and conditions of the Creative Commons Attribution (CC BY) license (https://creativecommons.org/licenses/by/4.0/).
Share and Cite
Choi, M.; Kwon, O.; Won, D.; Jang, W. Identifying the Policy Direction of National R&D Programs Based on Data Envelopment Analysis and Diversity Index Approach. Sustainability 2021, 13, 12547. https://doi.org/10.3390/su132212547
Choi M, Kwon O, Won D, Jang W. Identifying the Policy Direction of National R&D Programs Based on Data Envelopment Analysis and Diversity Index Approach. Sustainability. 2021; 13(22):12547. https://doi.org/10.3390/su132212547
Chicago/Turabian StyleChoi, Myoungjae, Ohjin Kwon, Dongkyu Won, and Wooseok Jang. 2021. "Identifying the Policy Direction of National R&D Programs Based on Data Envelopment Analysis and Diversity Index Approach" Sustainability 13, no. 22: 12547. https://doi.org/10.3390/su132212547
APA StyleChoi, M., Kwon, O., Won, D., & Jang, W. (2021). Identifying the Policy Direction of National R&D Programs Based on Data Envelopment Analysis and Diversity Index Approach. Sustainability, 13(22), 12547. https://doi.org/10.3390/su132212547