Abstract
The Wied il-Mielaħ Window (Gozo–Malta) is a limestone natural arch on the north-western coast of the island of Gozo in Malta. It is located at the end of the Wied il-Mielaħ valley north of the village of Għarb. This natural arch is less well known than the Azure Window, which collapsed in March 2017 following a heavy storm, but notwithstanding, it is an imposing and important natural monument too. In the past, the Wied il-Mielah valley was responsible for discharging wastewater from the surrounding localities to the Mediterranean directly at the Wied il-Mielah Window. The sewage flag was often clearly visible underneath the archway into the open sea. The natural features of the arch provide an outstanding touristic attraction. To avoid what happened to the Azure Window, a methodology for the evaluation of the collapse hazard, combining passive seismic, ground penetrating radar (GPR), geological/geomorphological surveys and mine engineering methods, is here proposed. In this study, a methodological approach was applied, based on the following: (i) passive seismic method to study the physical–mechanical characteristics of the rock mass that constitutes the window; (ii) GPR method in order to demonstrate the conservation state (i.e., the intensity of fracturing); (iii) geological/geomorphological surveys in order to obtain a crack pattern; and (iv) scaled span empirical analysis in order to evaluate the stability of the arch. The calculation of the safety factor, with a static method, gave a value equal to 3.75 with a probability of collapse of the marine arch within 50 and 100 years.
1. Introduction
The main topic dealt with in this work is inherent to the multidisciplinary study of the evolution of natural marine arches, (known also as “windows”), particularly widespread along the high rocky coasts in the Mediterranean area. They often constitute important local tourist attractions, which, however, could have a limited life depending on the structural vulnerability conditions and the morphoevolutive stage of the arch itself. The approach used here, as part of a wider Italy–Malta bilateral research program, constitutes an example of frontier study in this sector, applying different survey and monitoring methods (geophysical, structural, gemorphological, photogrammetric) in a single site: the Wied il-Mielaħ Window (Figure 1d), located 5 km north-west of Victoria, (Gozo–Malta; Figure 1a–c).
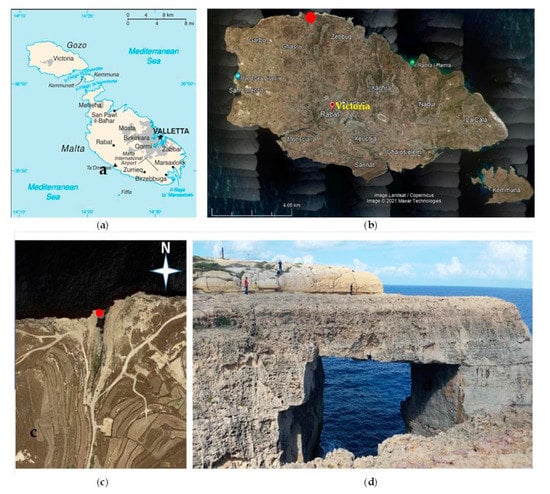
Figure 1.
Geographical location of the study site (red dots in a–c) in Gozo and detail of the Wied il-Mielaħ arch surveyed area (d).
The stability and conservation of the window have been a primary concern of local authorities, since the famous Azure Window has collapsed [1,2]. As often happens over the years, the structure has progressively deteriorated; consequently, due to climatic events, water infiltration has led to an increase in humidity and rock degradation. Several studies were carried out in order to determine the effects of these environmental alterations within the rock that forms the roof of the window and sea karstic caves [3,4,5]. Recent research studies assume that the protection of these important structures depends mainly on the degree of damage of the window’s roof, stress status and presence of several discontinuities belonging to the joint sets that may increase the kinematic degree of freedom of rock blocks [4]. The development of these studies, focusing on preventing structural failure of the roof, has a very important application in natural heritage protection.
The risk assessment of Wied il-Mielaħ Window can act as a useful tool in damage prevention. However, as illustrated in [6], karstic areas usually require complex scientific and technical efforts, and defining unique study methods is very difficult; therefore, it is recommended to determine a strategy that provides flexibility to adjust the specific methods according to local conditions in each region [7].
The stability of karstic rocks is being increasingly assessed through the use of geophysical surveys [3,8,9,10,11,12,13,14,15,16]. For example, geophysical methods allow a rapid analysis of rock shearing [17,18,19,20]. In some cases, such methods are a preferred alternative to direct investigation methods that are both costly, invasive, and difficult to carry out, especially in relatively inaccessible places.
In the present study, a method to evaluate the structural failure risk in the Wied il-Mielaħ Window is proposed and applied. The evaluation was performed in four phases: (1) analysis of the geometric parameters related to the Wied il-Mielaħ Window; (2) definition of the physical–mechanical and geomorphological characteristics of the rock that constitutes the roof; (3) evaluation of the safety factor (SF); and (4) determination of failure probability.
2. Geological Settings
The Maltese Islands consist of parts of the Mediterranean seabed that are warped and uplifted, emerging from the sea. The warping was caused by the collision between the African tectonic plate to the south and the European plate to the north. The geological formations that outcrop in Malta and Gozo (Figure 2) are between 5 million and 30 million years old (Miocene–Oligocene), and are represented by a stratigraphic sequence divided in four main formations [21]:
- Lower Coralline Limestone Formation (upper Oligocene), characterized by a pale grey limestone with abundant fossil corals and marine calcareous algae forming sheer cliffs up to 140 m;
- Globigerina Limestone Formation (late Oligocene to mid Miocene), a softer yellowish fine-grained limestone unit (biomicrite) forming irregular slopes with terrace-like steps, 20 m to over 200 m thick [22,23];
- Blue Clay Formation (Miocene, Langhian–Tortonian), a unit mainly characterized by alternating layer of silty sands, dark-grey marls or clays, 20 m to 75 m thick;
- Upper Coralline Limestone Formation (upper Miocene, Tortonian to early Messinian), a pale grey limestone unit, very similar to the Lower Coralline Limestone, 10–170 m thick.
In some areas, the bedrock is covered by relatively thin Quaternary deposits consisting of terrestrial aeolian and alluvial sediments that were deposited following the uplift and emergence of the sequence [24].
The upper and lower coral limestones, which characterize the great sea cliffs, are more compact and more resistant to wind and hydraulic erosion. They outcrop at the sub-flat hills of Gozo, while the golden-colored Globigerina Limestone is softer and defines landscapes with sweeter shapes.
The island of Gozo is characterized by a gentle regional dip to the north, which caused the Lower Coralline Limestone to develop into vertical cliffs over 120 m high along the south-west coast, falling to just over 20 m above sea level on the northern coast between Marsalforn and San Blas Bay [21,25].
The two main faults in Gozo are the Sannat Faults and Qala Faults, which are located close to Mġarr ix-Xini in southern Gozo (Figure 2). Structurally, they separate the south-eastern part of Gozo from the rest of the island [26].
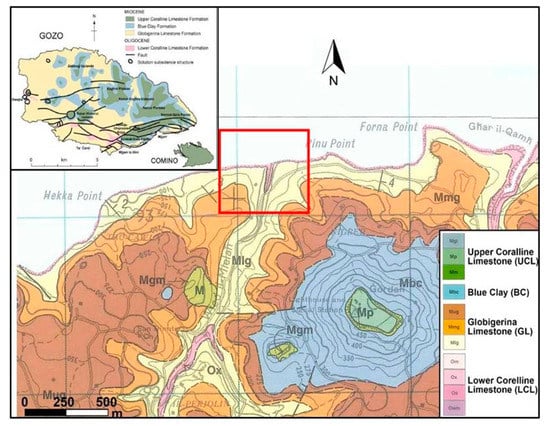
Figure 2.
Geological map of the Gozo by the Oil Exploration Directorate (OPM) at scale 1:25,000 (1993) [27]. Legend: (above left) Geological map of Gozo Island; (below) enlargement on the area of interest with the study site in the red box.
3. Geomorphology and Coastal Evolution
Though covering little more than one-third of the area of the main island of Malta, Gozo is topographically and geomorphologically more varied than Malta. It constitutes a horst within the Maltese horst-and-graben system. Several ENE-WSW faults along its southeastern coast and other main faults located in the western part of Gozo, generally associated with collapsed palaeosinkholes, have controlled the development of most of the river valleys.
In the northern half of the island, erosion has divided the Upper Coralline Limestone plateau into a series of disconnected fragments which diminish in size, but increase in height, from east to west. The largest one among them, the Nadur and Xagħra plateau, covers an area of more than 6.5 km2 and rises up to heights of 120–135 m, thus occupying the bulk of the north-eastern part of the island.
These uplands, like their counterparts in Malta, are penetrated by numerous, sharply incised valleys, with slopes and floors developed on the Blue Clay. In fact, the Gozitan landscape is characterized by the presence of shapes linked to past sea-level changes that have significantly modified the paleogeography of Gozo.
Along its length, the continental shelf is dissected by numerous channels that follow the trend (SW-NE and SSW-NNE) of the terrestrial river valleys (‘wied’ in Maltese; plur. ‘widien’), formed when the rivers downcut the Lower Coralline Limestone bedrock because of the uplift of the land or the fall of the sea level [28]. Some of the submarine channels represent a prolongation of the current terrestrial ‘widien’, and it is probable that the entire network of incised valleys and related alluvial plains originated when the continental shelf emerged during the last sea-level lowstand. One of these deeply engraved valleys [29] is that of the study area, which, in its terminal part, runs along the natural arch of Wied il-Mielaħ (Figure 3).
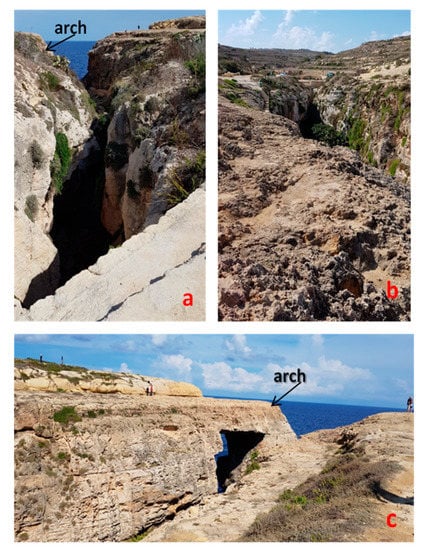
Figure 3.
The figure shows the narrow, deeply engraved river valley, both in the terminal part (a) and upstream (b) of the natural arch of Wied il-Mielaħ with a rectangular vault (c).
Apart from the structural features, the different erodibility of the four lithological units is the main factor controlling the Gozitan landscape of plateaus, mesas, buttes and gorges. So, four main features dominate the landscape as follows:
- Fragmented mesas of the Upper Coralline Limestone;
- Low-lying plains and hills that have developed on the Globigerina Limestone. Between the two, there are sweeping slopes which mark outcrops of the Blue Clay;
- Low-lying flat-topped hills, locally known as Mejda, where complete erosion of the Blue Clay exposed the planar top of the Upper Globigerina Limestone Member;
- Slopes characterized by differential erosion with possible triggers of natural arch formation mechanisms along the northern coast of the island where the Globigerina Limestone outcrops.
A spectacular type of erosional landform in Gozo is the sea arch, which forms as the result of different rates of erosion, typically due to the varied resistance of bedrock (Figure 3). These archways may have an arcuate or rectangular shape, with the opening extending below water level. The height of an arch can be up to tens of meters above sea level. These features are generally formed on cliffs or headlands.
The formation mechanism is represented in Figure 4 and shows that the first phase of marine arch formation begins with the wave action that attacks vertical lines of weakness, such as faults or cracks (Figure 4A). Processes such as hydraulic action wave pounding and abrasion widen these faults into cracks (where waves compress air into the cracks enlarging the crack into a crevice) and eventually the waves will penetrate deeply enough to create caves (Figure 4B,C). Over time, the cave will be eroded into an arch, accessible to the sea on both sides (Figure 4D).
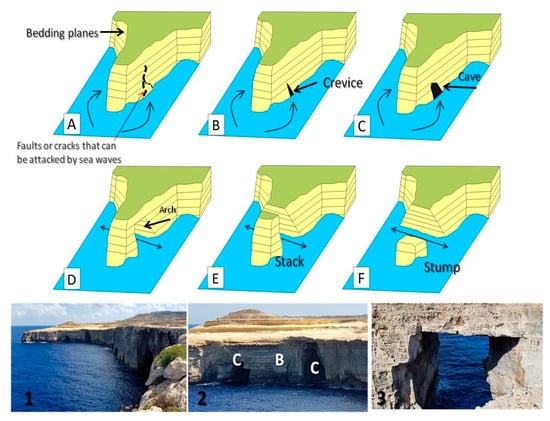
Figure 4.
The figure shows the main 6 schematized evolutionary stages of the formation of natural marine arches (A–F), while the photos show the coast north of Gozo (1), where the Wied il-Mielaħ Window is located. Photo (2) shows arches in formation (stages (B,C)), while photo 3 shows a formed arch (stage (D)).
Weathering will also play a role with physical weathering processes, such as salt crystallization and chemical processes, such as carbonation (which weakens the rock surrounding the cave or arch), making it more susceptible to mass movement and collapse. Finally, the erosion and weathering continue, and the arch collapses, leaving behind a stack (a vertical column of rock, Figure 4E). These stacks can be attacked further on, and eventually, the stack may collapse to leave a low-lying stump (Figure 4F).
However, the aforementioned evolutionary phases do not always follow the described temporal sequence as, for example, in the case of the collapse of the Azure Window. Until 2017, this was an iconic symbol for the Gozo island and probably its major tourist attraction. In this case, the collapse of the arch did not leave a stack [2]. Rather, a platform that supported the base of the pillar, which was attached on its southern side, collapsed under the stormy conditions, and the fragments deposited in shallow water close to the shore. The main mass of the pillar and arch were subsequently destabilized, and large monolithic blocks were deposited in the deeper water to the west of the arch location [2,4].
4. Materials and Methods
The study was carried out using an integrated approach, starting from a geomorphological and geological filed survey, from the study of historical documentary and photographic sources, up to geophysical prospecting and reconstruction of the digital model of the marine arch, obtained by applying photogrammetric techniques to UAV images.
4.1. Geophysical Prospecting: GPR
With regard to geophysical prospecting, ground penetrating radar (GPR) is the geophysical technique that customarily allows the finest resolution. In particular, the available resolution is of the order of the central wavelength in the soil (with some difference between horizontal and vertical resolution) at the air–soil interface, and it suffers some degradation with depth [30].
The datum is taken along straight observation lines describing (when possible) an orthogonal grid. The spatial step in both directions of the grid should be of the order of one quarter of the central wavelength in the soil, which is a requirement easily accomplished with regard to the in-line step (namely the distance between two consecutive data along the same observation line) but is a quite critical requirement with respect to the transect (namely the distance between two adjacent observation lines). Therefore, some spatial aliasing is customarily accepted along the transect, and the amplitude of the grid is usually calibrated on the basis of the size of the targets looked for. Each observation line provides a vertical image of the portion of soil underlying it, and all the observation lines together provide the so-called “cube of data” from which planar representation can be derived along planes orthogonal to any direction. Among the possible “cuts”, the most relevant ones are those orthogonal to the z-axis, namely the “depth-slices” that (under some assumptions and approximations) provide maps of the buried scenario at progressively larger depth levels [31].
Indeed, the slices are sections achieved under some averaging of all the returned signals in the same position within a finite time interval Δt. Selecting the various parameters involved and in particular the time width of the slice, Δt, is crucial [30,31,32,33]. Typically, Δt must be of the order of the dominant period, but different widths can be used in order to enhance particular features. In common practice, non-overlapping time windows are chosen, although sliding windows could be used instead, with the advantage of greater resolution but with the drawbacks of higher computational costs [30,31,32,33,34,35,36].
The interpolation of different depth slices, on the condition that some thresholds are applied, can provide suggestive and interesting perspective representations of the investigated site. These can provide a more precise idea of what scenario develops under the soil crust, but some caution must be taken, due to the intrinsic arbitrariness of the chosen threshold. A reasonable protocol is, therefore, to examine the image at different threshold levels and to check the fact that the main anomalies are “robust” vs. the chosen threshold level [32,33,34]. That said, as a step preliminary to the depth slices and to any possible 3D representation, some processing is needed on each Bscan (i.e., on the data gathered within each observation line, considered separately from the other ones), especially when depth slices are in order. Typical processing steps are zero timing (in order to erase the contribution of the propagation of the waves within the GPR system or in any case outside the soil), background removal or subtracting averaging (which are indeed 2D filters with regard to the spatial variations), gain vs. depth (in order to counteract the natural attenuation suffered by the GPR signal during its propagation), 1D filtering (in order to clean and correct spurious processing effects on each Bscan) and migration [30]. Other less common processing steps can be applied in particular cases, e.g., topographic corrections, FK filters, filters vs. external electromagnetic interferences and so on. Indeed, it is possible to consider the data altogether performing a full 3D processing (which is different from a sequence of 2D processing followed by suitable interpolations and joining algorithms). However, this is rarely performed [30,33] and it is not guaranteed that it provides better results because of the many parametric uncertainties involved about GPR data.
These uncertainties are caused by the a priori unknown electromagnetic characteristics of the soil, by an imprecise characterization of the antennas (a precise characterization would involve lengthy and not trivial measurements, and, in any case, would refer to the current case history because the antennas are influenced by the soil at hand), by the clutter, by possible electromagnetic interferences (GPR systems work in the same frequency bands of TV, mobile phones, FM broadcast radio transmission, data transmissions and so on) and of course by the thermal noise that any receiver unavoidably generates.
To carry out the GPR survey, a Ris Hi-Mod GPR system equipped with a dual band 200–600 MHz antenna was used; the data were acquired in continuous mode with 512 samples per scan, 80 ns recording time window for the 600 MHz antenna and 160 ns recording time window for the 200 MHz antenna, and along 0.25 m spaced Bscans. The radar data were then processed using the software Reflexw, produced by Sandmeier Software.
Fractures can be identified from the properties of their content in terms of nature and size or their infill material. This is possible if fractures are sufficiently open and filled with air or water, or with other materials, such as clay or terra rossa, as in the case of karst, allowing for a high amount of radar energy to be backscattered [35].
The electromagnetic (EM) wave velocity was determined from the reflection profiles acquired in continuous mode, using the characteristic hyperbolic shape of the reflection from a point source [36,37,38,39].
In order to retrieve the propagation velocity, the well-known two-way-travel-time was exploited, namely the following:
where s is the rock thickness and t is the two-way travel time related to the reflection event interpreted as the bottom of the window. Replacing t = 90ns and s = 5.5 m in Equation (1), we achieve the following:
4.2. Stability Analysis
The proposed method to study the stability was developed using, as an example, the studies performed in the evaluation of roof failure at abandoned mines. These studies [40,41] allow the SF to be defined considering the empirical relationships that include geometrical parameters, such as the average thickness of the rock window, the window’s length, and the rock quality parameter defined by the rock mass quality Q-value of Barton [42]. Considering the relationships determined by [41] in the present work, they were adapted to the specific case studied.
A crown pillar is any rock structure that remains between the void and the ground surface (Figure 2). The thickness of the rock that forms the roof of the window is defined as the thickness T. The width of the roof is defined as the length L.
All the measurements were derived by using the digital 3D model developed in this study. As described in [17], empirical analysis methods can be used to assess the stability of the window. The method of assessment is known as the scaled crown pillar span method [43]. This method was developed from extensive databases containing information about the geometry, rock mass parameters, and stability of the window. The method relies upon two input parameters: one related to the crown pillar geometry, and the other related to the rock mass quality. The rock mass quality is quantified by Q (tunneling quality index; [44]).
In particular, the considered variables are the thickness of the roof (T) of the window and its width (L) (Figure 5).
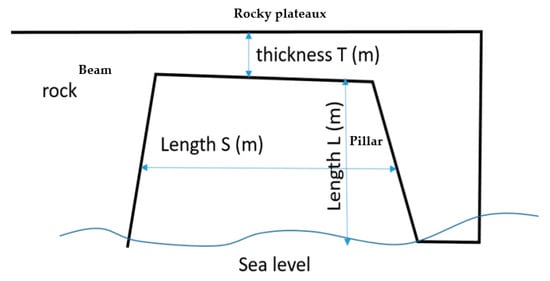
Figure 5.
Representative geometrical scheme of the natural rocky arch and physical parameters considered.
These parameters should be taken into account in stability evaluation.
The physical–mechanical characteristics of the rock were evaluated, using the seismic wave velocity obtained by seismic measurements. Seismic P−wave velocity analysis was used with a revised relationship that accounts for the long-term surface stability of the crown pillar. The empirical analysis on the stability of the window was performed considering the crown pillar’s thickness and its span as functions of its length and width, respectively. Furthermore, ground-penetrating radar (GPR) measurements [45,46] allowed to obtain the degree of fractures inside the roof.
Instability of the window is likely to occur if the parameter Cs (related to the geometry of the window) is greater than the parameter Sc (related to the rock quality). These parameters are calculated from the equation (modified by [47]) as follows:
And
where S = crown pillar span (m), L = crown pillar length (m), T = crown pillar thickness (m), S.G. = rockmass specific gravity (=3.5 for high grade ore; =3 for moderate grade ore; =2.7 for waste rock), and = orebody/foliation dip.
Sc = 3.3 × Q0.43
The method can be applied by comparing the scaled crown pillar span for any pillar of concern to the critical span value deemed to be appropriate for the controlling rock mass. When the scaled crown pillar span is determined to be less than the critical span, the crown pillar is considered stable. On the other hand, when Cs is greater than Sc, the probability of failure is higher. Because of its empirical basis, application of the scaled span method allows at least a rational assessment of failure likelihood if the method is applied probabilistically [43]. Assuming the index named “factor of safety” is as follows,
the instability of a crown pillar is likely to occur if F < 1.
F = Sc/Cs
Table 1 shows how the method can help in defining acceptable or allowable risk.

Table 1.
Crown pillar probability failure definition in long term (modified by [48]).
The empirical relationship between the probability of failure (Pf) and factor of safety (F) was defined by [49]. It is an error function relationship, given as follows:
Pf = 1 − erf [(2.9F − 1)/4]
As it is shown in Equation (6), the probability of failure is clearly dependent on both the geometry of the cave and the quality of the rock.
4.3. Seismic Data Acquisition and Analysis
To preliminarily investigate the dynamic behavior of the arch, we carried out ambient noise vibration measurements (Figure 6) with the main goal of investigating and retrieving the resonance frequency of the geological structure.
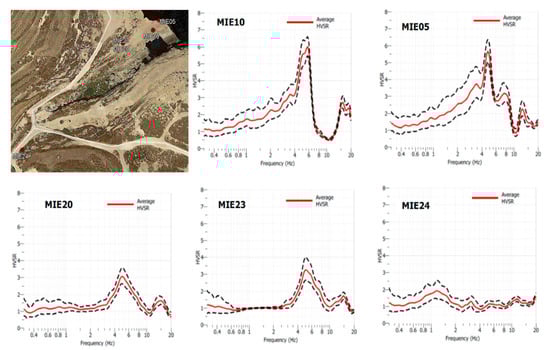
Figure 6.
Location of the HVSR measurements and related spectral functions.
In particular, we used the horizontal-to-vertical spectral ratio (HVSR) technique [50,51]. The instrument used to measure these vibrations was the compact and lightweight 3-component seismograph, the Micromed Tromino. It can record the average noise level in the range of frequency 0.1–200 Hz. Time series of ambient noise, having a length of 20 min, were recorded with a sampling rate of 128 Hz, and, following the guidelines suggested by the SESAME project [52], they were divided into windows of 20 s not overlapping each other. A 5% cosine taper was applied to each window, and the Fourier spectra were calculated. The spectra of each window were smoothed, using a Konno–Ohmachi window [53], fixing the parameter b to 40. Finally, the resulting HVSR, in the frequency range 0.5–40.0 Hz, was computed by estimating the logarithmic average of the spectral ratio obtained for each time window, selecting only the most stationary and excluding transients associated to very close sources.
Multi-station (array) measurements of ambient vibrations were also used to study the surface wave dispersion properties of the outcropping lithology in order to retrieve the characteristic shear wave velocity. An “L-shaped” array configuration was used for the ambient vibration measurements, where we recorded 40 min of ambient noise, using a 25-multichannel seismograph equipped with 4.5 Hz vertical geophones. The final configuration was composed of two branches with lengths of 80 m and 40 m, respectively. Time windows of 20 s were considered to calculate, with frequency–wave number (f–k) analysis [54], dispersion curves of the fundamental mode and the average of the dispersion curves.
4.4. 3D Model Reconstruction
Nowadays, fully automated methodologies, such as UAV images [55], can process large image datasets and deliver 3D models with a good quality of detail and variable precision according to specific applications.
In this study, the images were collected using an unmanned aerial vehicle (UAV) Phantom 4 Pro equipped with a 3-axis stabilization system for the professional camera integrated with a 1” Exmor R CMOS image sensor [49] and a resolution of 20 megapixels. About 1000 images were acquired in 2 different flights, one of which was in autonomous mode with a camera oriented in the nadiral direction with an angle of 90°, an 80% forward overlap and a 70% side overlap. The manual flight mode was made necessary by the difficult operating conditions dictated by the morphology of the area, which forced us to fly a few meters from the cliff with poor, and at times absent, GPS signal and with the complication of gusts of wind channeled by the arch.
The methodology used to build the three-dimensional model of the Wied il-Mielah arch is the structure from motion (SfM) digital photogrammetry [56], which is a technique which utilizes computer vision (CV) algorithms to transform a series of two-dimensional images into the three-dimensional structure of a scene or object. To take measurements from the 3D model, we measured some points on the ground with a 3D laser distometer, and then we inserted them as markers in the photogrammetric model to scale it.
The processing procedure [57,58] applied is composed of four main steps: the first phase is to generate a sparse point cloud through the alignment of the camera. It serves to correctly position the images, verify the overlapping among photos and to assure they are properly geolocated in order to retrieve the exact camera position in real space. During the second step a dense point cloud is built, and further processing is done on the point to eliminate points that could degrade the quality of the final model. The third step is the reconstruction of a 3D polygonal mesh representing the object surface based on the dense point cloud. Finally, during the fourth step, the model is textured, and the final 3D model is obtained.
5. Results and Discussion
5.1. Ground Penetrating Radar Data Acquisition and Analysis
The radar profiles carried out in the surveyed area show several hyperbolic reflections (yellow dashed circle) (Figure 7a,b), that allow for an accurate velocity analysis. The application of this method points out an average velocity of 0.12 m/ns (Table 2).
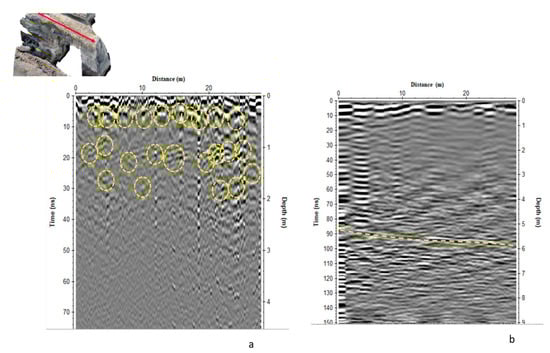
Figure 7.
The processed radar sections: (a) 600 MHz antenna; (b) 200 MHz antenna. The yellow circles indicate the scattering zones of the radargram, i.e., the fracturing zones.
Table 2.
The electromagnetic wave velocity of propagation obtained by direct measurement of the rock thickness and two-way time.
Within the great quantity of reflections, it is possible to note the main one, that is sub horizontal and located at the time depth of 90 ns–95 ns (about 5.5 m–5.7 m). This reflection (yellow dashed line in Figure 7b) is assumed to be produced by the bottom of the window.
The value of the average velocity of propagation of the electromagnetic waves was also confirmed by the direct measurement given by the knowledge of the rock thickness of the window. In fact, the rock thickness ranges from about 5.5 m to 6.0 m (Figure 2 and Figure 8).
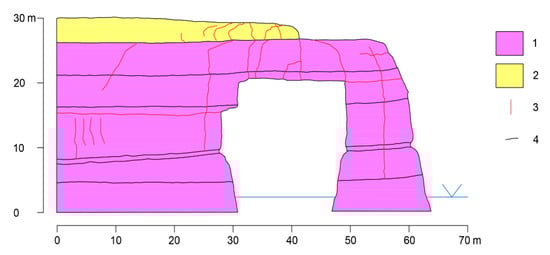
Figure 8.
Scheme of the main joint net surveyed by direct observation. Legend: 1—Lower Coralline Limestone; 2—Globigerina Limestone; 3—open joint; 4—sedimentary discontinuity.
Figure 7b refers to the data at 200 MHz. Regarding the data achieved at a central frequency of 600 MHz, on the other hand, the relatively short time scale, related in its turn to the lower penetration capabilities of the signal (Figure 7a), prevents us from identifying the bottom of the window. To put into evidence the fractures in the rock in a better way, radar profiles must be processed [55]. The processing steps were the following:
- -
- Background removal filter: the average trace was subtracted to remove the background contribution;
- -
- Kirchhoff migration, performed (as customarily) to concentrate the diffracted energy into bright spots;
- -
- Merging of the data at 200 and 600 MHz, in order to obtain a good compromise between resolution and depth (Figure 9).
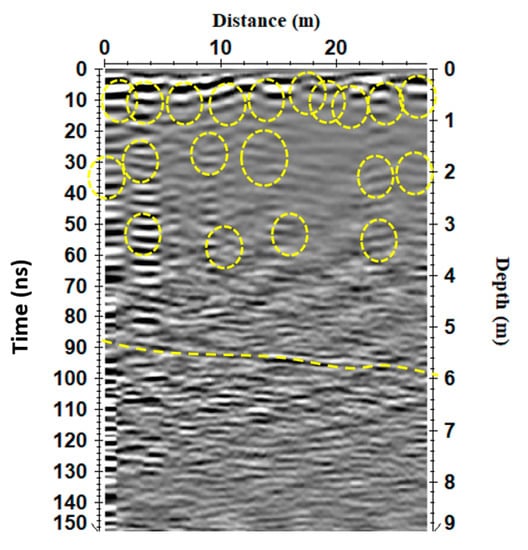 Figure 9. The merged 200–600 MHz processed radar sections (fractures are evidenced by yellow dashed circles and the yellow dashed line evidence the end of the arch).
In order to better put into evidence the backscattered EM energy, and in particular the diffracted arrivals, a Hilbert transform was also performed (Figure 10).
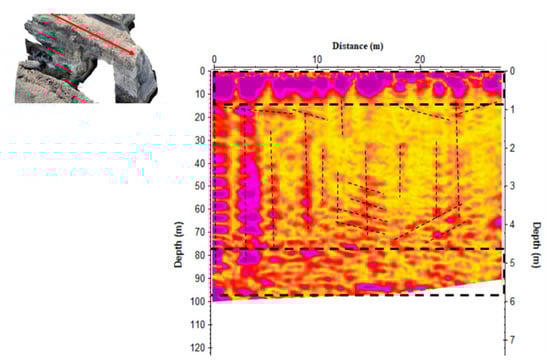
Figure 10.
The processed radar section with Hilbert transform (yellow is low EM amplitude; red is high EM amplitude).
In the areas where radar energy is diffracted, the fractures are characterized by the presence of small discontinuities, representing karstic voids or recrystallized zones. Therefore, the zones with high back-scattered EM energy (dashed dark lines) are related to more fractured carbonatic rock (Figure 10). Furthermore, the processed radar profile (Figure 9) shows that most fractures have vertical alignment, while the other ones have almost horizontal alignment, slightly tilted. The area inside the dashed rectangle has a high number of fractures.
We built time slices averaging the amplitude (or the square amplitude) of the radar signal within consecutive time windows of width Δt [59,60]. Sometimes, a particular complex trace attribute, the instantaneous amplitude or envelope (modulus of the Hilbert transform), was used instead. Being a measure for the reflectivity strength, it helps to show high amplitude anomalies.
Previous spatial averaging was also applied in order to reduce small-scale heterogeneity noise. Finally, data were interpolated and gridded on a regular mesh [60]. In the present work, the time slice technique was used to display the amplitude variations within consecutive time windows of width Δt = 5 ns. The selected two-way time interval corresponds to a soil layer approximately 0.30 m thick, and the time slices are located between 0 m and 6.0 m in depth. The slices shown in Figure 11 were obtained using the processed data. Several events are visible as high amplitude anomalies (red anomalies) that could be interpreted as the fractured areas.
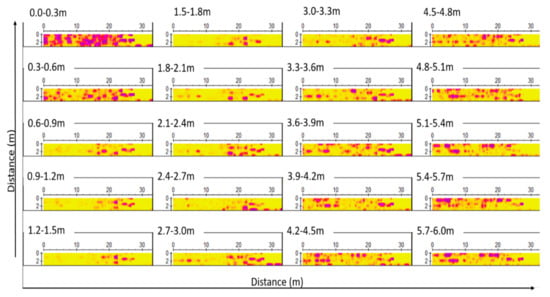
Figure 11.
The time slices (yellow is low EM amplitude; red is high EM amplitude). The orientation is the same as that in Figure 10.
A 3D visualization of the data was achieved as follows [59]:
- -
- Extraction of a particular complex signal attribute (trace envelope): the grid data are converted to the reflection strength or amplitude envelope by a Hilbert transformation.
- -
- Thresholding: a threshold value must be entered. Hence all amplitudes greater/equal than this value are considered, whereas the lower ones are put equal to zero.
- -
- Three-dimensional contouring by means of an iso-amplitude surface.
In Figure 12, the same data set is displayed with iso-amplitude surfaces, using a threshold value of 50% of the maximum complex trace amplitude.
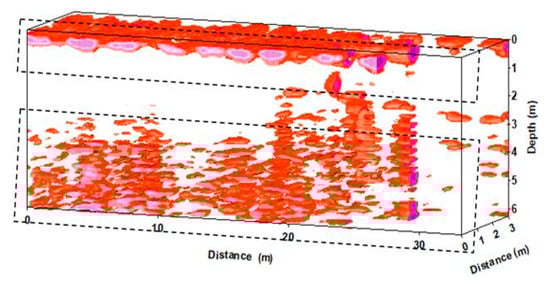
Figure 12.
The block diagram shows the 3D iso-amplitude surfaces.
Obviously, lowering the threshold value increases the visibility of the main anomaly and smaller objects, but it increases heterogeneity noise as well.
A relatively strong continuous reflection is visible on the threshold volumes (dark dashed rectangle). This visualization technique puts better into evidence the anomaly related to the fractured areas related to the rock that constitutes the roof of the window.
5.2. Seismic Data Results
Our results show that measurements taken outside the arch and directly on rock have, as expected, a flat HVSR curve, implying no potential amplification at the site. However, the HVSR measurements taken on the arch show that this geological structure vibrates with its own natural frequency. HVSR curves taken on the arch also show a dip below one that can be attributed to the free vibrations of the beam.
Results show that for the Globigerina formation, shear-wave velocities range between 900 m/s and 1050 m/s. Such values are typical for this type of rock, and the results are consistent with other measurements taken on similar outcrops in other parts of the Maltese archipelago [47,61]. For the Lower Coralline Formation (LCL), the Rayleigh wave velocities observed in the dispersion curve are relatively high, which indicates a range for the shear-wave velocity of the LCL layer of 1600–1800 m/s [32].
5.3. Stability Analysis
An estimate of Q is about 462.38. This is calculated using the following relationship [62]:
Vs = (140.7 · Log10 · Q) + 1425
In this case, Vs = 1800 m/s, and therefore, Q = 10(1800−1425/140.7) = 102.665 = 462.38.
Using relationship (3), it is possible to estimate the Sc parameter. Its value is 46.18. The next step is the study of the stability of the roof, using the empirical analysis illustrated above.
In the case of the model proposed by [41], the crown pillar thickness (T) is considered constant. In the studied case, the mean thickness is about 5 m. Assuming S.G. = 2.7 (waste rock), θ = 0 (i.e., the inclination of the window with respect to the horizontal plane is zero degrees). The values of S and L are S = 16.36 m, and L = 20 m.
Considering these values, it is possible to calculate the Cs parameter. Its value is 12.72. Using relationship (5), it is possible to calculate the safety factor F. Its value is equal to 3.63, giving a probability of failure of 0.5–1.5%. Therefore, the probability of crown pillar collapse falls within class F (Table 1).
6. Conclusions
The integration of several geo-scientific prospecting techniques [63,64,65] plays a strategic role in the resolution of many questions related to the conservation and protection of cultural and environmental heritage. Monumental morphologies, such as, for example, those of marine arches, could be key sites to better bring out the values expressed by geo-heritage, understood as another expression of natural heritage, and places to concentrate geotourism activities and proposals. They could certainly act as a canvas to express geological complexity at different scales, thus involving the viewer not only from a scientific point of view, but also stimulating a sense of wonder that those morphologies induce. The case study of the Wied il-Mielaħ Window is certainly an emblematic example to be protected, which is why the multidisciplinary study helps to define the elements of vulnerability on which to act in order to guarantee the safety conditions of the tourist and extend, if possible, the life of these spectacular natural sites’ landforms.
Several methods of investigation used in the literature (electrical method, seismic method, the electromagnetic method, etc.), integrated synergistically with the observations and results of various disciplines, such as geology, geomorphology, physics, engineering, allow to obtain a range of information about the site being studied.
Considering this premise, in this paper, different integrated methodologies were applied for the study of the stability conditions of the Wied il-Mielaħ Window marine arch and for its future conservation. Geophysical data were used as the start point in the application of the empirical analysis imported by mining engineering: the “scaled span” method.
The combined use of GPR, seismic, geomorphology, and 3D model reconstruction allowed to obtain the important parameters related to the arch and the rock quality (Figure 13). The empirical analysis proposed by [41] was adapted to the particular geometry related to the window.
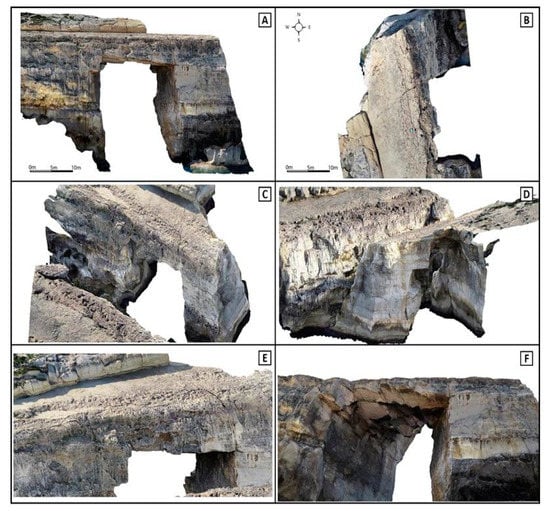
Figure 13.
Orthophotos with scale bar of East side (A) and top side (B) of the Wied il-Mielah arch (Gozo). Screenshots of the 3D model taken from north-east and (C), north-west (D), and details of the arch (E) and (F) reconstructed with drone’s images.
The model indicates instability when the coefficient Cs is larger than critical s Sc evaluated, according to the terms described in the paper. From the values of the ratio Sc/Cs, equivalent to the safety factor F, it is possible to conclude that F is equal to 3.75, and therefore, conditions of stability of the rock formation prevail, corresponding to class F in Table 1.
In this case, it is possible to affirm that the probability of rock failure is in the range between 0.5% and 1.5%. According to Table 1, rock failure could occur in about 50–100 years. However, it is also to be outlined that the stability analysis was carried out in static conditions, so it is plausible to consider that, depending on the erosive action exerted by wave action and by potential stresses due to seismic events, the value of the safety factor could change over time, affecting the life of the marine arch.
Author Contributions
Conceptualization, R.P., S.D. and M.L.; methodology, G.L., S.D., M.L. and L.D.G.; software, G.L., R.P., L.D.G., E.C., L.G., S.M. and R.I.; validation, G.L., S.D. and M.L.; geomorphological field survey M.L.; investigation, G.L., R.P., L.D.G., M.L., E.C., S.M., L.G. and R.I.; resources, R.P. and S.D.; data curation, G.L., R.P., E.C., L.D.G., S.D. and M.L.; writing—original draft preparation, G.L., R.P., M.L. and S.D.; writing—review and editing, G.L., R.P., M.L. and S.D.; visualization, G.L., R.P., E.C., L.D.G., S.D. and M.L.; supervision, R.P., S.D. and G.L.; project administration, R.P., S.D.; funding acquisition, R.P. and S.D. All authors have read and agreed to the published version of the manuscript.
Funding
Bilateral Italy-Malta Project “Noninvasive investigations for enhancing the knowledge and the valorization of the cultural heritage”, funded by the National research Council CNR and by the University of Malta. This study was partially supported by the project “NEWS-Nearshore hazard monitoring and Early Warning System” (code C1-3.2-60) part-financed by the European Union under the Italia-Malta Cross-Border Cooperation Programmes, 2014–2020. Part of this study was also supported by the project “Rock failures in cliff slopes: from back- to forward-analysis of processes through monitoring and multi-modelling approaches” (Sapienza University of Rome-Year 2016, P.I. Prof. S. Martino).
Institutional Review Board Statement
Not applicable.
Informed Consent Statement
Not applicable.
Data Availability Statement
Not applicable.
Acknowledgments
The authors thank Pauline Galea (University of Malta) for the critical reading of the manuscript and for her helpful suggestions. The authors also wish to thank Antonella Paciello (ENEA, C.R. Casaccia) and Marisa Regina (at Sapienza Università di Roma) for their useful contribution to the seismic ambient noise measurements and field geomechanical surveys.
Conflicts of Interest
The authors declare no conflict of interest.
References
- Coratza, P.; Gauci, R.; Schembri, J.; Soldati, M.; Tonelli, C. Bridging natural and cultural values of sites with outstanding scenery: Evidence from Gozo, Maltese Islands. Geoheritage 2016, 8, 91–103. [Google Scholar] [CrossRef]
- Galea, P.; Bozionelos, G.; D’Amico, S.; Drago, A.; Colica, E. Seismic Signature of the Azure Window Collapse, Gozo, Central Mediterranean. Seismol. Res. Lett. 2018, 89, 1108–1117. [Google Scholar] [CrossRef]
- Leucci, G.; De Giorgi, L. Integrated geophysical surveys to assess the structural conditions of a karstic cave of archaeological importance. Nat. Hazards Earth Syst. Sci. 2005, 5, 17–22. [Google Scholar] [CrossRef] [Green Version]
- Budetta, P.; De Luca, C.; Simonelli, M.G.; Guarracino, F. Geological analysis and stability assessment of a sea arch in Palinuro, southern Italy. Eng. Geol. 2019, 250, 142–154. [Google Scholar] [CrossRef]
- Quesada-Román, A.; Pérez-Briceño, P.M. Geomorphology of the Caribbean coast of Costa Rica. J. Maps 2019, 15, 363–371. [Google Scholar] [CrossRef]
- Sánchez, M.A.; Foyo, A.; Tomillo, C.; Iriarte, E. Geological risk assessment of the area surrounding Altamira Cave: A proposed Natural Risk Index and Safety Factor for protection of prehistoric caves. Eng. Geol. 2007, 94, 180–200. [Google Scholar] [CrossRef]
- Veni, G. A geomorphological strategy for conducting environmental impact assessments in karst areas. Geomorphology 1999, 31, 151–180. [Google Scholar] [CrossRef]
- Lin, Z.; Hatherly, P.; Vozoff, K.; Engels, O.G.; Smith, G.H. Joint application of seismic and electromagnetic methods to coal characterisation at west cliff colliery, New South Wales. Explor. Geophys. 1996, 27, 205–215. [Google Scholar] [CrossRef]
- Dobroka, M.; Gyulai, A.; Ormos, T.; Csokas, J.; Dresen, L. Join inversion algorithm of seismic and geoelectric data recorded in an underground coal mine. Geophys. Prospect. 1991, 39, 643–666. [Google Scholar] [CrossRef]
- Heikkinen, E.J.; Saksa, P.J. Integrating geophysical data into bedrock model in site characterization for nuclear waste disposal; Expanded Abstracts. In Proceedings of the 60th EAGE Conference and Exhibition, Leipzig, Germany, 8–12 June 1998; Volume I. Session 4–49. [Google Scholar]
- Santarato, G.; Nasser, A.; Chiara, P. Prospezioni geofisiche in area urbana. Geol. Tec. Ambiente 1998, 4/98, 43–52. [Google Scholar]
- Cardarelli, E.; Marrone, C.; Orlando, L. Evaluation of tunnel stability using integrated geophysical methods. J. Appl. Geophys. 2003, 52, 93–102. [Google Scholar] [CrossRef]
- Marsico, A.; Sabato, L.; Spalluto, L.; Infante, M.; Nitti, A. Integrated Geological and Digital Surveys to Know, Preserve and Promote a Geoheritage: The Sea Cliff of Vignanotica Bay (Gargano Promontory, Southern Italy). Geoheritage 2016, 8, 371–380. [Google Scholar] [CrossRef]
- Mercerat, E.D.; Payeur, J.B.; Bertrand, E.; Malascrabes, M.; Pernoud, M.; Chamberland, Y. Deciphering the dynamics of a heterogeneous sea cliff using ambient vibrations: Case study of the Sutta-Rocca overhang (southern Corsica, France). Geophys. J. Int. 2021, 224, 813–824. [Google Scholar] [CrossRef]
- Spilotro, G.; Pellicani, R.; Miccoli, D.; Canora, F. Analysis of interaction between waves and cliff along the adriatic coast of polignano (Apulia, Italy). In Engineering Geology for Society and Territory; Lollino, G., Manconi, A., Guzzetti, F., Culshaw, M., Bobrowsky, P., Luino, F., Eds.; Springer: Cham, Switzerland, 2015; Volume 5. [Google Scholar] [CrossRef] [Green Version]
- Pellicani, R.; Argentiero, I.; Spilotro, G. A preliminary method for assessing sea cliff instability hazard: Study cases along apulian coastline. In Computational Science and Its Applications—ICCSA 2018; Lecture Notes in Computer Science; Gervasi, O., Murgante, B., Misra, S., Stankova, E., Torre, C.M., Rocha, A.M.A.C., Taniar, D., Apduhan, B.O., Tarantino, E., Ryu, Y., Eds.; Springer: Berlin/Heidelberg, Germany, 2018; Volume 10961. [Google Scholar] [CrossRef]
- Leucci, G.; De Giorgi, L. Microgravimetric and ground penetrating radar geophysical methods to map the shallow karstic cavities network in a coastal area (Marina di Capilungo, Lecce—Italy). Explor. Geophys. 2010, 41, 178–188. [Google Scholar] [CrossRef]
- Crampin, S.; McGonigle, R.; Bamford, D. Estimatine crack parameters from observation of P-wave velocity anisotropy. Geophysics 1980, 45, 361–375. [Google Scholar] [CrossRef]
- Boadu, F.K. Fractured rock mass characterization parameters and seismic properties: Analytical studies. J. Appl. Geophys. 1997, 36, 1–19. [Google Scholar] [CrossRef]
- Kahraman, S. The effects of fracture roughness on P-wave velocity. Eng. Geol. 2002, 63, 347–350. [Google Scholar] [CrossRef]
- Pedley, H.M.; House, M.R.; Waugh, B. The geology of Malta and Gozo. Proc. Geol. Assoc. 1976, 87, 325–341. [Google Scholar] [CrossRef]
- Baldassini, N.; Mazzei, R.; Foresi, L.M.; Riforgiato, F.; Salvatorini, G. Calcareous plankton biochronostartigraphy of the Maltese Lower Globigerina Limestone member. Acta Geol. Pol. 2013, 63, 105–135. [Google Scholar]
- Giannelli, L.; Salvatorini, G. I Foraminiferi planctonici dei sedimenti terziari dell’Arcipelago Maltese. Biostratigrafia del ‘Globigerina Limestone’. I. Atti della Società Toscana di Scienze Naturali. Mem. Ser. A 1972, 79, 49–74. [Google Scholar]
- Hunt, C.O.; Schembri, P.J. Quaternary environments and biogeography of the Maltese Islands. In Facets of Maltese Prehistory; Malta: The Prehistoric Society of Malta; Mifsud, A., Ventura, C.S., Eds.; Proprint: Mosta, Malta, 1999; pp. 41–75. [Google Scholar]
- Pedley, H.M. A New Lithostratigraphical and Mineral Resources Palaeoenvironmental Interpretation for the Coralline Limestone Formations (Miocene) of the Maltese Islands; Her Majesty’s Stationery Office: London, UK, 1978. [Google Scholar]
- House, M.R.; Dunham, K.C.; Wigglesworth, J.C. Geology and structure of the Maltese Islands. In Malta: A Background for Development; Jones, H.B., Dewdney, J., Fisher, W.B., Eds.; Durham University Press: Durham, UK, 1961; pp. 25–47. [Google Scholar]
- Oil Exploration Directorate. Geological Map of the Maltese Islands; Office of the Prime Minister: Valletta, Malta, 1993.
- Pedley, M.; Hughes Clarke, M.; Galea, P. Limestone Isles in a Crystal Sea: The Geology of the Maltese Islands; Publishers Enterprises Group: San Gwann, Malta, 2002. [Google Scholar]
- Micallef, A.; Foglini, F.; Le Bas, T.; Angeletti, L.; Maselli, V.; Pasuto, A.; Taviani, M. The submerged paleolandscape of the Maltese Islands: Morphology, evolution and relation to Quaternary environmental change. Mar. Geol. 2013, 335, 129–147. [Google Scholar] [CrossRef]
- Persico, R. Introduction to Ground Penetrating Radar: Inverse Scattering and Data Processing; Wiley&Sons: Hoboken, NJ, USA, 2014. [Google Scholar]
- Conyers, L.B.; Goodman, D. Ground-Penetrating Radar: An Introduction for Archaeologists; AltaMira: Walnut Creek, CA, USA, 1997. [Google Scholar]
- Leucci, G.; Masini, N.; Persico, R.; Soldovieri, F. GPR and Sonic Tomography for Structural Restoration: The Case of the Cathedral of Tricarico. J. Geophys. Eng. 2011, 8, 76–92. [Google Scholar] [CrossRef]
- Leucci, G. Nondestructive Testing for Archaeology and Cultural Heritage: A Practical Guide and New Perspective; Springer: Berlin/Heidelberg, Germany, 2019; p. 217. [Google Scholar]
- Leucci, G. Advances in Geophysical Methods Applied to Forensic Investigations: New Developments in Acquisition and Data Analysis Methodologies; Springer: Berlin/Heidelberg, Germany, 2020; p. 200. [Google Scholar]
- Grandjean, G.; Gourry, J.C. GPR data processing for 3D fracture mapping in a marble quarry (Thassos, Greece). J. Appl. Geophys. 1996, 36, 19–30. [Google Scholar] [CrossRef]
- Mertens, L.; Persico, R.; Matera, L.; Lambot, L. Smart automated detection of reflection hyperbolas in complex GPR images with No a Priori Knowledge on the Medium. IEEE Trans. Geosci. Remote Sens. 2016, 54, 580–596. [Google Scholar] [CrossRef]
- Persico, R.; Leucci, G.; Matera, L.; De Giorgi, L.; Soldovieri, F.; Cataldo, A.; Cannazza, G.; De Benedetto, E. Effect of the height of the observation line on the diffraction curve in GPR prospecting. Near Surf. Geophys. 2015, 13, 243–252. [Google Scholar] [CrossRef]
- Lazzari, M.; De Giorgi, L.; Ceraudo, G.; Persico, R. Geoprospecting survey in the archaeological site of Aquinum (Lazio, central Italy). Surv. Geophys. 2018, 39, 1167–1180. [Google Scholar] [CrossRef]
- De Giorgi, L.; Lazzari, M.; Leucci, G.; Persico, R. Geomorphological and non-destructive GPR survey for the conservation of frescos in the rupestrian churches of Matera (Basilicata, southern Italy). Archaeol. Prospect. 2020, 1–9. [Google Scholar] [CrossRef]
- Leucci, G.; De Giorgi, L. Experimental studies on the effects of fracture on the P and S wave velocity propagation in sedimentary rock (“Calcarenite del Salento”). Eng. Geol. 2006, 84, 130–142. [Google Scholar] [CrossRef]
- Hutchinson, D.J.; Phillips, C.; Cascante, G. Risk considerations for crown pillar stability assessment for mine closure planning. Geotech. Geol. Eng. 2002, 20, 41–64. [Google Scholar] [CrossRef]
- Barton, N. Some new Q-value correlations to assist in site characterisation and tunnel design. Int. J. Rock Mech. Min. Sci. 2002, 39, 185–216. [Google Scholar] [CrossRef]
- Carter, T.G. A new approach to surface crown pillar design. In Proceedings of the 16th Canadian Rock Mechanics Symposium, Sudbury, ON, Canada, 15–19 June 1992; pp. 75–84. [Google Scholar]
- Barton, N.; Lien, R.; Lunde, J. Engineering classification of rockmasses for the design of tunnel support. Rock Mech. 1974, 6, 189–236. [Google Scholar] [CrossRef]
- Gennarelli, G.; Catapano, I.; Soldovieri, F.; Persico, R. On the Achievable Imaging Performance in Full 3-D Linear Inverse Scattering. IEEE Trans. Antennas Propag. 2015, 63, 1150–1155. [Google Scholar] [CrossRef]
- Gabellone, F.; Leucci, G.; Masini, N.; Persico, R.; Quarta, G.; Grasso, F. Nondestructive Prospecting and virtual reconstruction of the chapel of the Holy Spirit in Lecce, Italy. Near Surf. Geophys. 2013, 11, 231–238. [Google Scholar] [CrossRef]
- Farrugia, D.; Paolucci, E.; D’Amico, S.; Galea, P. Inversion of surface-wave data for subsurface shear-wave velocity profiles characterised by a thick buried low-velocity layer. Geophys. J. Int. 2016, 206, 1221–1231. [Google Scholar] [CrossRef] [Green Version]
- Carter, T.G.; Miller, R.I. Crown pillar risk assessment planning aid for cost-effective mine closure remediation. Trans. Inst. Min. Metall. 1995, 104, A41–A57. [Google Scholar]
- El Gamal, A.; Eltoukhy, H. CMOS image sensors. Engineering. IEEE Circuits Devices Mag. 2005, 21, 6–20. [Google Scholar] [CrossRef]
- Iannucci, R.; Martino, S.; Paciello, A.; D’Amico, S.; Galea, P. Engineering geological zonation of a complex landslide system through seismic ambient noise measurements at the Selmun Promontory (Malta). Geophys. J. Int. 2018, 213, 1146–1161. [Google Scholar] [CrossRef]
- Iannucci, R.; Martino, S.; Paciello, A.; D’Amico, S.; Galea, P. Investigation of cliff instability at Għajn Ħadid Tower (Selmun Promontory, Malta) by integrated passive seismic techniques. J. Seismol. 2020, 24, 897–916. [Google Scholar] [CrossRef]
- Acerra, C.; Havenith, H.B.; Zacharopoulos, S. Guidelines for the Implementation of the H/V Spectral Ratio Technique on Ambient Vibrations Measurements, Processing and Interpretation; (No. European Commission–EVG1-CT-2000-00026 SESAME); European Commission: Brussels, Belgium, 2004. [Google Scholar]
- Konno, K.; Ohmachi, T. Ground-motion characteristics estimated from spectral ratio between horizontal and vertical components of microtremor. Bull. Seism. Soc. Am. 1998, 88, 228–241. [Google Scholar] [CrossRef]
- Capon, J. High-Resolution Frequency-Wavenumber Spectrum Analysis. Proc. IEEE 1969, 57, 1408–1418. [Google Scholar] [CrossRef] [Green Version]
- Granados-Bolaños, S.; Quesada-Román, A.; Alvarado, G.E. Low-cost UAV applications in dynamic tropical volcanic landforms. J. Volcanol. Geotherm. Res. 2021, 410, 107143. [Google Scholar] [CrossRef]
- Westoby, M.J.; Brasington, J.; Glasser, N.F.; Hambrey, M.J.; Reynolds, J.M. Structure-from-Motion’photogrammetry: A low-cost, effective tool for geoscience applications. Geomorphology 2012, 179, 300–314. [Google Scholar] [CrossRef] [Green Version]
- Buyer, A.; Aichinger, S.; Schubert, W. Applying photogrammetry and semi-automated joint mapping for rock mass characterization. Eng. Geol. 2020, 264, 105332. [Google Scholar] [CrossRef]
- Li, X.; Chen, Z.; Chen, J.; Zhu, H. Automatic characterization of rock mass discontinuities using 3D point clouds. Eng. Geol. 2019, 259, 105131. [Google Scholar] [CrossRef]
- Sandmeier, K.J. Reflexw 7.0 Manual, Sandmeier Software; Karlsruhe, Germany, 2018; Available online: https://www.sandmeier-geo.de/Download/reflexw_manual_a4.pdf (accessed on 7 June 2021).
- Conyers, L.B.; Goodman, D. Ground Penetrating Radar: An Introduction for Archaeologist; Alta Mira Press: Lanham, MD, USA, 1997. [Google Scholar]
- Panzera, F.; D’Amico, S.; Galea, P.; Lombardo, G.; Gallipoli, R.; Pace, S. Geophysical measurements for site response investigation: Preliminary results on the island of Malta. Boll. Geo. Teo. Appl. 2013, 52, 111–128. [Google Scholar] [CrossRef]
- Leucci, G. I Metodi Elettromagnetico Impulsivo, Elettrico e Sismico Tomografico a Rifrazione per lo Studio di Problematiche Ambientali: Sviluppi Metodologici e Applicazioni. Ph.D. Thesis, University of Messina, Messina, Italy, 2004. [Google Scholar]
- Colica, E.; D’Amico, S.; Iannucci, R.; Martino, S.; Gauci, A.; Galone, L.; Galea, P.; Paciello, A. Using unmanned aerial vehicle photogrammetry for digital geological surveys: Case study of Selmun promontory, northern of Malta. Environ. Earth Sci. 2021, 80, 551. [Google Scholar] [CrossRef]
- Randazzo, G.; Italiano, F.; Micallef, A.; Tomasello, A.; Cassetti, F.P.; Zammit, A.; D’Amico, S.; Saliba, O.; Cascio, M.; Cavallaro, F.; et al. WebGIS Implementation for Dynamic Mapping and Visualization of Coastal Geospatial Data: A Case Study of BESS Project. Appl. Sci. 2021, 11, 8233. [Google Scholar] [CrossRef]
- Lazzari, M.; Lazzari, S. Geological and Geomorphological Hazard in Historical and Archaeological Sites of the Mediterranean Area: Knowledge, Forecasting and Mitigation. Disaster Adv. 2012, 5, 63–71. [Google Scholar]
Publisher’s Note: MDPI stays neutral with regard to jurisdictional claims in published maps and institutional affiliations. |
© 2021 by the authors. Licensee MDPI, Basel, Switzerland. This article is an open access article distributed under the terms and conditions of the Creative Commons Attribution (CC BY) license (https://creativecommons.org/licenses/by/4.0/).