Abstract
Circular Economy (CE) practices and technologies are essential for increasing sustainability performance in manufacturing. Due to the increasing number of environmental regulations and growing public awareness of environmental issues, especially in the EU, CE is increasingly seen as a valuable factor in improving competitiveness. Therefore, there is a need for a fuller understanding of the ways in which CE technologies can be implemented into the manufacturing industries. The aim of this paper is to contribute to the identification of the characteristics of manufacturing companies and their perceptions of the barriers to the adoption of CE technologies. This survey-based study of 241 manufacturing companies (comprising a sub-sample of Slovak and Slovenian companies from the more extensive European Manufacturing Survey) uses a series of statistical tests to examine the implementation of three CE technologies. The results show that there is significant relationship between the adoption of CE technologies in manufacturing companies and their size, location, R&D activities, company age and product batch size. Finally, the research reveals the surprising finding that there is no apparent link between the perception of CE barriers and the plans of companies to implement selected CE technologies.
1. Introduction
The concept of Circular Economy (CE), a novel economic model which aims to foster sustainable economic growth, boost global competitiveness, and generate new jobs, is attracting growing interest across many sectors of the economy [1]. In the CE framework, technological improvements and innovation can be of considerable benefit in strengthening a company’s competitiveness [2]. As Stahel has noted [3], CE focuses on the optimization of utilization and exploits resource efficiency in addition to leveraging sufficiency and prevention options in order to gain financial advantages and achieve higher levels of competitiveness. However, in order to maintain competitiveness, the presence of barriers forces the implementation of circularity to be gradual and combine both linear and circular models [4]. Moreover, the need to address material flow complexities (such as demand variations or company appearance and disappearance) and dependencies (decisions taken both now and in the future) limits the availability of practical options for optimizing material cycles in the economy [5].
As governing bodies across the globe place a greater emphasis on the implementation of CE practices, there is a growing awareness among companies of the importance of the concept [6]. In the EU context, the transition to CE lies at the core of EU taxonomy for sustainable activities intended to ensure that the objectives of the European green deal can be achieved [7], a program which will shape the future of industries and the competitiveness of specific companies. Gupta et al. [8] suggests that CE practices are crucial for increasing sustainability performance in manufacturing. Furthermore, in their CE framework Lieder and Rashid [9] suggest that a simultaneous focus on perspectives from the macro, meso and micro levels will ensure the concurrent and equivalent visibility of the limitations of natural resources, environmental concerns and individual business needs. Finally, as Bjørnbet et al. [10] have concluded, the field has now moved from the purely conceptual field into empirical studies and research.
A number of studies have been published which have conceptualized and framed the CE concept usually based on existing literature (e.g., Friant et al. [11]), although there is a lack of empirical knowledge on how well companies understand the CE concept. As Friant et al. [11]) stated, the actual definition, objectives and forms of implementation of CE still remain unclear, inconsistent and contested. With the exception of the widely investigated issue of energy efficiency, obviously reflecting energy consumption, investment/costs, or technical/technological issues, it is still unclear how well companies understand energy efficiency activities within the CE concept. This is also evidence for factors affecting the adoption of sustainable process technology. According to Vacchi et al. [12] sustainability in manufacturing companies is linked together and enabled by technology. The authors [12] also claim that the concepts of sustainability and technology are mainly associated together with the meaning of the sustainability of technologies.
Fu et al. [13] prepared a detailed literature review of scientific papers that deal with sustainable technologies (ST) in which they conclude that the results of the research are scattered across different disciplines, making knowledge on ST adoption and influencing factors both fragmented and rather scarce.
Water and energy recycling in industry has been studied from multiple views (from withdrawal proportions to specific technological aspects), but despite its inclusion in the CE context for manufacturing companies (e.g., Vimal et al. [14]), and some recent studies (e.g., Fu et al. [13]) there is no clear understanding of whether and why companies with different characteristics (e.g., size, production/product characteristics, R&D activities) implement these technologies in different patterns. The same applies to the implementation of remanufacturing, one of the best-known CE activities, which is currently enjoying worldwide growth (e.g., [15]). There is widespread awareness of the obvious advantages of this process in terms of conservation of energy and materials (e.g., Reddy et al. [16].) but, once again, there is a lack of knowledge about the sectoral (or other company characteristics) distribution of this potential technology. Finally, a number of studies have also defined and categorized CE barriers, but only few of them have also evaluated the degree of perception (e.g., Rizos et al. [17]); to the best of our knowledge, no study to date has attempted to connect the perception of these barriers with future plans of companies to implement CE technologies.
Based on the identified research gaps, we believe that a detailed analysis of the ways in which companies adopt CE technologies could be crucial in developing effective policy suggestions, and it is also imperative for manufacturing companies to understand the implementation trends in their industry to ensure that they can take appropriate steps in the future. This paper examines several factors which are of relevance to the adoption of CE technologies in manufacturing companies, as expressed by the research questions:
- What characteristics of manufacturing companies (their product/production) can determine how CE technologies are implemented?
- What barriers to CE are most responsible for impeding the planned implementation of CE technologies in manufacturing companies?
The paper is structured as follows. The first chapter offers an overview of ST relating to the CE concept (also termed as CE technologies). The methodology section describes the development of the hypotheses, the research concept and methods, and the data which will be analyzed. A series of statistical tests will be performed on data from European Manufacturing Survey 2018, more specifically the country sub-samples for Slovenia and Slovakia. In the results section, the characteristics of the companies, products or production methods which have a significant relationship to implementation of CE technologies are presented, with particular attention being paid to the impact of the perception of the CE barriers on the planned implementation of CE technologies. The final section offers a discussion and summary of the findings.
2. Theoretical Background
2.1. Technology Improvements and CE
Although the concept of CE has a broad scope, it remains closely linked to the waste and/or resource management sector [18]. Resource efficiency essentially means the creation of greater value using fewer natural resources, and the transition to CE can thus contribute towards the drive for sustainable economic growth [19].
A key element of reducing the consumption of resources and limiting pollution from industrial activities is the adoption of environmentally sound technologies (EST) (also called ST). They are defined as both cleaner process techniques and technologies (CTs) and pollution abatement technologies (PATs) [20]. Technological environmental innovations (EI) have emerged as a further crucial element, focusing particularly on increasing resource productivity and enjoying wider popularity as a heuristic for the transition to CE [21]. Nonetheless, companies are often unable or unwilling to invest into improvements in resource efficiency, even when are projected to be profitable [19].
The classification of these ST in a study by Fu et al. [13] has identified energy, water, and material efficiency technologies as among the main generic technologies. This paper will also investigate technologies closely related to these generic categories, more specifically “energy recovery”, “water recycling/reuse” and “remanufacturing” and offer a more detailed discussion of these processes within the context of CE in the following sub-section. Since a separate investigation is focused on the relation between the perception of barriers to CE and the implementation of these technologies in manufacturing companies, Section 2.3 summarizes the typology of investigated barriers.
2.2. Generic ST Relevant to the CE Concept
The issue of energy efficiency and saving in industry has been investigated from a variety of perspectives. Energy studies which focus on industry (e.g., [22,23,24]) usually use variables or data reflecting energy consumption, investment/costs, or technical/technological issues. Energy recovery is a widely accepted concept which refers to the idea of circularity in manufacturing. Since energy recovery is not a new concept, is not surprising that in some part of the world high levels of circularity have already been achieved with regards to energy recovery [25]. Despite this, the New Circular Strategies Scanner developed for the manufacturing context by Blomsma et al. [26] lists “energy recovery” as part of the so-called “restore, reduce & avoid strategy”, and adds “energy” as a relevant layer, thereby implying that a stronger emphasis on clean (renewable) energy sources and an overall reduction in energy consumption should be considered. Reduced energy consumption in product manufacturing leads to the improvement of circularity potential and gains in process efficiency [27]. More specifically, technologies such as, for example, heat recovery systems can significantly reduce, among others, energy consumption, emissions, and cost in manufacturing, while maintaining the quality of the final product [28].
Water is one of the most important raw materials which are used in industry, with water use by industry accounting for approximately 20% of global withdrawals (energy production is responsible for approximately 75%, manufacturing for 25% [29]). The volumes which are used can be either sector specific (with the chemical, steel/metallurgy and pulp/paper industries known to be predominant), country specific (for example, the total water use by manufacturing industry varied from 193 m3 per capita in the Netherlands (2018 data) to 4 m3 per capita in Cyprus (based on data from 2017) [30]) or related to other factors. Water can be materialized in the final product or may also feature in different stages of the production process. Water recycling and reuse can not only save fresh water but also reduce wastewater discharge and reduce the pressure on water treatment facilities, generating significant economic and environmental benefits [31]. Wastewater generated as a byproduct of production can also be treated, reclaimed, recycled and applied in manufacturing processes [32], and water recycling technologies have already been introduced into different industries including iron and steel making [33], the paper industry [34], and the food industry [31]. As Reh [34] has concluded, the recycling of used water in industry has considerable potential for growth and innovation. In the context of circularity, for example, a model for circularity assessment developed by Vimal et al. [14] lists water recycling within the closed-loop manufacturing circularity criteria.
The U.S. and the European Union account for the bulk of global remanufacturing activities and trade, but Brazil, India, and China are also developing their own remanufacturing industries in response to growing domestic demand [15]. More and more manufacturing companies are shifting their attention to CE due to the rising costs of input materials [35]. A focus on the design of circular products is part of the implementation of circular or closed-loop manufacturing approach, while the three post-use strategies of reuse, remanufacturing, and recycling are highly relevant in the effort to achieve loop closure [36]. Jawahir and Bradley [37] have envisioned a future in which all products reaching the end of their primary use are recovered, and either reused, remanufactured, or recycled over multiple generations. Processes such as repair, refurbishment and remanufacturing are intended to retain the value of the product throughout its life cycle [38]. As we can see, remanufacturing helps in harnessing environmental, economic, and social benefits by extending the life cycle of end-of-life and end-of-use items [39]. The approach conserves energy and materials and in particular conditions it can even substitute the manufacturing process entirely [16]. In closed-loop supply chains, remanufacturing can also have implications both for stock reduction and production stabilization [40]. Recently developed technologies such as additive manufacturing (AM) could also lead to more effective methods of remanufacturing [41].
2.3. ST and Company Characteristics
Fu et al. [13] summarized and classified several factors that impact ST adoption, among them also company and technology/production characteristics. Company size is the most frequent characteristic in recent studies, although no studies can be found which examine the recycling technologies group, and the conclusions of these studies differ regarding the effect of company size; positive [42,43], negative [44] and no significant effect relationships were identified in various studies [45,46].
Several studies on R&D activity and its impact on ST adoption show that R&D has a significant positive effect only on whether a firm adopts energy-saving technologies and invests in clean technology, not on investment in various types of ST [42,43,44,47]. Only two studies on financial capability, measured by the profitability, per capital income, and market share, were found, with both suggesting that financial capability does not have a significant effect on ST adoption [44,45].
2.4. Barriers (Challenges) to the Adoption of CE Concept
Over the last decade, research into the CE concept has also focused on the identification or systemization of the barriers which can prevent the full adoption of CE principles. The focus ranges from the regional or country (i.e., macro) level (e.g., [48,49,50,51]) through the industry (i.e., mezzo) level (e.g., [52,53,54,55,56]) to the company (i.e., micro) level (e.g., [17,57]). Barriers have been classified on the basis of systematic literature reviews (e.g., [17,55,58,59]) or identified by empirical research (e.g., [50,51,52,60]). Studies by de Jesus & Mendonça [58] and Kirchherr et al. [50] have categorized barriers into groups which cover regulatory/policy barriers, market/economic barriers, technical/technological barriers, and social/cultural/public participation barriers. Following the findings of these barrier studies and major groups, this study will investigate seven barriers: the market challenges associated with reused products, the high costs of technologies, the difficulty of forecasting benefits and the risks involved in redesigning business models for circularity (together comprising the market/economic group), legislation barriers (comprising the regulatory/policy group), the lack of appropriate technologies (comprising the technical/technological group) and finally, the lack of internal culture/strategic commitment (comprising the social/cultural group).
3. Materials and Methods
The main scope of the research is focused on the relationship between the implementation of CE technologies and the company/product/production characteristics of a company.
A Hypothesis (H1) was developed in order to investigate this relationship (Figure 1). It is hypothesized that there are significant variations in the implementation of CE technologies in companies from different countries and with different product or manufacturing characteristics (Figure 1). The first argument is related to the existence of business support institutions, “green” attitudes, and other factors which are known to vary from country to country. The second argument reflects the fact that various technological/product configurations in different industries could either limit or promote the implementation of specific CE technology.
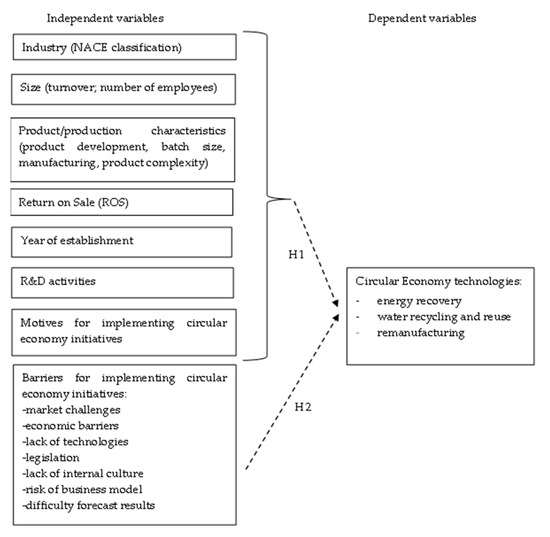
Figure 1.
Research concept.
In addition to H1, a more specific hypothesis (H2) was also developed which focuses on the relationship between the implementation of CE technologies and the perception of barriers to CE (Figure 1). While it might seem logical to assume that companies that have a strong perception of barriers would be less likely to implement CE technologies than those with a lower perception of such barriers, a fuller evaluation of such an assumption would require data that describes the predicted future implementation of CE technologies or their implementation in companies. The questionnaire which was formulated for our research also incorporates a sub-question querying the planned future implementation of each investigated technology within a three-year time horizon, and it was therefore possible to acquire data on this issue. We therefore hypothesize that there is a relationship between a current perceptions of CE barriers and the implementation of CE technologies in the near future (H2) (Figure 1).
Data
The research is based on data derived from the European Manufacturing Survey (EMS), more specifically the sub-samples for Slovakia and Slovenia. The EMS is a European joint survey project conducted by Frauhofer ISI which investigates numerous aspects of manufacturing companies (NACE codes 10 to 33) with more than 20 employees across 17 European countries. The respondents in companies are production managers, executive officers or owners of the facilities and were contacted either electronically or by post.
The survey was constructed with a core set of questions that are used in all countries. In addition to core questions some non-core questions (country specific) are integrated into the national questionnaires for each specific country by national teams. This approach allows a more detailed analysis of CE technologies, barriers and motives in the Slovak and Slovenian contexts which builds on previous investigations into the field of material and energy efficiency in the wider EMS consortium. The research incorporates several CE technologies, motives and barriers which were selected on the basis of literature reviews, EMS focus and opinion of experts from several countries. Although only Slovakia and Slovenia added all relevant questions for our research, it should be emphasized that in the case of recent CE studies, we can usually find only “single country studies”. Therefore, our research offers a bi-national perspective from two countries with several similarities in their industry structure, GDP/capita end export orientation.
The following wording was used in the questionnaires: “Which of the following technologies are currently used in your factory?”. The technologies were defined clearly (see below), and respondents could select either “yes” or “no” for each individual technology. The exact wording in case of three investigated CE technologies was as follows:
- “Technologies for recycling and re-use of water (e.g., water recirculating system)” = “water recycling and reuse”,
- “Technologies to recuperate kinetic and process energy (e.g., waste heat recovery)” = “energy recovery”,
- “Technologies of remanufacturing (including inspection, disassembly, cleaning, reprocessing, re-coating, additive repair, etc.)” = “remanufacturing”.
The data was collected independently in both countries at the end of 2018 and in the spring of 2019 and the size of the total sample (i.e., the total number of cases) is 241. The basic characteristics of the sample are presented in Table 1. Companies are distributed according to NACE Rev. 2 technological intensity into four groups: high-technology, medium-high-technology, medium-low-technology and low-technology companies.

Table 1.
Characteristics of respondents (sample of companies).
In Slovakia, the total number of manufacturing companies with NACE Rev. 2 codes 10–33 and more than 20 employees in 2017 was recorded as 2.527 companies (i.e., the total size of the population). Eight hundred of these companies were selected by stratified random sampling, which allows researchers to obtain a sample population that best represents the entire population being studied. Of the companies surveyed, 114 completed the questionnaire, giving the survey a response rate of 14.5%. The sectoral distribution and size structure of the surveyed companies offers a suitable cross-sample of the structure of the entire population.
Slovenia is an even smaller country than Slovakia, and therefore we were able to target the whole population of manufacturing companies, ensuring the highest possible representation. 847 questionnaires were sent, and 127 responses were received, a response rate of 15%.
A series of tests was performed in order to examine the possible relationship between the different “characteristics” of companies, CE motives, CE barriers and the implementation of CE technologies. All three dependent variables (i.e., the three CE technologies) were systematically verified using statistical tests to determine whether there are statistically significant differences between two groups of companies with similar values of independent variables (i.e., turn-over, number of employees, Return on Sales (ROS), R&D activities, etc.). The groups of companies were defined based on their average value in the whole sample. The first group was formed of companies with lower-than-average values and the second group by companies with higher-than-average values. However, the data did not display a typical distribution and lacked any repeated measures, and therefore the Mann–Whitney U test, χ2 and Kruskal-Wallis test were applied to the data depending on the number of groups in the sample and data type. For example, when investigating variance in the implementation of CE technologies related to high/low perceptions of CE barriers (Tab. 6), the sample size is relatively small since only a limited number of companies are planning to implement CE technology in next three years. In this case, the Fisher test (a variant of χ2 for small samples) was used.
4. Results
4.1. Implementation of CE Technologies in Companies
The general statistics on the implementation of CE technologies in manufacturing companies in Slovakia and Slovenia (Table 2) shows that each specific technology (“water recycling”, “energy recovery”, and “remanufacturing”) is currently being used by approximately one quarter of the surveyed companies.
Table 2.
Statistics for questions identifying the implementation of CE technologies in companies.
In this section, we will interpret the findings of the statistical testing of the relationship between the control variables and the implementation of three CE technologies (Table 3). In terms of NACE, the results show that the only statistically significant relationship is that between NACE and “water recycling” technology, with this technology being implemented in a significantly higher percentage of medium-low-tech companies in comparison to low-tech companies. The performance of R&D in the company has a relationship to the implementation of two of the three CE technologies (“water recycling” and “remanufacturing”), while in both cases, these technologies are implemented in significantly higher percentage of companies that perform R&D activities. The investigation of product/manufacturing characteristics in relation to the implementation of CE technologies revealed that batch size is an important factor, with a significantly lower percentage of companies categorized as “single unit production” companies implementing two CE technologies (“energy recovery”, “water recycling”) in comparison to other companies (medium and large batch). Company size, (measured by either by turnover or the number of employees) has a significant relationship to the implementation of two of the three CE technologies (“energy recovery”, “water recycling”). In both cases, a significantly higher percentage of larger companies were found to have implemented these technologies in comparison to smaller companies. In terms of ROS, the data shows that this factor has no significant relationship to the implementation of any of the three CE technologies. However, the company age was found to be related to the implementation of two of three CE technologies (“water recycling” and “energy recovery”), with both technologies being implemented in a significantly higher percentage of companies that are older than the average age of companies in the sample. With regard to the relation between CE technologies and CE motives, the data shows that only the “cost savings” motive had any significant relationship with the implementation of CE technology implementation. A significantly higher percentage of companies that selected this motive employed energy recovery technologies in comparison with companies that did not select this motive. Additionally, we used “country” variable to test whether there were any significant differences between the implementation of CE technologies in Slovenian and Slovak companies. The data shows that a significantly higher percentage of Slovenian companies have implemented CE technologies than Slovak companies.
Table 3.
Implementation of CE technologies in companies with different company/product/production characteristics.
4.2. Planning the Implementation of CE Technologies in Companies
In addition to an analysis of the actual implementation of the three CE technologies, we also investigated the plans of manufacturing companies in Slovakia and Slovenia regarding the implementation of CE technologies in the period from 2019 to 2021 (Figure 2). As was expected, the comparison of the three technologies showed that the highest percentage of companies are planning the implementation of “energy recovery” technology, with a substantially lower percentage considering the use of “water recycling” technology and only a marginal percentage of companies projecting the introduction of “remanufacturing” technology. Furthermore, Figure 1 shows a significant difference between Slovak and Slovenian companies in the case of each of the technologies, with a higher percentage of Slovenian companies either planning or having already introduced the technology than was the case with Slovak companies.
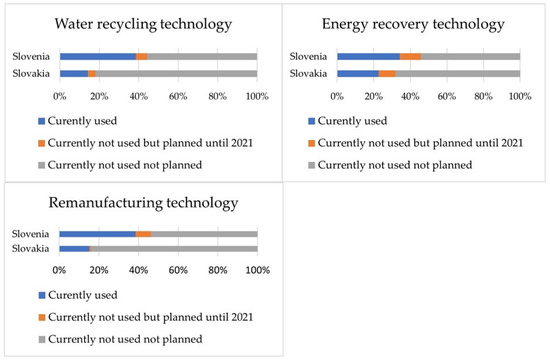
Figure 2.
Current status and plans of the companies to implement CE technology in near future.
4.3. Relationship between Current Perceptions of CE Barriers and the Planned Implementation of CE Technologies
The data also revealed that there is no significant relationship between the current perception of CE barriers and the planned implementation of CE technologies (Table 4). This is a somewhat surprising result, since it had been expected that in the case of at least some of the barriers, companies that perceived the barrier(s) to a lower degree would be more likely to be planning the implementation of one or more CE technologies.
Table 4.
Variance in the planned implementation of CE technologies related to weak/strong perception of CE barriers.
5. Discussion
5.1. Implementation of CE Technologies
In general, there is a notable lack of any detailed data mapping the level of implementation of CE technologies across entire industries or countries. Our data fills this gap and shows that around one quarter of the surveyed manufacturing companies use “energy recovery” technology and a similar proportion was also recorded for the technologies of “water recycling/reuse” and “remanufacturing”. In comparison, according to the EU Survey (distributed to more than 20,000 contacts that were identified as very likely to be remanufacturing actors), 162 (85%) of 190 respondents reported that their company undertakes remanufacturing activity [61], a figure which is far higher than our research has indicated, although it should be noted that there are significant differences in the sample of respondents which the two studies and surveys have investigated.
5.2. Influences on the Implementation of CE Technologies
According to Rajnoha & Lesníková [62], company size is a relevant factor in engagement in environmental issues, and they suggest that the larger the company is, the greater the focus it places on environmental issues. Nonetheless, Fu et al. [13] conclude that studies differ concerning the effect of company size on ST adoption. They also offer possible reasons for the negative effect of company size (the fact that smaller companies are early adopters of innovative technology), the positive effects of company size (the greater financial resources and easier access to knowledge enjoyed by larger companies) and the contrasting effects of company size (e.g., the so-called U-shaped relationship). Some indirect explanations of the positive effect of company size can also be found in the study produced for the European Commission which states that although SMEs are generally aware of national environmental legislation, they lack the specific knowledge and capacity to comply with the necessary requirements [63]. In this respect, other studies have found that perceptions of the pressure of coercive environmental regulation and market pressure have a greater influence on ST adoption among larger companies than on small companies [64,65]. Our empirical study supports these explanations of the positive effects of company size, since the data shows that larger companies were more likely to have implemented two of three investigated CE technologies (“energy recovery” and “water recycling”).
Based on a recent review paper by Fu et al. [13], profitability does not appear to have a significant effect on ST adoption in most cases. The only exception is a study by Meynard and Shortle [44] for implementation of highly specific technology. Our profitability data (measured by ROS) shows “no relation” results in the case of all three of the investigated CE technologies. Again, this finding is perhaps surprising, as it might be expected that more profitable companies would be able invest more in CE technologies. When interpreting our results, however, it should be noted that the ROS variable reflects its value at only one point in time, more precisely the year 2017, and not an average value in longer time period.
Cainelli et al. [66] have stated that R&D is too generic and weak innovation commitment to enhance the adoption of eco-innovations (EI). They also stated that other techno-organizational features are required to enhance the adoption of EI. Their later econometric analysis [67] shows that companies typically adopt EI on the basis of company specific and relational factors, with the more common drivers such as R&D having little or no impact. In partial disagreement with Cainelli, Fu et al. [13] found that R&D activity has a significant positive effect on the adoption of energy-saving technologies. They further explain that R&D activity is valid for the adoption of energy-saving technologies and investment in clean technology, but not on the level of the adoption of clean or end-of-pipe technologies or investment in various types of STs. Furthermore, in relation to technology type, Bhupendra and Sangle [68] found that clean technology adoption requires a broad innovative capability, while the adoption of pollution prevention technology requires only a partial innovation capability. Our results contrast with those of Fu et al. [13], since they show that the performance of R&D activities within companies does in fact have a relationship to the implementation of two of the three CE technologies (“water recycling” and “remanufacturing”), but that this is not the case with “energy recovery”. As expected, both technologies are implemented in a significantly higher percentage of companies that perform R&D activities.
In terms of differences related to the country in which the company (or factory) is located, the data shows that a significantly higher percentage of Slovenian companies have implemented CE technologies in comparison to Slovak companies (see Figure 2). In the case of water recycling technologies, these differences could be influenced by the higher share of water withdrawal by industry as a percentage of total water withdrawal in Slovenia (Slovakia: 41.56% (2017); Slovenia: 81.38% (2017) [69]). We also have to consider the structure of manufacturing companies in both countries, since not all NACE C sectors in Slovenia were included in the survey as was the case with Slovak companies. Slovenian companies are also typically suppliers for other European companies, especially Western European companies, and a closer look at the survey results for Slovenian manufacturing companies reveals that suppliers implemented all three analyzed CE technologies much more frequently than OEMs. This factor is a major contributor to the total number of CE technologies implemented in Slovenia, as the implementation of these technologies might even be a prerequisite for doing business with foreign OEMs.
In EU32, a wide range of policies have been introduced aimed at influencing resource use; within the context of SMEs alone, more than a hundred such initiatives are now in effect [70]. A number of previous studies (e.g., [20,64,71,72]) have found that governmental regulations have a positive effect on the adoption of sustainable process technologies. Based on an extensive survey of EU companies, a study by Cainelli et al. [73] supports the idea that environmental policy is a significant factor in driving the adoption of innovations that promote recycling, reduce waste and decrease the use of materials. They conclude that there seems to be a general consensus that stricter environmental regulation is expected to increase adoption incentives, but some studies have cast doubt on the validity of such a statement with respect to specific technologies, environmental policy tools (e.g., [74]) and the type of innovation (e.g., there is less evidence of the impact of innovations related to material inputs reduction [73]). In addition, Perino and Requate [74] found that given a sufficient degree of symmetry between companies, the relationship between the rate of advanced technology adoption and the stringency of environmental policy takes the form of an inverted U-shape. Moreover, an interesting study by Horbach [75] shows that regulatory activities seem to be more important for Eastern countries than they are for the “richer” Western European countries in terms of the introduction of eco-innovations. In the CE context, Cainelli et al. [73] noted that the existing environmental regulations offer significant and positively support for the adoption of CE related innovation by companies, with companies located in regions featuring more effective separated waste collection and stricter waste policies are more likely to adopt EI [73]. The authors also argued that there appears to be some degree of agreement on the potentially positive impact of environmental regulatory stringency on the incentives of regulated companies to adopt cleaner technologies. Surprisingly, our data shows no significant relationship between the selection of the “regulation compliance” motive for the adoption of CE initiatives and the implementation of any of the investigated CE technologies. However, the “no relation” result could be affected by how the nature of the survey itself. In our survey, respondents were asked to select one or more generic motives for the adoption of CE initiatives. We did not ask respondents individually for the motives behind the adoption of specific CE technology, nor did we directly ask whether any specific regulation had had an effect on the implementation of a specific CE technology within the company. Cost savings are an important motivation for reducing energy and material use, emphasizing the key role of energy and raw material prices as drivers for eco-innovation [76,77]. Our study partially supports studies showing that cost-savings are an important motive for the implementation of CE technologies, since it shows that companies selecting the cost savings motivation had implemented energy recovery technologies in a significantly higher proportion, but no similar relationship was identified in the case of water reuse/recycling or remanufacturing technologies.
5.3. Relationship between Current Perceptions of CE Barriers and the Planned Implementation of CE Technologies
The reasons for the lack of any significant relationship between any of seven investigated CE barriers and the planned implementation of any of three investigated CE technologies are not entirely clear. There may be some bias at play caused by ambiguities over which types of technologies and practices can be considered as falling under the CE umbrella; for example, our inclusion of energy recovery and water recycling/reuse to CE technologies may not have been clearly understood by some companies. However, there should have been less confusion in the case of remanufacturing, since this technology was clearly listed under the CE technologies group in the questionnaire. Another possible explanation might be the size of the sample in terms of the number of companies in both countries that are planning to introduce at least one of the analyzed ST.
6. Conclusions
The results regarding the implementation of the three investigated CE technologies in manufacturing companies show that each of the technologies is used by approximately one quarter of the surveyed companies. Our data further shows that there is a significant relationship between company size (in concordance with Calogirou et al. [63], Fu et al. [13], Huang et al. [64] and Triguero et al. [65]), the performance of R&D activities (in contradiction to the findings of Fu et al. [13]), product/manufacturing characteristics of companies, company age, and country and the implementation of the CE technologies. In contrast, little or no relationship was found in the case of the NACE and ROS variables (a finding in agreement with Fu et al. [13]). In a more detailed analysis, larger companies were found to be more likely to have implemented two of the three investigated CE technologies (“energy recovery” and “water recycling”). “Water recycling” and “remanufacturing” technologies were implemented in a significantly higher percentage by companies that perform R&D activities, while the data showed no relationship between the adoption of “energy recovery” technologies and the performance of R&D. Regarding the product/manufacturing characteristics of companies, it was found that batch size was an important factor, with a significantly lower percentage of companies practicing “single unit production” implementing two of the three CE technologies (“energy recovery” and “water recycling”). Company age was also identified as a factor in the implementation of two of the three CE technologies (“water recycling” and “energy recovery”), with both technologies being implemented in a significantly higher percentage of older companies. Lastly, the country of origin also had significant influence on the implementation of CE technologies, with a higher percentage of Slovenian companies implementing cleaner technologies in comparison to Slovak companies. Surprisingly, our results also reveal that there is no significant relationship between the current perception of CE barriers and the planned implementation of CE technologies in the near future.
Some theoretical contributions can be derived from this paper. The first contribution concerns the study of specific company and product characteristics that can affect the adoption of selected ST. While several of these characteristics have been studied before, the topic is still largely unexplored. In a debate on company size and adoption of ST we clearly support a broader stream of research and suggest that larger companies have a much higher tendency to introduce ST. The only exception to this rule is “remanufacturing” ST, where company size does not play an important role neither in terms of the number of employees nor in terms of annual turnover. We also expand upon the perception of the R&D effect, with our results appearing to contradict the findings of other literature show that manufacturing companies with more intensive R&D activities are more prone to adopt different types of ST.
The second theoretical contribution deals with the company and production characteristics that effect ST adoption, an issue which to our knowledge has not been studied before. One of these characteristics is product/production type. Production batch size is a clear factor that impacts the adoption of “energy recovery” and “water recycling” technologies, whereas production batch size is not a factor which influences the decision to use “remanufacturing” activities. Another important finding that has not been explored sufficiently in the past is the fact that the technological intensity of the companies (industry) has no effect on ST adoption in terms of all three of the selected ST.
The third contribution lies in the finding that there is no significant relationship between the current perception of CE barriers and the planned implementation of CE technologies in the near future. This has considerable implications for the theoretical aspects of the issue. One could logically expect that some relation would exist in the case of “remanufacturing” technology, one of the best-known CE activities. One explanation for this apparent discrepancy may lie in the possibility of unclear understandings of the CE concept by manufacturing companies in general, for example by their failure to consider at least their remanufacturing activities as a core part of CE initiatives. Therefore, this “no relation” result could indirectly support the notion that companies have limited knowledge about the CE concept.
This contribution also has some limitations. One of the limitations of this research is that it does not cover the full range of CE technologies and CE barriers. The high number of specific technologies and barrier mentioned in the relevant literature and the limited space in EMS questionnaire meant that it was not possible to include all of the technologies in the survey and it was instead necessary to select the most appropriate examples or merge other categories together. Another limitation is the spatial distribution of the data. Although seventeen European countries participated in the EMS survey, only two of the national surveys (Slovakia and Slovenia) included questions that investigated the implementation of all three of the investigated CE technologies and the perceptions of CE barriers and motives, and therefore the analysis in this study was limited to these two countries. A final limitation is related to the awareness of CE among the managers. Although a concise definition of the term CE was provided in the questionnaire in order to ensure that the respondents had a clear understanding of the initiatives (and actions) which are covered by the concept, it is possible that the answers concerning the barriers to adoption and the motives for CE implementation were influenced by the level of knowledge of each individual respondent. It was not possible to measure the degree of awareness among respondents, but the impact of this factor on the significance of the presented results could be assuaged if we assume the possibility of the random character of variations in knowledge.
The findings of our research also have some implications in the managerial sphere. Managers of large companies that have not yet implemented CE technologies in terms of water recycling, energy recovery or remanufacturing will be made aware of the fact that other large companies are already investing heavily in CE technologies. While the use of these technologies may not present a clear financial advantage at this time, the positive impact of a “green image” in the future will on one hand represent a valuable competitive criterion, as well as a necessity in alignment with existing environmental policies. Cost savings, at least in terms of energy recovery technologies, have already been identified as a powerful motive for investment into these technologies. An important finding is also the fact that R&D-oriented manufacturing companies are more likely to invest in CE technologies, suggesting that innovative companies are already considering the environmental issues related to manufacturing processes.
As the topic of CE continues to grow in relevance, we expect that the concept will also become clearer to manufacturing companies, removing one of the biggest limitations in CE and ST research. Our future research into this topic will expand the CE and ST issues to a larger group of European countries in our EMS consortium. This type of approach will allow us to conduct a more in-depth analysis of factors that affect ST adoption on a multi-country level. We will also include new important factors for ST adoption, such as Industry 4.0 and the digitization maturity level of manufacturing companies.
Author Contributions
Conceptualization, J.Š. and I.P.; Data curation, J.Š., M.Š. and I.P.; Investigation, J.Š.; Methodology, J.Š.; Research administration and funding, M.Š.; Writing—original draft, J.Š.; Writing—review and editing, J.Š., M.Š. and I.P. All authors have read and agreed to the published version of the manuscript.
Funding
This contribution was supported by KEGA research grants 002TUKE-4/2020 “Implementation of intelligent technology and advanced technologies to support transformation processes and future product design” and Slovenian Research Agency (Research Core Funding No. P2-0190).
Institutional Review Board Statement
Not applicable.
Informed Consent Statement
Not applicable.
Data Availability Statement
Not applicable.
Acknowledgments
The authors would like to thank to the EMS consortium for methodological support for the research.
Conflicts of Interest
The authors declare no conflict of interest.
References
- Aminoff, A.; Valkokari, K.; Antikainen, M.; Kettunen, O. Exploring Disruptive Business Model Innovation for the Circular Economy BT—Sustainable Design and Manufacturing 2017; Campana, G., Howlett, R.J., Setchi, R., Cimatti, B., Eds.; Springer International Publishing: Cham, Switzerland, 2017; pp. 525–536. [Google Scholar]
- Cui, Y.; Jiao, H. How to Build Enterprise Competitiveness: From Circular Economy Perspective. Appl. Mech. Mater. 2014, 448–453, 4471–4474. [Google Scholar] [CrossRef]
- Stahel, W.R. The Business Angle of a Circular Economy–Higher Competitiveness, Higher Resource Security and Material Efficiency. A New Dyn. Eff. Bus. A Circ. Econ. 2013, 1, 1–10. [Google Scholar]
- Corral-Marfil, J.-A.; Arimany-Serrat, N.; Hitchen, E.L.; Viladecans-Riera, C. Recycling Technology Innovation as a Source of Competitive Advantage: The Sustainable and Circular Business Model of a Bicentennial Company. Sustainability 2021, 13, 7723. [Google Scholar] [CrossRef]
- De Man, R.; Friege, H. Circular Economy: European Policy on Shaky Ground. Waste Manag. Res. 2016, 34, 93–95. [Google Scholar] [CrossRef] [PubMed] [Green Version]
- Liakos, N.; Kumar, V.; Pongsakornrungsilp, S.; Garza-Reyes, J.A.; Gupta, B.; Pongsakornrungsilp, P. Understanding Circular Economy Awareness and Practices in Manufacturing Firms. J. Enterp. Inf. Manag. 2019, 32, 563–584. [Google Scholar] [CrossRef]
- European Commission EU Taxonomy for Sustainable Activities; European Commission: Brussels, Belgium, 2021.
- Gupta, H.; Kumar, A.; Wasan, P. Industry 4.0, Cleaner Production and Circular Economy: An Integrative Framework for Evaluating Ethical and Sustainable Business Performance of Manufacturing Organizations. J. Clean. Prod. 2021, 295, 126253. [Google Scholar] [CrossRef]
- Lieder, M.; Rashid, A. Towards Circular Economy Implementation: A Comprehensive Review in Context of Manufacturing Industry. J. Clean. Prod. 2016, 115, 36–51. [Google Scholar] [CrossRef]
- Bjørnbet, M.M.; Skaar, C.; Fet, A.M.; Schulte, K.Ø. Circular Economy in Manufacturing Companies: A Review of Case Study Literature. J. Clean. Prod. 2021, 294, 126268. [Google Scholar] [CrossRef]
- Friant, M.C.; Vermeulen, W.J.V.; Salamone, R. A typology of circular economy discourses: Navigating the diverse visions of a contested paradigm. Resour. Conserv. Recycl. 2020, 161, 104917. [Google Scholar] [CrossRef]
- Vacchi, M.; Siligardi, C.; Demaria, F.; Cedillo-Gonzalez, E.I.; Gonzalez-Sanchez, R.; Settembre-Bludno, D. Technological Sustainability or Sustainable Technology? A Multidimensional Vision of Sustainability in Manufacturing. Sustainability 2021, 13, 9942. [Google Scholar] [CrossRef]
- Fu, Y.; Kok, R.A.W.; Dankbaar, B.; Ligthart Paul, E.M.; van Riel, A.C.R. Factors Affecting Sustainable Process Technology Adoption: A Systematic Literature Review. J. Clean. Prod. 2018, 205, 226–251. [Google Scholar] [CrossRef]
- Vimal, K.E.K.; Kulatunga, A.K.; Ravichandran, M.; Kandasamy, J. Application of Multi Grade Fuzzy Approach to Compute the Circularity Index of Manufacturing Organizations. Procedia. CIRP 2021, 98, 476–481. [Google Scholar] [CrossRef]
- U.S. International Trade Commission Remanufactured Goods: An Overview of the U.S. and Global Industries, Markets and Trade; U.S. International Trade Commission: Washington, DC, USA, 2012.
- Reddy, K.N.; Kumar, A. Capacity Investment and Inventory Planning for a Hybrid Manufacturing—Remanufacturing System in the Circular Economy. Int. J. Prod. Res. 2021, 59, 2450–2478. [Google Scholar] [CrossRef]
- Rizos, V.; Behrens, I.; Kafyekei, T.; Hirschnitz-Garbers, M.; Ioannou, A. Circular Economy: Barrier and Opportunities for SMEs. CEPS Work. Doc. 2021, 255, 8. [Google Scholar] [CrossRef]
- de Jesus Pacheco, D.A.; ten Caten, C.S.; Jung, C.F.; Guitiss Navas, H.V.; Cruz-Machado, V.A. Eco-Innovation Determinants in Manufacturing SMEs from Emerging Markets: Systematic Literature Review and Challenges. J. Eng. Technol. Manag. 2018, 48, 44–63. [Google Scholar] [CrossRef]
- Flachenecker, F.; Rentschler, J. Investing in Resource Efficiency: The Economics and Politics of Financing the Resource Transition; Springer: Cham, Switzerland, 2018; ISBN 3-319-78867-1. [Google Scholar]
- Luken, R.; Van Rompaey, F. Drivers for and Barriers to Environmentally Sound Technology Adoption by Manufacturing Plants in Nine Developing Countries. J. Clean. Prod. 2008, 16, S67–S77. [Google Scholar] [CrossRef]
- de Jesus, A.; Antunes, P.; Santos, R.; Mendonça, S. Eco-Innovation in the Transition to a Circular Economy: An Analytical Literature Review. J. Clean. Prod. 2016, 172, 2999–3018. [Google Scholar] [CrossRef]
- Choudhry, H.; Lauritzen, M.; Somers, K.; Niel, J.V. Greening the Future: New Technologies That Could Transform. How Industry Uses Energy; McKinsey & Company: Chicago, IL, USA, 2015; p. 28. [Google Scholar]
- Chowdhury, J.I.; Hu, Y.; Haltas, I.; Balta-Ozkan, N.; Matthew, G.; Varga, L. Reducing Industrial Energy Demand in the UK: A Review of Energy Efficiency Technologies and Energy Saving Potential in Selected Sectors. Renew. Sustain. Energy Rev. 2018, 94, 1153–1178. [Google Scholar] [CrossRef]
- Thollander, P.; Rohdin, P.; Moshfegh, B.; Karlsson, M.; Söderström, M.; Trygg, L. Energy in Swedish Industry 2020—Current Status, Policy Instruments, and Policy Implications. J. Clean. Prod. 2013, 51, 109–117. [Google Scholar] [CrossRef] [Green Version]
- Reike, D.; Vermeulen, W.J.V.; Witjes, S. The Circular Economy: New or Refurbished as CE 3.0?—Exploring Controversies in the Conceptualization of the Circular Economy through a Focus on History and Resource Value Retention Options. Resour. Conserv. Recycl. 2018, 135, 246–264. [Google Scholar] [CrossRef]
- Blomsma, F.; Pieroni, M.; Kravchenko, M.; Pigosso, D.; Hildenbrand, J.; Kristinsdottir, A.R.; Kristoffersen, E.; Shabazi, S.; Nielsen, K.; Jönbrink, A.K.; et al. Developing a Circular Strategies Framework for Manufacturing Companies to Support Circular Economy-Oriented Innovation. J. Clean. Prod. 2019, 241, 118271. [Google Scholar] [CrossRef]
- Potting, J.; Hekkert, M.; Worrell, E.; Hanemaaijer, A. Circular Economy: Measuring Innovation in the Product Chain; PBL Netherlands Assessment Agency: The Hague, The Netherlands, 2017; p. 42. [Google Scholar]
- Khayyam, H.; Naebe, M.; Milani, A.S.; Fakhrhoseini, S.M.; Date, A.; Shabani, B.; Atkiss, S.; Ramakrishna, S.; Fox, B.; Jazar, R.N. Improving Energy Efficiency of Carbon Fiber Manufacturing through Waste Heat Recovery: A Circular Economy Approach with Machine Learning. Energy 2021, 225, 120113. [Google Scholar] [CrossRef]
- WWAP. The United Nations World Water Development Report 2014: Water and Energy; WWAP: Paris, France, 2014. [Google Scholar]
- Eurostat Water Statistics; European Commission: Brussels, Belgium, 2021.
- Qi, J.; Zhao, J.; Li, W.; Peng, X.; Wu, B.; Wang, H. The Circular Economy-Oriented Practice in the Food Manufacturing Industry BT—Development of Circular Economy in China; Qi, J., Zhao, J., Li, W., Peng, X., Wu, B., Wang, H., Eds.; Springer: Singapore, 2016; pp. 201–222. ISBN 978-981-10-2466-5. [Google Scholar]
- Wen, Z.; Hu, Y.; Lee, J.C.K.; Luo, E.; Li, H.; Ke, S. Approaches and Policies for Promoting Industrial Park Recycling Transformation (IPRT) in China: Practices and Lessons. J. Clean. Prod. 2018, 172, 1370–1380. [Google Scholar] [CrossRef]
- Wu, H.; Lv, K.; Liang, L.; Hu, H. Measuring Performance of Sustainable Manufacturing with Recyclable Wastes: A Case from China’s Iron and Steel Industry. Omega 2017, 66, 38–47. [Google Scholar] [CrossRef]
- Reh, L. Process Engineering in Circular Economy. Particuology 2013, 11, 119–133. [Google Scholar] [CrossRef]
- Bag, S.; Gupta, S.; Foropon, C. Examining the Role of Dynamic Remanufacturing Capability on Supply Chain Resilience in Circular Economy. Manag. Decis. 2019, 57, 863–885. [Google Scholar] [CrossRef]
- Lieder, M.; Asif, F.M.A.; Rashid, A.; Mihelič, A.; Kotnik, S. Towards Circular Economy Implementation in Manufacturing Systems Using a Multi-Method Simulation Approach to Link Design and Business Strategy. Int. J. Adv. Manuf. Technol. 2017, 93, 1953–1970. [Google Scholar] [CrossRef] [Green Version]
- Jawahir, I.S.; Bradley, R. Technological Elements of Circular Economy and the Principles of 6R-Based Closed-Loop Material Flow in Sustainable Manufacturing. Procedia CIRP 2016, 40, 103–108. [Google Scholar] [CrossRef] [Green Version]
- Leino, M.; Pekkarinen, J.; Soukka, R. The Role of Laser Additive Manufacturing Methods of Metals in Repair, Refurbishment and Remanufacturing—Enabling Circular Economy. Phys. Procedia 2016, 83, 752–760. [Google Scholar] [CrossRef] [Green Version]
- Singhal, D.; Tripathy, S.; Jena, S.K. Remanufacturing for the Circular Economy: Study and Evaluation of Critical Factors. Resour. Conserv. Recycl. 2020, 156, 104681. [Google Scholar] [CrossRef]
- Ponte, B.; Naim, M.M.; Syntetos, A.A. The Value of Regulating Returns for Enhancing the Dynamic Behaviour of Hybrid Manufacturing-Remanufacturing Systems. Eur. J. Oper. Res. 2019, 278, 629–645. [Google Scholar] [CrossRef]
- Wasono, R.S.; Wahab, D.A.; Azman, A.H. Additive Manufacturing for Repair and Restoration in Remanufacturing: An Overview from Object Design and Systems Perspectives. Processes 2019, 7, 802. [Google Scholar] [CrossRef] [Green Version]
- Arvanitis, S.; Ley, M. Factors determining the adoption of energy-saving technologies in Swiss firms: An analysis based on micro data. Environ. Resour. Econ. 2013, 54, 389–417. [Google Scholar] [CrossRef]
- Hammar, H.; Lofgren, A. Explaining adoption of end of pipe solutions and clean technologies-Determinants of firms’ investments for reducing emissions to air in four sectors in Sweden. Energy Policy 2010, 38, 3644–3651. [Google Scholar] [CrossRef]
- Maynard, L.J.; Shortle, J.S. Determinants of cleaner technology investments in the US bleached kraft pulp industry. Land Econ. 2001, 77, 561–576. [Google Scholar] [CrossRef]
- Luken, R.; Van Rompaey, F.; Zigova, K. The determinants of EST adoption by manufacturing plants in developing countries. Ecol. Econ. 2008, 66, 141–152. [Google Scholar] [CrossRef]
- Wagner, M. National culture, regulation and country interaction effects on the association of environmental management systems with environmentally beneficial innovation. Bus. Strategy Environ. 2009, 18, 122–136. [Google Scholar] [CrossRef]
- Theyel, G. Management practices for environmental innovation and performance. Int. J. Oper. Prod. Manag. 2000, 20, 249–266. [Google Scholar] [CrossRef]
- Bartholdi, J.J.; Hackman, S.T. Warehouse & Distribution Science; The Supply Chain and Logistics Institute: Atlanta, GA, USA, 2014; p. 323. [Google Scholar]
- Geng, Y.; Doberstein, B. Developing the Circular Economy in China: Challenges and Opportunities for Achieving “Leapfrog Development”. Int. J. Sustain. Dev. World Ecol. 2008, 15, 231–239. [Google Scholar] [CrossRef] [Green Version]
- Kirchherr, J.; Piscicelli, L.; Bour, R.; Kostense-Smit, E.; Muller, J.; Huibrechtse-Truijens, A.; Hekkert, M. Barriers to the Circular Economy: Evidence from the European Union (EU). Ecol. Econ. 2018, 150, 264–272. [Google Scholar] [CrossRef] [Green Version]
- Su, B.; Heshmati, A.; Geng, Y.; Yu, X. A Review of the Circular Economy in China: Moving from Rhetoric to Implementation. J. Clean. Prod. 2013, 42, 215–227. [Google Scholar] [CrossRef]
- Acerbi, F.; Taisch, M. A Literature Review on Circular Economy Adoption in the Manufacturing Sector. J. Clean. Prod. 2020, 273, 123086. [Google Scholar] [CrossRef]
- Jaeger, B.; Upadhyay, A. Understanding Barriers to Circular Economy: Cases from the Manufacturing Industry. J. Enterp. Inf. Manag. 2020, 33, 729–745. [Google Scholar] [CrossRef]
- Koszewska, M. Circular Economy—Challenges for the Textile and Clothing Industry. Autex Res. J. 2018, 18, 337–347. [Google Scholar] [CrossRef] [Green Version]
- Moktadir, M.A.; Ahmadi, H.B.; Sultana, R.; Zohra, F.T.; Liou, J.J.H.; Rezaei, J. Circular Economy Practices in the Leather Industry: A Practical Step towards Sustainable Development. J. Clean. Prod. 2020, 251, 119737. [Google Scholar] [CrossRef]
- Schröter, M.; Mattes, K.; Jäger, A. Overcoming Barriers to Implementing Recycling Solutions. In Proceedings of the POMS 23rd Annual Conference, Chicago, IL, USA, 27–30 April 2012. [Google Scholar]
- Lopes de Sousa Jabbour, A.B.; Jabbour, C.J.C.; Godinho Filho, M.; Roubaud, D. Industry 4.0 and the Circular Economy: A Proposed Research Agenda and Original Roadmap for Sustainable Operations. Ann. Oper. Res. 2018, 270, 273–286. [Google Scholar] [CrossRef]
- de Jesus, A.; Mendonça, S. Lost in Transition? Drivers and Barriers in the Eco-Innovation Road to the Circular Economy. Ecol. Econ. 2018, 145, 75–89. [Google Scholar] [CrossRef] [Green Version]
- Korhonen, J.; Nuur, C.; Feldmann, A.; Birkie, S.E. Circular Economy as an Essentially Contested Concept. J. Clean. Prod. 2018, 175, 544–552. [Google Scholar] [CrossRef]
- Halse, L.L.; Jæger, B. Operationalizing Industry 4.0: Understanding Barriers of Industry 4.0 and Circular Economy; Springer: New York, NY, USA, 2019; Volume 567, pp. 135–142. [Google Scholar]
- Parker, D.; Riley, K.; Robinson, S.; Symington, H.; Hollins, O. Remanufacturing Market. Study; European Commission: Brussels, Belgium, 2015. [Google Scholar]
- Rajnoha, R.; Lesníková, P. Strategic Performance Management System and Corporate Sustainability Concept—Specific Parametres in Slovak Enterprises. J. Compet. 2016, 6, 107–124. [Google Scholar] [CrossRef] [Green Version]
- Calogirou, C.; Sørensen, S.Y.; Larsen, P.J.; Alexopoulou, S. SMEs and the Environment in the European Union; European Commission: Brussels, Belgium, 2010. [Google Scholar]
- Huang, Y.C.; Ding, H.B.; Kao, M.R. Salient Stakeholder Voices: Family Business and Green Innovation Adoption. J. Manag. Organ. 2009, 15, 309–326. [Google Scholar] [CrossRef]
- Triguero, A.; Moreno-Mondéjar, L.; Davia, M.A. Eco-Innovation by Small and Medium-Sized Firms in Europe: From End-of-Pipe to Cleaner Technologies. Innovation 2015, 17, 24–40. [Google Scholar] [CrossRef]
- Cainelli, G.; Mazzanti, M.; Montresor, S. Environmental Innovations, Local Networks and Internationalization. Ind. Innov. 2012, 19, 697–734. [Google Scholar] [CrossRef] [Green Version]
- Cainelli, G.; D’Amato, A.; Mazzanti, M. Adoption of Waste-Reducing Technology in Manufacturing: Regional Factors and Policy Issues. Resour. Energy Econ. 2015, 39, 53–67. [Google Scholar] [CrossRef]
- Bhupendra, K.V.; Sangle, S. What Drives Successful Implementation of Pollution Prevention and Cleaner Technology Strategy? The Role of Innovative Capability. J. Environ. Manag. 2015, 155, 184–192. [Google Scholar] [CrossRef] [PubMed]
- FAO AQUASTAT Database; AQUASTAT. 2021. Available online: https://www.fao.org/aquastat/statistics/query/index.html (accessed on 25 October 2021).
- Ecorys, O. The Role of Market-Based Instruments in Achieving a Resource Efficient Economy. Report for the European Commission; DG Environment; Ecorys; Cambridge Econometrics and COWI: Rotterdam, The Netherlands, 2011. [Google Scholar]
- Sangle, S. Adoption of Cleaner Technology for Climate Proactivity: A Technology-Firm-Stakeholder Framework. Bus. Strategy Environ. 2011, 20, 365–378. [Google Scholar] [CrossRef]
- Weng, M.H.; Lin, C.Y. Determinants of Green Innovation Adoption for Small and Medium-Size Enterprises (SMES). Afr. J. Bus. Manag. 2011, 5, 9154–9163. [Google Scholar]
- Cainelli, G.; D’Amato, A.; Mazzanti, M. Resource Efficient Eco-Innovations for a Circular Economy: Evidence from EU Firms. Res. Policy 2020, 49, 103827. [Google Scholar] [CrossRef]
- Perino, G.; Requate, T. Does More Stringent Environmental Regulation Induce or Reduce Technology Adoption? When the Rate of Technology Adoption Is Inverted U-Shaped. J. Environ. Econ. Manag. 2012, 64, 456–467. [Google Scholar] [CrossRef] [Green Version]
- Horbach, J. Empirical Determinants of Eco-Innovation in European Countries Using the Community Innovation Survey. Environ. Innov. Soc. Transit. 2016, 19, 1–14. [Google Scholar] [CrossRef]
- Horbach, J.; Rammer, C.; Rennings, K. Determinants of Eco-Innovations by Type of Environmental Impact—The Role of Regulatory Push/Pull, Technology Push and Market Pull. Ecol. Econ. 2012, 78, 112–122. [Google Scholar] [CrossRef] [Green Version]
- Lin, T.; Wu, P.; Gao, F.M.; Wu, T.S. Energy-Saving Cloud Workflow Scheduling Based on Optimistic Cost Table. Int. J. Simul. Model. 2020, 19, 505–516. [Google Scholar] [CrossRef]
Publisher’s Note: MDPI stays neutral with regard to jurisdictional claims in published maps and institutional affiliations. |
© 2021 by the authors. Licensee MDPI, Basel, Switzerland. This article is an open access article distributed under the terms and conditions of the Creative Commons Attribution (CC BY) license (https://creativecommons.org/licenses/by/4.0/).