Article

Resiliency Assessment of Road Networks during Mega Sport Events: The Case of FIFA World Cup Qatar 2022

by
Mohammad Zaher Serdar
and
Sami G. Al-Ghamdi
*
Division of Sustainable Development, College of Science and Engineering, Hamad Bin Khalifa University, Qatar Foundation, Doha 122104, Qatar
*
Author to whom correspondence should be addressed.
Sustainability 2021, 13(22), 12367; https://doi.org/10.3390/su132212367
Submission received: 5 October 2021 / Revised: 27 October 2021 / Accepted: 3 November 2021 / Published: 9 November 2021

Abstract

:
Hosting Mega Sport Events (MSEs) is a formidable expedition that requires enormous investments and that has the potential to reform the nation’s future and create a lasting legacy. However, the increase in environmental concerns is pushing host cities to adopt a compact event approach. Compactness increases the concentration of the load on host cities’ infrastructures, which have to preserve an acceptable level of functionality under any possible disturbance; in other words, they should be resilient. Among these infrastructures, the road network plays the most prominent role in the fans’ experiences and the event’s success. To assess its resilience during MSE, we proposed a multilevel assessment approach that focuses on the network cohesion and critical trips performance under several disturbance scenarios, including natural hazards, intentional attacks, and accidents. The framework was applied to the Doha road network, since Doha will be a host city for the FIFA World Cup in Qatar in 2022, which exhibited a high level of resilience to intentional attacks and accidents scenarios. However, during the natural hazard scenario (flooding), the network experienced severe fragmentation, signaling weak resilience and highlighting the need to improve storm management plans. Future research could investigate the use of weighted graphs to increase the accuracy or incorporate different assessment approaches into the framework.

1. Introduction

Hosting a successful Mega Sport Event (MSE) such as the FIFA World Cup (WC) is a formidable expedition, especially under adverse challenges such as climate change and rapid urbanization. Today, more than half of the world’s population lives in cities, and experts expect this number to reach two-thirds of the world’s population by 2050 [1]. This accelerated urbanization trend has led to capital concentration in cities, converting them into development hubs [2,3,4]. However, in many cases, ill-planned expansions increased loads on infrastructure and caused degradation in service quality [5,6,7]. At the same time, political tensions and climate change have increased the rate, intensities, and impacts of disasters in recent years, adding more loads on the infrastructure systems [8,9,10]. These challenges have caused a paradigm shift in design mentality and fueled the research in infrastructure resiliency in the past decade [3,4,11,12]. Hosting a successful MSE with tremendous popularity, such as the WC, is an important milestone in any nation’s history and a testimony to its capabilities and development [13]. However, a critical factor in organizing a successful event of such a scale is a robust and efficient transportation network that can accommodate the influx of a huge number of fans and preserve functionality under perplexing and unpredictable threats; in other words, a resilient transportation system is required.

1.1. Resiliency in Transportation Systems

Resiliency is a relatively new concept in the engineering field with varying definitions and assessment methods. The first mention of system resiliency in the academic literature is by Holling [14] in 1973, where the term is used to describe an ecological system’s ability to regain its original state after a disturbance. However, the concept only found its way to urban planning and engineering literature about two decades ago because of the increasing amount of unpredictable disasters and their impacts, especially with an ever-growing capital concentration in urban centers [3,15,16,17,18]. So far, there is no consensus on the definition of resiliency in engineering systems and critical infrastructures, which is attributed to the varying nature of threats and assessment frameworks [3,15,17]. According to various researchers, resiliency is a combination of several systems’ properties, most notably, vulnerability, robustness, flexibility, and reliability, that describe its response and reaction to disturbances [19]. Despite the variance, most definitions proposed in the literature converge at two qualities to measure system resiliency, impact resistance, and the amount of time required for recovering an acceptable performance [3].
Transportation system resiliency assessments are distinct from other critical infrastructure resiliency assessments. For instance, water and electrical infrastructures have a directed continuous flow with a source-sink theme [3,20,21,22], while communication infrastructure has area coverage and wireless connectivity in most urban areas [3,23]. On the other hand, transportation networks usually enjoy two-way connectivity, especially on highways and main roads, with no main, distinguished source-sink [12,24,25]. Furthermore, transportation networks enjoy a discrete nature of flow, which allows for the usage of methodologies, such as agent-based modeling and simulation, to assess their performance and resiliency [26,27,28].
However, the level and scale of the transportation network that is under investigation can profoundly affect the resiliency assessment method. Many methods are proposed in the literature, ranging from analytical methods to simulation and even logical methods, depending on the available resources and addressed threats, whether it is a natural disaster, an intentional attack, something else that is affecting the city’s network, or an origin-destination group of links [12,17,29]. Simulation methods, such as agent-based or Monte Carlo simulations, can provide high-resolution results that can be used to assess the effectiveness of various improvements under different scenarios, but they are resource-demanding, hard to scale up, and need calibration to reflect the real world, which makes them only suitable for small-scale networks or networks with a limited number of elements and links [30,31]. Logical methods, such as optimization and game theory, and their applications, are mainly used to address intentional attacks or to draft informed development strategies, depending on the informed payoff value; however, the accuracy of the mathematical formulation of the impacts, each strategy’s actual cost, and the probability of predicting each side behavior affects their feasibility [32,33,34]. Analytical methods include complex networks theory (CN) and simple performance measurements, such as pace and shortest path length; these are the most often-used methods in resiliency studies since they are the least resource-demanding and provide metrics with a reasonably acceptable level of accuracy [35,36,37,38,39].
CN can form the base for other methods and even leverage other disciplines and technologies. CN provides a simple yet efficient abstract of a network’s components and their relationships, allowing for the analysis of these relations by other methods, such as game theory or Monte Carlo simulations [30,40]. This combination of methods can significantly reduce the computational resource demands and provide comparability between various methodologies [39,41,42]. Moreover, CN can leverage other technologies, such as geographic information systems (GIS), to give the network abstract spatial meaning and more accurate representations [43,44]. This coupling of GIS with CN also allows for scenario simulations, using powerful GIS spatial analysis tools, and reflects the results on the network’s connectivity and centrality measures. This application is widely applied in the literature [5,45,46]. Furthermore, GIS can measure the shortest paths and the levels of walkability in areas of interest, giving the abstract further information or weighting other than the normal connectivity of links; this potential could be employed to measure the effect on the commuting time between points of interest and used as an additional resiliency metric [47,48,49].

1.2. Mega Sports Events and Resilience
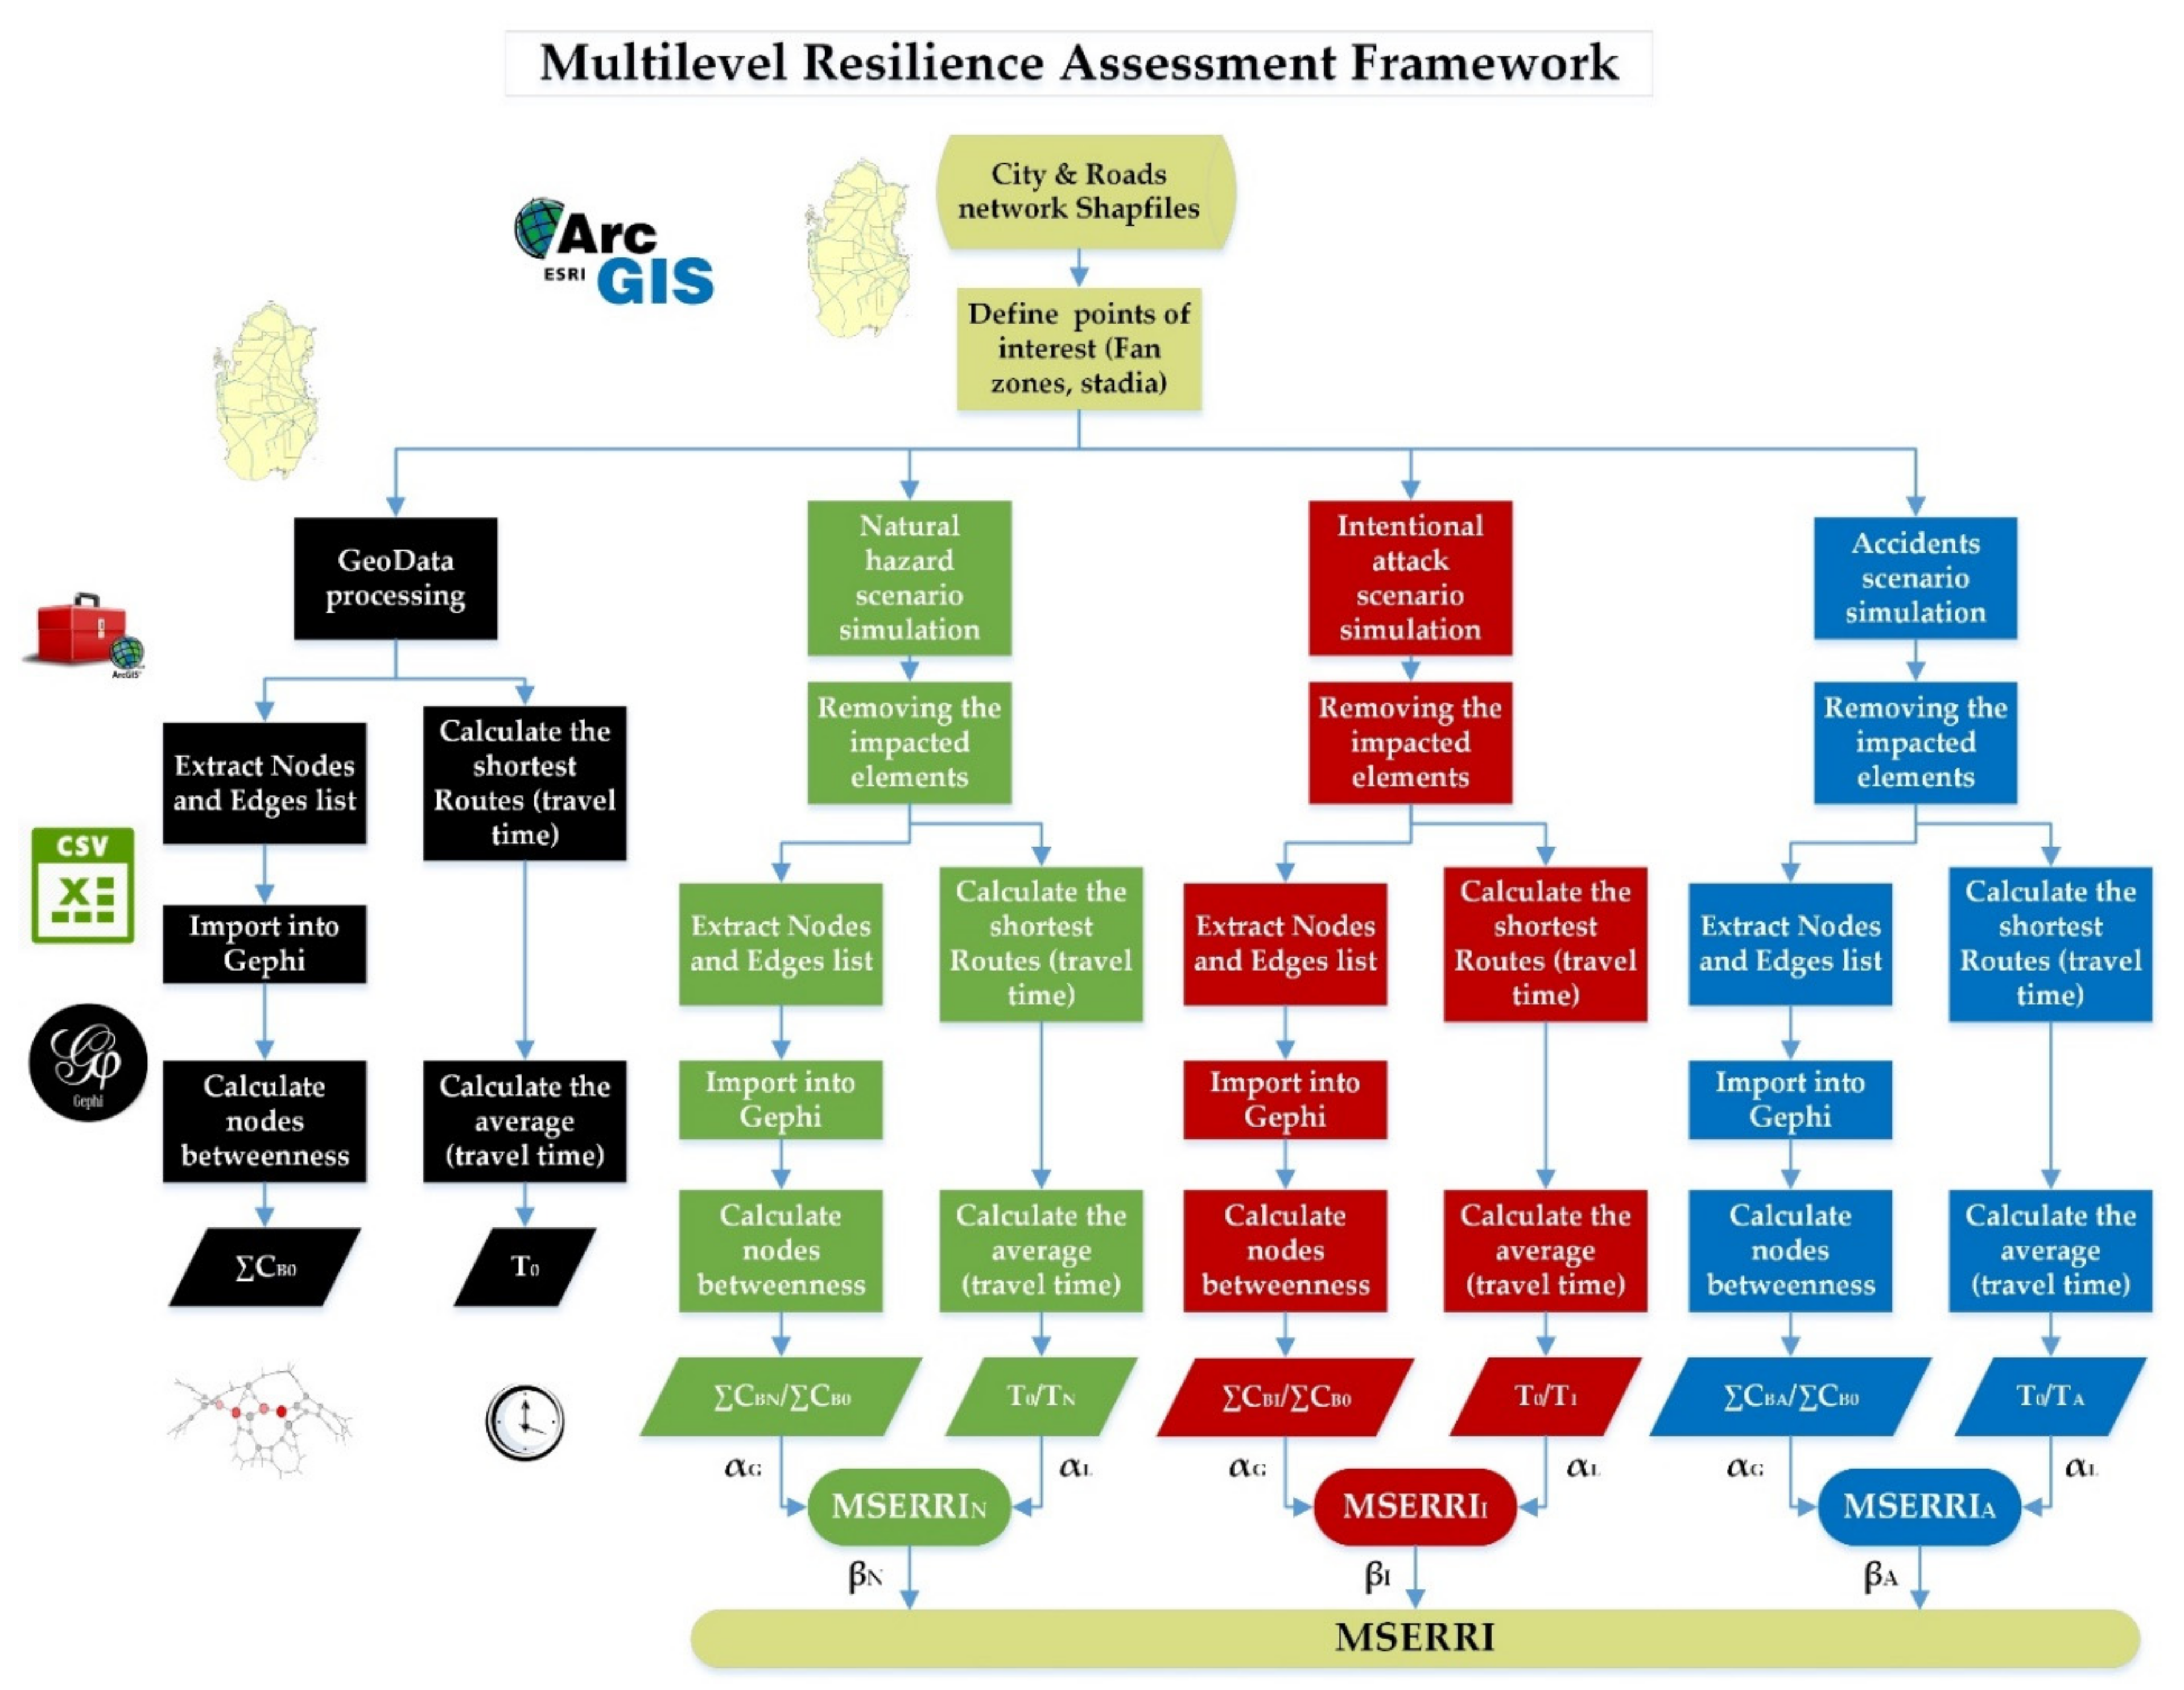
Mega Sport Events (MSEs) present a great opportunity and a formidable challenge to the host nation. Hosting an MSE presents a possibility of boosting the economy in multiple sectors, including tourism and construction, and creating a lasting legacy for the nation [13,50,51]. On the other hand, it also requires renovating infrastructures to meet the sudden increase in demands that is presented by the influx of spectators (which, in the case of the 2022 FIFA WC in Qatar, is expected to reach 50% of the population) without creating “white elephant projects” [13,52,53]. Furthermore, host nations are increasingly expected to apprehend strict environmental obligations and are encouraged to achieve carbon neutrality, promoting a trend of compact MSEs, as in the 2022 WC in Qatar, where all the stadia are within the Doha metropolitan area and the furthermost distance between venues is less than 60 km [13,52,54]. This compactness means concentrating the demands on the supporting infrastructures throughout the event, which in the WC case, extends over a month, and ensuring that these infrastructures can sustain the expected disturbances; such disturbances can range between natural hazards, intentional attacks, accidents, and failures propagated between interdependent infrastructures [55,56,57]. However, in the face of these disturbances, the main focus during MSEs should be on preserving functionality over recovery, as this is essential for maintaining an acceptable service level and ensuring a remarkable visitor experience. Among these infrastructures, the road networks play a critical role in providing mobility throughout the city and between points of interest, such as fan zones and event venues, and in affecting the visitors’ experiences and the event’s success [56].
For this study, we will focus our resilience assessment on the system’s ability to preserve functionality; functionality evaluation here refers to the evaluation of suitable performance metrics for each level. For example, it is widely accepted in the literature to use, at a network level, network centrality and cohesion as performance criteria and resilience metrics [3,41,43,58,59]. While representing a small part of the system level, it is more common to use the shortest path to travel between point A and point B or to use changes in travel pace instead [7,28,60,61,62]. Both assessment methods would result in a performance degradation metric, which can easily be compared under different scenarios and generalized for other purposes and interests.
To the best of our knowledge, no published work has suggested a framework to evaluate the resilience of road networks during MSEs to date; thus, the main objective of this research is to suggest a framework for assessing the resilience of road networks during MSEs, paving the way for considering resilience as a criterion in evaluating future host cities’ nomination profiles. The additional contribution of the suggested framework is addressing the network’s resilience on multiple levels, rather than the common approach of focusing on a single, certain level. Furthermore, the flexibility of the suggested framework to produce a combined and weighted index under different threats of interest allows for the comparability of different development plans and the evaluation of their effectiveness under the credibility of possible threats. The suggested framework focuses on urban areas and assumes that the event’s activities would be compacted to be contained in a metropolitan area. However, in the case of multiple host cities, the framework concepts could be adopted and modified to accommodate related complications, but that is out of the scope of this paper.
In the following sections, we will present the suggested framework and apply it to the Doha metropolitan as the host city for the 2022 WC in Qatar; then, we will present the results and discuss them, before, finally, providing the main conclusion, remarks, and future research directions

2. Methods

Creating a lasting legacy through an MSE means delivering a remarkable experience for the spectators; as such, they should have unrestricted exposure to the local culture and landmarks and access to various competition activities [13]. Such accessibility and exposure require a robust and effective transportation system. Furthermore, with the current trend of compact MSEs, the concentration of activities and mobility would be limited to urban transportation networks. Urban networks could include various modes, such as metros, buses, and private cars. However, metro networks, in general, lack flexibility and cannot accommodate the large influxes of demand, as is expected in such events, so the main modes of transportation that would facilitate the intended mobility would be the ones that use road networks.
To address the resilience of road networks during MSEs, we develop a framework that simultaneously assesses the network capacity at multiple levels to meet the aforementioned mobility goals under several expected disturbances. Geographical Information Systems (GIS), combined with complex network (CN) properties, form the basis of this framework. GIS is a powerful technology that allows for the extraction of various information about the real transportation network and the simulation of various disaster scenarios. CN allows for the representation of the network in a simplified way yet preserves the topological relation between its components. Furthermore, CN properties are used in many studies to assess a system’s resiliency and performance in normal situations and when under stress by focusing on connectivity metrics and network robustness.

2.1. Multilevel Resiliency Assessment

Simulating massive network behaviors under disturbances to flow and demand is a challenging and resource-intense process. To simplify this challenge, we divided the problem into two levels, focusing on more efficient resilience metrics such as connectivity (on the whole network level) and travel delays (on vital origin-destination pairs, such as fan zones and stadia). We used GIS technology to simulate the network and the consequences of extreme events, analyzed the resulting network on both levels and under the same disturbance scenarios, and combined the results into the Mega Sport Events Roads Resilience Index (MSERRI).
On the whole system level, we converted the road network into pure CN, consisting of E edges and N nodes, representing roads and intersections, respectively. During extreme events, we identified the affected nodes and edges and removed them from the network. The removal of the damaged elements would affect and change the properties of the network, which is assessed through network centrality properties. CN centrality properties include degree, closeness, and betweenness; however, we focused on using betweenness as a performance indicator. Betweenness measures the node’s role in connecting other nodes in the network [63]. More accurately, it calculates the fraction of shortest paths passing through the node and connecting pairs of other nodes, or, mathematically [64]:
C B i = s t i N σ s t i σ s t  
where:
  • C B i 
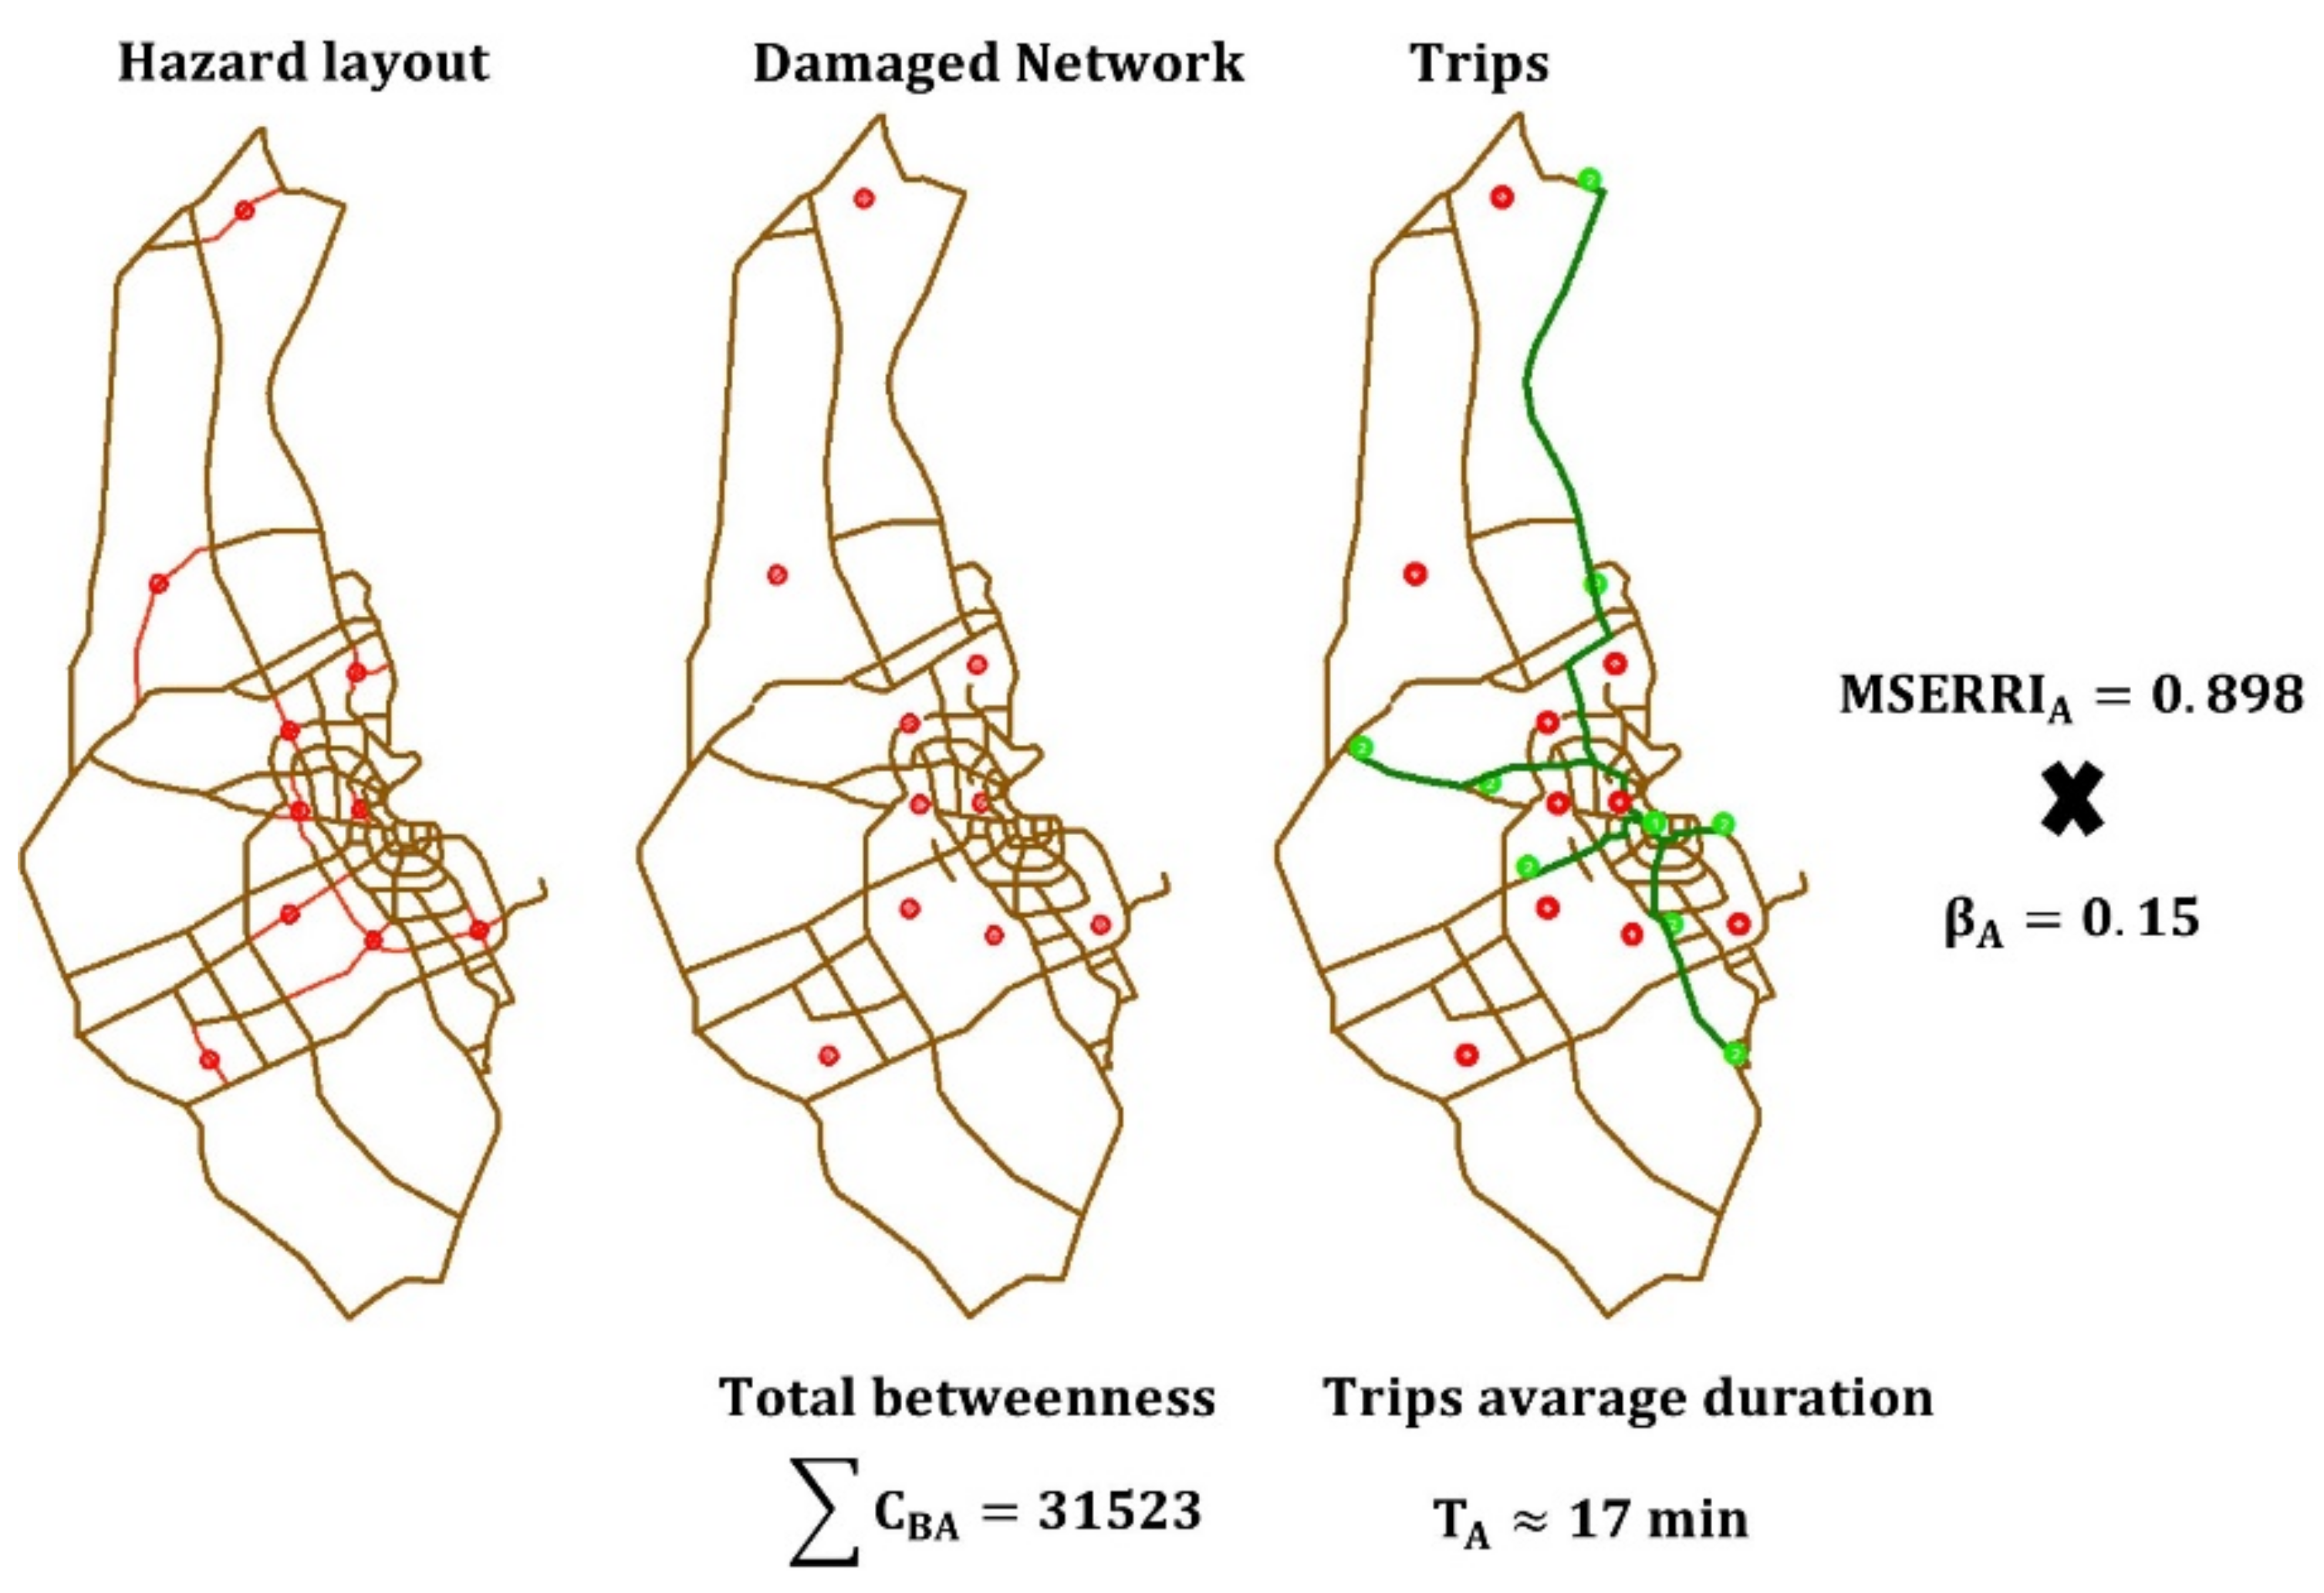
: is the betweenness centrality of node (i),
  • σ s t : is the number of shortest paths that start at node (s) and ends at node (t), and
  • σ s t i : is the number of these shortest paths that pass through the node (i).
Based on this definition, betweenness reflects the importance of specific nodes as bottlenecks in the network and the network’s cohesion [63,65]. Furthermore, betweenness allows for the detection of changes throughout the network since it considers any random pair of nodes. Under disturbances, relations between network components change and, consequently, its properties change as well. Resiliency measures how a network responds to a disturbance so that we can use betweenness as an indicator of network performance and resilience [41,43,58]. Using ArcGIS software developed by ESRI (California, USA), we processed the road network and simulated the disturbance scenarios; then, both the baseline and the damaged networks were converted into a graph using open-access tools such as (GIS F2E) [66] and further processed with CN tools such as Gephi [67] to calculate the network’s metrics.
On the vital set of the origin-destination paths level, we measured the performance based on the shortest route length. The connection between specific points of interest can be of great importance, especially during disasters or events. However, using the overall network performance metric cannot reflect the real situation of such elements. In this regard, we aimed to measure the performance of connections between valuable points (fan zones and stadia) through changes in the shortest route length. Comparing the change in performance on a set of essential links with the performance level at the whole network level and under the same disturbance allowed for a better understanding of its performance during MSEs. We used the ArcGIS network analyst plugin to identify the closest route between pairs of points in regular and disturbance conditions to perform this assessment. The loss of roads and links due to disaster can increase the distance traveled between these essential points, which can be considered as a reduction in performance. This change in performance under specific events in the city can be considered as a resilience indicator of these connections [7,60,61,62]. This concept is similar, to some extent, with betweenness centrality within the context of shortest paths; however, betweenness in pure CN does not account for distances. This measure is essential for, and complimentary to, the overall network performance and focuses on the efficiency of completing specific trips.

2.2. Disturbance Scenarios

During an MSE, several disturbances could affect the host city, including natural hazards, intentional attacks, and accidents; however, the probability and impact of these disturbances vary. In the literature, the main disturbance categories that can directly affect critical infrastructures are natural hazards, intentional attacks, and accidents [55]. However, during an MSE, the importance or credibility of these disturbances vary, and planners should have the capacity to reflect this in their design by assigning different weightings for each disturbance, based on local priorities and conditions. The impact of other critical infrastructure failures, or of failure propagations, could affect and destabilize the road network; however, such scenarios result from the hazards mentioned earlier and should be considered on a more holistic level, as suggested in [56].
Natural hazards cause large-scale and undirected damage to critical infrastructures, can be reoccurring or emerging, and are influenced by the geographical properties and climate of the region. Natural hazards, such as earthquakes and floods, have a widespread impact and can cause devastating damage to the networks. However, while earthquakes are reoccurring disasters, allowing for precaution and for regulations to limit their impact, extreme floods, on the other hand, are emerging in some regions, especially in recent years, fueled by a shift in precipitation patterns and intensities attributed to climate change [57]. To simulate the impact of natural hazards, we used nationally accepted designs and insurance maps, such as a 100-year average recurrence interval (ARI) map for floods [68,69]. Such maps use hydraulic models, peak flows, and elevation profiles to identify the inundation levels. Some inundation levels can restrict or prevent the mobility over some sections of the road networks; in other words, they can act as a hazard level, and these impacted sections can be identified by overlaying hazard maps over the road network and removing the impacted elements. Such maps are developed by emergency management agencies such as Federal Emergency Management Agency (FEMA).
The second scenario is based on an intentional attack targeting the network’s central node. This scenario considers targeting a central node with the highest betweenness centrality in order to cause the most substantial disturbance in the network; however, it can be reasonably considered in different scenarios that target a financial center or a city’s downtown [70]. Within the same context, the effect of such an attack would affect a circle with a 3 km radius around the targeted node, according to a similar scenario conducted in a study by Kermanshah et al. (2014) [70]. The nodes and elements within this buffer zone were also removed from the network.
The third scenario considers a widespread random failure, or accidents, in the network. Random failures are attributed to regular service disturbances, such as car accidents, congestions, or unexpected failures of structural elements. However, the widespread nature of such simultaneous failures and occurrences can stress the network [70]. To consider this effect and the resulting disturbance, we chose ten random points of the network and considered a circle with a 500 m radius as a buffer zone around these nodes. Moreover, we removed any nodes or links within the buffer zone.
We identified the affected links and nodes and removed them by overlaying maps resulting from each scenario on the transportation network within the GIS environment. Then, by analyzing the resulting change in network properties and traveling distances, we evaluated the resilience of the road network under each scenario. Finally, assigning different weights to each threat and level allowed us to get the MSERRI, as demonstrated in Figure 1, summarizing the suggested framework.

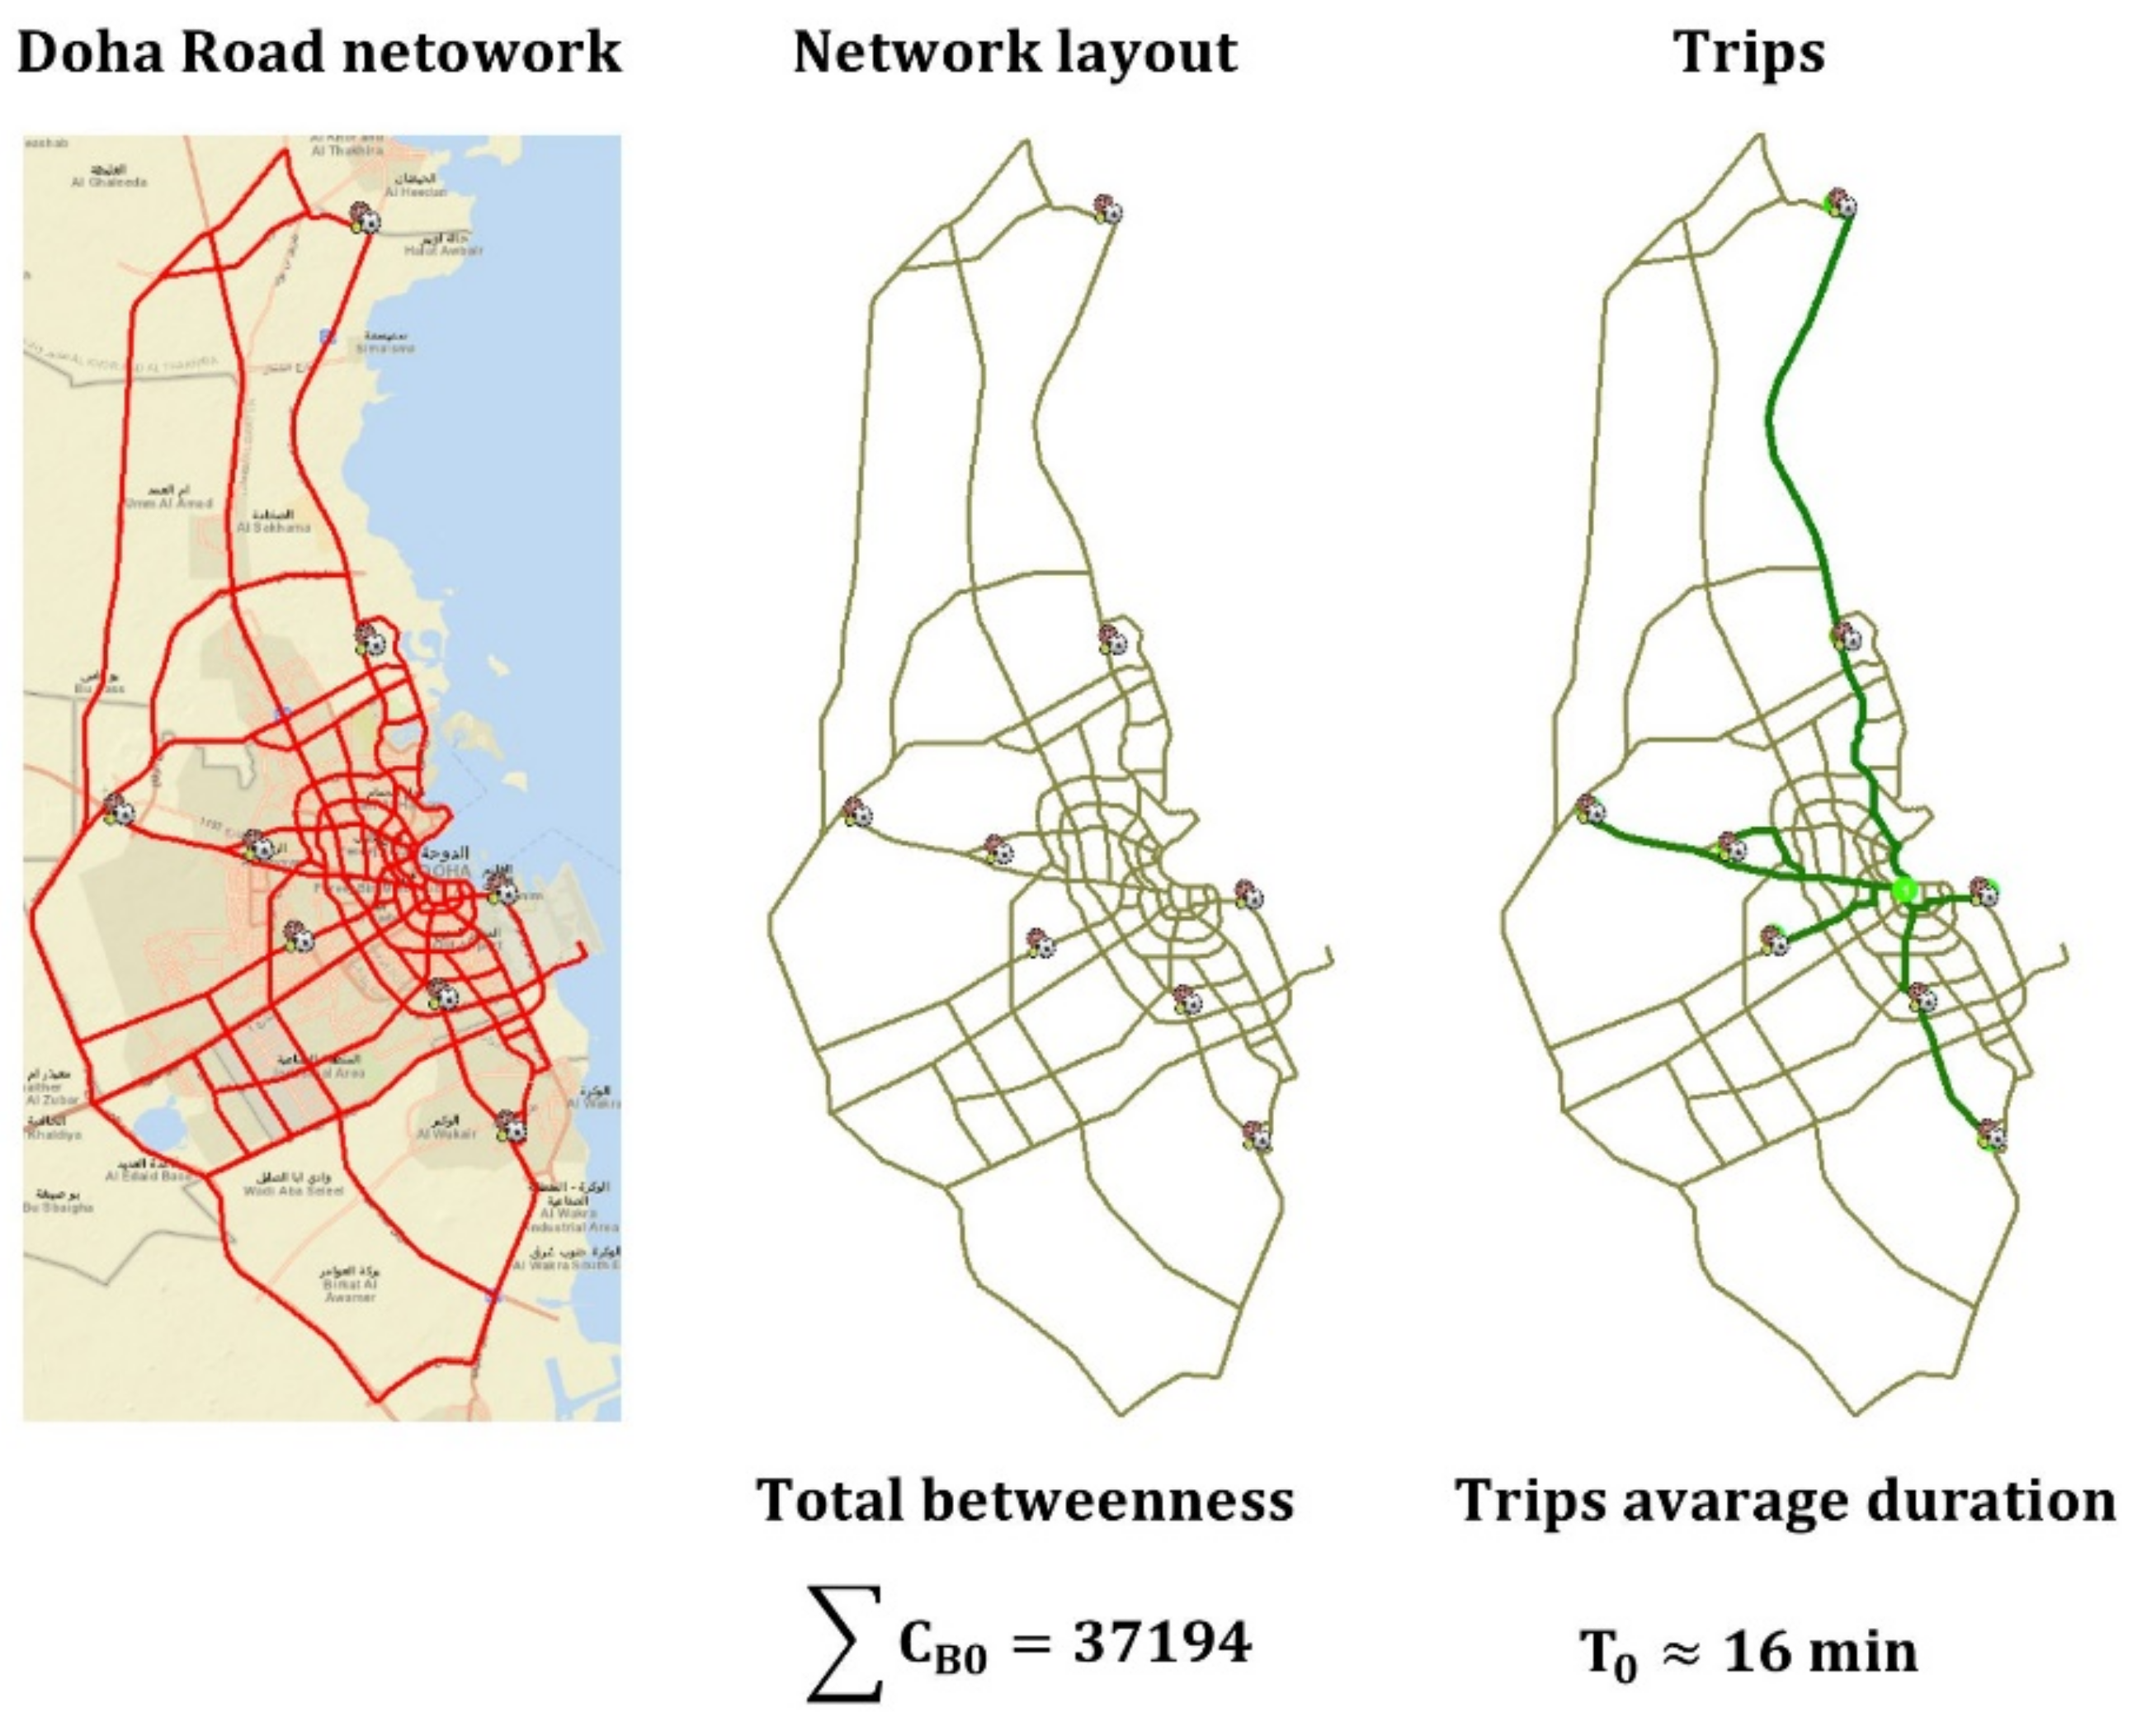
2.3. Case Study Description

The 2022 FIFA WC in Qatar is set to be the most compact WC in its current 32-team version, with all the matches being held at eight stadia that are mostly scattered within or around the Doha metropolitan area [52]. The suggested framework will be applied to the Doha road network, focusing on origin-destination pairs between the central fan zone close to the old city center and the stadia. Due to harsh summer weather and fears regarding players’ health, the competition was moved to December, a month during the winter season which witnessed unprecedented rainfalls and floods in recent years [9]; as such, we decided to consider flooding as the investigated natural hazard. In this regard, Qatar’s Ministry of Municipality and Environment (MME) has developed a flood hazard map with several hazard levels suitable for our application with 100-year ARI; detailed explanations and the scientific background are provided through the MME website [71]. We considered roads overlayed by a high hazard level (inundation depths of 61–120 cm) to be inaccessible, according to the manuals and the guidance provided by MME [71], hypothesizing that the primary means of transportation for fans would be buses. As for intentional attack and accident scenarios, they were applied as stated during the previous subsection, which correlates with similar studies in the literature [70]. As for weighting, the most significant weight was given to intentional attacks due to their severity and considering the region political sensitivity, while accidents were given low weight due to the possibility of reducing them with simple approaches, such as reducing the demand on the network by shifting to a work-from-home system during the competition. The weighting factors for natural hazards (βN), intentional attacks (βI), and accidents (βA) were, respectively, as follows: β N = 0.35 ,     β I = 0.5 ,     and     β A = 0.15 . Additionally, weighting factors for the whole network (Global level, αG) and for important trips (Local level, αL) were assumed to be equal: α G = 0.5 ,   α L = 0.5 .

3. Results and Discussion

After applying the suggested framework, including simulating different disturbance categories, it was clear that the network is severely vulnerable to flooding while being resilient towards other disturbances (intentional attacks and random accidents). The assessment results are shown and discussed in the following subsections; however, a summary of the results is presented in Table 1. Figure 2 shows the network layout and the stadia, forming the baseline case and the network metrics, including betweenness and average trip times before any disturbances.

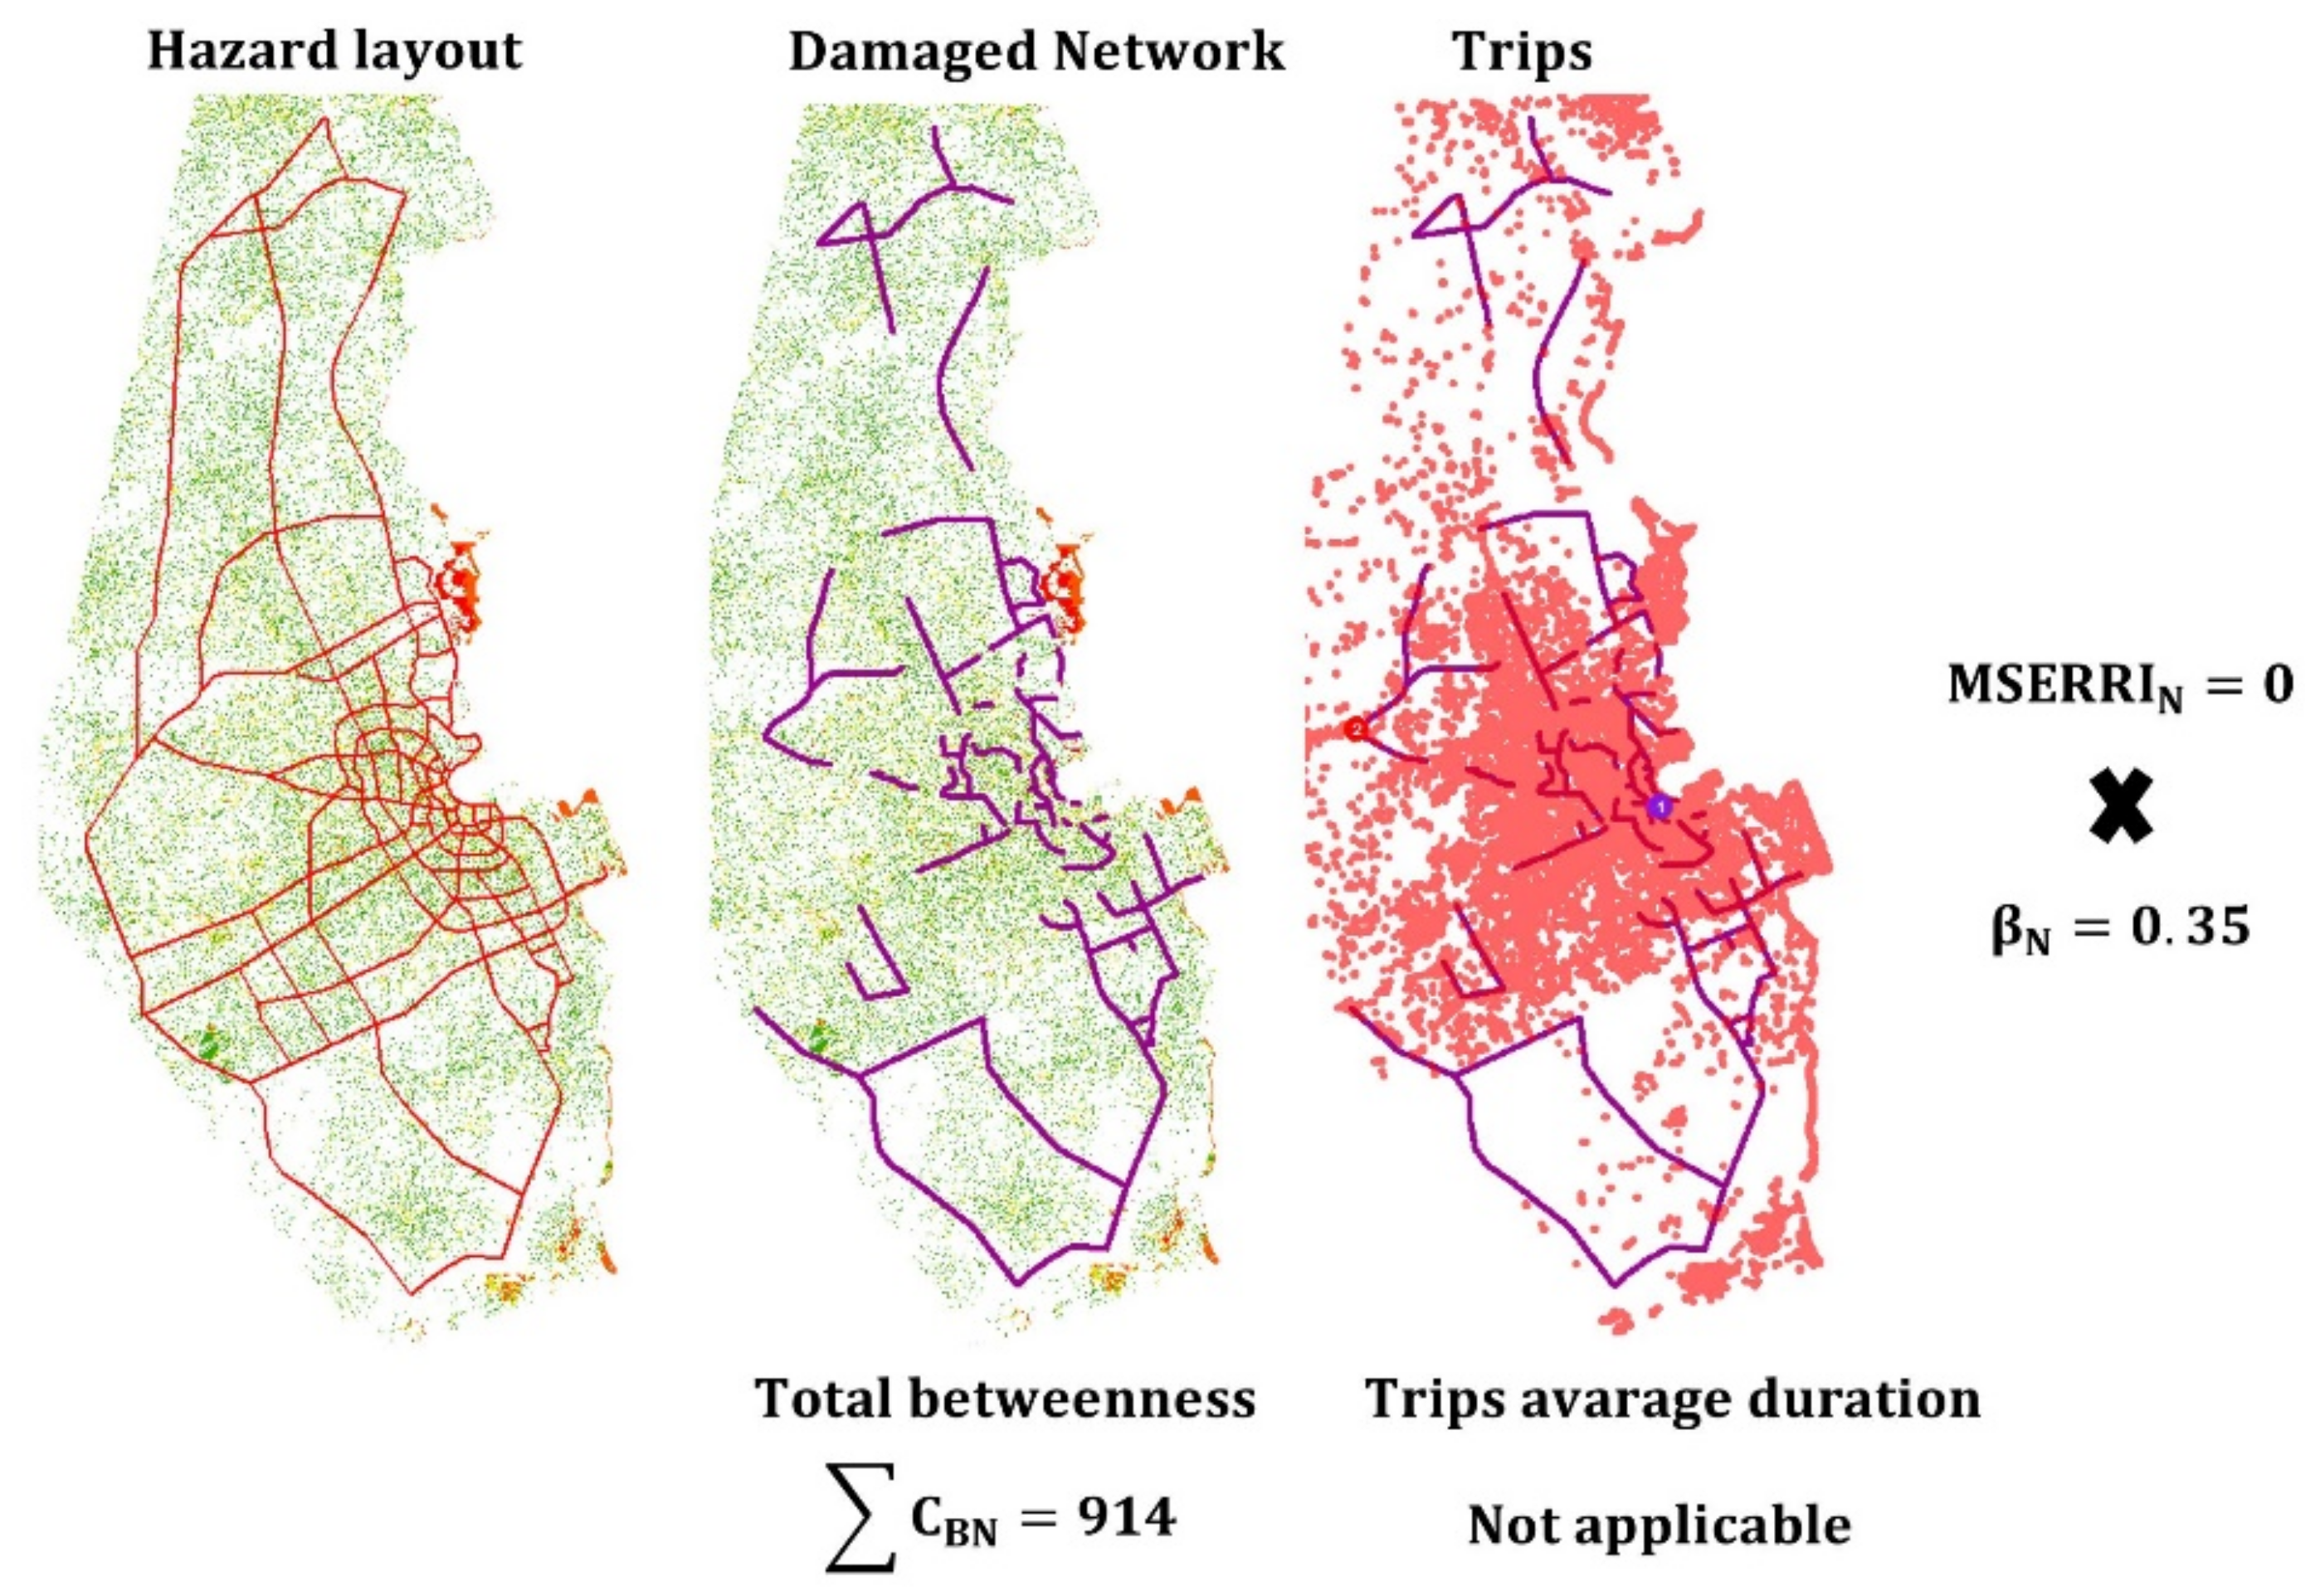
3.1. Doha Is Vulnerable to Flooding Hazards

Flooding scenarios caused complete network fragmentation and severe degradation in betweenness centrality. The flooding hazard scenario showed the worst performance, with the network suffering from complete fragmentation, as in Figure 3. Natural hazards are generally associated with large-scale impacts on infrastructure networks [57,68,70]. The large extent and severe impact of flooding on the Doha road network is reflected by the extreme reduction in the betweenness centrality, reaching almost 90%. However, this correlates with results from previous studies where road networks showed a massive reduction in betweenness centrality under extreme flooding scenarios, reaching more than 85%, as in Chicago [70], and around 65% in New York City [68].
Flooding restricted mobility in the network and prevented trips between the city center and the stadia. In addition to the reduction in betweenness, flooding restricted the mobility throughout the Doha road network, preventing the completion of any previously defined trips, compared to around 60% of uncompleted trips in Chicago [70]. This severe degradation of mobility in the network can be attributed to underestimating the flooding hazard in early development plans, due to Qatar’s arid climate and the rarity of rainfalls combined with low-elevation barren plains and a reduction in the total number of pervious surfaces due to rapid urbanization, in addition to the impacts of climate change [9]. Considering the failure of the network to provide mobility between different venues, we considered its resilience towards natural hazards equal to zero.

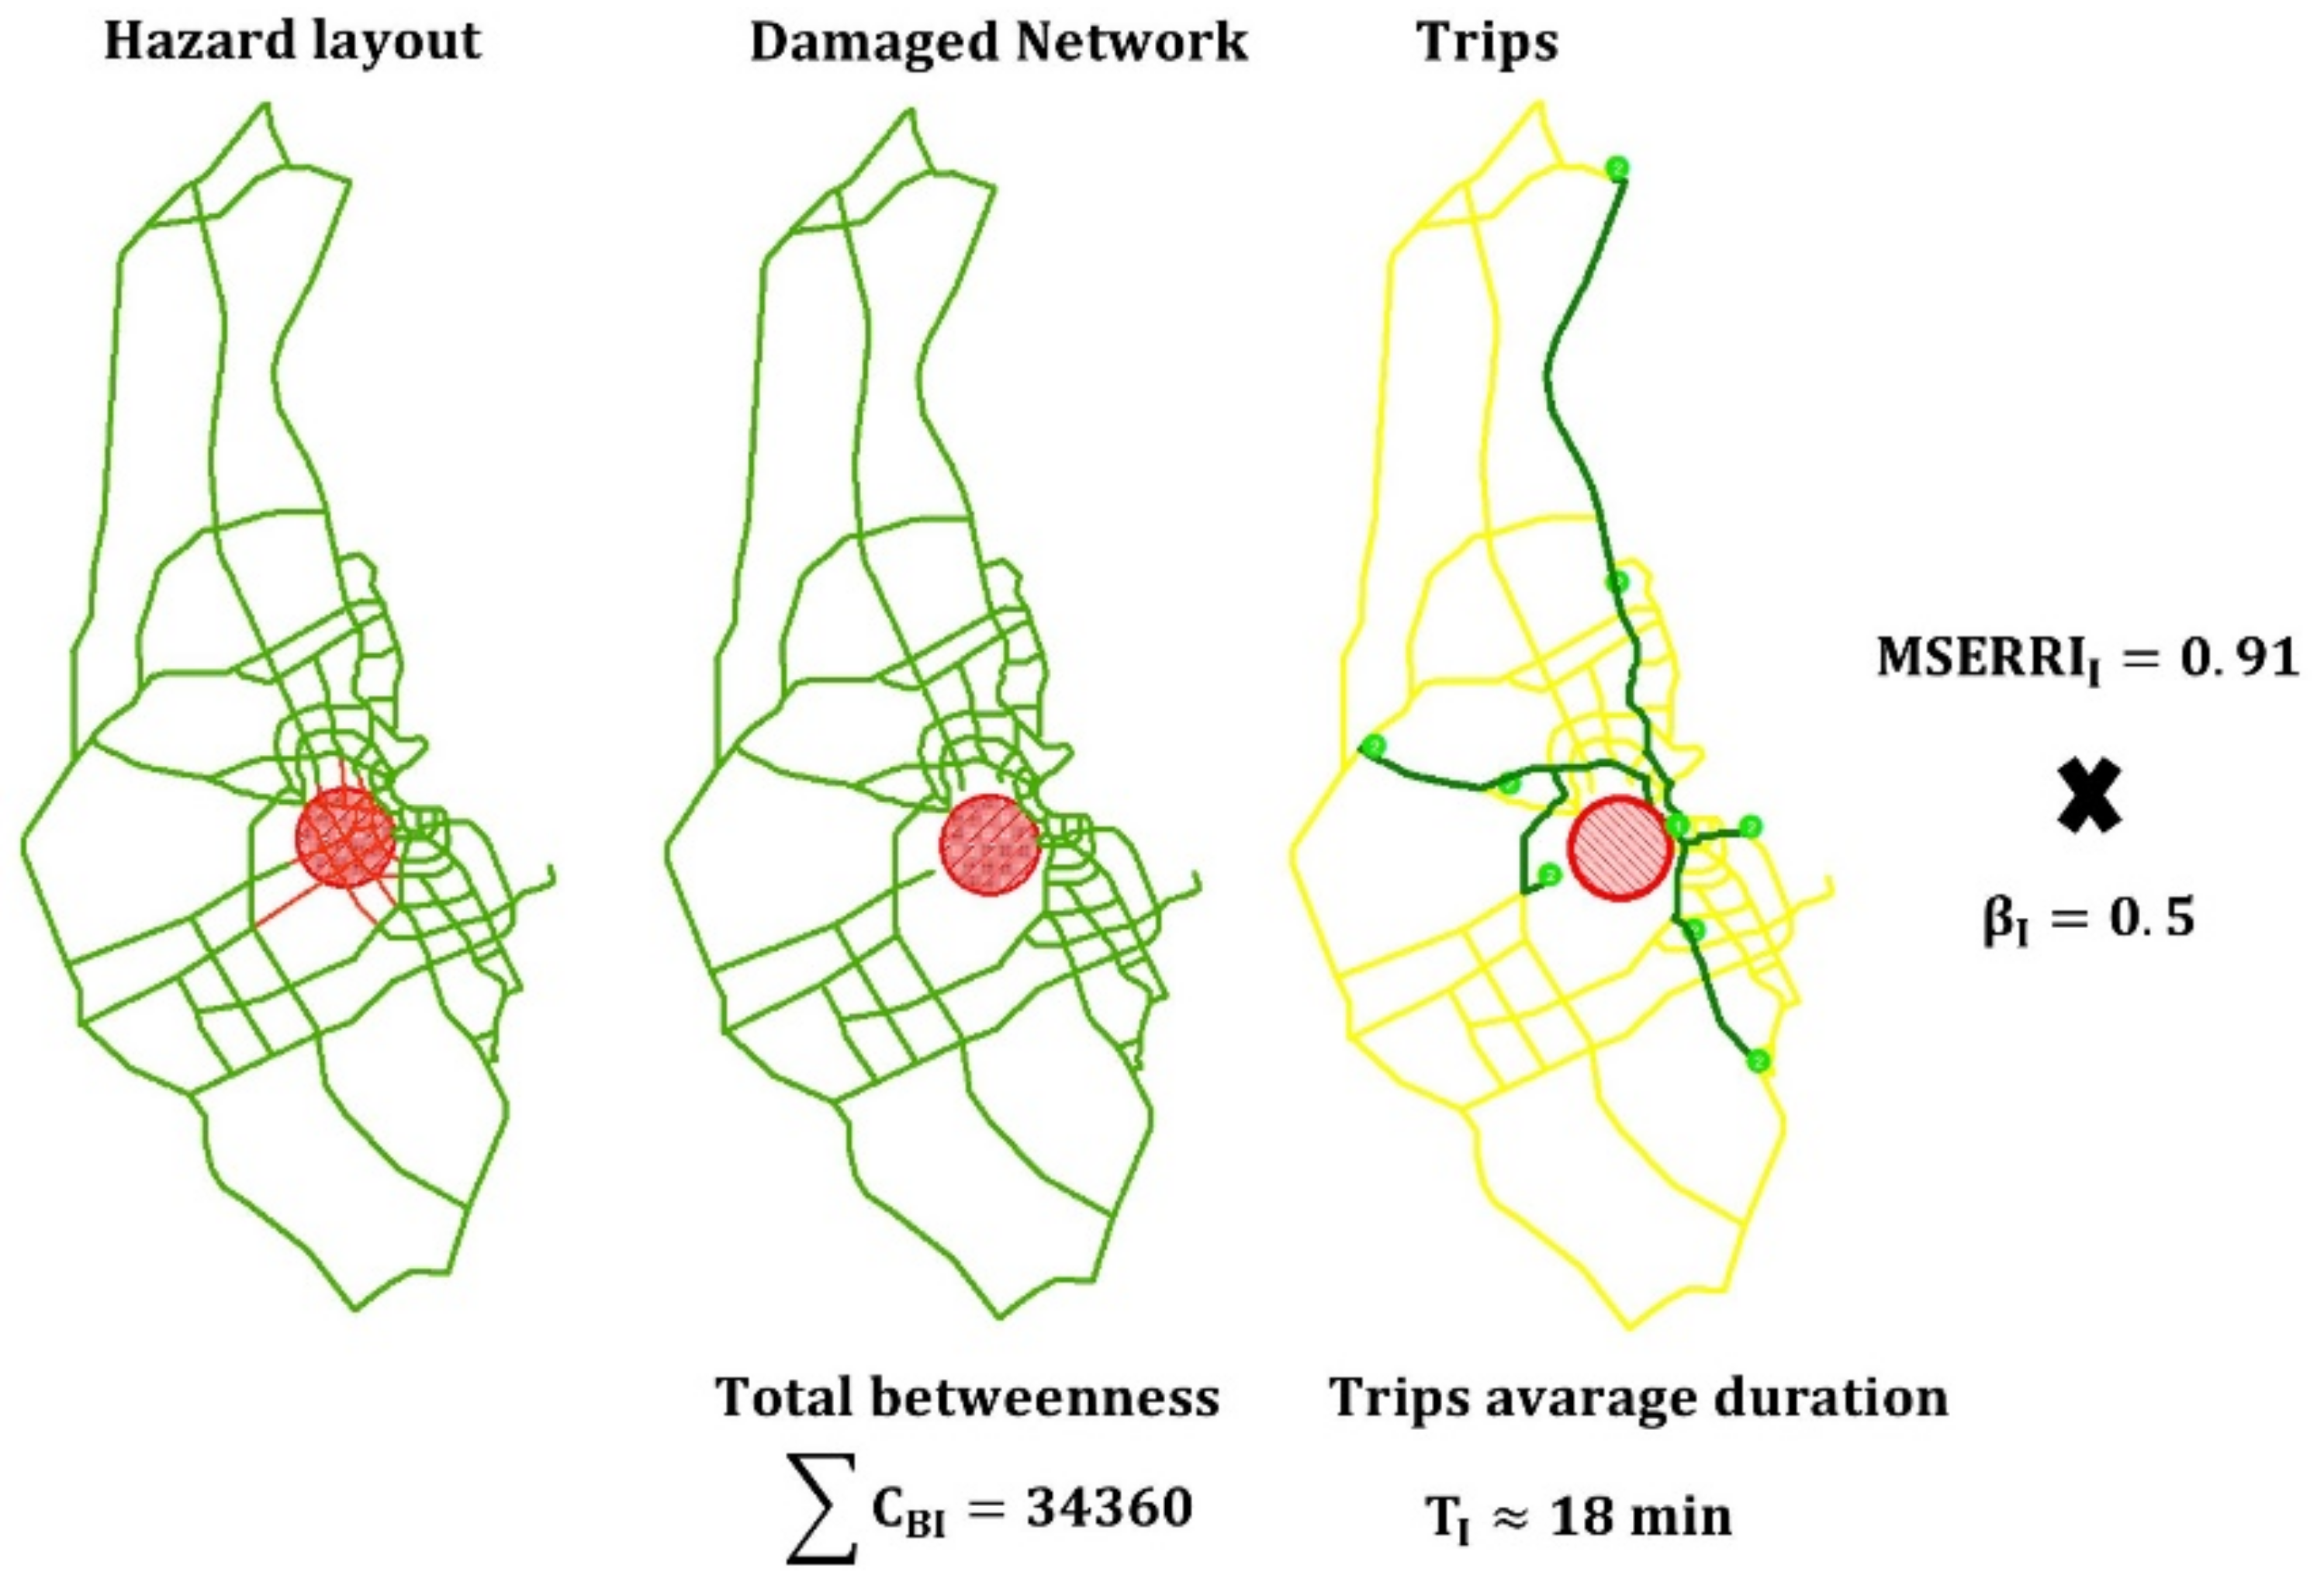
3.2. Doha Road Network Is Resilient to Intentional Attacks

During an intentional attack scenario, the Doha road network exhibited a high level of robustness and resilience. Despite being targeted on the highest betweenness node and the supposed removal of all the elements in the surrounding 3 km buffer area, the Doha road network remains intact and in good service condition. Both the betweenness and average trip time metrics did not suffer any significant degradation, even in the case of a considerable localized impact close to the city center, as shown in Figure 4, which can serve as an example of the good design and cohesion of the network.
As presented in Table 1, it is notable that the Doha road network showed an increase in the maximum betweenness value of 1242, compared to the baseline case of 1085, equal to an increase of 14%; this increase highlights the increase in the importance of alternative paths and nodes. However, as will be discussed later, we focused on the sum of all betweenness values as a more effective measure, which yielded ∑CBI = 34,360, resulting in a degradation of 8% from the baseline. The limited impact of intentional attacks on the resilience of this well-connected and well-designed road network correlates with similar studies conducted on the Chicago road network, where only 2% degradation in maximum betweenness was reported [70].
Average travel time increased slightly, causing a decrease in the performance metric. The increase in average travel time, equal to almost 2 min, can be attributed to the loss of several edges (roads) passing through the impacted buffer area. This loss of direct roads, especially close to the city center, forced the use of longer alternatives and additional turns in certain trips, while the rest of the trips remained unimpacted; subsequently, the overall degradation in this performance metric was equal to almost 11%. The impact of intentional attacks and the resulting values are shown in Figure 4, with a resilience index equal to MSERRII = 91%, resulting from using the previously presented weighting factors (αG = 0.5, αL = 0.5).

3.3. Doha Road Network Is Resilient to Accidents (Random Widespread Failures)

The Doha road network maintained a good resilience level during the accident hazards scenario, based on a limited degradation in the metrics despite a large number of affected elements. Despite the widespread nature of accident points within this scenario, with more than ten randomly scattered failure areas of 500 m surrounding buffer areas, as shown in Figure 5, the Doha road network continued to prove good performance on both metrics. With accidents assigned randomly, mostly at intersections, and the assumption of preventing the accessibility in the surrounding links within 500 m buffers, the scenario assumes an extreme, high rarity event where all such access-restrictive accidents happen simultaneously and throughout the city.
The Doha road network continues to show a high level of cohesion even after the widespread accidents scenario. During this scenario, the maximum betweenness also increased to 1228 (up by almost 13%), as in the intentional attack scenario, compared to the baseline case, presented in Table 1. However, to avoid misrepresenting the result, we used the total network betweenness as the sum of all nodes’ betweenness, resulting in a value of 31,523, reflecting a betweenness degradation of around 15%. Within this scenario, the Doha road network exhibited better performance compared to similar studies where the maximum betweenness decreased by around 30% in the Chicago road network [70], reflecting the good planning and the abundance of alternatives within the Doha road network.
Additionally, the average travel time was more than the baseline case but still better than the intentional attack scenario. The average travel time between the central station and the stadia was around 17 min, equal to a decrease in performance of almost 6% compared to the baseline, but this performance is still better than the intentional attack scenario. Furthermore, in the Doha road network, all trips continue to reach their destinations with small delays, compared with 4% of uncompleted trips and 52% of longer trips in the Chicago network [70]. Based on the result and weighting factors, the resulted resilience index towards accidents was almost MSERRIA = 90%.
The value of the overall resilience index for the Doha road network during MSE, based on the suggested framework, is:
MSERRI = β N MSERRI N + β I MSERRI I + β A MSERRI A
= 0.35 0 + 0.5 0.91 + 0.15 0.9 = 0.59
We can notice that the lack of resilience during natural hazards jeopardized the overall resilience, with the network performing quite well during other scenarios.
Although previous studies highlighted the importance and effectiveness of maximum betweenness for assessing large infrastructure networks, maximum betweenness may reflect only a part of the performance [70,72,73]. This limitation is clearly encountered during this study, as we repeatedly dealt with cases where the maximum betweenness increased, which is rational considering the development of bottlenecks in the network after the disturbances. This problem could be encountered in any network where the damage does not lead to network fragmentation, associated with an increase of the importance of the remaining critical links. To address this issue, we suggested using the sum of betweenness of all nodes, or total network betweenness, which can always return a value less than the baseline case and thus reflect the resulted degradation in the cohesion of the network. This approach correlates with results reported in the literature where the sum of betweenness increases along with the increase of the size of the network [74].

4. Conclusions and Outlook

Mega Sport Events (MSEs) are a sign of the host nation’s ambition and capacity, and can act as a catalyst to boost development plans and reshape its economy, including tourism and construction, creating a lasting legacy for the nation. However, host nations are increasingly expected to apprehend strict environmental obligations and be encouraged to achieve carbon neutrality, promoting a compact MSE, as in the 2022 WC in Qatar. Furthermore, during MSEs, this compactness means concentrating the demands on the supporting infrastructures throughout the event and ensuring that these infrastructures would sustain the expected disturbances; the road networks are the most prominent among these infrastructures. Road networks are expected to provide mobility for visitors between fan zones and event venues and accessibility throughout the city, thus directly affecting visitors’ experiences and the event’s success. Additionally, road networks should enjoy the capacity to preserve an acceptable level of functionality to provide these services during any possible disturbance scenario; in other words, they should have resilience.
In this study, we develop a framework to assess the resilience of road networks during MSEs, focusing on multilevel assessments during several disturbance scenarios subjected to varying weighting factors. The suggested framework assesses the cohesion of the network through a complex network approach based on betweenness centrality and the mobility between the event’s hotspots, such as the venues and a central fan zone, using the average trip time. Several disturbance scenarios were considered, ranging from natural hazards, intentional attacks, and accidents. Weighting factors prioritized the importance of certain disturbances and impeded flexibility in the framework based on designer interests and concerns.
During the application of the framework on the Doha road network, the network exhibited a high level of resilience on both levels during intentional attacks and random failure scenarios, attributed to the good design practices and the abundance of alternatives. On the other hand, during the scenario of flooding as the simulated natural hazard, the network suffered an extreme degradation and fragmentation, preventing access to any of the stadia. Despite the high performance in other scenarios, the lack of resilience towards flooding severely affected the resilience index during MSEs. These results highlight the urgent need to revisit storm-management plans and adopt practical approaches to prevent such degradation, especially as the WC will be held during the winter season, which has witnessed unprecedented precipitation events over the last decade associated with the impacts of climate change.
The proposed framework considers the first attempt to address the resilience of road networks during MSEs. Considering the limited literature in this regard, we hope such research would pave the way for other researchers to address this topic with all its potential, considering the sensitivity and huge investments associated with MSEs. Additionally, this study is a first step in creating a holistic assessment of urban resilience during MSEs, including other critical infrastructures [56]. However, future research can customize this framework for considering multiple fan zones, instead of central gathering zones, or incorporate several modes of transportation, such as metros and buses, based on their expected share of travelers, or assess the possibility of compensating for the lost capacity or the possibility of bridging the lost elements of other modes of transportation. On the other hand, future studies can revise this framework to include several improvements, such as weighted graphs to improve its accuracy, or incorporate multiple assessment approaches, such as game theory, in an intentional attack scenario. Furthermore, this study aims to direct attention towards the importance of resilience assessments during MSEs as a vital part of ensuring their success in creating a lasting positive legacy, preserving sustainable developments, and to maybe be used as a criterion for evaluating the hosting nations’ profiles to prevent ill-planning and resource-wasting.

Author Contributions

Conceptualization and methodology, M.Z.S. and S.G.A.-G.; data-gathering, investigating, visualization, M.Z.S.; funding-acquisition and supervision, S.G.A.-G. writing, M.Z.S.; writing—review and editing, S.G.A.-G. All authors have read and agreed to the published version of the manuscript.

Funding

This publication was made possible by National Priorities Research Program (NPRP) grant (NPRP12S-0212-190073) from the Qatar National Research Fund (QNRF), a member of the Qatar Foundation (QF). Any opinions, findings, and conclusions or recommendations expressed in this material are those of the author(s) and do not necessarily reflect the views of QNRF or QF.

Institutional Review Board Statement

Not applicable.

Informed Consent Statement

Not applicable.

Data Availability Statement

All data, models, and code generated or used during the study appear in the submitted article.

Conflicts of Interest

The authors declare no conflict of interest.

References

  1. United Nations, Department of Economic and Social Affairs. World Urbanization Prospects: The 2018 Revision; United Nations: New York, NY, USA, 2019. [Google Scholar]
  2. Addanki, S.C.; Venkataraman, H. Greening the economy: A review of urban sustainability measures for developing new cities. Sustain. Cities Soc. 2017, 32, 1–8. [Google Scholar] [CrossRef]
  3. Liu, W.; Song, Z. Review of studies on the resilience of urban critical infrastructure networks. Reliab. Eng. Syst. Saf. 2020, 193, 106617. [Google Scholar] [CrossRef]
  4. The Resilience Shift. The Resilience Shift Website. Available online: http://resilienceshift.org (accessed on 18 November 2019).
  5. Duy, P.N.; Chapman, L.; Tight, M. Resilient transport systems to reduce urban vulnerability to floods in emerging-coastal cities: A case study of Ho Chi Minh City, Vietnam. Travel Behav. Soc. 2019, 15, 28–43. [Google Scholar] [CrossRef]
  6. Huck, A.; Monstadt, J. Urban and infrastructure resilience: Diverging concepts and the need for cross-boundary learning. Environ. Sci. Policy 2019, 100, 211–220. [Google Scholar] [CrossRef]
  7. Ilbeigi, M. Statistical process control for analyzing resilience of transportation networks. Int. J. Disaster Risk Reduct. 2019, 33, 155–161. [Google Scholar] [CrossRef]
  8. Schleussner, C.-F.; Donges, J.F.; Donner, R.V.; Schellnhuber, H.J. Armed-conflict risks enhanced by climate-related disasters in ethnically fractionalized countries. Proc. Natl. Acad. Sci. USA 2016, 113, 9216–9221. [Google Scholar] [CrossRef] [Green Version]
  9. Salimi, M.; Al-Ghamdi, S.G. Climate change impacts on critical urban infrastructure and urban resiliency strategies for the Middle East. Sustain. Cities Soc. 2020, 54, 101948. [Google Scholar] [CrossRef]
  10. Raleigh, C. Political Marginalization, Climate Change, and Conflict in African Sahel States. Int. Stud. Rev. 2010, 12, 69–86. [Google Scholar] [CrossRef]
  11. Raouf, A.M.; Al-Ghamdi, S.G. Effectiveness of Project Delivery Systems in Executing Green Buildings. J. Constr. Eng. Manag. 2019, 145, 03119005. [Google Scholar] [CrossRef]
  12. Wan, C.; Yang, Z.; Zhang, D.; Yan, X.; Fan, S. Resilience in transportation systems: A systematic review and future directions. Transp. Rev. 2018, 38, 479–498. [Google Scholar] [CrossRef]
  13. Meza Talavera, A.; Al-Ghamdi, S.; Koç, M. Sustainability in Mega-Events: Beyond Qatar 2022. Sustainability 2019, 11, 6407. [Google Scholar] [CrossRef] [Green Version]
  14. Holling, C.S. Resilience and Stability of Ecological Systems. Annu. Rev. Ecol. Syst. 1973, 4, 1–23. [Google Scholar] [CrossRef] [Green Version]
  15. Chan, R.; Schofer, J.L. Measuring Transportation System Resilience: Response of Rail Transit to Weather Disruptions. Nat. Hazards Rev. 2016, 17, 05015004. [Google Scholar] [CrossRef]
  16. Abedi, A.; Gaudard, L.; Romerio, F. Review of major approaches to analyze vulnerability in power system. Reliab. Eng. Syst. Saf. 2019, 183, 153–172. [Google Scholar] [CrossRef]
  17. Hosseini, S.; Barker, K.; Ramirez-Marquez, J.E. A review of definitions and measures of system resilience. Reliab. Eng. Syst. Saf. 2016, 145, 47–61. [Google Scholar] [CrossRef]
  18. Bruneau, M.; Chang, S.E.; Eguchi, R.T.; Lee, G.C.; O’Rourke, T.D.; Reinhorn, A.M.; Shinozuka, M.; Tierney, K.; Wallace, W.A.; Von Winterfeldt, D. A Framework to Quantitatively Assess and Enhance the Seismic Resilience of Communities. Earthq. Spectra 2003, 19, 733–752. [Google Scholar] [CrossRef] [Green Version]
  19. Faturechi, R.; Miller-Hooks, E. Measuring the Performance of Transportation Infrastructure Systems in Disasters: A Comprehensive Review. J. Infrastruct. Syst. 2015, 21, 04014025. [Google Scholar] [CrossRef]
  20. Gasser, P.; Suter, J.; Cinelli, M.; Spada, M.; Burgherr, P.; Hirschberg, S.; Kadziński, M.; Stojadinović, B. Comprehensive resilience assessment of electricity supply security for 140 countries. Ecol. Indic. 2020, 110, 105731. [Google Scholar] [CrossRef]
  21. Najafi, J.; Peiravi, A.; Anvari-Moghaddam, A.; Guerrero, J.M. Resilience improvement planning of power-water distribution systems with multiple microgrids against hurricanes using clean strategies. J. Clean. Prod. 2019, 223, 109–126. [Google Scholar] [CrossRef]
  22. Chakrabarti, S. Eutrophication—A Global Aquatic Environmental Problem: A Review. Res. Rev. J. Ecol. Environ. Sci. 2018, 6, 1–6. [Google Scholar]
  23. Meng, Y.; Yang, Y.; Chung, H.; Lee, P.-H.; Shao, C. Enhancing Sustainability and Energy Efficiency in Smart Factories: A Review. Sustainability 2018, 10, 4779. [Google Scholar] [CrossRef] [Green Version]
  24. Ferrari, P. The dynamics of the competition between cars and trucks on motorways. Transp. Res. Part C Emerg. Technol. 2011, 19, 579–592. [Google Scholar] [CrossRef]
  25. Serulle, N.U.; Heaslip, K.; Brady, B.; Louisell, W.C.; Collura, J. Resiliency of Transportation Network of Santo Domingo, Dominican Republic. Transp. Res. Rec. J. Transp. Res. Board 2011, 2234, 22–30. [Google Scholar] [CrossRef]
  26. Casalicchio, E.; Galli, E.; Tucci, S. Agent-based modelling of interdependent critical infrastructures. Int. J. Syst. Syst. Eng. 2010, 2, 60. [Google Scholar] [CrossRef] [Green Version]
  27. Sun, W.; Bocchini, P.; Davison, B.D. Resilience metrics and measurement methods for transportation infrastructure: The state of the art. Sustain. Resilient Infrastruct. 2020, 5, 168–199. [Google Scholar] [CrossRef]
  28. Donovan, B.; Work, D.B. Empirically quantifying city-scale transportation system resilience to extreme events. Transp. Res. Part C Emerg. Technol. 2017, 79, 333–346. [Google Scholar] [CrossRef] [Green Version]
  29. Serdar, M.Z.; Koç, M.; Al-Ghamdi, S.G. Urban Transportation Networks Resilience: Indicators, Disturbances, and Assessment Methods. Sustain. Cities Soc. 2021, 76, 103452. [Google Scholar] [CrossRef]
  30. Aydin, N.Y.; Duzgun, H.S.; Heinimann, H.R.; Wenzel, F.; Gnyawali, K.R. Framework for improving the resilience and recovery of transportation networks under geohazard risks. Int. J. Disaster Risk Reduct. 2018, 31, 832–843. [Google Scholar] [CrossRef]
  31. Wang, Y.; Zhan, J.; Xu, X.; Li, L.; Chen, P.; Hansen, M. Measuring the resilience of an airport network. Chinese J. Aeronaut. 2019, 32, 2694–2705. [Google Scholar] [CrossRef]
  32. Liao, T.-Y.; Hu, T.-Y.; Ko, Y.-N. A resilience optimization model for transportation networks under disasters. Nat. Hazards 2018, 93, 469–489. [Google Scholar] [CrossRef]
  33. Sommer, M.; Tomforde, S.; Hähner, J. An Organic Computing Approach to Resilient Traffic Management. In Autonomic Road Transport Support Systems; Springer International Publishing: Cham, Switzerland, 2016; pp. 113–130. [Google Scholar]
  34. Ye, Q.; Ukkusuri, S.V. Resilience as an Objective in the Optimal Reconstruction Sequence for Transportation Networks. J. Transp. Saf. Secur. 2015, 7, 91–105. [Google Scholar] [CrossRef]
  35. Haznagy, A.; Fi, I.; London, A.; Nemeth, T. Complex network analysis of public transportation networks: A comprehensive study. In Proceedings of the 2015 International Conference on Models and Technologies for Intelligent Transportation Systems (MT-ITS), Budapest, Hungary, 3–5 June 2015; IEEE: Piscataway, NJ, USA, 2015; pp. 371–378. [Google Scholar]
  36. Zhang, J.; Wang, S.; Wang, X. Comparison analysis on vulnerability of metro networks based on complex network. Phys. A Stat. Mech. Appl. 2018, 496, 72–78. [Google Scholar] [CrossRef]
  37. Zhenwu, S.; Xianyu, T.; Huiyu, L.; Hui, L.; Jie, L.; Xunguo, L. Quantitative Study on the Waterlogging Resilience of Road Transportation System Based on the Validity View of System Functions. J. Eng. Sci. Technol. Rev. 2019, 12, 117–125. [Google Scholar] [CrossRef]
  38. Cerqueti, R.; Ferraro, G.; Iovanella, A. Measuring network resilience through connection patterns. Reliab. Eng. Syst. Saf. 2019, 188, 320–329. [Google Scholar] [CrossRef] [Green Version]
  39. Testa, A.C.; Furtado, M.N.; Alipour, A. Resilience of Coastal Transportation Networks Faced with Extreme Climatic Events. Transp. Res. Rec. J. Transp. Res. Board 2015, 2532, 29–36. [Google Scholar] [CrossRef]
  40. Bell, M.G.H. Measuring network reliability: A game theoretic approach. J. Adv. Transp. 1999, 33, 135–146. [Google Scholar] [CrossRef]
  41. Akbarzadeh, M.; Memarmontazerin, S.; Derrible, S.; Salehi Reihani, S.F. The role of travel demand and network centrality on the connectivity and resilience of an urban street system. Transportation 2019, 46, 1127–1141. [Google Scholar] [CrossRef]
  42. Cheng, M.X.; Crow, M.; Ye, Q. A game theory approach to vulnerability analysis: Integrating power flows with topological analysis. Int. J. Electr. Power Energy Syst. 2016, 82, 29–36. [Google Scholar] [CrossRef] [Green Version]
  43. Sarlas, G.; Páez, A.; Axhausen, K.W. Betweenness-accessibility: Estimating impacts of accessibility on networks. J. Transp. Geogr. 2020, 84, 102680. [Google Scholar] [CrossRef]
  44. Ortega, E.; Martín, B.; Aparicio, Á. Identification of critical sections of the Spanish transport system due to climate scenarios. J. Transp. Geogr. 2020, 84, 102691. [Google Scholar] [CrossRef]
  45. Twumasi-Boakye, R.; Sobanjo, J.O. Resilience of Regional Transportation Networks Subjected to Hazard-Induced Bridge Damages. J. Transp. Eng. Part A Syst. 2018, 144, 04018062. [Google Scholar] [CrossRef] [Green Version]
  46. Yang, Y.; Ng, S.T.; Zhou, S.; Xu, F.J.; Li, H. Physics-driven based resilience analysis of interdependent civil infrastructure systems—A Case study in Hong Kong. In Proceedings of the Computing in Civil Engineering 2019, Atlanta, GA, USA, 17–19 June 2019; American Society of Civil Engineers: Reston, VA, USA, 2019; pp. 563–569. [Google Scholar]
  47. Pagani, G.A.; Aiello, M. A complex network approach for identifying vulnerabilities of the medium and low voltage grid. Int. J. Crit. Infrastruct. 2015, 11, 36. [Google Scholar] [CrossRef]
  48. Zio, E.; Golea, L.R. Analyzing the topological, electrical and reliability characteristics of a power transmission system for identifying its critical elements. Reliab. Eng. Syst. Saf. 2012, 101, 67–74. [Google Scholar] [CrossRef] [Green Version]
  49. Cuadra, L.; Salcedo-Sanz, S.; Del Ser, J.; Jiménez-Fernández, S.; Geem, Z. A Critical Review of Robustness in Power Grids Using Complex Networks Concepts. Energies 2015, 8, 9211–9265. [Google Scholar] [CrossRef] [Green Version]
  50. Preuss, H. The Contribution of the FIFA World Cup and the Olympic Games to Green Economy. Sustainability 2013, 5, 3581–3600. [Google Scholar] [CrossRef] [Green Version]
  51. Borchers, M.; Kedia, S.; Trusen, C. Sustainable Mega-Events in Developing Countries: Experiences and Insights from Host Cities in South Africa, India and Brazil; Konrad Adenauer Stiftung: Johannesburg, South Africa, 2011; ISBN 978-0-9870243-0-5. [Google Scholar]
  52. The Supreme Committee for Delivery and Legacy. The Supreme Committee for Delivery and Legacy (Sustainability Policy). Available online: https://www.qatar2022.qa/en/about/sustainability (accessed on 10 October 2020).
  53. Azzali, S. Mega-events and urban planning: Doha as a case study. URBAN Des. Int. 2017, 22, 3–12. [Google Scholar] [CrossRef]
  54. Weiler, J.; Mohan, A. The Olympic Games and the Triple Bottom Line of Sustainability: Opportunities and Challenges. Int. J. Sport Soc. 2010, 1, 187–202. [Google Scholar] [CrossRef] [Green Version]
  55. Butry, D.; Davis, C.A.; Malushte, S.R.; Medina, R.A.; Taha, M.R.; van de Lindt, J.W.; Brett, C.R.; Daghash, S.; Field, C.; Fung, J.; et al. Hazard-Resilient Infrastructure; Ayyub, B.M., Ed.; American Society of Civil Engineers: Reston, VA, USA, 2021; ISBN 9780784415757. [Google Scholar]
  56. Serdar, M.Z.; Koc, M.; Al-Ghamdi, S.G. Urban Infrastructure Resilience Assessment During Mega Sport Events Using a Multi-Criteria Approach. Front. Sustain. 2021, 2, 41. [Google Scholar] [CrossRef]
  57. Serdar, M.Z.; Al-Ghamdi, S.G. Preparing for the Unpredicted: A Resiliency Approach in Energy System Assessment. In Green Energy and Technology; Ren, J., Ed.; Springer International Publishing: Cham, Switzerland, 2021; pp. 183–201. ISBN 978-3-030-67529-5. [Google Scholar]
  58. Yadav, N.; Chatterjee, S.; Ganguly, A.R. Resilience of Urban Transport Network-of-Networks under Intense Flood Hazards Exacerbated by Targeted Attacks. Sci. Rep. 2020, 10, 10350. [Google Scholar] [CrossRef]
  59. Zhang, D.; Du, F.; Huang, H.; Zhang, F.; Ayyub, B.M.; Beer, M. Resiliency assessment of urban rail transit networks: Shanghai metro as an example. Saf. Sci. 2018, 106, 230–243. [Google Scholar] [CrossRef]
  60. Soltani-Sobh, A.; Heaslip, K.; El Khoury, J. Estimation of road network reliability on resiliency: An uncertain based model. Int. J. Disaster Risk Reduct. 2015, 14, 536–544. [Google Scholar] [CrossRef]
  61. Ukkusuri, S.V.; Yushimito, W.F. A methodology to assess the criticality of highway transportation networks. J. Transp. Secur. 2009, 2, 29–46. [Google Scholar] [CrossRef]
  62. Yin, Y.; Ieda, H. Assessing Performance Reliability of Road Networks Under Nonrecurrent Congestion. Transp. Res. Rec. J. Transp. Res. Board 2001, 1771, 148–155. [Google Scholar] [CrossRef]
  63. Casali, Y.; Heinimann, H.R. Robustness response of the Zurich road network under different disruption processes. Comput. Environ. Urban Syst. 2020, 81, 101460. [Google Scholar] [CrossRef]
  64. Freeman, L.C. Centrality in social networks conceptual clarification. Soc. Netw. 1978, 1, 215–239. [Google Scholar] [CrossRef] [Green Version]
  65. Pregnolato, M.; Ford, A.; Robson, C.; Glenis, V.; Barr, S.; Dawson, R. Assessing urban strategies for reducing the impacts of extreme weather on infrastructure networks. R. Soc. Open Sci. 2016, 3, 160023. [Google Scholar] [CrossRef] [Green Version]
  66. Karduni, A.; Kermanshah, A.; Derrible, S. A protocol to convert spatial polyline data to network formats and applications to world urban road networks. Sci. Data 2016, 3, 160046. [Google Scholar] [CrossRef]
  67. Bastian, M.; Heymann, S.; Jacomy, M. Gephi: An open source software for exploring and manipulating networks. In Proceedings of the BT—International AAAI Conference on Weblogs and Social Media, San Jose, CA, USA, 17–20 May 2009; pp. 361–362. [Google Scholar]
  68. Kermanshah, A.; Derrible, S. Robustness of road systems to extreme flooding: Using elements of GIS, travel demand, and network science. Nat. Hazards 2017, 86, 151–164. [Google Scholar] [CrossRef]
  69. Flood Hazard Map-FEMA. Available online: https://hazards-fema.maps.arcgis.com/apps/webappviewer/index.html?id=8b0adb51996444d4879338b5529aa9cd (accessed on 28 September 2021).
  70. Kermanshah, A.; Karduni, A.; Peiravian, F.; Derrible, S. Impact analysis of extreme events on flows in spatial networks. In Proceedings of the 2014 IEEE International Conference on Big Data (Big Data), Washington, DC, USA, 27–30 October 2014; IEEE: Piscataway, NJ, USA, 2014; pp. 29–34. [Google Scholar]
  71. MME. MME Flood Mapping Portal. Available online: https://aldeera.gisqatar.org.qa/mmeflood/ (accessed on 29 April 2021).
  72. Ser-Giacomi, E.; Baudena, A.; Rossi, V.; Follows, M.; Clayton, S.; Vasile, R.; López, C.; Hernández-García, E. Lagrangian betweenness as a measure of bottlenecks in dynamical systems with oceanographic examples. Nat. Commun. 2021, 12, 4935. [Google Scholar] [CrossRef]
  73. Teixeira, A.S.; Santos, F.C.; Francisco, A.P. Spanning edge betweenness in practice. In Complex Networks VII; Springer International Publishing: Cham, Switzerland, 2016; pp. 3–10. [Google Scholar]
  74. Derrible, S. Network centrality of metro systems. PLoS ONE 2012, 7, e40575. [Google Scholar] [CrossRef] [Green Version]
Figure 1. Multilevel resilience assessment framework developed for MSEs. C B refers to betweenness centrality, T refers to the average time of trips, MSERRI refers to Mega Sport Events Road Resilience Index, β refers to threat weighting, α refers to level weighting, and the subscript notations 0, N, I, A, G, and L refer to baseline case, natural hazard scenario, intentional attack scenario, random accidents scenario, global/network level, and local/important trips level, respectively.
Sustainability 13 12367 g001
Figure 2. Doha Road network (the baseline case). In the baseline case, the sum of betweenness centrality of all nodes is ∑CB0 = 37,194, and the Average important trips duration is T0 ≈ 16 min.
Sustainability 13 12367 g002
Figure 3. Flooding scenario and its impact on Doha. Under the natural hazard scenario, the sum of betweenness centrality of all nodes is ∑CBN = 914, and the important trips could not be completed due to the extensive damage to the network. Due to the failure of the damaged network to facilitate the trips, its resilience index during this scenario was equal to zero: MSERRIN = 0.
Sustainability 13 12367 g003
Figure 4. Intentional attack scenario and its impact on the Doha road network. Under the intentional attack scenario, the sum of betweenness centrality of all nodes is ∑CBI = 34,360, and the average important trips duration is TI ≈ 18 min. Based on the calculation and the use of level-weighting factors, the resilience index during this scenario was: MSERRII = 0.91. The threat-weighting factor βI = 0.5 was used before adding it to the final calculations.
Sustainability 13 12367 g004
Figure 5. Random accidents scenario and its impact on Doha road network. Under the random accidents scenario, the sum of betweenness centrality of all nodes is ∑CBA = 31,523, and the average important trips duration TA ≈ 17 min. Based on the calculation and the use of level-weighting factors the resilience index during this scenario was: MSERRIA = 0.898. The threat-weighting factor βA = 0.15 was used before adding it to the final calculations.
Sustainability 13 12367 g005
Table 1. Doha road network assessment results and resilience index.
CaseBetweennessTravel Time (Min.)MSERRI
Max
(% Change)
Sum
(% Change)
Max
(% Change)
Average
(% Change)
Baseline108537,19443.516-
Scenario #1103 (−90%)914 (−97.5%)--0.00
Scenario #21242 (+14.5%)34,360 (−7.6%)43.518 (+12.5%)0.91
Scenario #31228 (+13.2%)31,523 (−15.2%)46.1 (+5.8%)17 (+6.25%)0.9
MSERRI refers to Mega Sport Events Road Resilience Index.
Publisher’s Note: MDPI stays neutral with regard to jurisdictional claims in published maps and institutional affiliations.

