Article

Consumer Demand for Circular Products: Identifying Customer Segments in the Circular Economy

by
Robert H. W. Boyer
*,
Agnieszka D. Hunka
and
Katherine A. Whalen
Sustainable Business Unit, RISE Research Institutes of Sweden AB, Lindholmspiren 3A, 417 56 Gothenburg, Sweden
*
Author to whom correspondence should be addressed.
Sustainability 2021, 13(22), 12348; https://doi.org/10.3390/su132212348
Submission received: 15 October 2021 / Revised: 2 November 2021 / Accepted: 4 November 2021 / Published: 9 November 2021

Abstract

:
Understanding consumer preferences in the circular economy can help producers develop profitable strategies, lowering the risk involved in transitioning to circular business models and circular product design. This study uses a choice experiment to identify customer segments for mobile phones and robot vacuum cleaners at different levels of circularity. The experiment observes how a product’s theoretical Circular Economy Score (ranging from 0 to 100) influences consumer preferences as compared to other product attributes like price, appearance, warranty, battery life, reseller type, or ease of repair. Drawing from 800 UK respondents, the results indicate the presence of three customer segments that are sensitive to a product’s Circular Economy Score, including two that appear willing to purchase recirculated items and one that expresses a preference against them. The results offer initial evidence that a market for recirculated consumer electronics exists and that circularity labeling is a marketable option. The results also present a strong rationale for further research that probes a greater variety of products and contexts.

1. Introduction

The circular economy (CE) encompasses a knowledge community interested in reducing the extraction of Earth’s finite resources and the generation of waste. While the precise definition of the CE and of “circularity” remain topics of ongoing debate, inquiry about the CE coalesces around resource life extension strategies that contribute to a transition away from unsustainable resource-intensive production and consumption [1,2]. This includes prolonging the life of products and their components through reuse, remanufacturing, and access-based consumption models, and closing material loops through recycling [3]. As such, circular products can be understood as products designed in ways that encourage longevity, reuse, and the recirculation of resources [4].
Multiple publications highlight the theoretical importance of production- and consumption-centered strategies in the CE [5,6,7]. Yet, as interest in the CE has surged in the past decade, published research appears to have marginalized consumption-centered strategies. A recent literature review estimates that only 10 percent of peer-reviewed articles associated with the CE focus on “consumption”, “consumers”, or “users” [8]. Kirchherr and colleagues [9] find a similar lack of attention to consumption in definitions of the CE. This represents an important knowledge gap, especially given the abundant social–psychological factors that preclude individuals from spontaneously deciding to purchase recirculated items in the marketplace. Just as producers are bound to a certain extent by the internal logic of their business models [10], so too are consumers constrained by layers of cognitive biases that favor the purchase of never-used-before goods [11].
There is a possibility, however, that offering consumers information about the recirculated content of products can stimulate the purchase of circular goods. As we detail below, consumers remain generally unaware of the extent to which products are composed of material sourced from prior use phases. This study tests for the existence of customer segments for products with an explicit circular economy label, and how preferences for a product with high circularity cluster with preferences for other product attributes such as price, battery life, appearance, warranty, etc. This is achieved through a choice experiment (adaptive choice-based conjoint) in which mobile phones and robot vacuum cleaners are assigned a series of attributes, including a hypothetical Circular Economy Score (CE Score). Our analysis reveals customer segments that assign high importance to the relative circularity of a product, including two that appear inclined to purchase circular products.
The article proceeds as follows. Section 1 discusses existing research on consumer preferences for circular products. Section 2 describes data collection and analytical methods. Section 3 details results. Section 4 discusses theoretical and practical implications. Concluding thoughts are offered in Section 5.

2. Materials and Methods

The following section reviews existing literature and describes research methods.

2.1. Literature Review: Who Prefers Circular Products?

Existing research offers an incomplete understanding of the types of consumers most likely to purchase products associated with the CE. This is due to the relative scarcity of consumer-focused studies confounded by a variety of product types, recirculation pathways, contexts, and theoretical frameworks that apply to the issue. The review that follows encompasses scholarship related to products broadly associated with the CE—e.g., refurbished, reused, recycled content, products designed for durability, or access-based business models. The review also draws from literature on “sustainable” product labeling for purposes of comparison.
Multiple studies show that consumer awareness of circular options (both their existence and their benefits) is low, and that transparency about a product’s recirculation status can stimulate consumers’ intention to purchase or willingness to pay [12,13,14,15,16,17]. Similar findings apply to “green” consumer products outside the specific context of the CE [18,19].
In multiple studies, women, more than men, favor or somehow express their intentions to purchase products associated with the CE [14,20]. Mugge et al. [13] divide respondents into six clusters with different attitudes about smartphone refurbishment. While most clusters have a gender balance resembling the larger respondent pool, one of three “pro-refurbishment” clusters includes a disproportionately large number of female respondents, while one of three “anti-refurbishment” clusters includes disproportionately more male respondents.
Younger respondents also tend to favor CE product options more than older respondents, although with some inconsistency. Hirschl et al. [16] find that the respondents most open to shared-access product systems are younger on average than the surveyed population. Mugge et al. [13] also find that the cluster least interested in refurbished products are considerably older than average. Among ecolabel studies, [21] and [22] find that willingness to pay for eco-products decreases with age; however, [23] find the opposite.
There is also evidence that preferences for circular products vary by country and culture, which both have a strong influences on individuals’ perception of product value [11,12]. Several studies probe how environmental attitudes and knowledge influence preferences for circular products. Harms and Linton [14] find that pro-environmental attitudes are associated with higher willingness to pay for refurbished products, but environmental knowledge is not. Atlason and colleagues [20] find that interest in design for end-of-life is highest amongst respondents with some higher education, and that interest in disposal methods is highest among those with many years of higher education. Hirschl and colleagues [16] find that educated respondents show more interest in shared-access products.
Studies that employ cluster analysis present a nuanced portrait of the customer segments interested in circular products, distinguishing consumers that express strong intentions of purchasing recirculated products from consumers who—for different reasons—have no or negative interest in them. Drawing from a representative sample of 1000 German respondents, Ref. [16] evaluates respondents’ willingness to accept non-ownership options for consumer products, for example shared use, borrowing, or rental options. Among other clusters, the authors identify “open-minded users” (20.4 percent) who find private bartering and rent-on-demand interesting and meaningful.
Mugge and colleagues [13] use cluster analysis to identify customer segments interested in purchasing refurbished smartphones. The authors administer a survey to a multinational convenience sample recruited over social media to evaluate different social, economic, and technological incentives for purchasing a refurbished smartphone. The study isolates six different customer segments, including three clusters (representing 46 percent of the sample population) that appear willing to purchase a refurbished option.
This study overlaps considerably with [13], employing a choice experiment to identify customer segments for recirculated consumer electronics. We deviate in several important ways, however, recruiting 846 random adult respondents from a single country (the UK), while testing two product varieties and two pricing structures. The following section outlines the methods, data collection and experimental setup.

2.2. Methods

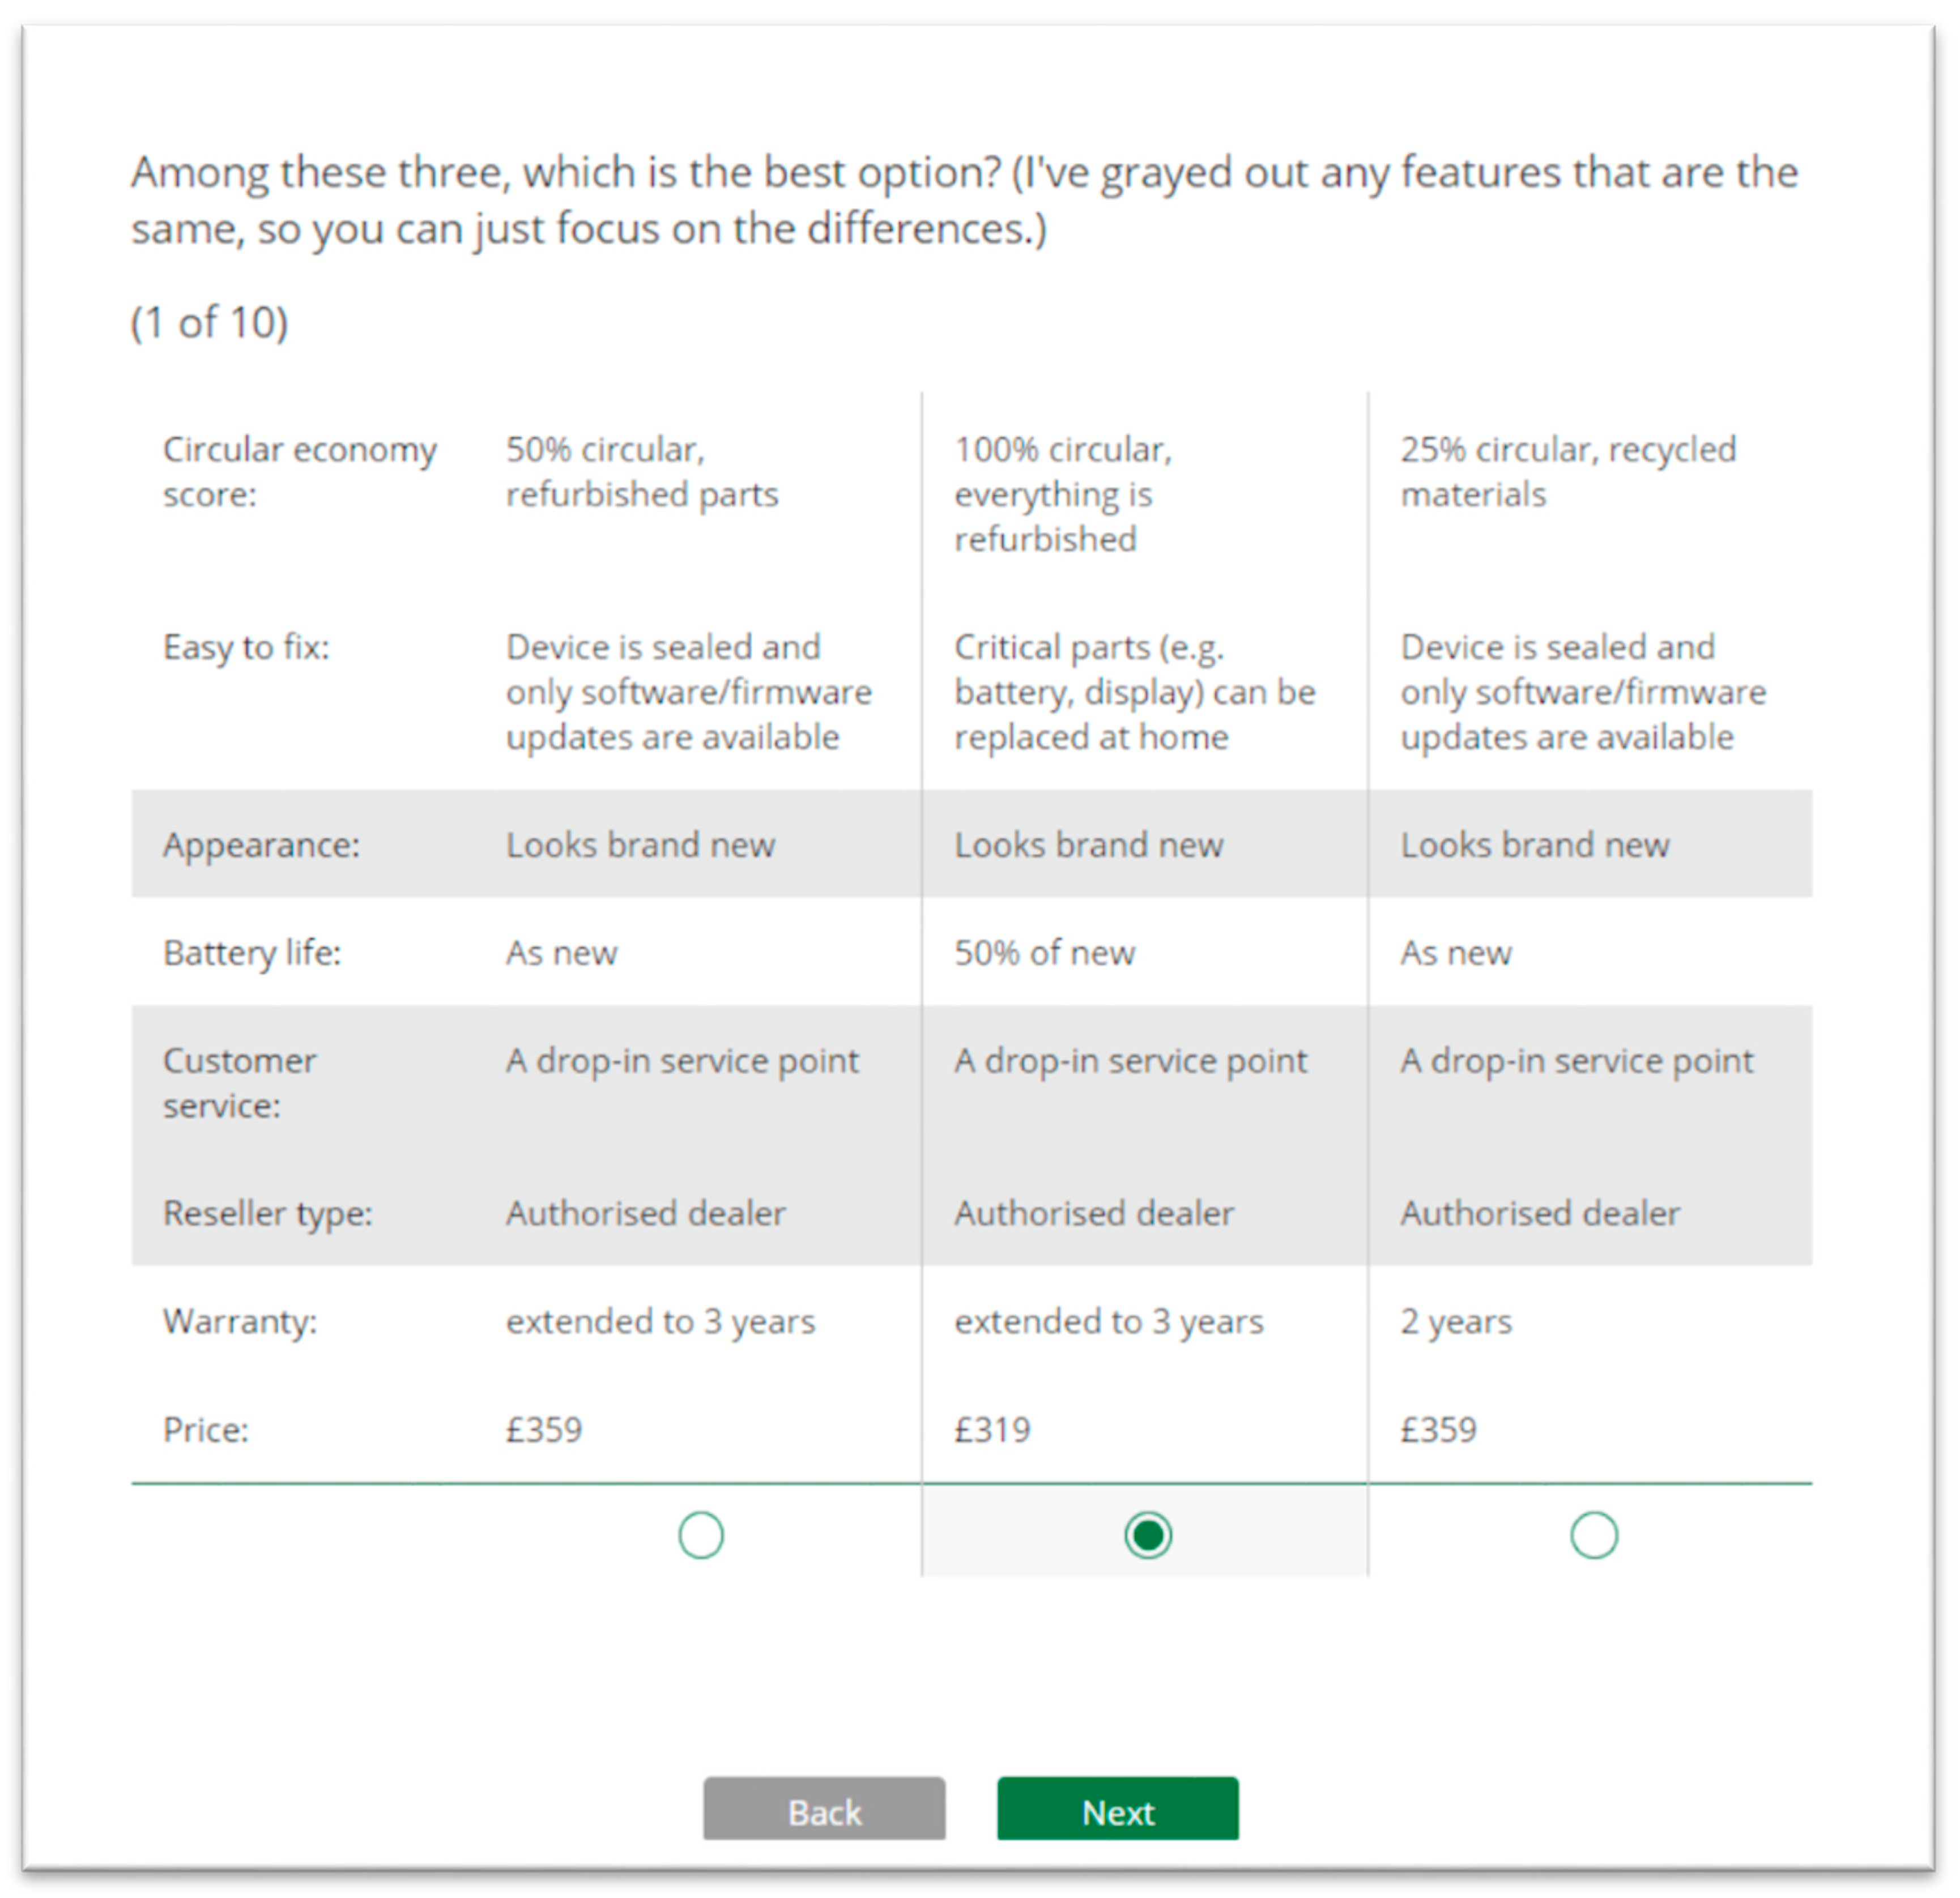
2.2.1. Choice-Based Conjoint

Choice experiments, conjoint analysis or choice-based conjoint are methods used to quantitatively elicit market preferences in experimental settings. The three terms are sometimes used interchangeably, although according to [24] this equivalency is not correct, as only choice experiments rest on the assumptions of an economic demand theory [25,26]. The term choice-based conjoint (CBC) has become popular in North America through applied market research, and it is used also in this paper [27]. The reasoning for this practice is that CBC inherits the structure from conjoint analysis (product attributes and levels), but arrives at the discrete choices consumers make, rather than numerical rankings of products’ features. The CBC methods belong to the category of stated preference methods (SP), because consumers are asked, directly or indirectly, to make a (hypothetical) decision, unlike in revealed preference methods (RP) where purchase decisions are gleaned from decisions that have already been made, such as from existing market data [28].
Choice-based conjoint attempts to emulate real-life purchases, where consumers choose the most preferred option among available alternatives, given their budget and other constraints, in line with the Random Utility Theory (RUT) [25,26,29]. RUT posits that consumers would choose the most preferred option in repeated choices (maximization of utility) and any variation in this behavior is due to random factors. The random element in RUT represents stochastic, unexplainable and unobservable factors influencing choice.
Consequently, in a CBC experiment, respondents are asked to repeatedly choose the most preferred alternative from a choice set made of offers or products with varying levels of several predefined attributes, such as price, color or brand. The utility of a given product is expressed as the sum of marginal utilities of the levels of attributes present in that product profile and an unexplained, stochastic part.

2.2.2. Circular Economy Score

The Circular Economy Score attribute applied in this study is inspired by the c-metric, developed by Linder, Sarasini, and Van Loon [30]. The c-metric is 1 of nearly 100 product-level circularity metrics developed in recent years [31]. It is expressed as a ratio of the economic value of all recirculated content in a product (e.g., reused, remanufactured, or recycled content) divided by the product’s total economic value. The c-metric offers several practical and theoretical advantages as an attribute in a consumer preference study. Firstly, the c-metric is concisely expressed as a ratio, where 0 represents a product whose economic value is composed entirely of virgin content and 1 represents a product made entirely of content recovered from a prior use phase. Secondly, whereas multiple product-level circularity metrics apply to specific industries, the c-metric is designed to apply to any product or sub-assembly thereof. Thirdly, the metric has been applied by multiple companies and validated in a comparison of 18 real-world products [32].
Finally, the c-metric effectively collapses all material recirculation pathways into a single “circularity” category by conceiving of circularity as value retained from all prior use phases. This allows for the study of “circular” products rather than separating reuse, refurbishment, remanufacturing, recycling, etc.
Study participants were introduced to the CE Score in the following prompt:
Imagine you are in a shop where a measure of circular economy, a Circular Economy Score, is displayed next to each product. The score tells us how much of the product is made of reused or refurbished parts. Some products are new and some are used.
Five CE Score levels were listed:
  • 0% circular—everything in the product comes from new materials;
  • 25% circular—the product contains recycled materials;
  • 50% circular—half of the product is made of refurbished/reused parts;
  • 75% circular—most of the product is made of refurbished parts;
  • 100% circular—the whole product is reused or made of refurbished parts.
Descriptions of products at each level of circularity are assigned different combinations of recirculation pathway labels, e.g., “recycled”, “refurbished”, “reused”, as rough descriptions of what a consumer might encounter on a product label in a physical store. As such, the descriptions above provide necessarily incomplete information. Such labels reflect the succinct if sometimes incomplete nature of information about product attributes in the marketplace. The different levels of other attributes, such as “appearance” and “ease of repair”, must also be described succinctly and somewhat subjectively.

2.2.3. Data Collection

Data were collected in November and December 2019 via Prolific Academic (https://www.prolific.co/, accessed on 3 November 2021), which is an on-line research participants recruitment platform. Respondents were remunerated for their time at GBP 6.80 per hour. Out of 846 initial participants, 800 returned valid responses. Participants were informed about the purpose of the study and could withdraw their consent at any point. Prior to fielding, the study was piloted with 24 colleagues at RISE Research Institutes of Sweden. The goal of the pilot was to establish whether the experiment was easy to understand and engaging. Another goal was to establish which products and product attributes would be tested in the final experiment. The project team also searched relevant literature and successfully sold listings on eBay.co.uk to determine a suitable list of attributes for different types of recirculated products. Findings in several studies suggest that perceived inferior quality of recirculated products is an obstacle to their emergence in the marketplace [15,17,33,34,35]. We attempt to control for perceptions of product quality by including elements such as appearance, battery life, and warranty as explicit attributes in the choice experiment.
After the pilot study, two products were selected for the final experiment: a mobile phone and a robot vacuum cleaner. Respondents were randomly divided further into two sub-groups: the first group was presented with fixed-level prices and the second group was shown prices randomly drawn from the same interval (GBP 259-629), rounded to the nearest 9. This resulted in four experiment scenarios with identical attributes (two scenarios for each product). Table 1 lists the demographics of the sample collected in the experiment. Sub-samples are separated by product type.
Respondents who took part in answering the survey on one product were automatically excluded from taking part in the other. The products both belong to the group of home/personal electronic equipment and are similar enough to share the same attributes, including average retail prices. They are different enough, however, to yield hypothetically interesting comparisons, including to existing literature. For example, previous studies suggest that the perceived quality of refurbished mobile phones was affected by attributes such as battery life or warranty length [13], two attributes also included in this study. The base retail price for both products was established at GBP 499, which was the average price for both product categories (premium brand mobile phones and robot vacuum cleaners) referenced on the website pricerunner.uk (accessed on 3 November 2019). Other attributes, such as the DIY-friendly repairability and type of customer service, were elicited from the aforementioned qualitative pilot study. In total, eight product attributes were used in the survey, as described in Table 2. Figure 1 presents a screen shot of the online survey interface in which participants were instructed to choose their most preferred product with attributes at variable levels.
The final survey employs a variation of CBC, an Adaptive Choice-Based Conjoint (ACBC), which is a tool developed by Sawtooth Software and used both in commercial and academic research [36,37,38,39,40]. A detailed description of ACBC and the comparison between a traditional CBC and ACBC can be found in Orme [41] and Chapman et al. [42]. Lighthouse Studio, a commercial software developed by Sawtooth Software, was used to design, test, host and statistically analyze the data. A detailed overview of the method, experimental design and the underlying multinomial logit model can be found in [43]. Additionally, the authors have published detailed results related to respondents’ willingness to pay for products at different levels of circularity [44], which is conceptually and methodological distinct from the customer segmentation reported below.
Originally, choice experiments and CBCs reported utilities aggregated across all respondents, resulting in an average model of choice [45]. With the emergence of more powerful computational technologies it has become possible, thanks to Bayesian methods, to calculate individual marginal utilities and to arrive at the probability of choosing a given product profile for each respondent. This further allows for computing clusters of respondents sharing similar preferences, i.e., groups of people choosing similar alternatives from the given choice set. Details and pioneering implementations of Bayesian methods for CBC studies can be found in Allenby and Ginter [46] and Allenby et al. [47].

2.2.4. Cluster Analysis

Cluster analysis is used to assign objects to dissimilar groups, i.e., objects in one group are similar but share as little as possible with objects from other groups. A common measure of similarity between objects is distance, for instance the length of the straight line between two data points (Euclidean distance). It is important to note that clustering is not the same as classification. The latter involves grouping objects on the basis of known labels. The assumptions behind clustering are that the data are not labeled and the clustering algorithm uncovers similarities within data—this approach is also called “unsupervised” data analysis [48]. The most common clustering method is k-means clustering, which uses distance between data points and a mean point (centroid) of each cluster as a datapoint defining a given cluster [49]. Another common clustering method based on distance between observations is hierarchical clustering, which either starts with treating each data point as a single cluster and merges these clusters into pairs in subsequent steps, or starts with a single cluster of all data points that is subsequently split into two at every following step [48,50].
This paper employs Convergent Cluster and Ensemble Analysis (CCEA) developed by Sawtooth Software. The method uses clustering algorithms, starting with k-means clustering, to achieve a consensus solution based on more than one clustering method. The final solution maximizes between-group dissimilarity, expressed as both distance between cluster means and an F-ratio (variance between clusters/variance within clusters), for each product attribute. A detailed overview of CCEA can be found in Orme and Johnson [51] and Retzer et al. [52].
The outcome of cluster analysis, as an unsupervised data analysis method, combines a quantitative analysis (similarity and dissimilarity based on distance between data points) and a qualitative interpretation—it is up to the researcher to choose a cluster solution that has the highest interpretative value. In this paper, 4 cluster solutions have been selected for all experimental scenarios.

3. Results

Table 3 presents the mean utilities of clusters in all four experiments and corresponding F-ratios for each attribute level. The marginal utility values entered into the cluster analysis were standardized (zero-centre differences) to make it possible to compare utility values across different attributes. For each experiment, the research team generated as few as two and as many as six clusters, and for each experiment, the scenario with four clusters was judged to present the best balance of variation between clusters and cluster size. Given a sample of approximately 200 respondents per experiment, scenarios with more than four clusters resulted in clusters with a very small number of respondents, whereas scenarios with fewer than four clusters did not result in segments with interesting variation. The research team also settled on four clusters due to the number of meaningful attributes, as determined by F-ratios. An F-ratio is the ratio of variation between groups to variation within groups. An attribute level with a higher F-ratio has a higher impact on the formation of a cluster. As is evident in Table 3, a small number of variables had rather dominant F-ratios. In each experiment, the variables CE Score and Price were critical to the formation of clusters, while length of warranty and scratched vs. unscratched appearance displayed high F-ratios in some experiments, but not others. F-ratios for the remaining attributes—ease of repair, battery life, customer service, and reseller type—were consistently in the single digits, and thus relatively unimportant to the determination of clusters.

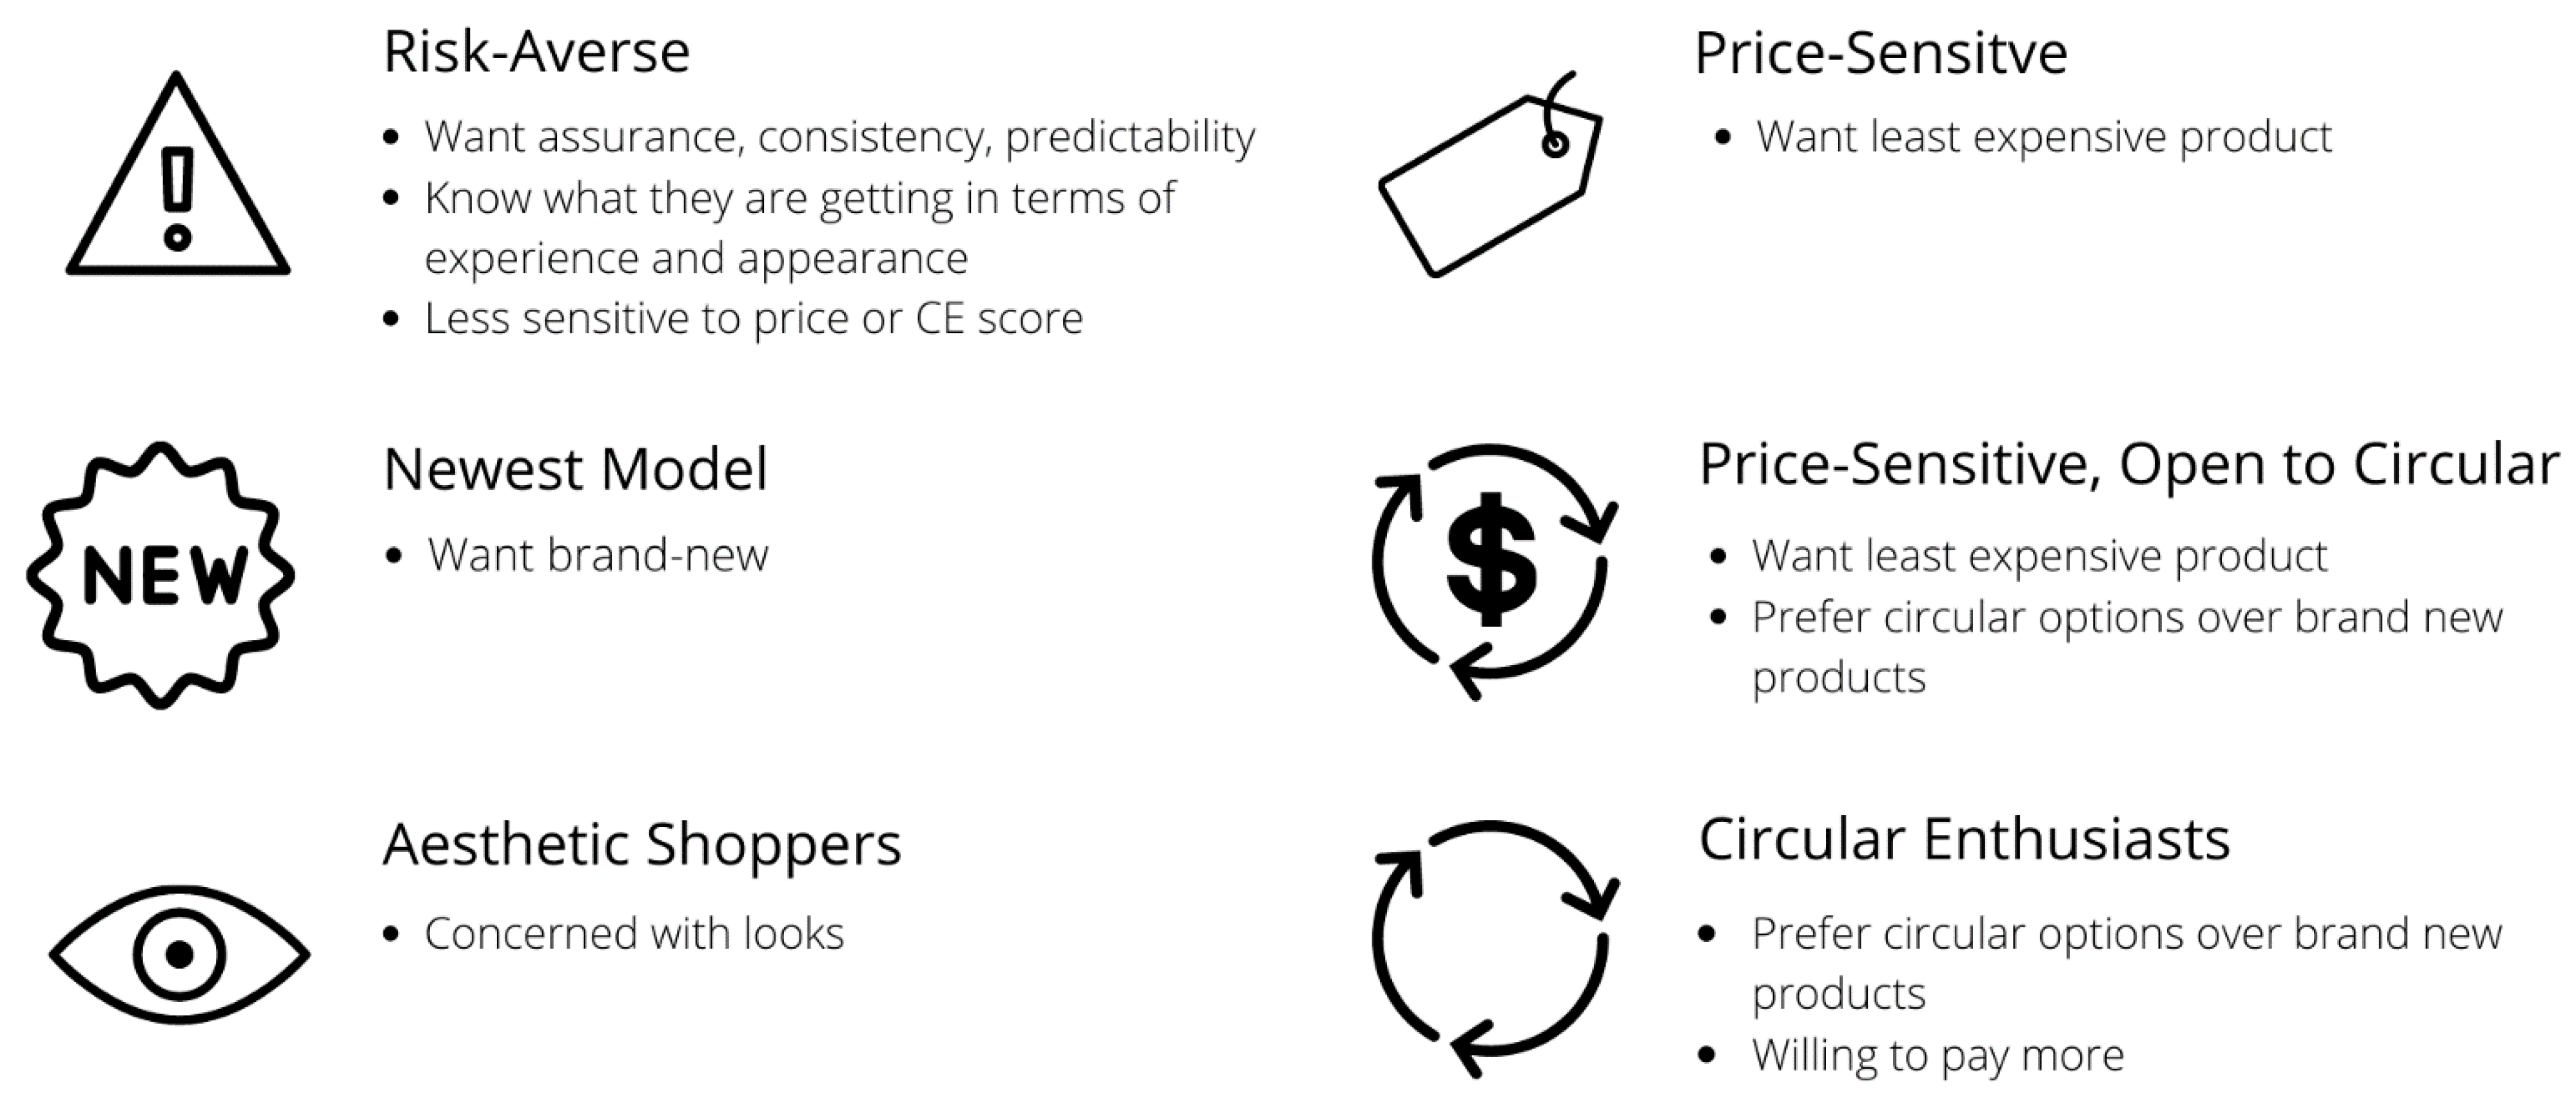
3.1. Customer Segments

Circular Enthusiasts. From each experiment emerged a cluster that assigned relatively high utility to circular products: Cluster 4 (Experiment 1), Cluster 4 (Experiment 2), Cluster 4 (Experiment 3), and Cluster 3 (Experiment 4) constitute categories we label Circular Enthusiasts. On average, respondents in this cluster assigned higher utility to items with high CE Scores and relatively low absolute utility to price, suggesting that CE Score motivated their choice heavily. Importantly, they assigned comparatively lower utility to brand new (0% circular) items than they did high utility to completely reused (100% circular) items, suggesting that respondents may be repelled by the prospect of brand-new items more than they are attracted to the prospect of a completely recirculated one. For example, Cluster 4 (Exp 1) assigned “0% circular” products a utility score of −72.80 while assigning the 100% circular attribute level a utility score of 41.50. A similar pattern appeared in Cluster 4 (Exp 2) with −133.60 vs. 100.46, respectively; in Cluster 4 (Exp 3) with −128.09 vs. 56.48, respectively; and in Cluster 3 (Exp 4) with −105.01 vs. 82.41, respectively. Respondents in this cluster also assigned relatively low absolute utility to price as an attribute. In every cluster of this study, subjects responded “rationally”, in the sense that no cluster preferred a high-cost item to a low-cost item (all other things equal); however, some clusters appeared to assign higher absolute utility to the price attribute than others. The Circular Enthusiasts assigned relatively low absolute utility to the price variable as compared to other clusters and compared to the CE score within its own cluster. In short, members of this cluster appeared to care less about price than about CE Score, and less about price than respondents in other clusters. This cluster also tended to be rather small in terms of respondents. It is the smallest cluster in Experiments 2, 3, and 4, and the third-largest in Experiment 1.
Price-Sensitive, Open to Circular. Each experiment also contained a separate category in which respondents assigned comparatively high absolute utility to price (e.g., very high utility to cheap items and very low utility to expensive items), while also preferring circular options over brand new options somewhat, but to a lesser degree than Circular Enthusiasts. We labeled these clusters Price-Sensitive, Open to Circular, which includes Cluster 2 (Exp 1), Cluster 3 (Exp 2),Cluster 3 (Exp 3), and Cluster 1 (Exp 1). We interpret these data to mean that individuals in this cluster are foremost interested in purchasing an inexpensive product, but will purchase a circular product when available and inexpensive. This cluster varied in size across experiments. It was the largest cluster in both Experiment 1 (n = 76) and Experiment 4 (n = 75), the second-largest in Experiment 2 (n = 55), and the third-largest in Experiment 3 (n = 42).
Several other clusters emerged, although inconsistently across the four experiments.
We labeled Cluster 1 (Exp. 2), Cluster 1 (Exp. 3), and Cluster 4 (Exp. 4) as Price-Sensitive. This cluster expresses very high preference for the least expensive product and very weak preferences for all other attributes. The average utility scores for CE Score in this cluster are relatively low in magnitude and defy the relatively smooth linear relationships of this attribute in other clusters. These consumers appear driven almost exclusively by price.
Aesthetic Shoppers assigned high absolute utilities to the appearance attribute, and comparatively low absolute utilities to the CE Score and price attributes. This cluster emerged in both mobile phone experiments—Cluster 1 (Exp. 1), Cluster 1 (Exp 2)—but not at all in the robot vacuum cleaner experiments. We interpret this to mean that some consumers are very sensitive to whether or not a mobile phone—a highly personalized item—shows visible signs of use, and that this attribute supersedes price and circularity in importance. Consumers are not as concerned about the appearance of robot vacuum cleaners. Neither of these clusters expressed preferences for circular items over brand-new items.
A Risk-Averse category emerged in both robot vacuum cleaner experiments—Cluster 2 (Exp. 3) and Cluster 2 (Exp. 4). These respondents assigned high utility to the warranty attribute, as well as the highest utilities to appearance, in their respective experiments. Meanwhile, they appeared comparatively less sensitive to CE Score or price.
In Cluster 3 (Exp. 1), respondents assigned the highest absolute utility to the CE Score attribute, and expressed strong preferences for the 0% circular (brand-new) option. We labeled this cluster Newest Model. This cluster appears relatively unconcerned about appearance, warranty, or price. We interpret this to mean that respondents in this category are primarily interested in purchasing the most up-to-date model of mobile phones. It is worth noting that a rather small proportion of respondents in the robot vacuum cleaner experiments preferred a brand-new product. In both Experiment 3 and Experiment 4, three out of four clusters assigned the lowest utility to 0% circular (brand-new) products. This was less prevalent in the mobile phone experiments, however.
Figure 2 contains an overview of the (in total) six customer segments identified and their defining characteristics.

3.2. Demographics

Chi-square tests of homogeneity failed to reveal statistically significant (p < 0.05) differences among clusters in gender balance, employment status, educational attainment, household income, or age. Thus, these data cannot confirm that preferences for circular mobile phones or robot vacuum cleaners vary by isolated demographic categories. This finding may be the consequence of relatively small clusters, and future research (with larger samples) may reveal otherwise. It is also partially the result of a large proportion of respondents declining to provide information about education and income level. This, too, can be resolved by a larger sample size in future studies.

4. Discussion

The six clusters that emerged from this study appear to confirm the existence of at least two customer segments interested in purchasing circular products. These two clusters shed light on how businesses can position circular business offerings to their customers. Interestingly, the clusters identified in this study suggest that the CE Score has a strong impact on customer preferences. However, it appears that firms will need to make clear strategic decisions when deciding how to market circular products, because the results show that members of these clusters view circular products in different ways.
The identification of Circular Enthusiasts indicates there is a market segment willing to pay for products of higher circularity. This resembles the “Sustainability Enthusiasts” in [13] and “Open-Minded Users” in [16], who prefer “greener” options despite possible increases in price. However, while offering circular products at a premium would likely resonate with customers in this cluster, it is expected to repel customers in the Price-Sensitive, Open to Circular cluster. These customers value circularity but prioritize low prices, thus most likely responding best to an offering that emphasizes a low price and its circular nature. From the data, it appears companies should use such an offering if they desire to address the greatest number of customers through a single circular offering. This is likely to attract not only Circular Enthusiasts and Price-Sensitive, Open to Circular customers, but also Price-Sensitive customers, because respondents in this cluster were found to have a weak preference for anything but price.
Additional testing is needed to gain further data and insight. For example, using a circularity label on a lower priced product could result in missed revenue from Circular Enthusiasts. Moreover, different aesthetic preferences identified for the mobile phone in comparison to the robot vacuum cleaner suggest firms should also adjust offerings according to product type. Visible signs of wear may be more acceptable for circular products that are not used daily and publicly.
Firms can use the clusters to provide inspiration and input for their business model innovation process. Within such processes, firms are encouraged to find situations and potential customers along the product’s lifecycle, where the product and/or components can have a second life (or more) [3]. The clusters identified in this paper can help firms design this circular flow. For example, one possible solution based on the results could be a three-tier distribution system where one product is sold three times, each to a new customer segment. First, the newly manufactured product is distributed to Newest Model and Risk-Averse customers. After this first use, the product is returned and prepared for reuse or remanufacturing. It is then sold to Circular Enthusiasts at a premium, before a final collection and resale to Price-Sensitive, Open to Circular and Price-Sensitive customers. Many firms have already adopted similar approaches (i.e., buyback, deposit-refunds, trade-in credit, etc.) to obtain products back after first sale in order to be sold again [53].
The identified customer preference for new products is of particular interest for circular economy researchers. The findings corroborate previous research that has similarly distinguished customer segments interested in circular options from customers that are particularly focused on purchasing the newest technology [13,16,54]. As circular economy ultimately aims to decouple production from consumption, the production of new products with virgin materials directly contradicts this goal. Firms must find ways to incorporate circularity into their business model while still aligning with customer preferences. Distributing products through product-service system could help ensure new products are returned and cascaded to other customers after first use.
The limitations of the study offer opportunities for follow-up research. First, the relatively small sample sizes for each of the four experiments likely preclude additional insight into the demographic characteristics of consumers who prefer circular products (i.e., sex, age, income). Moreover, some of the clusters identified in the study are small, and therefore, future experiments with larger respondent groups are necessary to substantiate how products labeled “circular” will perform in the market. Second, given that this study only focused on respondents in one country (the UK), its salience in other contexts is uncertain. Previous studies suggest variance between countries and cultures [11,12], particularly as UK consumers have been found to express greater preference for products containing sustainably sourced materials for certain products [12].
Third, aspects of the research design may have encouraged the respondents to have a positive association with circularity. For example, brand-new products were represented as 0% circular and reused products as 100% circular. It is possible that respondents find “0%” to be an unattractive offer, perhaps believing they were receiving less of something. Future studies could address this through randomized framing of the circularity scale, for example, prompting some respondents to a scale in which 100% represents a product made entirely of virgin material rather than entirely of recirculated material. Moreover, participants in each experiment assigned high absolute utility to both CE Score and price. It is possible this is the result of response bias, especially as some respondents likely first learned about the concept of circularity from the study prompt. Moreover, the findings on social desirability bias in research on pro-environmental attitudes are inconsistent, and at best show only a weak direct effect of socially desirable responses on self-reported environmental friendliness [55]. Future research could address this through an intake questionnaire designed to gauge respondents’ previous exposure to such concepts. It could also be interesting to investigate how consumers’ preferences change with and without using the terminology related to “Circular Economy”, instead using terminology associated with specific recirculation pathways such as recycling, refurbishment, and reuse.

5. Conclusions

This study has examined whether and which types of consumers express preferences for electronic products at different levels of circularity. Two relevant customer segments emerged. In the cases of both mobile phones and robot vacuum cleaners, one rather small segment appeared interested in circular products regardless of higher price. A second much larger segment appeared open-minded to circular products, but remained primarily motivated by low prices. An additional segment responded strongly to the CE Score, expressing a preference against circular mobile phones; however, no such segment emerged in the case of robot vacuum cleaners. Further research will clarify whether these results apply to consumers outside the United Kingdom and beyond the two products tested here. Unfortunately, the rather small study size precludes any conclusions regarding isolated demographic variables such as sex, age, education, or income.
In addition to the presence of these customer segments, a critical finding in this study was the salience of the CE Score as a product attribute. To date, no product label for the circular economy exists, and consumers remain generally unaware of the Circular Economy and individual products’ level of recirculation. The findings here suggest that the development of a labeling and certification system of circular products is a worthwhile undertaking.
Consumer-centered research in Circular Economy literature is still relatively uncommon, yet it is an essential dimension of a broader societal transition. Armed with a nuanced understanding of the market for products made from recirculated material, producers can abandon antiquated and environmentally unsustainable linear business models with higher confidence that a potentially risky innovation will be met with reward.

Author Contributions

This paper was initially conceived by A.D.H. with further conceptual development by R.H.W.B. Data curation and methodology was managed by A.D.H. Writing—original draft preparation as well review and editing were managed by R.H.W.B. and shared by A.D.H. and K.A.W. All authors have read and agreed to the published version of the manuscript.

Funding

The paper and the related study were funded by the Marianne and Marcus Wallenberg Foundation in the project Measuring Business Model Circularity for Increased Resource Productivity (MMW 2015.0045).

Institutional Review Board Statement

Ethical review of human subject research at RISE Research Institutes of Sweden AB and all institutions in Sweden was conducted by Etikprövningsmyndigheten (the ethics examination ministry). Ethics approval applies to research that (1) involves a physical intervention, (2) uses a method that aims to affect a person physically or mentally, (3) is performed on biological material, or (4) includes processing of sensitive personal data or criminal records. The detailed policy can be found here (in Swedish): https://etikprovningsmyndigheten.se/for-forskare/vad-sager-lagen/ (accessed on 3 November 2021). This research fits none of the criteria that require ethics approval.

Informed Consent Statement

Informed consent was obtained from all subjects involved in the study.

Data Availability Statement

Not applicable.

Acknowledgments

The authors thank Marcus Linder for support in securing funding and early project conceptualization.

Conflicts of Interest

The authors declare no conflict of interest. The funders had no role in the design of the study; in the collection, analyses, or interpretation of data; in the writing of the manuscript, or in the decision to publish the results.

References

  1. Blomsma, F.; Brennan, G. The Emergence of Circular Economy: A New Framing around Prolonging Resource Productivity. J. Ind. Ecol. 2017, 21, 603–614. [Google Scholar] [CrossRef]
  2. Korhonen, J.; Nuur, C.; Feldmann, A.; Birkie, S.E. Circular Economy as an Essentially Contested Concept. J. Clean. Prod. 2018, 175, 544–552. [Google Scholar] [CrossRef]
  3. Nußholz, J.L.K. Circular Business Models: Defining a Concept and Framing an Emerging Research Field. Sustainability 2017, 9, 1810. [Google Scholar] [CrossRef] [Green Version]
  4. Bocken, N.M.P.; de Pauw, I.; Bakker, C.; van der Grinten, B. Product Design and Business Model Strategies for a Circular Economy. J. Ind. Prod. Eng. 2016, 33, 308–320. [Google Scholar] [CrossRef] [Green Version]
  5. Ghisellini, P.; Cialani, C.; Ulgiati, S. A Review on Circular Economy: The Expected Transition to a Balanced Interplay of Environmental and Economic Systems. J. Clean. Prod. 2016, 114, 11–32. [Google Scholar] [CrossRef]
  6. Lieder, M.; Rashid, A. Towards Circular Economy Implementation: A Comprehensive Review in Context of Manufacturing Industry. J. Clean. Prod. 2016, 115, 36–51. [Google Scholar] [CrossRef]
  7. Yuan, Z.; Bi, J.; Moriguichi, Y. The Circular Economy: A New Development Strategy in China. J. Ind. Ecol. 2006, 10, 4–8. [Google Scholar] [CrossRef] [Green Version]
  8. Camacho-Otero, J.; Boks, C.; Pettersen, I. Consumption in the Circular Economy: A Literature Review. Sustainability 2018, 10, 2758. [Google Scholar] [CrossRef] [Green Version]
  9. Kirchherr, J.; Piscicelli, L.; Bour, R.; Kostense-Smit, E.; Muller, J.; Huibrechtse-Truijens, A.; Hekkert, M. Barriers to the Circular Economy: Evidence From the European Union (EU). Ecol. Econ. 2018, 150, 264–272. [Google Scholar] [CrossRef] [Green Version]
  10. Chesbrough, H. Business Model Innovation: Opportunities and Barriers. Long Range Plan. 2010, 43, 354–363. [Google Scholar] [CrossRef]
  11. Singh, P.; Giacosa, E. Cognitive Biases of Consumers as Barriers in Transition towards Circular Economy. Manag. Decis. 2019, 57, 921–936. [Google Scholar] [CrossRef]
  12. Potoglou, D.; Whitmarsh, L.; Whittle, C.; Tsouros, I.; Haggar, P.; Persson, T. To What Extent Do People Value Sustainable-Resourced Materials? A Choice Experiment with Cars and Mobile Phones across Six Countries. J. Clean. Prod. 2020, 246, 118957. [Google Scholar] [CrossRef]
  13. Mugge, R.; Jockin, B.; Bocken, N. How to Sell Refurbished Smartphones? An Investigation of Different Customer Groups and Appropriate Incentives. J. Clean. Prod. 2017, 147, 284–296. [Google Scholar] [CrossRef]
  14. Harms, R.; Linton, J.D. Willingness to Pay for Eco-Certified Refurbished Products: The Effects of Environmental Attitudes and Knowledge: WTP for Eco-Certified Refurbished Products. J. Ind. Ecol. 2016, 20, 893–904. [Google Scholar] [CrossRef]
  15. van Weelden, E.; Mugge, R.; Bakker, C. Paving the Way towards Circular Consumption: Exploring Consumer Acceptance of Refurbished Mobile Phones in the Dutch Market. J. Clean. Prod. 2016, 113, 743–754. [Google Scholar] [CrossRef] [Green Version]
  16. Hirschl, B.; Konrad, W.; Scholl, G. New Concepts in Product Use for Sustainable Consumption. J. Clean. Prod. 2003, 11, 873–881. [Google Scholar] [CrossRef]
  17. Hazen, B.T.; Overstreet, R.E.; Jones-Farmer, L.A.; Field, H.S. The Role of Ambiguity Tolerance in Consumer Perception of Remanufactured Products. Int. J. Prod. Econ. 2012, 135, 781–790. [Google Scholar] [CrossRef]
  18. Peschel, A.O.; Grebitus, C.; Steiner, B.; Veeman, M. How Does Consumer Knowledge Affect Environmentally Sustainable Choices? Evidence from a Cross-Country Latent Class Analysis of Food Labels. Appetite 2016, 106, 78–91. [Google Scholar] [CrossRef] [PubMed] [Green Version]
  19. Teisl, M.F.; Rubin, J.; Noblet, C.L. Non-Dirty Dancing? Interactions between Eco-Labels and Consumers. J. Econ. Psychol. 2008, 29, 140–159. [Google Scholar] [CrossRef]
  20. Atlason, R.S.; Giacalone, D.; Parajuly, K. Product Design in the Circular Economy: Users’ Perception of End-of-Life Scenarios for Electrical and Electronic Appliances. J. Clean. Prod. 2017, 168, 1059–1069. [Google Scholar] [CrossRef]
  21. Sønderskov, K.M.; Daugbjerg, C. The State and Consumer Confidence in Eco-Labeling: Organic Labeling in Denmark, Sweden, The United Kingdom and The United States. Agric. Hum. Values 2011, 28, 507–517. [Google Scholar] [CrossRef] [Green Version]
  22. Ward, D.O.; Clark, C.D.; Jensen, K.L.; Yen, S.T.; Russell, C.S. Factors Influencing Willingness-to-Pay for the ENERGY STAR ® Label. Energy Policy 2011, 39, 1450–1458. [Google Scholar] [CrossRef]
  23. Vecchio, R.; Annunziata, A. Willingness-to-Pay for Sustainability-Labelled Chocolate: An Experimental Auction Approach. J. Clean. Prod. 2015, 86, 335–342. [Google Scholar] [CrossRef]
  24. Louviere, J.J.; Flynn, T.N.; Carson, R.T. Discrete Choice Experiments Are Not Conjoint Analysis. J. Choice Model. 2010, 3, 57–72. [Google Scholar] [CrossRef] [Green Version]
  25. McFadden, D. The Measurement of Urban Travel Demand. J. Public Econ. 1974, 3, 303–328. [Google Scholar] [CrossRef]
  26. Thurstone, L.L. A Law of Comparative Judgment. Psychol. Rev. 1927, 34, 273–286. [Google Scholar] [CrossRef]
  27. Gustafsson, A.; Herrmann, A.; Huber, F. Conjoint Measurement: Methods and Applications; Springer Science & Business Media: Berlin/Heidelberg, Germany, 2013; ISBN 978-3-540-24713-5. [Google Scholar]
  28. Breidert, C.; Hahsler, M.; Reutterer, T. A review of methods for measuring willingness-to-pay. Innov. Mark. 2006, 2, 25. Available online: https://www.businessperspectives.org/index.php/journals/innovative-marketing/issue-111/a-review-of-methods-for-measuring-willingness-to-pay (accessed on 3 November 2021).
  29. Luce, R.D. Individual Choice Behavior: A Theoretical Analysis; 2012; ISBN 0-486-15339-8. Available online: https://books.google.co.jp/books?hl=zh-CN&lr=&id=ERQsKkPiKkkC&oi=fnd&pg=PP1&dq=.+Individual+Choice+Behavior:+A+Theoretical+Analysis%3B+Courier&ots=2jps0sZ7bo&sig=7g1pKkjjO4i5EW_51V-s2AHpZJI#v=onepage&q=.%20Individual%20Choice%20Behavior%3A%20A%20Theoretical%20Analysis%3B%20Courier&f=false (accessed on 3 November 2021).
  30. Linder, M.; Sarasini, S.; van Loon, P. A Metric for Quantifying Product-Level Circularity. J. Ind. Ecol. 2017, 21, 545–558. [Google Scholar] [CrossRef] [Green Version]
  31. Roos Lindgreen, E.; Salomone, R.; Reyes, T. A Critical Review of Academic Approaches, Methods and Tools to Assess Circular Economy at the Micro Level. Sustainability 2020, 12, 4973. [Google Scholar] [CrossRef]
  32. Linder, M.; Boyer, R.H.W.; Dahllöf, L.; Vanacore, E.; Hunka, A. Product-Level Inherent Circularity and Its Relationship to Environmental Impact. J. Clean. Prod. 2020, 260, 121096. [Google Scholar] [CrossRef]
  33. Abbey, J.D.; Meloy, M.G.; Blackburn, J.; Guide, V.D.R., Jr. Consumer Markets for Remanufactured and Refurbished Products. Calif. Manag. Rev. 2015. [Google Scholar] [CrossRef]
  34. Hazen, B.T.; Boone, C.A.; Wang, Y.; Khor, K.S. Perceived Quality of Remanufactured Products: Construct and Measure Development. J. Clean. Prod. 2017, 142, 716–726. [Google Scholar] [CrossRef]
  35. Vafadarnikjoo, A.; Mishra, N.; Govindan, K.; Chalvatzis, K. Assessment of Consumers’ Motivations to Purchase a Remanufactured Product by Applying Fuzzy Delphi Method and Single Valued Neutrosophic Sets. J. Clean. Prod. 2018, 196, 230–244. [Google Scholar] [CrossRef] [Green Version]
  36. Bauer, R.; Menrad, K.; Decker, T. Adaptive Hybrid Methods for Choice-Based Conjoint Analysis: A Comparative Study. Int. J. Mark. Stud. 2015, 7, 1. [Google Scholar] [CrossRef] [Green Version]
  37. Cunningham, C.E.; Deal, K.; Chen, Y. Adaptive Choice-Based Conjoint Analysis. Patient Patient-Cent. Outcomes Res. 2010, 3, 257–273. [Google Scholar] [CrossRef] [Green Version]
  38. Jervis, S.M.; Ennis, J.M.; Drake, M.A. A Comparison of Adaptive Choice-Based Conjoint and Choice-Based Conjoint to Determine Key Choice Attributes of Sour Cream with Limited Sample Size. J. Sens. Stud. 2012, 27, 451–462. [Google Scholar] [CrossRef]
  39. Kaufmann, S.; Künzel, K.; Loock, M. Customer Value of Smart Metering: Explorative Evidence from a Choice-Based Conjoint Study in Switzerland. Energy Policy 2013, 53, 229–239. [Google Scholar] [CrossRef]
  40. Shin, H.-S.; Callow, M.; Dadvar, S.; Lee, Y.-J.; Farkas, Z.A. User Acceptance and Willingness to Pay for Connected Vehicle Technologies: Adaptive Choice-Based Conjoint Analysis. Transp. Res. Rec. 2015, 2531, 54–62. [Google Scholar] [CrossRef]
  41. Orme, B. Getting Started with Conjoint Analysis: Strategies for Product Design and Pricing Research, 2nd ed.; Research Publishers LLC: Madison, WI, USA, 2010. [Google Scholar]
  42. Chapman, C.N.; Alford, J.L.; Johnson, C.; Weidemann, R.; Lahav, M. CBC vs. ACBC: Comparing Results with Real Product Selection. In Proceedings of the 2009 Sawtooth Software Conference Proceedings, Delray Beach, FL, USA, 25–27 March 2009; Available online: https://sawtoothsoftware.com/resources/technical-papers/cbc-vs-acbc-comparing-results-with-real-product-selection (accessed on 3 November 2021).
  43. Hunka, A.D.; Linder, M.; Habibi, S. Determinants of Consumer Demand for Circular Economy Products. A Case for Reuse and Remanufacturing for Sustainable Development. Bus Strat. Env. 2021, 30, 535–550. [Google Scholar] [CrossRef]
  44. Boyer, R.H.W.; Hunka, A.D.; Linder, M.; Whalen, K.; Habibi, S. Product Labels for the Circular Economy: Are Customers Willing to Pay for Circular? Sustain. Prod. Consum. 2020. [Google Scholar] [CrossRef]
  45. Carson, R.T.; Louviere, J.J.; Anderson, D.A.; Arabie, P.; Bunch, D.S.; Hensher, D.A.; Johnson, R.M.; Kuhfeld, W.F.; Steinberg, D.; Swait, J. Experimental Analysis of Choice. Mark. Lett. 1994, 5, 351–367. [Google Scholar] [CrossRef]
  46. Allenby, G.M.; Ginter, J.L. Using Extremes to Design Products and Segment Markets. J. Mark. Res. 1995, 32, 392–403. [Google Scholar] [CrossRef]
  47. Allenby, G.M.; Arora, N.; Ginter, J.L. Incorporating Prior Knowledge into the Analysis of Conjoint Studies. J. Mark. Res. 1995, 32, 152–162. [Google Scholar] [CrossRef]
  48. Romesburg, C. Cluster Analysis for Researchers; Lulu Press: Morrisville, NC, USA, 2004; ISBN 1-4116-0617-5. [Google Scholar]
  49. Kanungo, T.; Mount, D.M.; Netanyahu, N.S.; Piatko, C.D.; Silverman, R.; Wu, A.Y. An Efficient K-Means Clustering Algorithm: Analysis and Implementation. IEEE Trans. Pattern Anal. Mach. Intell. 2002, 24, 881–892. [Google Scholar] [CrossRef]
  50. Johnson, S.C. Hierarchical Clustering Schemes. Psychometrika 1967, 32, 241–254. [Google Scholar] [CrossRef]
  51. Orme, B.; Johnson, R. Improving K-Means Cluster Analysis: Ensemble Analysis Instead of Highest Reproducibility Replicates. 2008, pp. 1–11. Available online: http://docplayer.net/49036228-Proceedings-of-the-sawtooth-software-conference-march-2009.html (accessed on 3 November 2021).
  52. Retzer, J.; Alberg, S.; Yuan, J. Achieving Consensus in Cluster Ensemble Analysis. 2009. Available online: https://content.sawtoothsoftware.com/assets/7abd15e0-f082-4bce-be66-d683aa69ebc3 (accessed on 3 November 2021).
  53. Whalen, K.A. Three Circular Business Models That Extend Product Value and Their Contribution to Resource Efficiency. J. Clean. Prod. 2019, 226, 1128–1137. [Google Scholar] [CrossRef]
  54. Jiménez-Parra, B.; Rubio, S.; Vicente-Molina, M.-A. Key Drivers in the Behavior of Potential Consumers of Remanufactured Products: A Study on Laptops in Spain. J. Clean. Prod. 2014, 85, 488–496. [Google Scholar] [CrossRef]
  55. Milfont, T.L. The Effects of Social Desirability on Self-Reported Environmental Attitudes and Ecological Behaviour. Environmentalist 2009, 29, 263–269. [Google Scholar] [CrossRef]
Figure 1. A screenshot of the online survey. Respondents were presented a series of product options with attributes at varying levels. Respondents selected the product they most preferred. Attributes with equivalent levels are highlighted in gray to simplify respondents’ choice.
Sustainability 13 12348 g001
Figure 2. Identified customer segments and their characteristics. “Circular Enthusiasts” and “Price-Sensitive, Open to Circular”—which express relatively high utilities for relatively more circular products—emerged in every experiment.
Sustainability 13 12348 g002
Table 1. Sample Demographics.
Mobile Phone (N = 400)Robot Vacuum Cleaner
(N = 400)
Mean Age (range)37.98 (18, 74)38.28 (18, 82)
Sex
male112139
female288261
Location in the UK
England348354
Scotland2725
Wales1717
Northern Ireland84
Employment Status
Full-time employed197239
Part-time employed11294
Not paid work (e.g., homemaker)7963
Job-seeking64
Other60
Student Status
Yes6257
No338343
Highest education level attained
Secondary (GCSE)3957
Technical/community college4426
High school diploma/A-levels8770
Undergraduate (BA, BSc, other)126136
Graduate (MA, MSc, Mphil, other)4862
Doctorate119
No formal qualifications11
No information provided4439
Income (GBP)
Below 15,999 5151
16,000–29,999 8290
30,000–49,999 115125
50,000–99,999 8188
Above 100,000 910
would rather not say 6236
Table 2. Description of attributes and their respective levels.
AttributeLevels (Description as Appearing in the Survey)
Circular economy score
  • 0% circular—everything in the product comes from new materials
  • 25% circular—the product contains recycled materials
  • 50% circular—half of the product is made of refurbished/reused parts
  • 75% circular—most of the product is made of refurbished parts
  • 100% circular—the whole product is reused or made of refurbished parts
Easy to fix
  • Device can be taken apart and easily repaired at home
  • Critical parts (e.g., battery, display) can be replaced at home
  • Device is sealed and only software/firmware updates are available
Appearance
  • Looks used (scratches, etc.)
  • Looks brand-new
Battery life
  • As new
  • 80% of new
  • 50% of new
Customer service
  • A drop-in service point
  • Only online support
Reseller type
  • Authorized dealer
  • Third-party shop
  • Shop on eBay
Warranty
  • Extended to 3 years
  • 2 years
  • 6 months
  • No warranty
Price (variant 1, in GBP)
  • 259
  • 379
  • 499
  • 629
Price (variant 2, in GBP)Random prices were drawn from 259–629 range, rounded up to the nearest 9
Table 3. Group means and F-ratios.
Experiment 1. Mobile Phones, Fixed Prices
Group Means
AttributesLevels1234F-Ratio
Aesthetic ShoppersPrice-Sensitive, Open to CircularNewest ModelCircular Enthusiast
CE Score (% recirculated content)0 (brand new)22.89−21.0485.79−72.80116.75
258.792.6157.87−10.7831.63
506.568.350.7218.954.14
75−19.836.12−66.6523.1267.48
100 (total reuse)−18.413.96−77.7341.5060.25
Easy to fixfully reparable1.7314.574.2216.748.54
critical parts9.6810.799.317.862.48
not reparable−11.42−25.35−13.52−34.596.93
Appearancescratches−96.91−40.08−49.91−25.5257.69
looks new96.9140.0849.9125.5257.69
Battery life100%85.0153.6843.5155.5711.16
80%10.3519.76−8.4117.237.03
50%−95.35−73.43−35.1−72.88.66
Customer Serviceshop5.315.976.979.841.05
email−5.31−5.97−6.97−9.841.05
Reseller typedealer40.8222.5644.1346.4710.26
third-party−8.28−4.88−12.3−6.290.48
auction−32.53−17.68−31.84−40.184.14
Warranty (months)3641.3337.8945.2945.800.9
2442.0338.8743.6644.530.58
6−8.63−2.61−14.1−18.514.32
0−74.73−74.14−74.85−71.820.05
Price (GBP)25930.75107.437.5449.25106.41
3791859.7530.927.5562.54
499−0.63−14.425.36−4.269.03
629−48.12−152.73−73.81−72.54110.26
GroupCluster Size6676174433.16
Experiment 2. Mobile Phones, Variable Prices
Group Means
AttributesLevels1234F-Ratio
Price-SensitiveAesthetic shoppersPrice-Sensitive, Open to CircularCircular Enthusiast
CE Score (% recirculated content)0 (brand new)−11.2638.59−41.88−133.6055.85
251.2117.22−6.19−47.1129.48
506.702.1410.8423.877.19
754.51−17.9916.4456.3835.28
100 (total reuse)−1.16−39.9720.79100.4651.26
Easy to fixfully reparable8.562.7713.6617.194.16
critical parts7.244.879.8910.611.25
not reparable−15.80−7.64−23.54−27.85.40
Appearancescratches−45.14−78.08−45.30−5.7514.56
looks new45.1478.0845.305.7514.56
Battery life100%38.5479.3553.6113.2623.03
80%15.4012.1823.4416.782.93
50%−53.94−91.52−77.05−30.0513.75
Customer Serviceshop4.416.166.727.160.23
email−4.41−6.16−6.72−7.160.23
Reseller typedealer22.4737.3931.3033.073.51
third-party−4.74−5.66−3.799.642.53
auction−17.73−31.73−27.51−42.724.03
Warranty (months)3616.7947.0652.8838.3332.68
2425.8241.8450.6727.0116.87
62.75−8.16−9.480.114.28
0−45.36−80.74−94.07−65.4522.14
Price (GBP)259134.8830.4876.2336.7995.30
37976.3620.7834.8533.0069.93
499−16.855.030.3319.3321.82
629−194.39−56.29−111.41−89.13132.68
GroupCluster Size785555937.11
Experiment 3. Robot Vacuum Cleaner, Fixed Prices
Group Means
AttributesLevels1234F-Ratio
Price-SensitiveRisk-AversePrice-Sensitive, Open to CircularCircular Enthusiast
CE Score (% recirculated content)0 (brand new)−9.6421.83−91.05−128.0984.79
250.8112.92−33.9−16.8227.58
509.1413.1722.6641.2713.04
750.71−20.5841.9247.1557.2
100 (total reuse)−1.02−27.3460.3756.4855.46
Easy to fixfully reparable20.4128.1435.452.229.08
critical parts9.755.748.7515.832.18
not reparable−30.16−33.88−44.15−68.057.68
Appearancescratches−25.36−56.88−12.67−12.2229.39
looks new25.3656.8812.6712.2229.39
Battery life100%49.6952.0536.6448.922.46
80%12.516.9916.9313.180.97
50%−62.19−69.04−53.57−62.11.27
Customer Serviceshop1.385.10−0.846.821.64
email−1.38−5.100.84−6.821.64
Reseller typedealer23.6440.097.9814.8913.1
third-party−6.2−16.14−2.08−11.454.59
auction−17.44−23.95−5.9−3.455.2
Warranty (months)3647.2661.1434.546.86.75
2439.3743.4930.1451.022.54
6−14.15−18.63−6.83.274.86
0−72.48−86.00−57.84−101.095
Price (GBP)259134.1523.83114.1145.1196.13
37977.0118.5363.5510.4782.09
499−27.132.81−13.937.0513.03
629−184.03−45.18−163.73−62.62139.89
GroupCluster Size1114442939.33
Experiment 4. Robot Vacuum Cleaner, Variable Prices
Group Means
AttributesLevels1234F-Ratio
Price-Sensitive, Open to CircularRisk-AverseCircular EnthusiastPrice-Sensitive
CE Score (% recirculated content)0 (brand new)−23.6751.12−105.01−18.7974.20
25−1.1413.73−58.980.9847.62
504.75−7.2120.598.6310.91
756.12−27.8760.99−1.1849.16
100 (total reuse)13.94−29.7782.4110.3653.34
Easy to fixfully reparable25.5720.2323.8127.801.61
critical parts4.03−5.166.7310.728.15
not reparable−29.60−15.07−30.55−38.528.09
Appearancescratches−15.71−37.86−16.31−16.7010.14
looks new15.7137.8616.3116.7010.14
Battery life100%25.6854.1538.7841.239.93
80%10.603.8719.9913.906.43
50%−36.28−58.02−58.77−55.135.81
Customer Serviceshop0.279.780.808.624.68
email−0.27−9.78−0.80−8.624.68
Reseller typedealer13.2041.4316.7516.639.37
third-party3.65−5.353.26−0.403.50
auction−16.85−36.09−20−16.235.43
Warranty (months)3625.3157.1827.3558.1127.35
2429.2640.4830.3551.0112.15
6−2.72−9.85−11.41−8.962.82
0−51.84−87.80−46.3−100.1623.93
Price (GBP)259175.5441.9480.57114.74128.96
37992.1039.0951.5762.1241.07
499−41.6911.522.95−0.3344.22
629−225.95−92.54−135.08−176.52132.21
GroupCluster Size7539275343.10
Publisher’s Note: MDPI stays neutral with regard to jurisdictional claims in published maps and institutional affiliations.

