Article

Investigating the Impact of Professional and Nonprofessional Hosts’ Pricing Behaviors on Accommodation-Sharing Market Outcome

1
School of Computer Science, Inner Mongolia University, Huhhot 010010, China
2
School of Economics and Management, Yan An University, Yan’an 716000, China
*
Author to whom correspondence should be addressed.
Sustainability 2021, 13(21), 12331; https://doi.org/10.3390/su132112331
Submission received: 25 August 2021 / Revised: 3 November 2021 / Accepted: 3 November 2021 / Published: 8 November 2021

Abstract

:
Nonprofessional hosts in the P2P accommodation-sharing markets have been demonstrated to be inferior in pricing. The sharing market is increasingly recruiting more professional hosts but is bothered by the disharmony from nonprofessionals’ feelings of being cast aside in this drive. To respond to this practice and disharmony, we develop a modeling framework with price-sensitive customers and earning-based hosts to investigate how varying ratios of professional and nonprofessional hosts affect pricing and impact sharing-market outcomes according to contemporary and long-term success indicators. This study is one of the first attempts to examine whether more professional hosts as supply decision makers is more beneficial to the sharing market. Numerical experiments for model analysis led to two primary managerial implications. A high ratio of professional hosts does not necessarily maximize indicators of hosts’ earnings, platform’s profit, or supply size, indicators that measure the accommodation-sharing market’s contemporary and long-term success. In addition, the market improves with magnified differences in the unique features of two types of hosts and they can cater to customers’ experiences and expectations, differentiating the market positioning of the two types of hosts.

1. Introduction

In recent years, the accommodation-sharing rental market has experienced particularly strong growth [1,2]. For instance, Airbnb, one of the most popular and frequently discussed accommodation-sharing models, has over 7 million listings in 100,000 cities and 220 countries worldwide as of January 2020. The accommodation-sharing markets follow the two-sided-market paradigm, however, they are different from traditional two-sided markets on the supply side: The former include both nonprofessional and professional hosts, whereas the latter usually recruit firms and professionals as the supply decision makers (e.g., credit card markets, software markets, etc. [3]). Professional hosts are hosts who hold two or more listings, and nonprofessional agents refer to those who hold a single listing [2,3,4]. Hosts in accommodation-sharing markets decide whether they want to offer their properties, the quantity, and the price. In recent years, a stream of related research has emerged and claimed that, compared to professionals, nonprofessional hosts are inferior in terms of pricing, whereas professional players are much better at adopting dynamic pricing strategies [5,6]. Nonprofessional hosts may forfeit potential revenue due to their inefficient pricing behaviors [7]. Platform firms such as Airbnb thus tend to recruit more professional hosts to the accommodation-sharing market, which leads to rapid growth in the number of professional decision makers [8]. As a result, the accommodation-sharing market is quickly moving away from the “sharing” paradigm and becoming a short-term rental market. In addition, nonprofessional hosts increasingly feel cast aside by these sharing-platform firms [9]. Considering this distortion of the “sharing” aspect of the shared-accommodation market, and nonprofessional hosts displeasure with the platforms, two research questions arise in this paper: First, is having more professional players while slighting the interests of nonprofessional hosts really beneficial to the accommodation-sharing market? Xie and Mao (2021) showed that professional hosts (i.e., multi-listing hosts) underperform nonprofessional hosts (i.e., single-listing hosts) in profit per listing. Such inconclusive findings can foil practitioners’ understanding of professional hosts’ success.
The other question asks what revenue indicator can guarantee the long-term prosperity of the market since market development is usually measured in terms of multiple indicators such as supplier size, profit per listing (in the accommodation-sharing context), and others.
To the best of our knowledge, few studies address the above two questions. Therefore, we have developed a model framework by including multiple indicators to examine whether more professional hosts is beneficial for the accommodation-sharing market in terms of both contemporary revenue and profit and long-term prosperity as indicated by supplier size and other measures [10]. In this model framework, hosts are assumed to be earnings-based and profit maximizing per listing held. Most often, the seller’s goal is to design a pricing policy that maximizes his or her cumulative revenue [11]. While some (such as Uber) believe that sharing-market suppliers decide to or not to provide service rest based on profit per unit of service, hosts’ goal is assumed to be to maximize profit per listing in this paper. The customers in the framework are assumed to be utility sensitive and have different preferences when choosing between rental services provided by the two types of hosts. The difference in consumer preferences is characterized by a Hotelling model [12]. In addition, our model framework sheds a light on stakeholders’ perspectives, including both platform firms and hosts. Many previous studies were based only on the perspective of the platform firms’ interests. Since the state of demand has always been the most critical condition of the market [13,14,15], the examination the model aims to complete rests in the context of different demand states.
As the model framework is intractable, we conduct numerical experiments to obtain conclusions. Based on the numerical experiment results, we offer practitioners several managerial insights. First, it is one of first attempts to investigate whether recruiting more professional decision makers is better for the accommodation sharing market; second, we provided a modeling framework for such examination; and third, a number of managerial insights are obtained, and the market may re-consider their existing strategy for maximizing profit or promoting the market’s prosperity by recruiting more professional hosts to the market.
In the remainder of this paper, we list the related literature in Section 2 and develop the modeling framework in Section 3. Section 4 develops a special case of just one type of host, professional or nonprofessional. The numerical experiments for the base and general models are presented in Section 5. Section 6 discusses the managerial insights for the accommodation-sharing economy. Section 7 concludes the paper.

2. Literature Review

This paper investigates how varying ratios of nonprofessional and professional hosts interplay in pricing and how their interactions further affect the accommodation-sharing market’s performance under different market-demand conditions, including the related issues of pricing in the accommodation-sharing market and the impact of pricing interactions between professional and nonprofessional decision makers on market outcomes.

2.1. Price Issues in the Accommodation-Sharing Market

Pricing issues in the sharing market deal mainly with the determinants of the price of accommodation-rental services, how individual decision makers behave in pricing, and the corresponding consequences.
Many extant studies have discussed the price determinants of accommodation-rental services in the sharing market. Demand is frequently reported as one of the most important price determinants in most fields [16,17]. For listings in the accommodation-sharing market, price determinants are more complex [9,18,19]. Prices in Airbnbs are demonstrably impacted by the learned experience of the individual hosts: Wu [20] (2016) suggests that hosts with less experience are at a disadvantage in terms of knowledge and dynamic-pricing skills. In addition to those studies, much evidence suggests that, compared to professional hosts, nonprofessional hosts use potentially ineffective pricing systems, including insufficient price adjustments and inadequate responses to well-known demand shocks [3,21] that determine pricing choices for tourist rental accommodations. Researchers have demonstrated that a price differential exists between professional and opportunistic sellers, and seasonality in demand impacts the size and direction of this price differential [22].
In addition, other researchers have analyzed whether consumers’ preferences—evaluated through social media—for different tourist sites have a significant impact on Airbnb’s prices [23,24].

2.2. Price Interactions between Professional and Nonprofessional Decision Makers and Market Outcome

The role of price is frequently debated in economics [21,25,26]. Particularly in the field of hospitality and airline transportation management, price is the most important criteria across hospitality choices [22,27]. The importance attributed to pricing decisions mainly arises from the intrinsic nature of the tourism product as a perishable and unstorable service [26], considering the near-zero marginal cost [28]. Agents in a market interact by price based on economic or behavior theory, the effect generated by the interactions are then transformed into the market outcomes. The one concept that has the most connection with price is the decision maker’s cumulative revenue. However, due to the flexible or wider use of the properties or time required to service the sharing market, supply decision makers are flexible in deciding the quantity of properties and the time they offer based on the profit per unit of service they earn. For example, in Uber, one of the most popular ride-sharing markets, Chen and Sheldon verified that dynamic pricing significantly affects the labor supply, the time supply decision makers offer [29]. Sometimes, dynamic adjustments to stochastic demand, such as a price surge (i.e., increasing the price as we approach the date of service consumption), have an adverse effect on cumulative revenue. Hence, it is not sufficient to only consider the cumulative revenue to measure the development of the shared accommodation market.
Researchers have suggested pricing is one of the most important factors affecting the size of the suppliers in the sharing market [30,31,32]. The revenue of the platform in two-sided markets and social welfare depend critically on the number of suppliers, and supply size is involved in the long-term success of the sharing market [33]. One thus must consider the supply size as another indicator of market development or one market outcome of the hosts’ price interactions in this paper.

3. A Modeling Framework with Price-Sensitive Customers and Earning-Based Hosts

In this paper, we begin with the accommodation-sharing markets of P2P platforms such as Airbnb or Tujia to develop our model framework. In this modeling framework, we make five assumptions:
  • Customers arrive at the platform to request rental service and meet the available hosts;
  • Professional hosts dynamically set prices to maximize profit per listing he/she provides to the sharing market;
  • Nonprofessional hosts accept given price values since they are demonstrated to have inferior dynamic pricing strategies;
  • The marginal cost of each unit of service is zero, as Roma et al. (2019) reported it is near to zero;
  • For simplicity, both types of hosts provide accommodation services of the same quality;
The market conditions are primarily classified into high- and low-demand periods, which are characterized by rates of potential customer demand and listings offered by hosts. Under each type of market condition, we study how varying ratios of professional and nonprofessional players, together with platform firms interact in pricing and how their interactions impact market outcome. Professional hosts and platform firms endogenously determine the best values for price per listing p p r o and a fee rate ω to charge customers for maximum profit. Note that to simplify exposition, we assume that the platform firm charges only the customer a fee; hosts pay no fee. This assumption is consistent with Airbnb’s strategy as it just charges hosts about 3% to cover the negligible transaction costs incurred on the platform [34]. The notations used in the modeling framework are listed in Table 1.

3.1. The Realized Customer Request Rate, λ

Consider a certain time period. The maximum potential customer demand rate at this time period is denoted as λ ¯ . The utility each customer gains from the accommodation-sharing service in a transaction depends on his or her value rate, θ , the quality of the service, q , the price rate, p , host’s charge for each listing transaction, and the fee rate customers pay to the platform firm, ω . As a result, the utility customers gain from, for example, renting from a nonprofessional host is U (θ) = θ q p n o n p r o ( 1 + ω ) , where q = E ( Q ) indicates the average quality level of properties in the accommodation-sharing market. The value of parameter θ falls on a continuum in the range of (0, 1) to model heterogeneous customers according to a cumulative distribution. The utility function U ( θ ) of a customer of value rate-type θ is given in Equation (1). A rational customer of valuation θ will request rental service if and only if U ( θ ) 0 :
U ( θ ) = θ q p ( 1 + ω )
The realized customer demand rate, λ , is captured in Equation (2):
λ = λ ¯ P r ( U ( θ ) 0 )
The potential customers are divided into two groups in this research, one requests service from the professional hosts, and the other requests from the nonprofessionals. The dividing process is described using Hotelling models [12] in Equations (3) and (4), wherein t implies the preference difference of customers choosing between two such groups of hosts.
λ ¯ n o n p r o = λ ¯ p p r o ( 1 + ω ) p n o n p r o ( 1 + ω ) + t 2 t
λ ¯ p r o = λ ¯ p n o n p r o ( 1 + ω ) p p r o ( 1 + ω ) + t 2 t
By substituting Equations (3) and (4) into (2), we obtain the realized customer demand rate for professional players λ p r o in (5) and nonprofessionals in (6), respectively:
λ p r o = λ ¯ p r o P r ( θ q p p r o ( 1 + ω ) 0 )
λ n o n p r o = λ ¯ n o n p r o P r ( θ q p n o n p r o ( 1 + ω ) 0 )

3.2. The Realized Number of Listings Participating Hosts Provide, k

Consider the same time period. Let K be the maximum number of potential listings that hosts provide on the platform to offer accommodation services. k denotes the realized number of listings that hosts provide. k p r o and k n o n p r o denote the respective realized supply size for each group of hosts under the price rates p p r o and p n o n p r o . (We have assumed that the platform charges hosts no fee. Thus, the parameter ω is not included in the models for k ). To simplify exposition, we further assume that each host, who may be professional or nonprofessional, offers only a single listing. Note that this is in contrast to the definition of professional hosts owning two or more listings [3]. This contradiction does not exist essentially due to the fact that professional agents maximize profit per listing offered, please refer to Equations (7) and (8). On the supply side of the market, the ratio of professional agents to the total number of potential hosts, K , is denoted as σ . This is the primary market parameter we control in the paper. After the value of σ is given, σ K represents the number of potential listings professional hosts offer on the platform. Moreover, ( 1 σ ) K is the number of the potential listings from nonprofessionals:
k n o n p r o = ( 1 σ ) K ¯ P r ( m i n ( 1 , λ n o n p r o k n o n p r o ) p n o n p r o r )
k p r o = σ K ¯ P r ( m i n ( 1 , λ p r o k p r o ) p p r o r )
In the paper, each host is sensitive to earning per listing and is heterogeneous in reservation earnings rate r . The type r of host is continuum over (0, R ) and follows a cumulative distribution assumed to be uniform. A potential host will list a rental service if and only if the expected earning p m i n ( 1 , λ / k ) per listing transaction is greater than or equal to the reservation earnings rate r . The realized numbers of participating listings from professional and nonprofessional hosts are characterized in Equations (7) and (8), respectively.

3.3. Problem Formulation

In the modeling framework, the groups of hosts, the platform firm, and the customers interact intricately through price rate p ( p p r o for professionals’ rental service and p n o n p r o for nonprofessionals’ rental service) and fee ω . Furthermore, these interactions are translated into the related market outcomes, which is measured in terms of π p r o , π n o n p r o , π ω , k , and r e v p r o to indicate the cumulative transaction value for professionals and nonprofessionals, the profit for the platform firm obtains, the number of hosts, and the professionals’ and total earnings per listing for professional decision makers, see Equations (9)–(15) below:
π p r o = p p r o m i n ( λ p r o , k p r o )
π n o n p r o = p n o n p r o m i n ( λ n o n p r o , k n o n p r o )
π = π p r o + π n o n p r o
π w = m a x ω ( π ω )
k = k p r o + k n o n p r o
r e v p r o = m a x p p r o ( m i n ( 1 , λ p r o / k p r o ) p p r o )
a e r = π k

4. The Base Models with Only Professional Hosts or Nonprofessionals on the Supply Side

To better analyze the sharing market mixed with both nonprofessional and professional hosts on the supply side, we develop two extreme markets in the modeling framework: One refers to the situation with only nonprofessional hosts on the supply side and a purely sharing market, and the other refers to the situation with only professional hosts, which is close to a short-term accommodation rental market rather than a sharing paradigm. We then extend these models to the general settings, under which both types of hosts coexist in the market by varying the ratio of professional agents on the market’s supply side while controlling for other market conditions. It is difficult to derive tractable results from these models, so we perform a number of numerical experiments to maximize the platform’s profit and professional hosts’ earnings per listing to solve the optimization problem described in Equations (12) and (14).

4.1. The Base Model with Only Nonprofessional Hosts on the Supply Side

In the setting with no professional hosts, λ ¯ n o n p r o λ ¯ and σ = 0 , λ n o n p r o λ , k n o n p r o k , and π π n o n p r o .
λ n o n p r o = λ ¯ n o n p r o P r ( θ q p n o n p r o ( 1 + ω ) 0 )
k n o n p r o = K ¯ P r ( m i n ( λ n o n p r o / k n o n p r o , 1 ) p n o n p r o r )
a e r = r e v n o n p r o = p n o n p r o m i n ( 1 , λ n o n p r o / k n o n p r o )
π ω = m a x ω ( m i n ( λ n o n p r o , k n o n p r o ) p n o n p r o ω )
π = π n o n p r o = p n o n p r o m i n ( λ n o n p r o , k n o n p r o )
The realized demand rate is represented in Equation (16) and the realized supply rate is in Equation (17).

4.2. The Base Model with Only Professional Hosts on the Supply Side

In this model, with no nonprofessional hosts at all, λ ¯ λ ¯ p r o , σ = 1 , λ λ p r o , k k p r o , and π π p r o . The accommodation-sharing market with only professional hosts on the supply side is near the short-term accommodation rental market. All professional hosts try to choose the optimal price rate, p p r o , to maximize their earning per listing. The market conditions are equal to the model with only nonprofessional hosts. The platform firm controls the optimal fee rate, ω , to maximize its profit. We conduct numerical experiments to obtain the near-optimal values for the price, p p r o , and fee rates, ω , by maximizing the value of pareto value in (24) as there exist two maximization optimization problems in Equations (22) and (23):
λ p r o = λ ¯ P r ( θ q p p r o ( 1 + ω ) 0 )
a e r = r e v p r o = m a x p p r o ( p p r o m i n ( 1 , λ p r o / k p r o ) )
π ω = max ω ( p p r o ω   m i n ( λ p r o , k p r o ) )
p v ( p a r e t o v a l u e ) = δ a e r ( p n o n p r o ) + ( 1 δ ) π ω ( ω )
The optimal price-rate and fee-rate values in (22) and (23) cannot be derived by KKT conditions. Because the model contains a multi-objective optimization problem. By assigning weights to each, it can be turned into a single-objective optimization problem. The solution of the single-objective optimization problem is equal to the Pareto solution of the original multi-objective optimization problem. We thus conduct numerical experiments to obtain the near-optimal values for the price rate p p r o and the fee rate ω and the resulting values of the market performances in the paper. δ is the concession weight made by the platform firm for the professional player’s profit interests.

4.3. The Extended Models for the Market with Varying Ratios of Professional Hosts over the Market Supply Side

The two models with σ = 0 and σ = 1 are modeled in earlier subsections. We extend them to the general situations with various ratios, σ , within the range (0, 1). This ratio refers to the number of potential professional hosts over the potential supply size of the market. Hence, σ K ¯ represents the potential number of professional hosts, and ( 1 σ ) K ¯ is the potential number of nonprofessionals. The realized numbers of these two groups of hosts are correspondingly denoted as k n o n p r o and k p r o . Since professional and nonprofessional hosts together constitute the supply side, customers must choose between the rental services from the two groups of hosts to meet their requests. We use a horizontal-difference version of the Hotelling model [12] to capture the customers’ choices. In consequence, the potential customer size λ is divided into λ n o n p r o as the realized customer size for nonprofessional hosts and λ p r o for the professional hosts. The dividing process is captured in (3) and (4). The corresponding realized demand rates are λ n o n p r o and λ p r o in (5) and (6):
π n o n p r o = p n o n p r o m i n ( λ n o n p r o , k n o n p r o )
π p r o = p p r o m i n ( λ p r o , k p r o )
a e r = π p r o + π n o n p r o k p r o + k n o n p r o
π ω = m a x ω ( π p r o + π n o n p r o ) ω
r e v p r o = m a x p p r o ( p p r o m i n ( 1 , λ p r o / k p r o ) )

5. Numerical Experiments

In the numerical experiments, we set the market-condition parameters with q = 25 and R = 25 . The high- and low-demand periods are described as ( λ ¯ = 100 , K ¯ = 50 ) and ( λ ¯ = 50 , K ¯ = 100 ) , respectively. p n o n p r o takes a value in the range of {5, 20}.

5.1. The Experimental Results for the Model with Only Nonprofessional Hosts

Table 2 provides a sample set of results in our numerical experiments for the model with only nonprofessional hosts on the supply side. The results show that, except the profit the platform firm receives, all values, the total market transaction value π = π n o n p r o , the average earning per listing the nonprofessional hosts obtain a e r , and the realized number of participating hosts a e r become larger when a e r is of value 20. Based on the results, a e r = r e v n o n p r o and k n o n p r o = K ¯ P r o b ( a e r r ) move in the same direction because Equation (15) can be rewritten as k = k n o n p r o P r ( r e v n o n p r o r ) . During all the demand periods, we found that when the host’s price is lower, the platform firm can charge higher transaction fees and thus sometimes have higher profits.

5.2. The Experimental Results for the Model with Only Professional Hosts

In this experiment setting, δ takes a value in {0.0, 0.5, 0.9}. Based on the results, we found that the market with only professional hosts outperforms the one with only nonprofessionals in the platform firm’s profit. Compared against the low-demand period, the market has more realized suppliers and is relatively better in the cumulative market transaction value and earnings per listing transaction during the high-demand period. If the platform firm puts a lower weight on hosts’ benefits, that is, the combination parameter δ is smaller, hosts are limited in their dynamic pricing range. This leads to a worse result in π , k , and a e r on the host side.
From the result of Table 2 and Table 3, we have Conclusion 1: More professional hosts guarantees the maximum profit benefit for the platform firm but not necessary the maximum supply size k , the average earnings per listing a e r , or the cumulative transaction value π in the whole market.

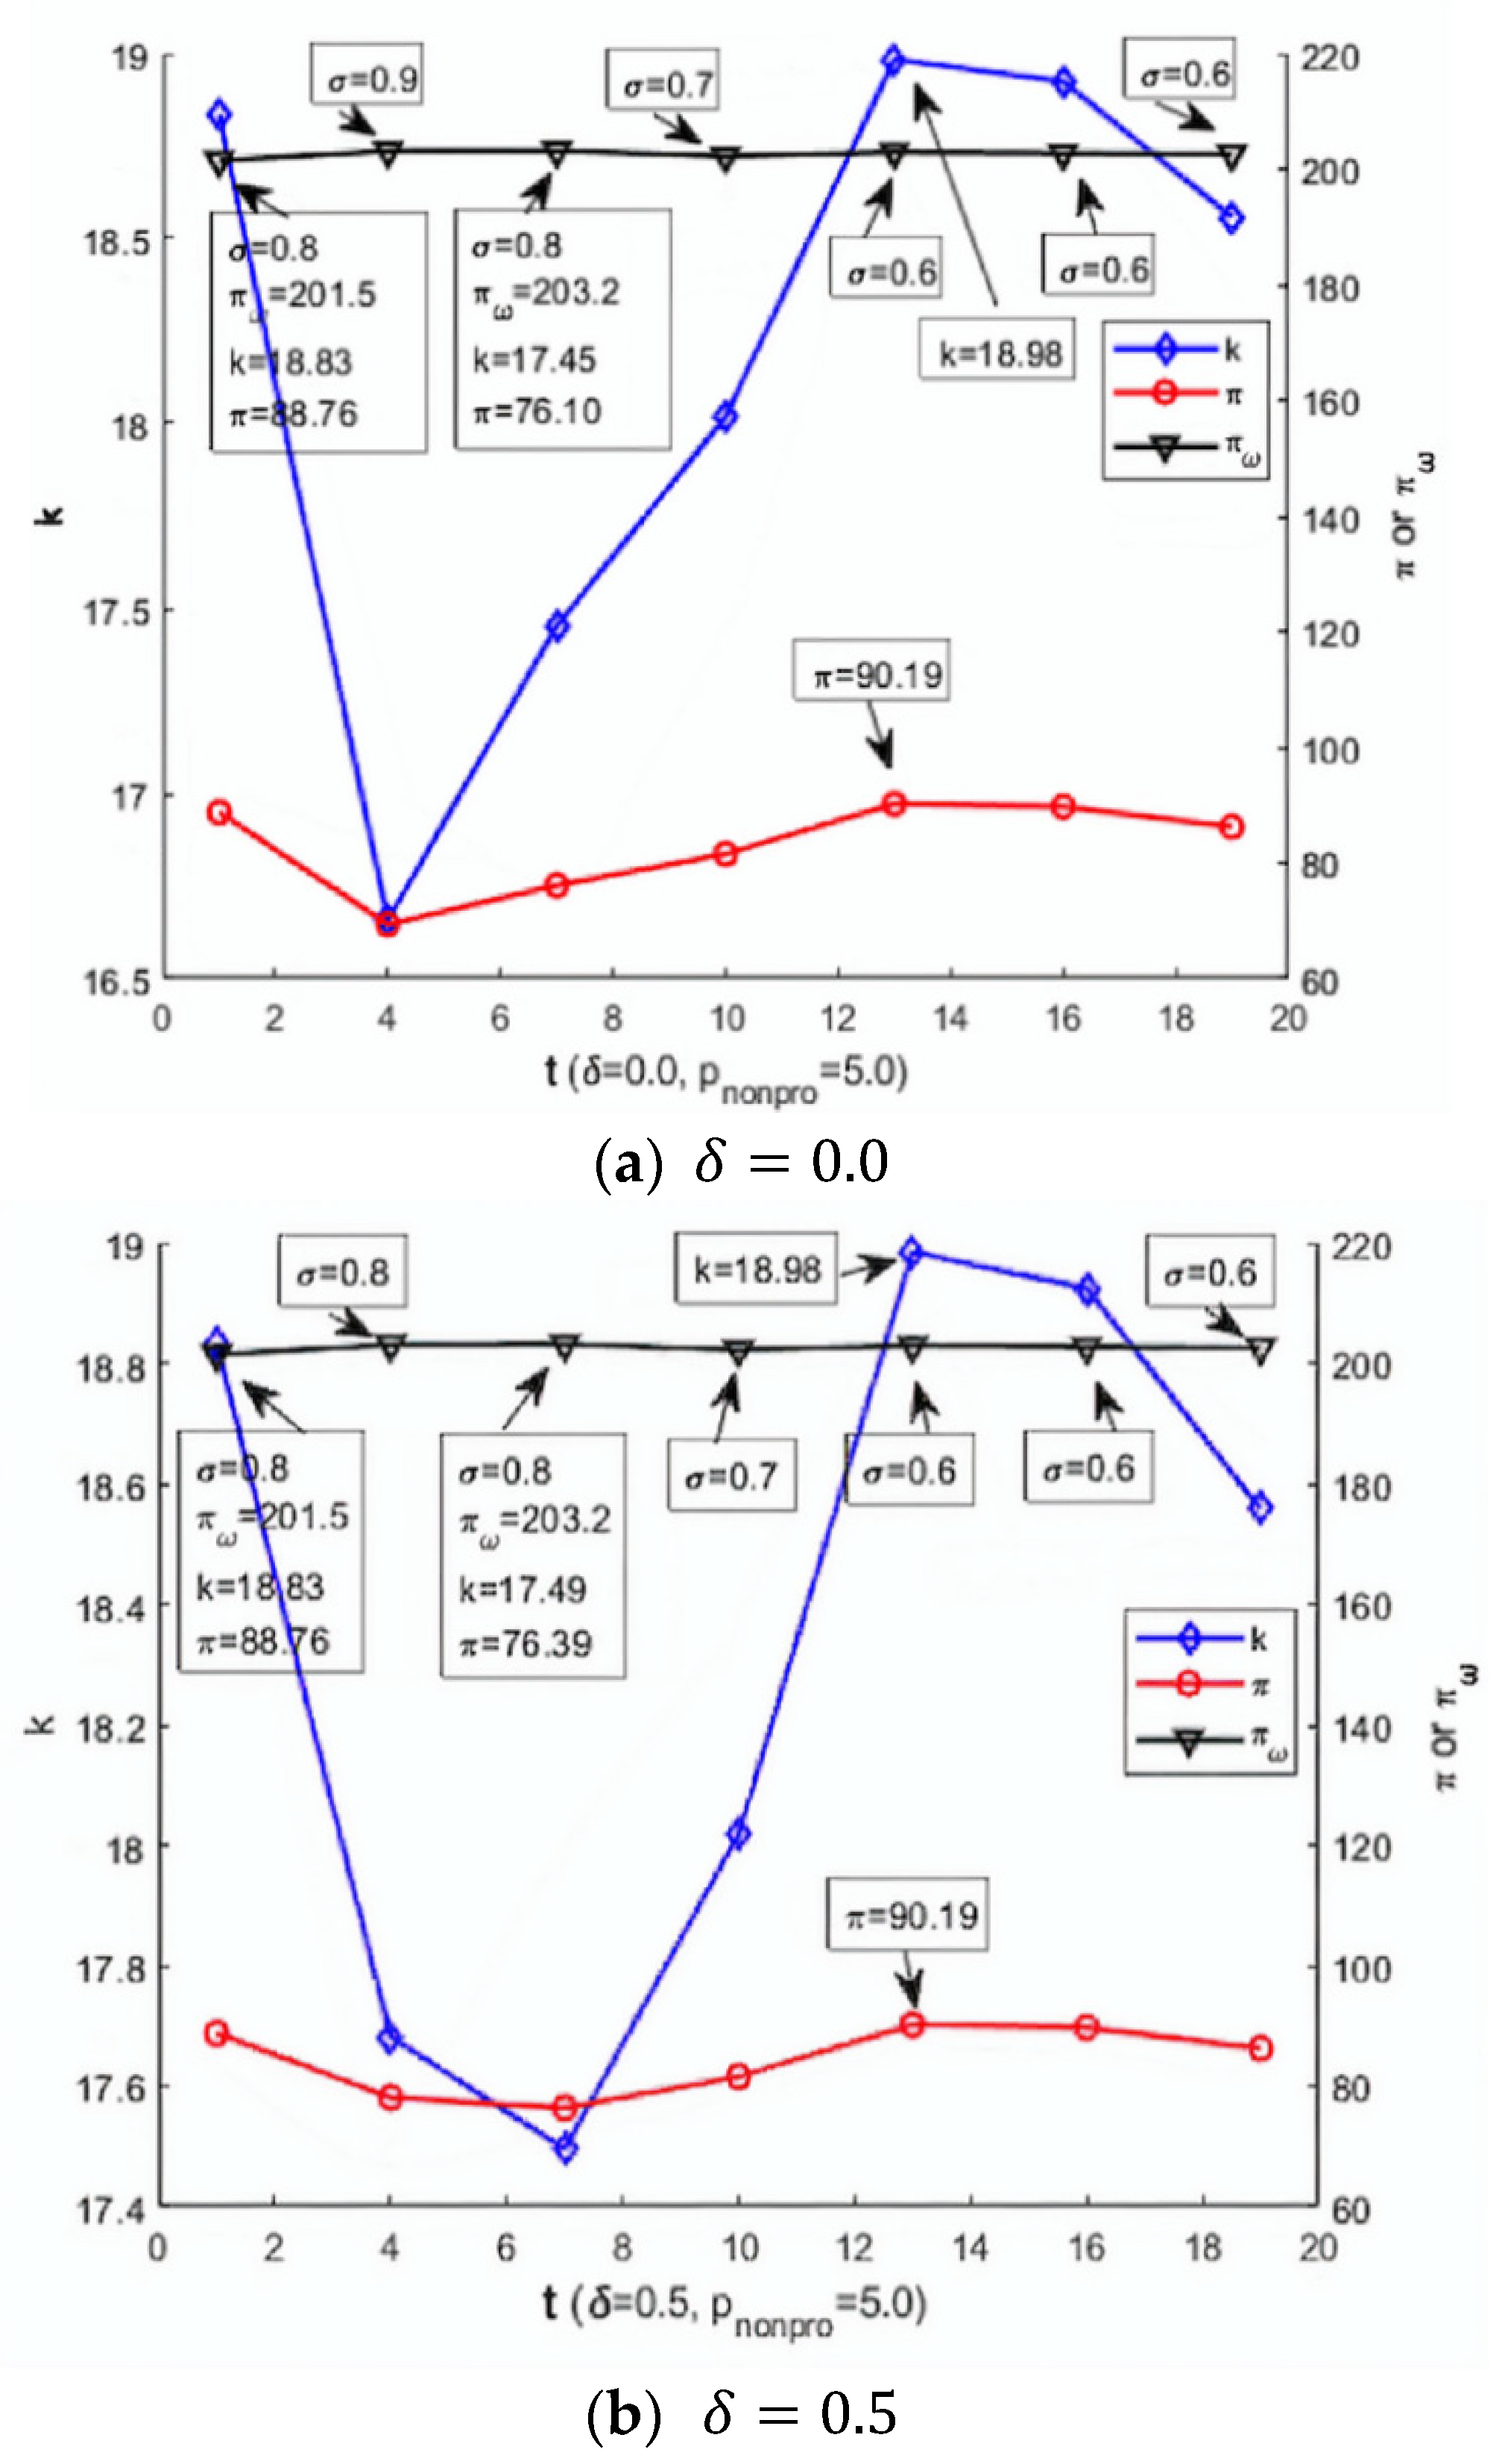
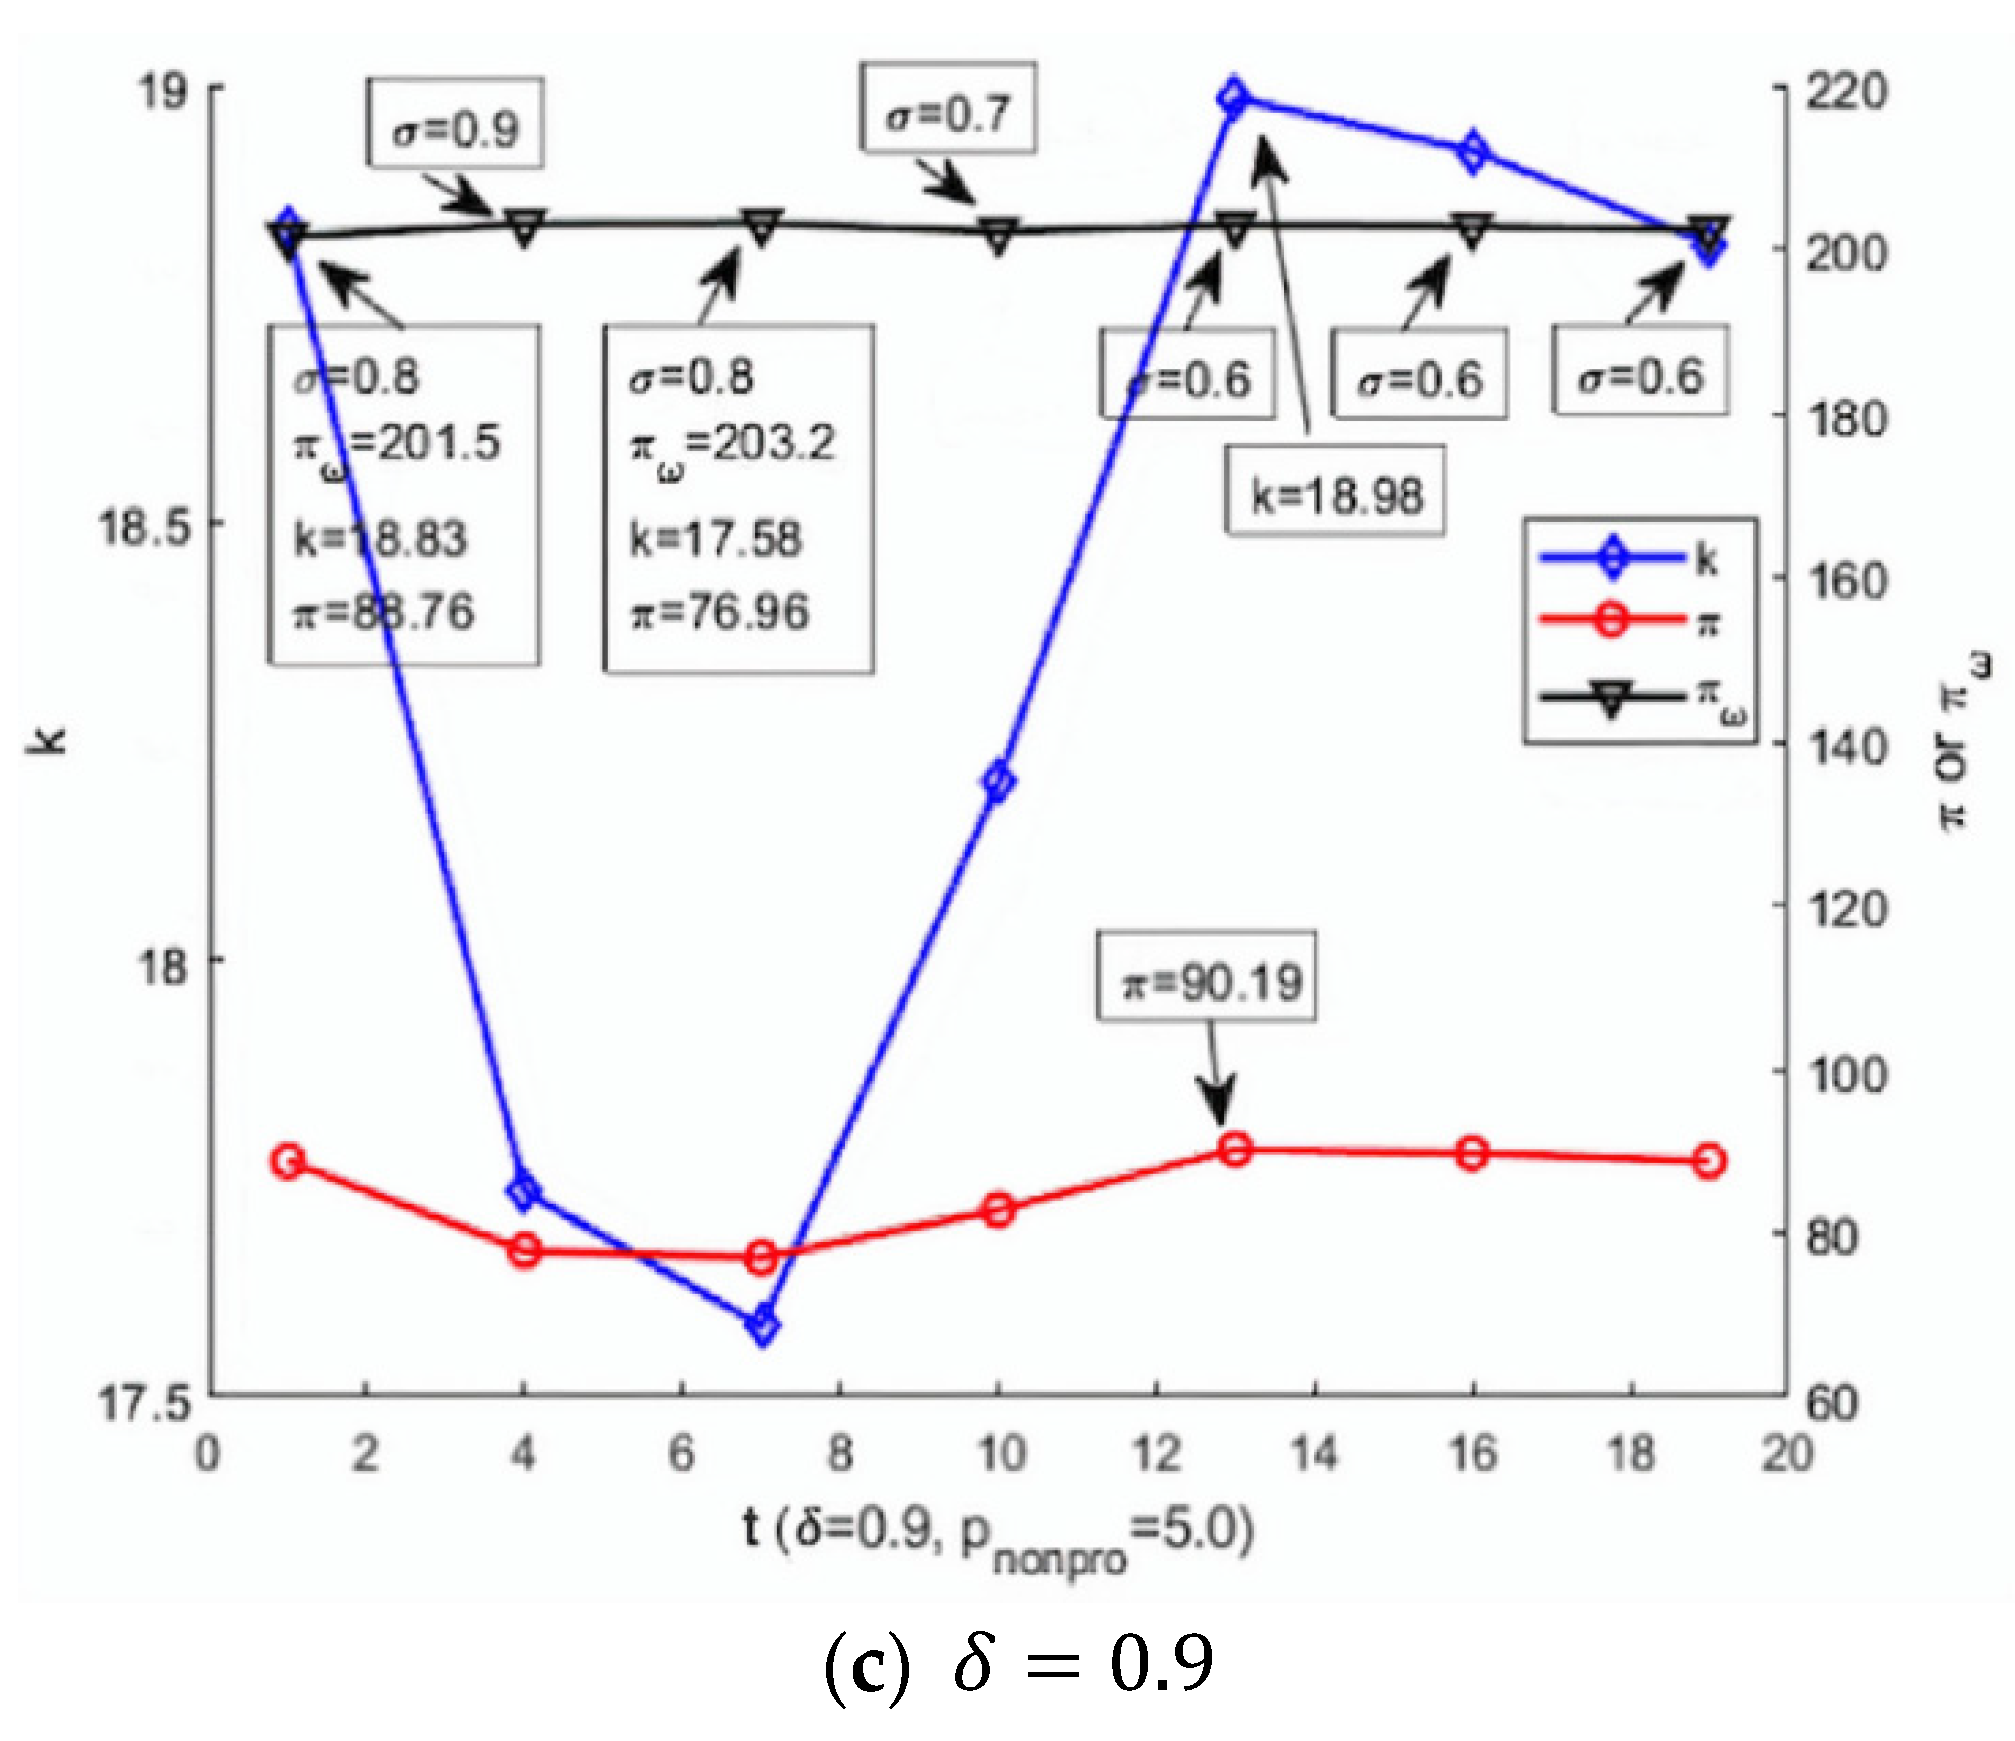
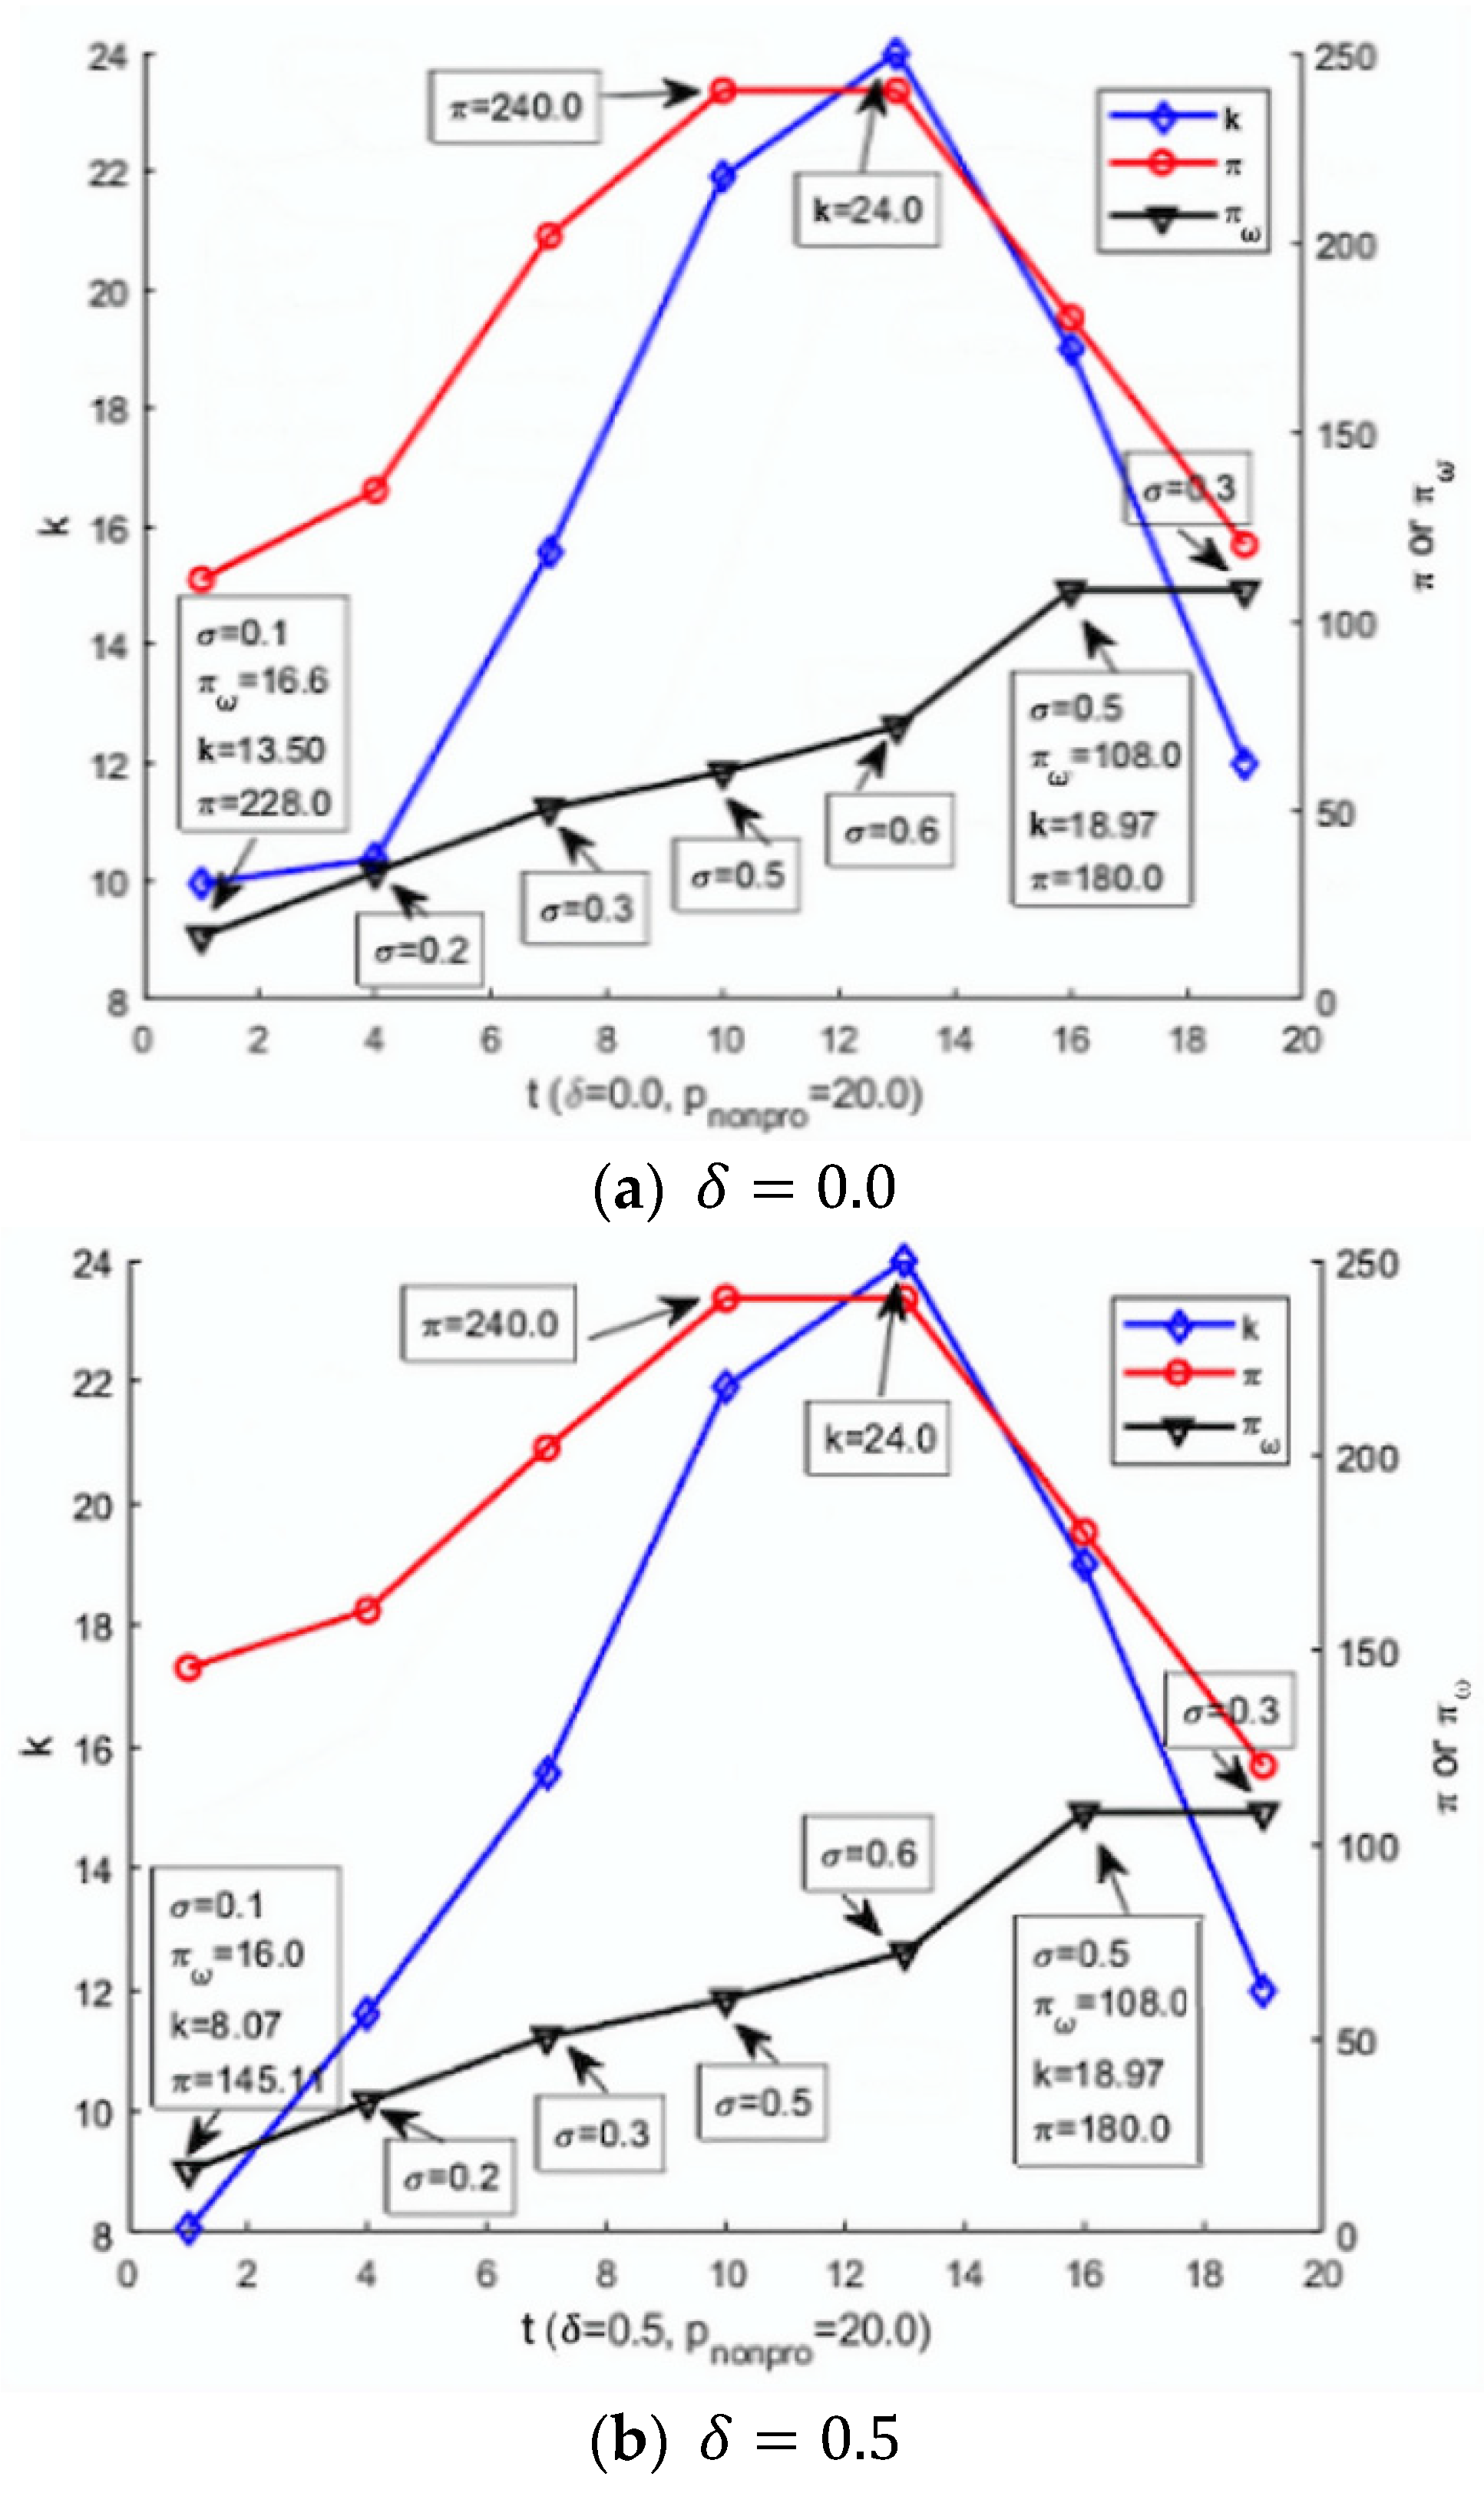
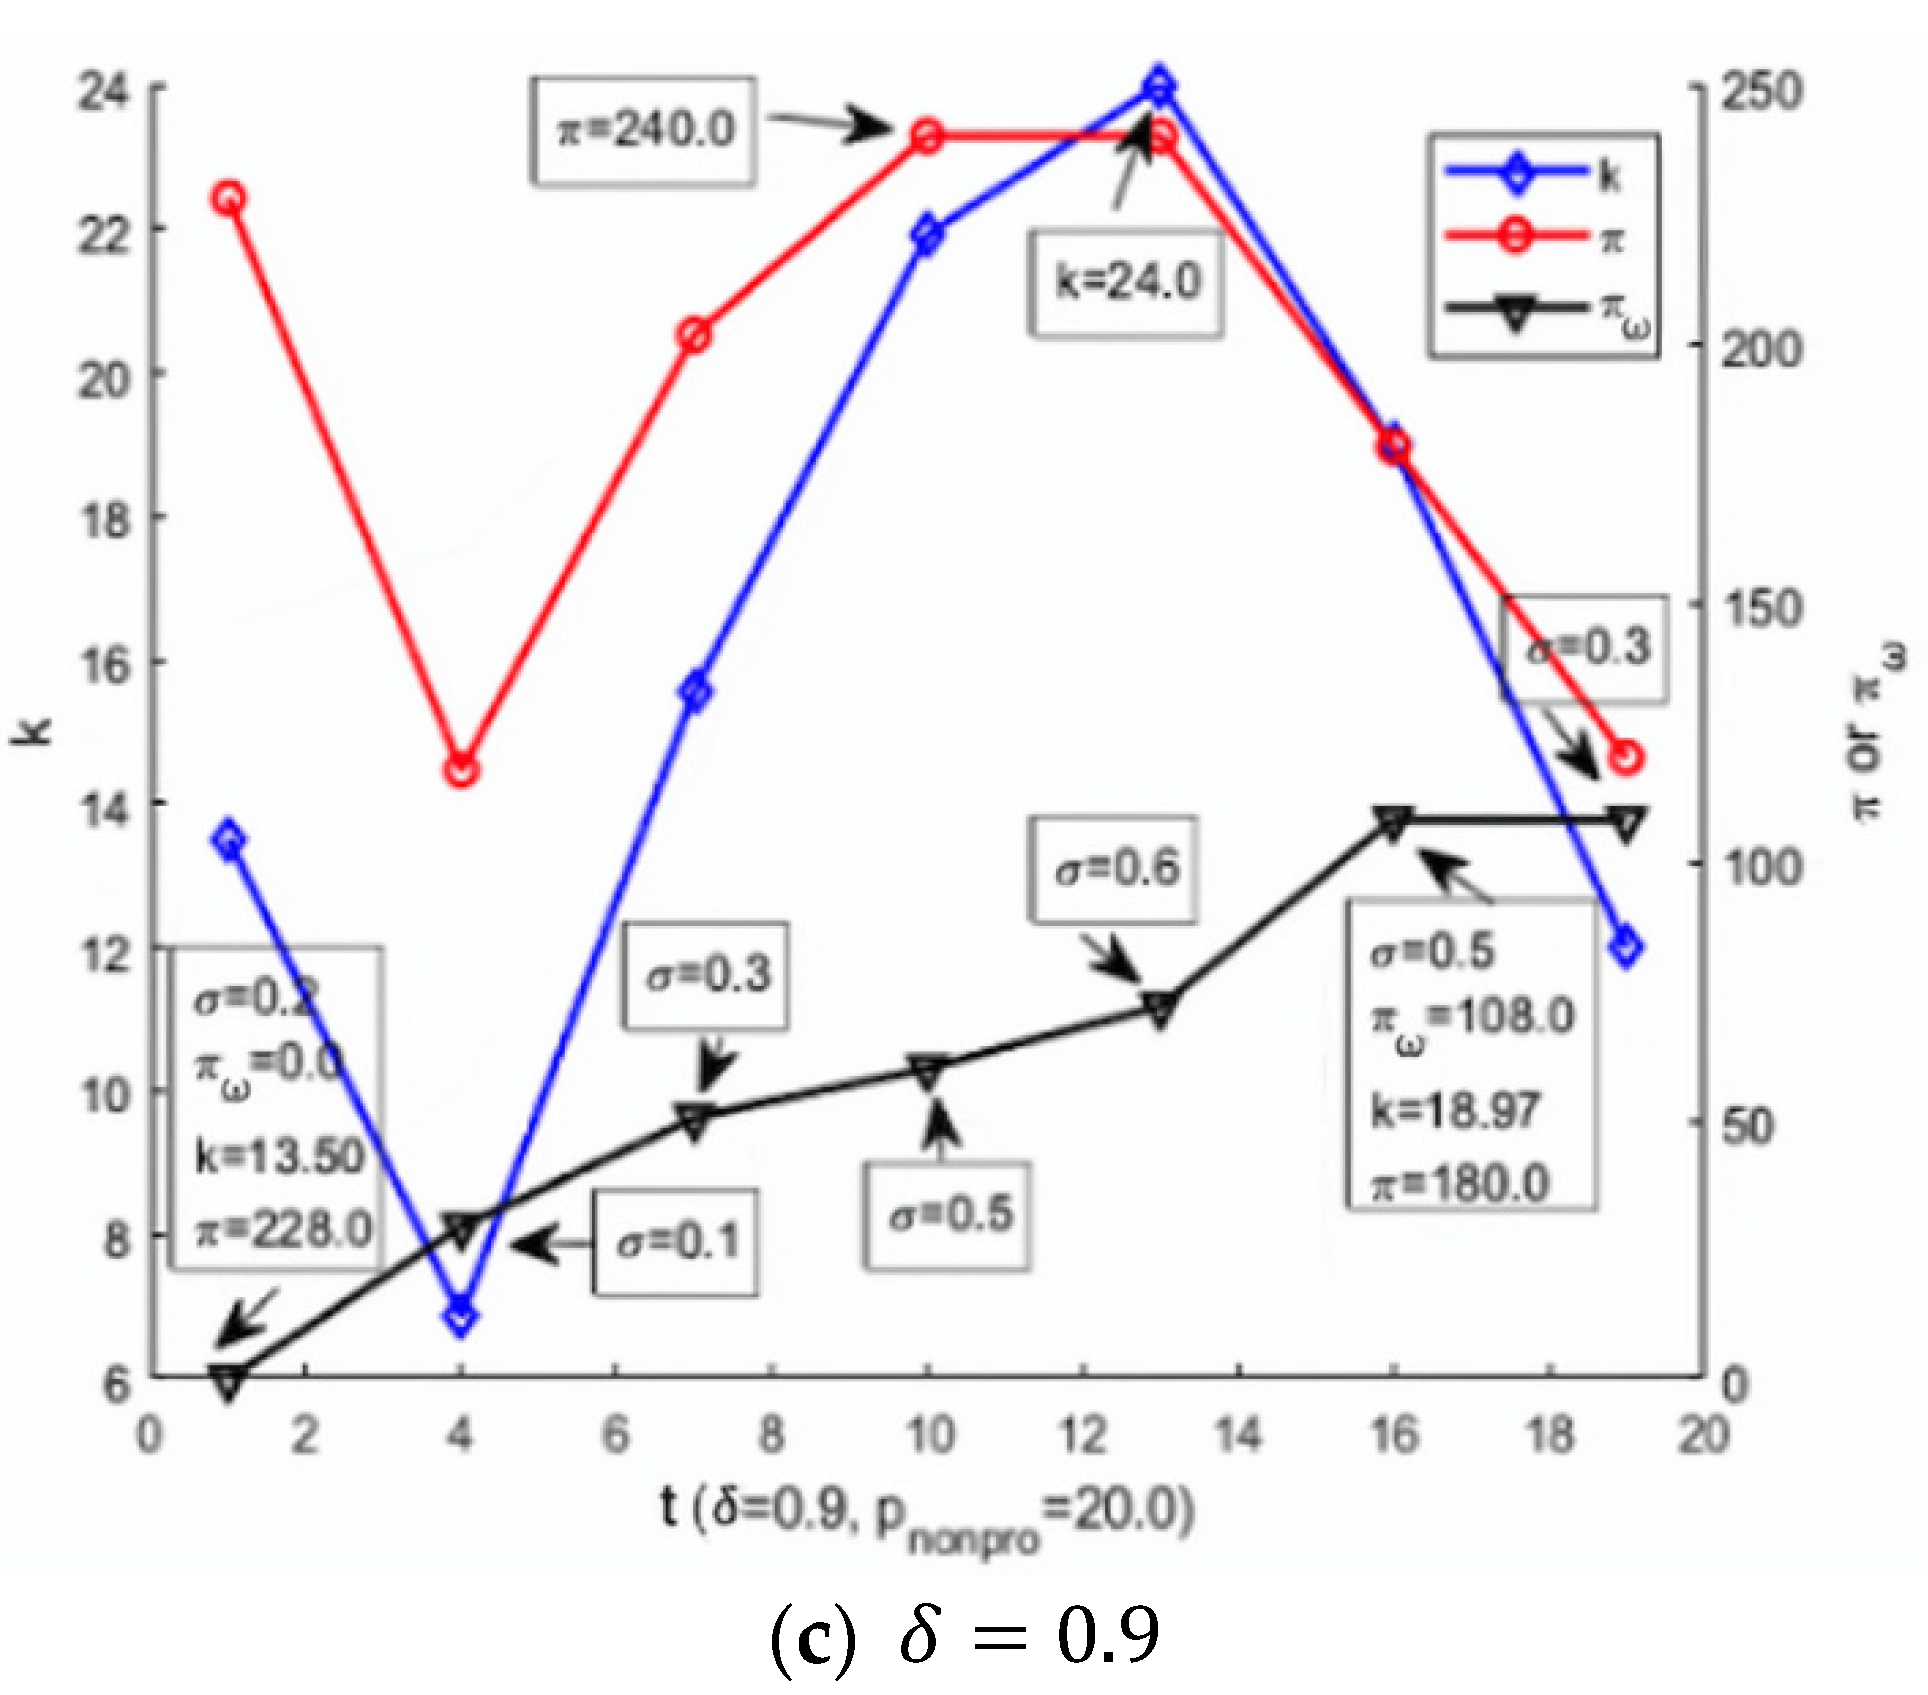
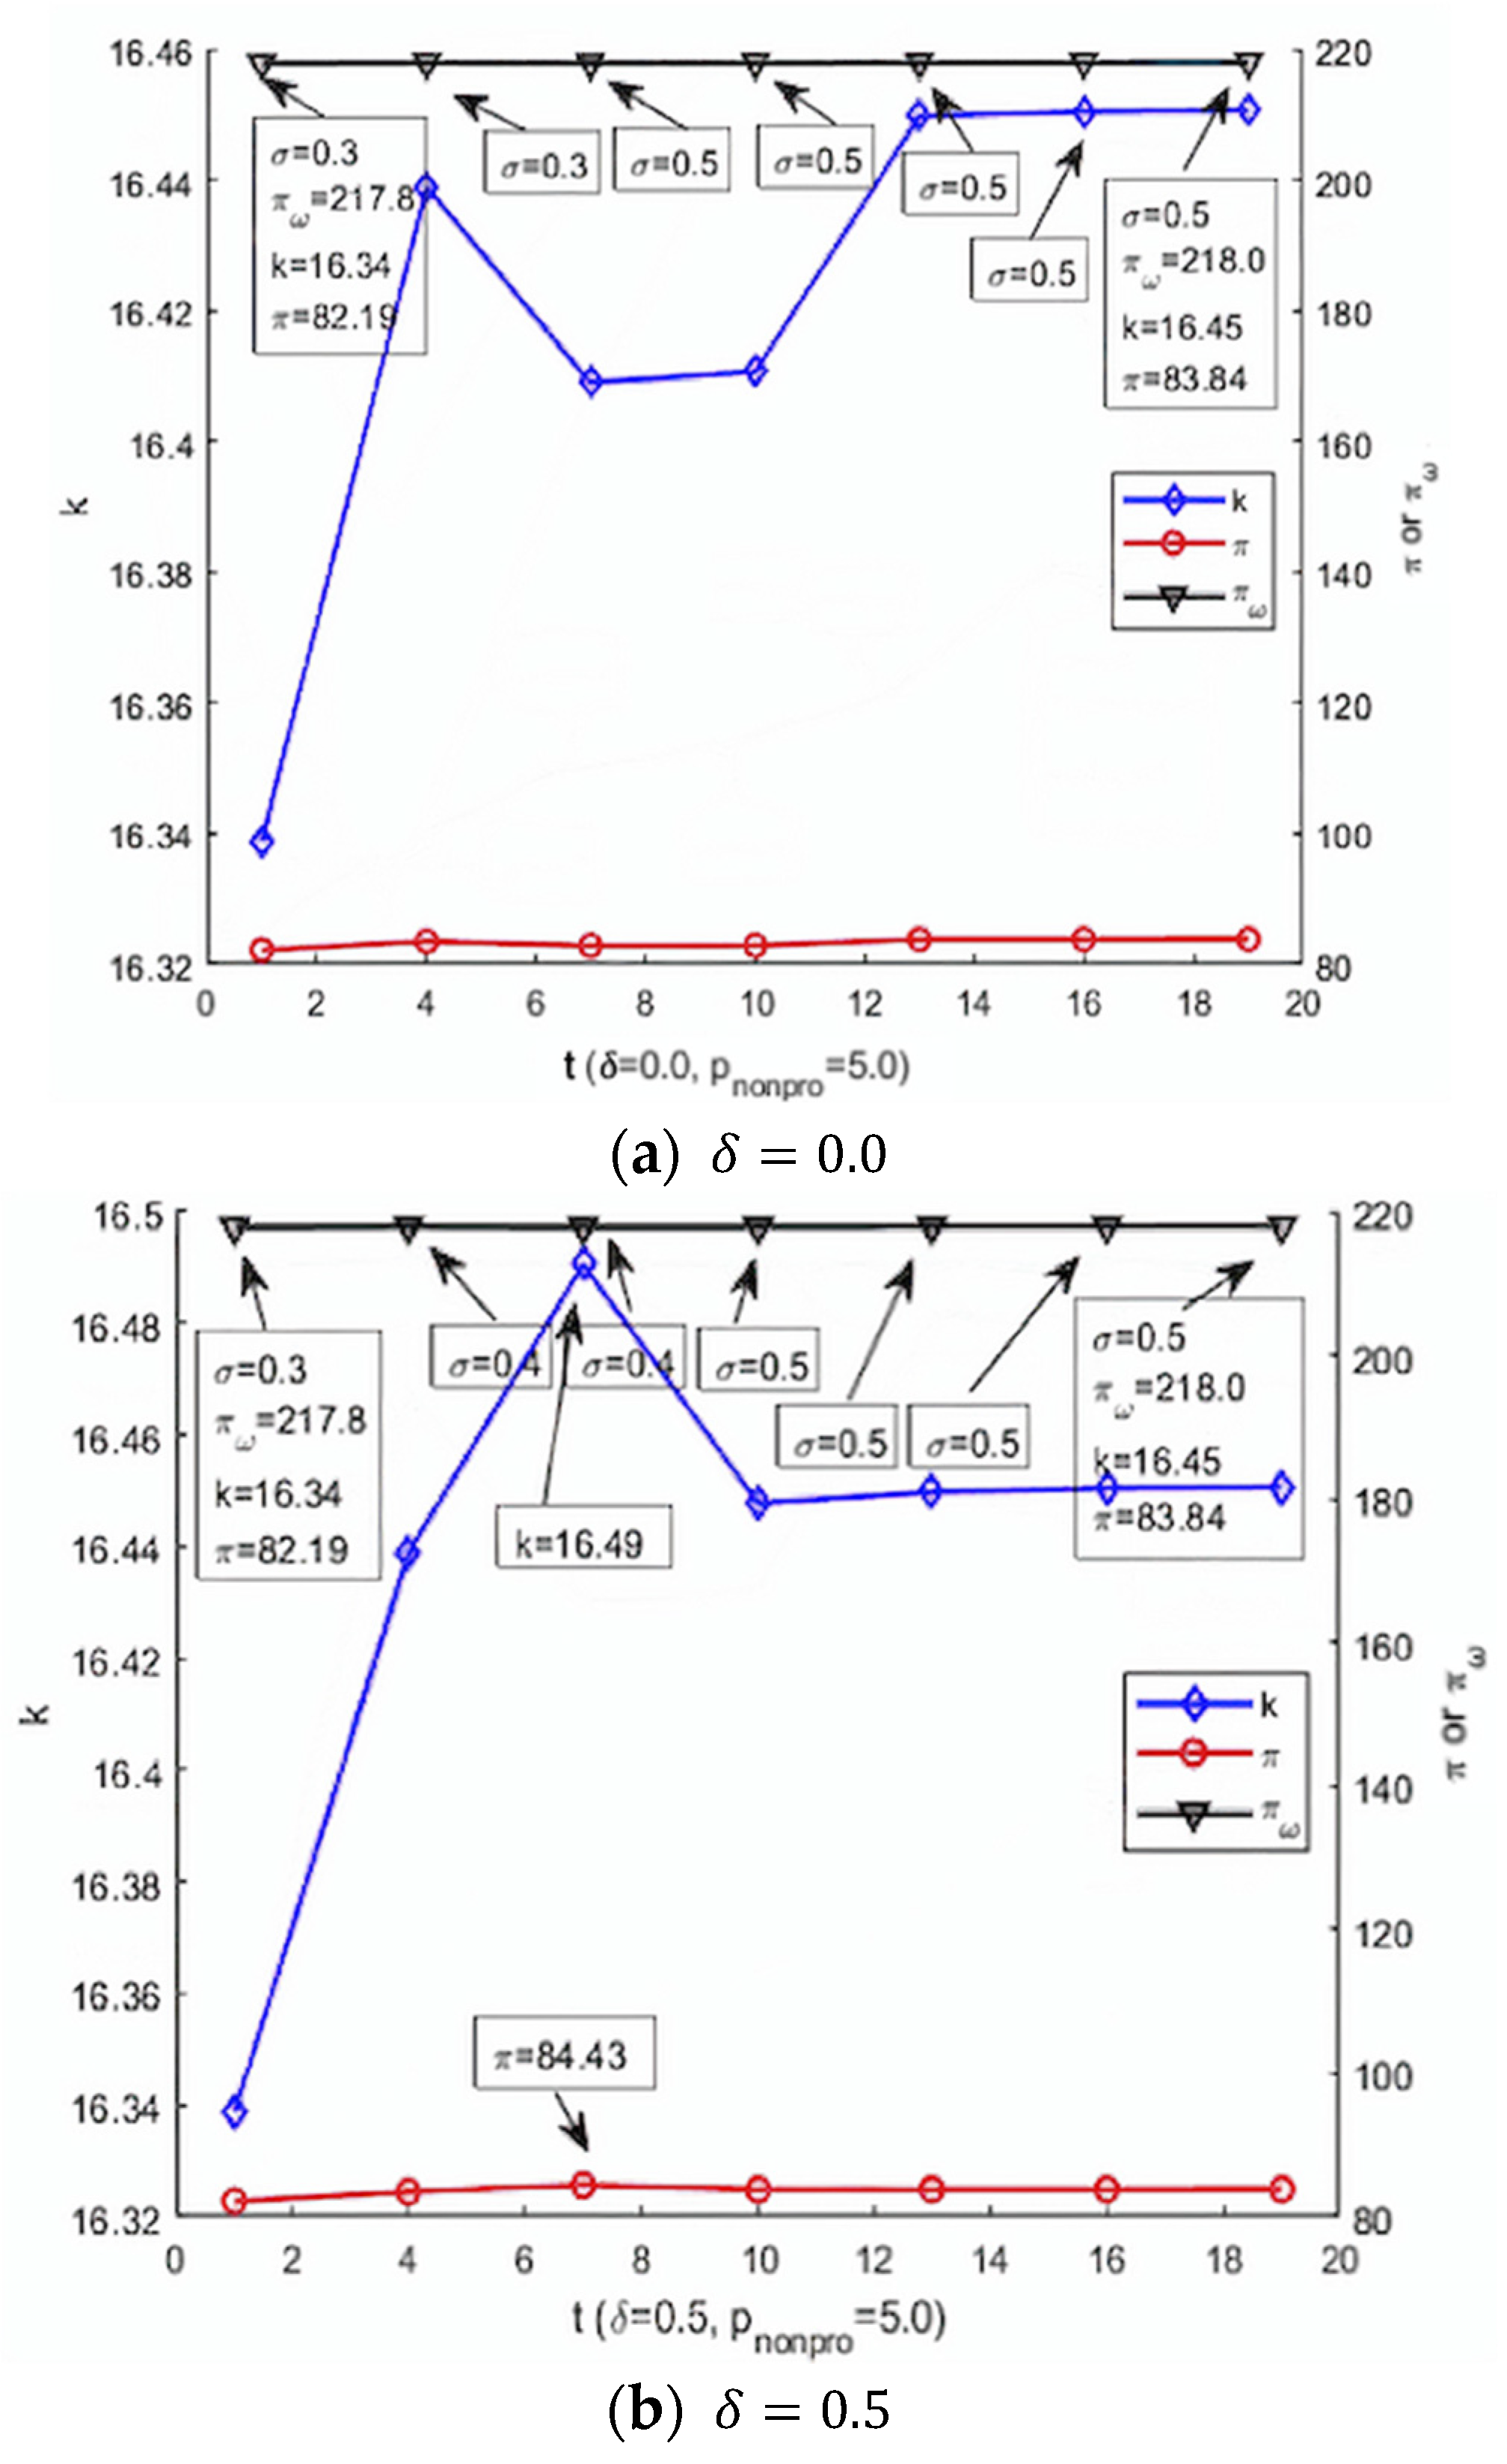
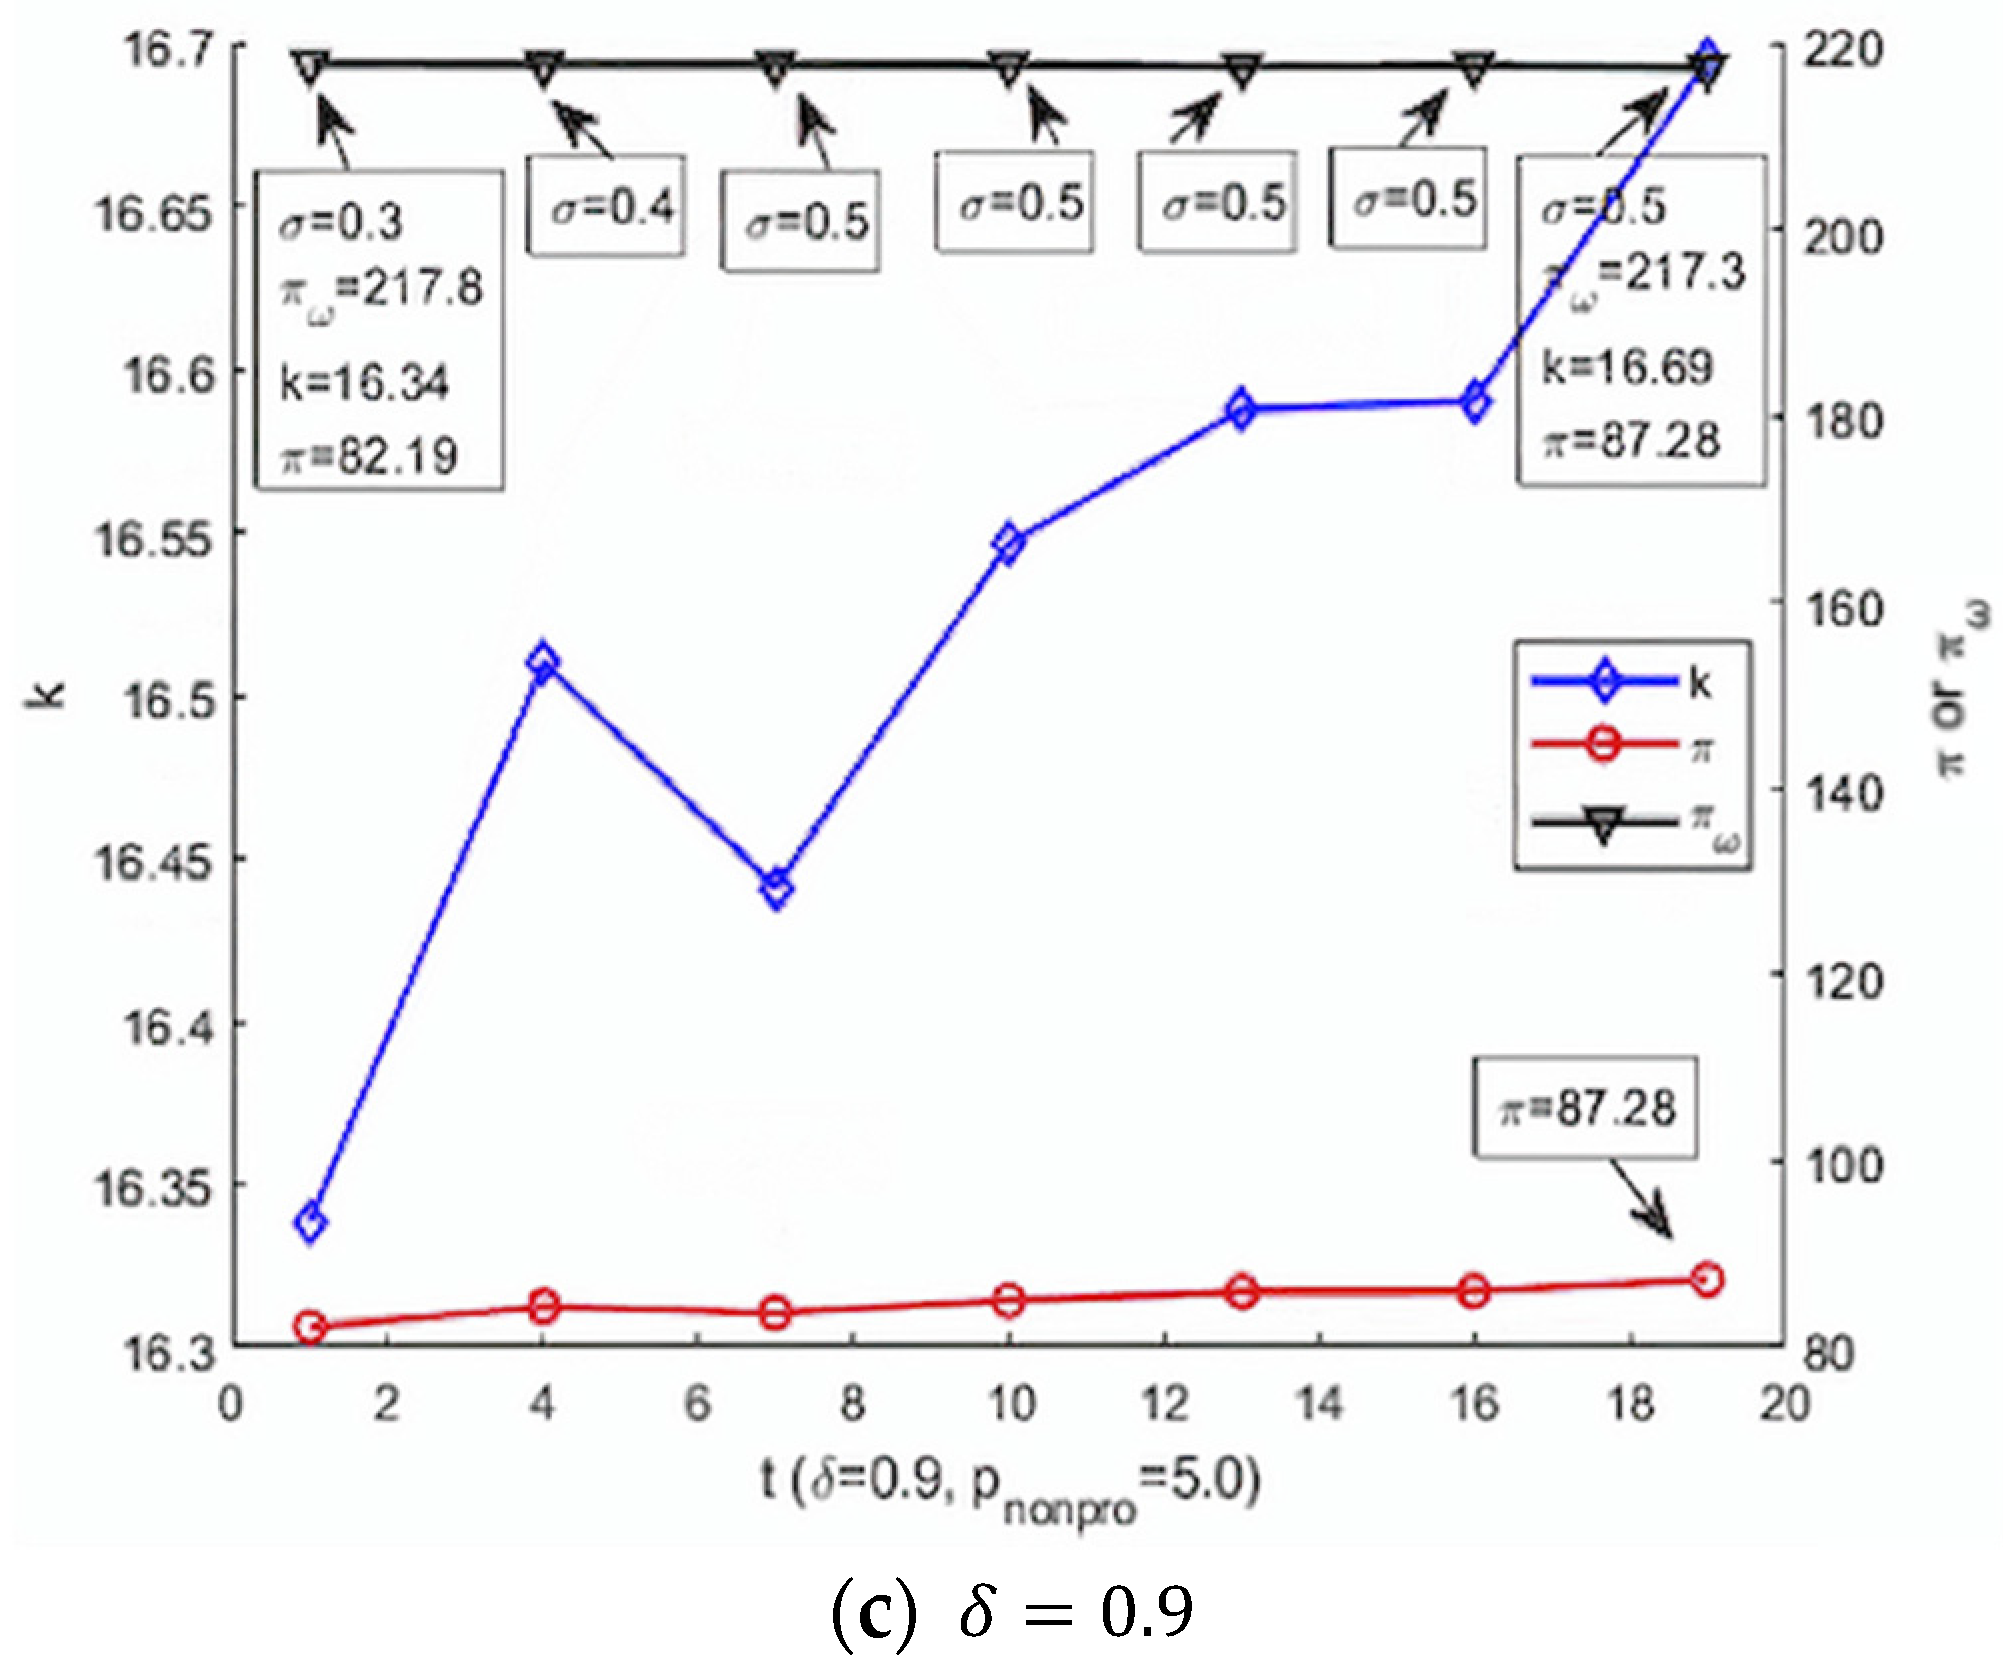
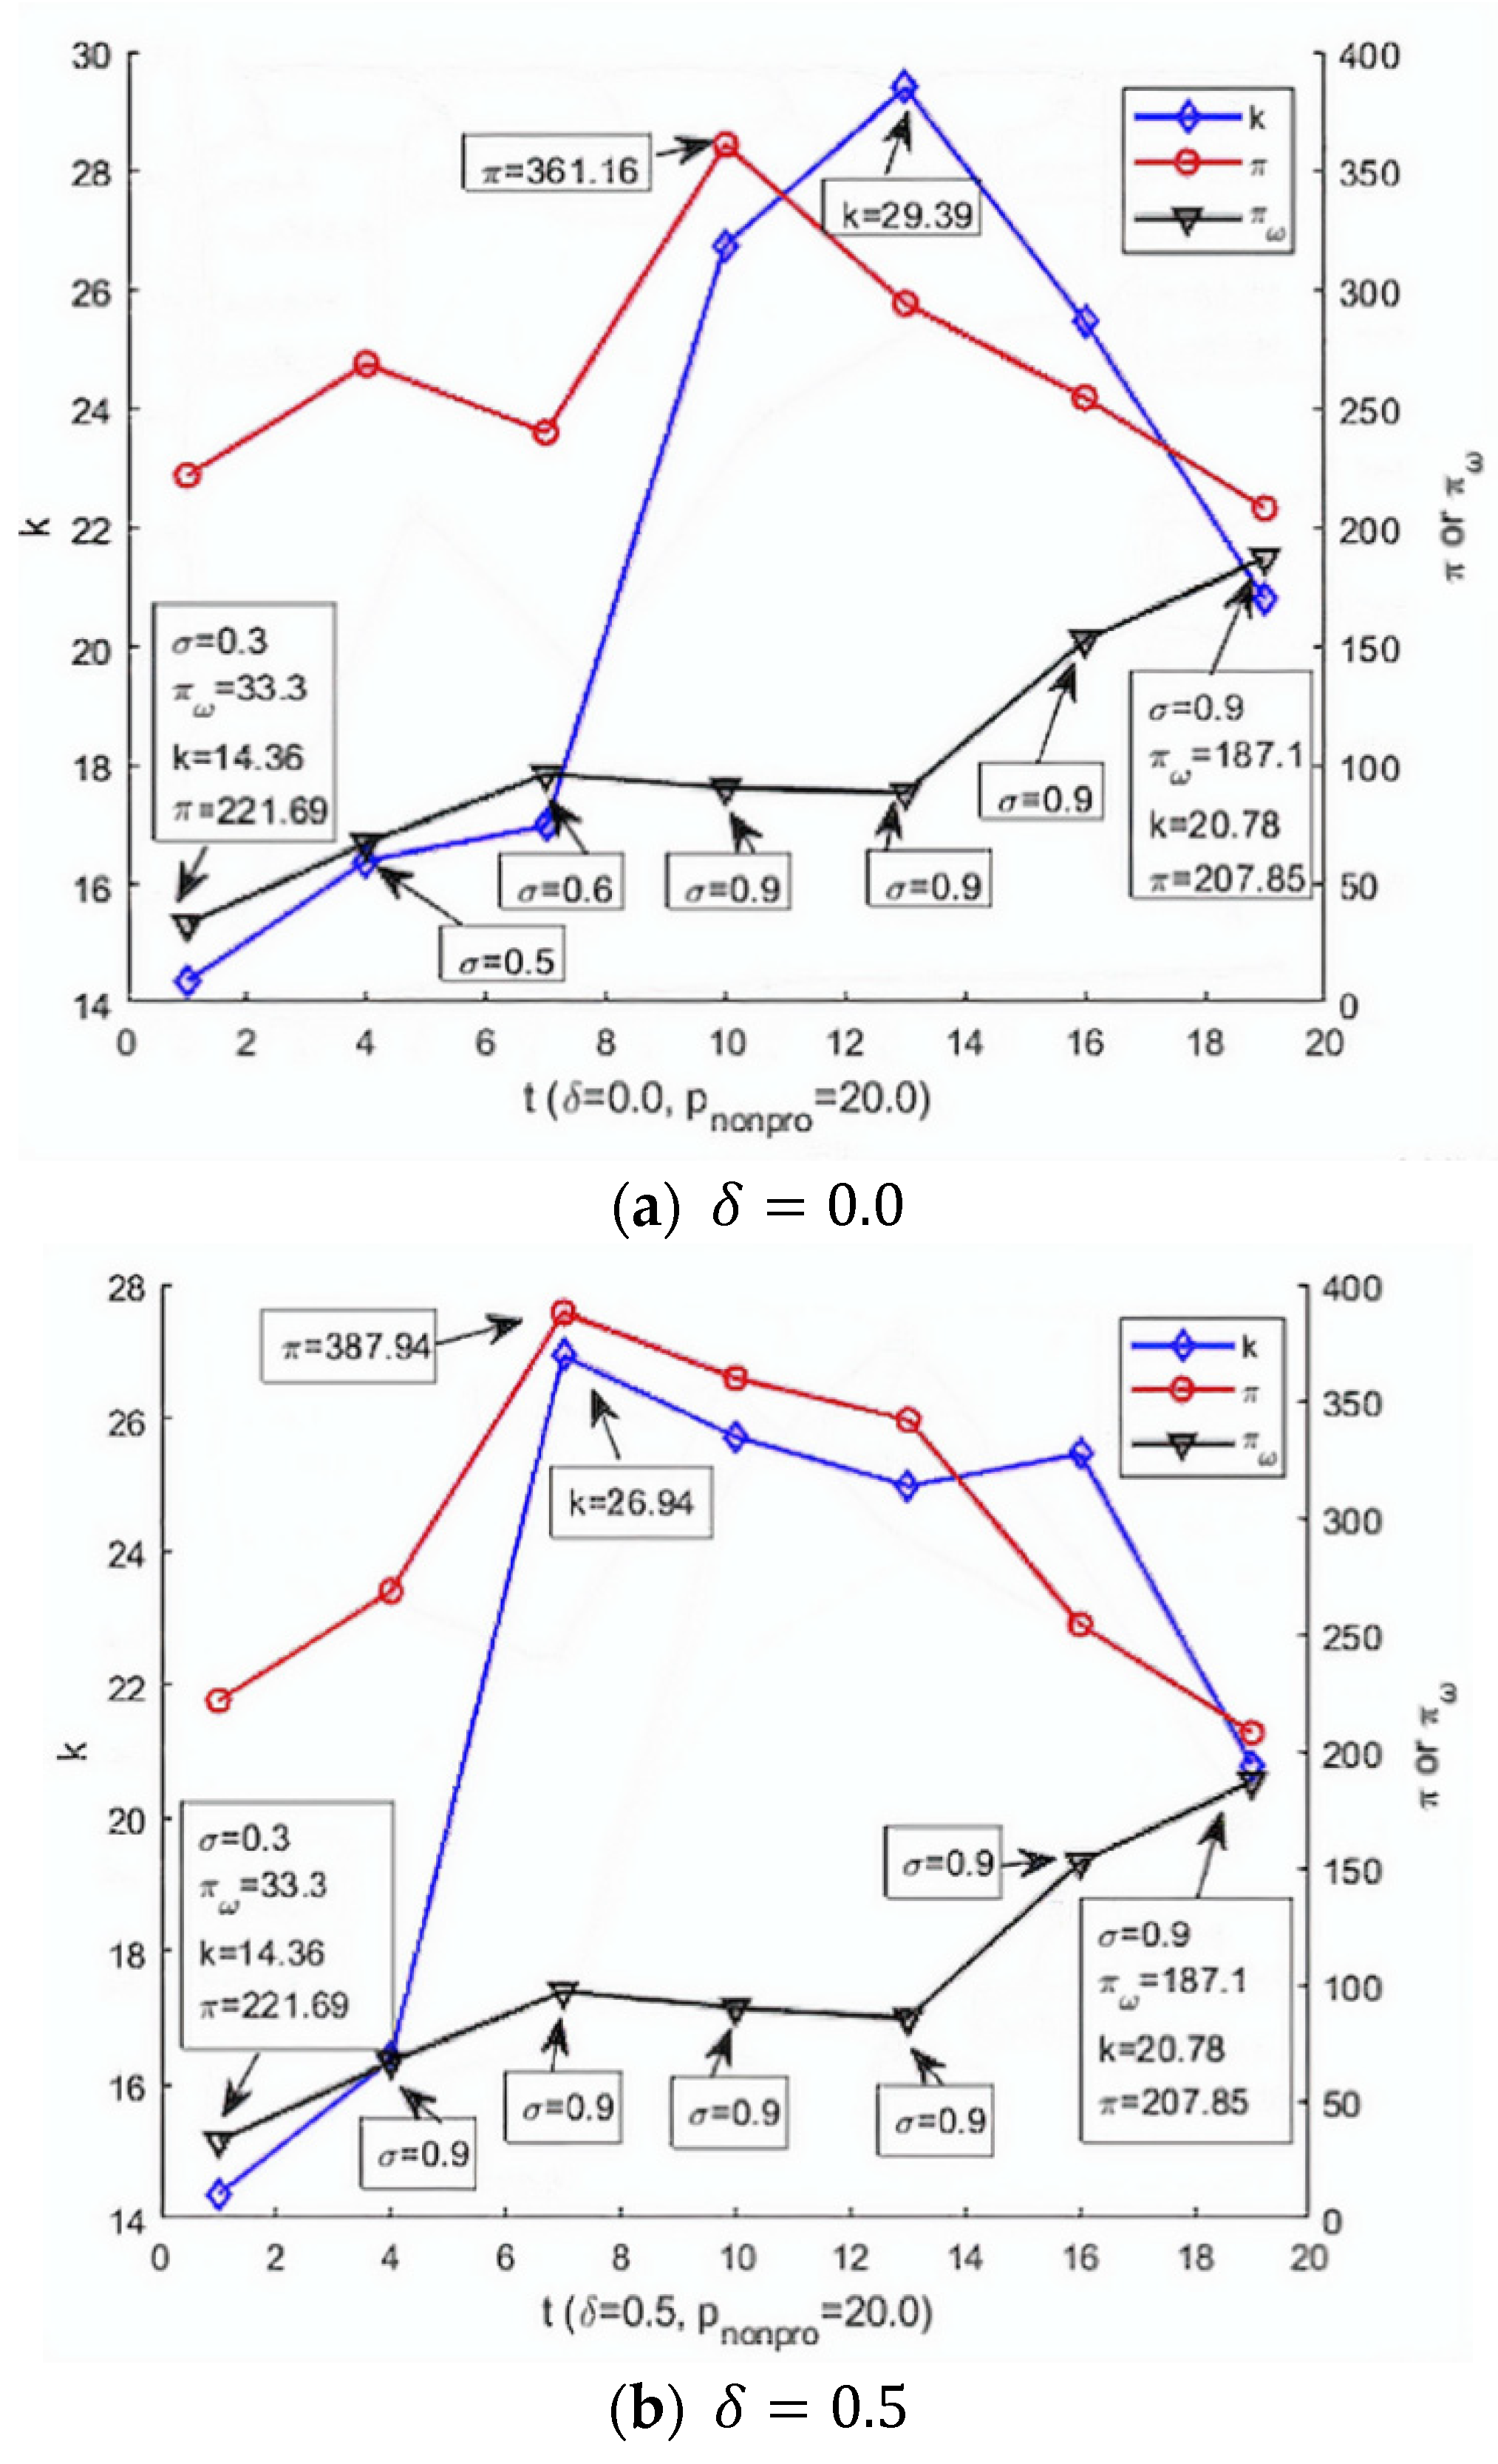
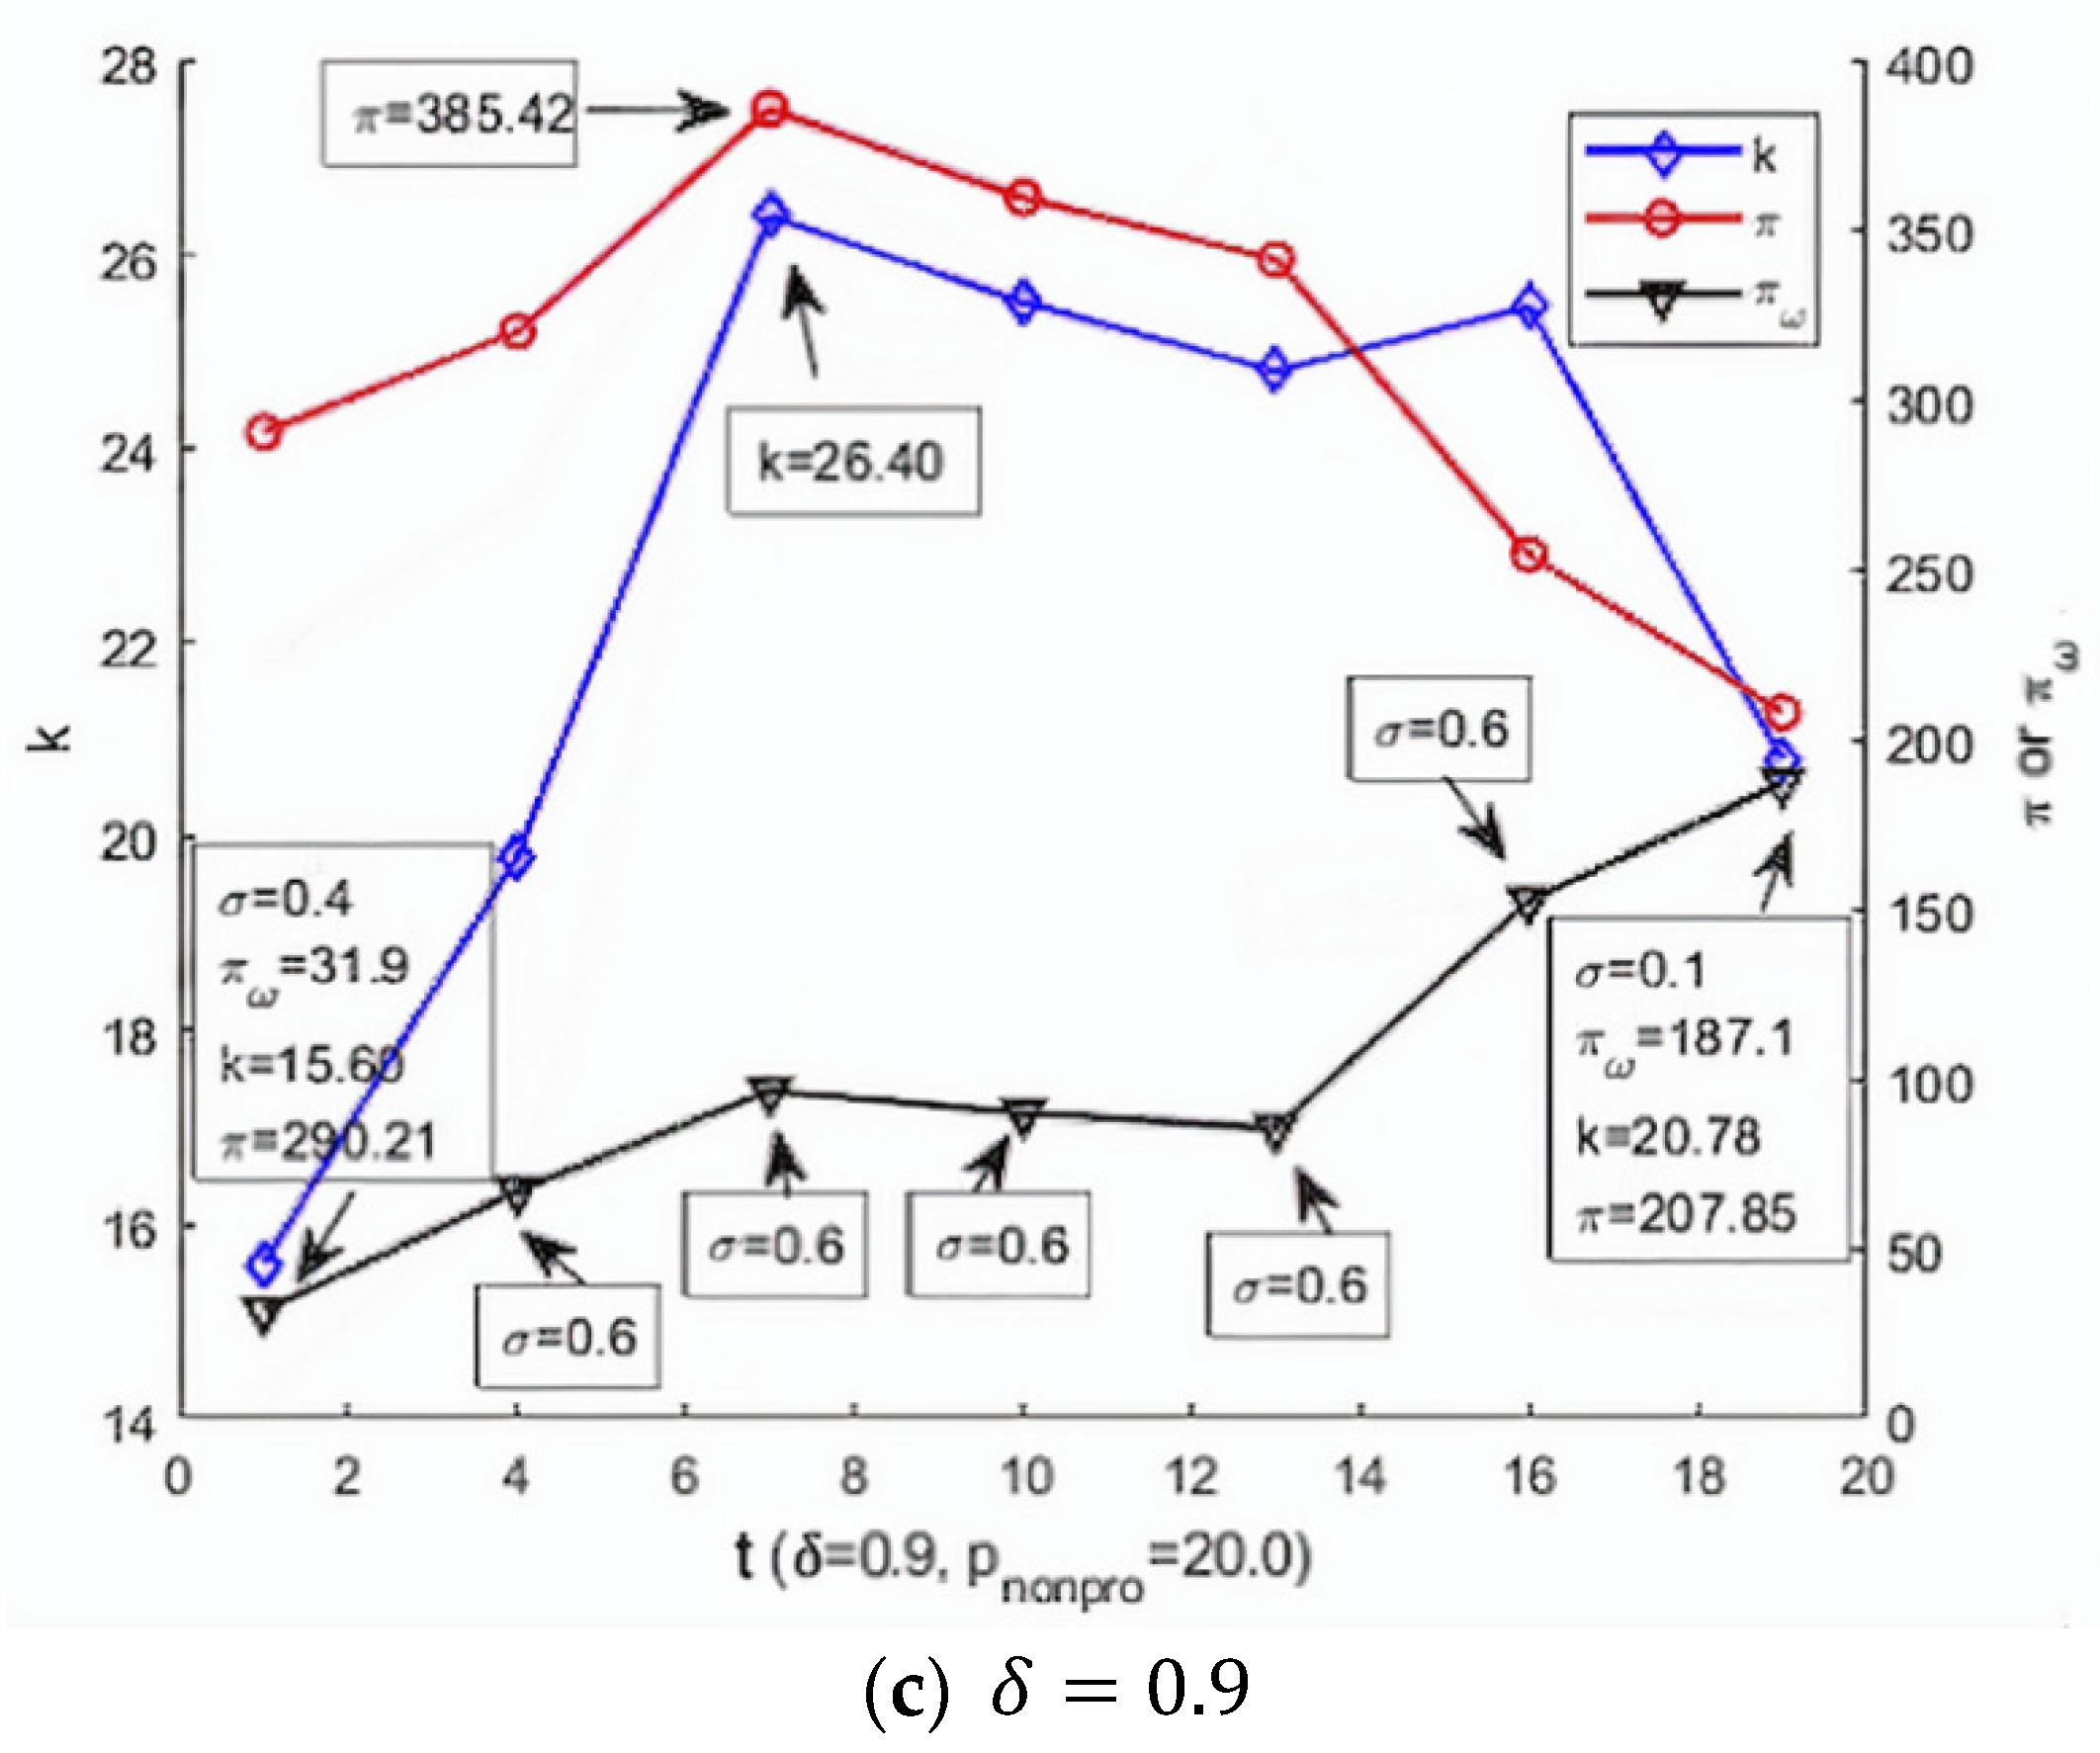
5.3. The Experimental Results for the Extended Model with Varying Ratios of Professional and Nonprofessional Hosts

We assume the ratio σ is valued in {0.1, 0.3, 0.5, 0.7, 0.9} across numerical experiments, but everything else is equal to the models in the earlier subsections. In the customer-choice models of (3) and (4), t is induced to represent the difference of customers’ preference for the two groups of hosts in location, cooking facilities, and so on, and valued in {1, 4, 7, 10, 13, 16, 19}. A larger t leads to more difference between the preferences the customers perceive from professional and nonprofessional rental services. We generate the simulation data by setting the price levels of nonprofessional hosts to be p n o n p r o = 5 and p n o n p r o = 20 in turn. In the numerical experiment for the extended model, the professional host’s pricing is restricted to be within | p p r o p n o n p r o | ( 1 + ω ) t . If it leaves this range, all consumers purely choose either type of hosts, therefore, it is not necessary to allow | p p r o p n o n p r o | ( 1 + ω ) > t . We depict the changes in the cumulative value of all transactions as π , the number of participating hosts in the market as k (as, most often, a e r move in the same direction with k , hence, we delete it from the figures below), and profit π ω with the value of t increasing in Figure 1, Figure 2, Figure 3 and Figure 4. The data points of the curves indicate the optimal-value information for π ω and its corresponding value of σ . From Figure 1, Figure 2, Figure 3 and Figure 4, we draw two conclusions. Conclusion 2: (1) The cumulative transaction value of the market π and supply size k do not always move in the same direction (please refer to Figure 4), and (2) the optimal value for the platform’s profit π ω cannot lead to optimal values for π and k . Conclusion 3: (1) When customers have a preference difference between service from the two types of hosts ( t 1 ), a high ratio of professional hosts cannot guarantee maximum values for π , k (which indicated long-term success of the market), and π ω ; and (2) a high value of t usually leads to the maximum value of the platform’s profit π ω . A possible explanation for the second part of Conclusion 3 could be that when t becomes larger, customers’ choice of service from professional hosts is insensitive to | p n o n p r o p p r o | ( 1 + ω ) , so the platform has more flexibility to adjust ω to a larger profit value of π ω .

6. Discussion

In this paper, we proposed a modeling framework to examine how various ratios of professional and nonprofessional hosts interplay in pricing behaviors and how their interactions impact the market outcomes in terms of the cumulative market transaction value, supply size (average earning per listing the host obtains), and the platform profit. Specifically, we tried to answer questions about whether more professional players are more beneficial for the contemporary and long-term development of the accommodation-sharing market. This paper has both theoretical and practical implications.

6.1. Theoretical Implications

Related extant work has been devoted to the differences in professionals’ and nonprofessionals’ pricing behaviors and financial performance in the accommodation-sharing market [3,6], the external competition between the sharing market and traditional hotels [35,36,37], and the internal competition between the two types of hosts within the accommodation-sharing market [38]. This paper is one of first attempts to investigate the interplay between professional and nonprofessional decision makers in pricing and the impact of their interaction on market outcomes in the context of accommodation sharing.
In this paper, we not only develop a modeling framework to analyze whether having more professional players while slighting the interests of nonprofessional hosts is really beneficial to the accommodation-sharing market but also multiple indicators such as supplier size and profit per listing are included to measure contemporary and long-term development of the accommodation-sharing market. Through the numerical analysis for the modeling framework, this study brings counterintuitive theories to the accommodation-sharing market: more professional decision makers do not necessarily lead to long-term prosperity (indicated by supply size) and also cannot maximize the platform’s profit under the condition that customers have preference differences in choosing services offered by the two types of hosts. Most platform firms believe that having more professional hosts is beneficial to their profit and to the market.

6.2. Practical Implications

Our research has important practical implications for the accommodation-sharing market based on the three conclusions in Section 5. First, for the long-term prosperity of the sharing market, the platform firm should focus on multiple indicators rather than just the cumulative market transaction value (or the hosts’ cumulative revenue). Second, the platform firm should balance its own interests with the hosts’. Third, when customers have preference differences in choosing between services provided by professional and nonprofessional hosts, high ratios of professional decision makers do not necessarily bring the largest supply, the greatest cumulative market transaction value, or the maximum platform profit. Fourth, it is beneficial for the market to magnify differences in the unique features of two types of hosts to cater to customers’ experiences and expectations. This is consistent with the conclusions from Liu and Park’s [38] (2020) related work. Kwok et al. [6] (2020) compared Airbnb’s seven Ps marketing mix with the listings managed by different types of hosts. However, professional and nonprofessional hosts deliver similar services with a small noticeable difference. Hence, we suggest that the platform firm should make managerial decisions to enlarge the differentiation in positioning for the two types of hosts and segment tourists. This suggestion is consistent with a recent stream of research [27,39].

7. Conclusions

The accommodation-sharing markets are actively recruiting more professional hosts and are experiencing disharmony from nonprofessionals who feel cast aside by this practice. Our paper developed a modeling framework with price-sensitive customers and earnings-based hosts to examine whether more professional players necessarily bring more benefit to the sharing market. We examine multiple indicators rather than only the cumulative host revenue to indicate sharing market development. The related models in the framework are analyzed under settings specified primarily by various ratios of professional and nonprofessional hosts on the supply side of the sharing markets and the preference difference of customers when they choose between the two types of hosts (the demand rate). Because there exist two optimal maximization problems in the models and they are intractable, we conduct a number of numerical experiments to obtain the near-optimal solutions for these modes.
In summary, this study offers the following contributions. First, it is one of first attempts to investigate whether recruiting more professional hosts is beneficial to the contemporary and long-term success of the sharing market. The experimental results show that a high ratio of professional decision makers does not maximize the cumulative transaction value, supply size, or platform profit. Second, we provided a modeling framework for such study. Third, we suggest for the long-term prosperity of the sharing market that the platform firm should focus on multiple indicators rather than only the cumulative market transaction value (or the hosts’ cumulative revenue). It is not necessary for the accommodation-sharing market to recruit a high ratio of professional hosts. It is beneficial for the market to magnify the differences in the unique features of the two types of hosts to cater to customers’ experiences and expectations or differentiate the market positioning of the two types of hosts.
The study is limited due to the fact that market-condition parameters such as the number of potential consumers, the number of potential hosts, and the price of non-professional hosts’ price have a few small numbers of values through the numerical experiments. Hence, in the future, a larger number of values will be assigned to these market- condition parameters. At the same time, we will download data from the accommodation-sharing markets such as Airbnb to empirically verify the model and findings proposed in this paper.

Author Contributions

Conceptualization, R.J. and S.W.; methodology, S.W.; validation, R.J.; formal analysis, R.J. and S.W.; investigation, R.J.; resources, S.W.; writing—original draft preparation, R.J.; writing—review and editing, R.J. and S.W.; visualization, R.J.; supervision, S.W.; funding acquisition, R.J. All authors have read and agreed to the published version of the manuscript.

Funding

This research was funded by Inner Mongolia Natural Science Foundation grant number 2020MS07018. And The APC was funded by Inner Mongolia Natural Science Foundation grant number 2020MS07018.

Institutional Review Board Statement

Not applicable.

Informed Consent Statement

Not applicable.

Data Availability Statement

Not applicable.

Conflicts of Interest

The authors declare no conflict of interest.

References

  1. Leoni, V. Stars vs lemons. Survival analysis of peer-to peer marketplaces: The case of Airbnb. Tour. Manag. 2020, 79, 104091. [Google Scholar] [CrossRef]
  2. Boto-García, D.; Mayor, M.; Vega, P.l. Spatial price mimicking on Airbnb: Multi-host vs single-host. Tour. Manag. 2021, 87, 104365. [Google Scholar] [CrossRef]
  3. Li, J.; Moreno, A.; Zhang, D.J. Agent Behavior in the Sharing Economy: Evidence from Airbnb. Ross Sch. Bus. Work. Pap. Ser. 2015, 1298, 2015. [Google Scholar] [CrossRef]
  4. Farajallah, M.; Hammond, R.G.; Pénard, T. What Drives Pricing Behavior in Peer-to-Peer Markets? Evidence from the Carsharing Platform BlaBlaCar. Inf. Econ. Policy 2019, 48, 15–31. [Google Scholar] [CrossRef]
  5. Ke, Q. Sharing Means Renting? An Entire-marketplace Analysis of Airbnb. In Proceedings of the 2017 ACM on Web Science Conference; Association for Computing Machinery: Troy, NY, USA, 2017; pp. 131–139. [Google Scholar]
  6. Kwok, L.; Xie, K.L. Pricing strategies on Airbnb: Are multi-unit hosts revenue pros? Int. J. Hosp. Manag. 2019, 82, 252–259. [Google Scholar] [CrossRef]
  7. Gibbs, C.; Guttentag, D.; Gretzel, U.; Yao, L.; Morton, J.; Okumus, F.; Okumus, F. Use of dynamic pricing strategies by Airbnb hosts. Int. J. Contemp. Hosp. Manag. 2018, 30, 2–20. [Google Scholar] [CrossRef]
  8. Hardy, A.; Dolnicar, S. Types of Network Members. In Peer-to-Peer Accommodation Networks; Goodfellow Publisher: Oxford, UK, 2017. [Google Scholar]
  9. Gibbs, C.; Guttentag, D.; Gretzel, U.; Morton, J.; Goodwill, A. Pricing in the sharing economy: A hedonic pricing model applied to Airbnb listings. J. Travel Tour. Mark. 2018, 35, 46–56. [Google Scholar] [CrossRef]
  10. Ractham, P.; Banomyong, R.; Sopadang, A. Two-Sided E-Market Platform: A Case Study of Cross Border E-Commerce between Thailand and China. In Proceedings of the ICEB, Newcastle Upon Tyne, UK, 8–12 December 2019; pp. 475–482. [Google Scholar]
  11. Javanmard, A.; Nazerzadeh, H.; Shao, S. Multi-Product Dynamic Pricing in High-Dimensions with Heterogeneous Price Sensitivity. In Proceedings of the 2020 IEEE International Symposium on Information Theory (ISIT), Los Angeles, CA, USA, 21–26 June 2020. [Google Scholar]
  12. Hurley, J.E. Equilibrium in Hotelling’s Model of Spatial Competition; McMaster University: Hamilton, ON, Canada, 1988. [Google Scholar]
  13. Geertsema, P.; Lu, H. Regulated Price and Demand in China’s IPO Market. J. Econ. Bus. 2019, 106, 105846. [Google Scholar] [CrossRef]
  14. Volgger, M.; Taplin, R.; Pforr, C. The evolution of ‘Airbnb-tourism’: Demand-side dynamics around international use of peer-to-peer accommodation in Australia. Ann. Tour. Res. 2019, 75, 322–337. [Google Scholar] [CrossRef]
  15. Brown, D.; Andrew, E. Analyzing Firm Behaviour in Restructured Electricity Markets: Empirical Challenges with a Residual Demand Analysis. Int. J. Ind. Organ. 2021, 74, 102676. [Google Scholar] [CrossRef]
  16. Masiero, L.; Nicolau, J.L.; Law, R. A demand-driven analysis of tourist accommodation price: A quantile regression of room bookings. Int. J. Hosp. Manag. 2015, 50, 1–8. [Google Scholar] [CrossRef] [Green Version]
  17. Pham, T.D.; Nghiem, S.; Dwyer, L. The determinants of Chinese visitors to Australia: A dynamic demand analysis. Tour. Manag. 2017, 63, 268–276. [Google Scholar] [CrossRef]
  18. Hill, D. How much is your spare room worth? Spectr. IEEE 2015, 52, 32–58. [Google Scholar] [CrossRef]
  19. Karlsson, L.; Dolnicar, S. Someone’s been sleeping in my bed. Ann. Tour. Res. 2016, 58, 159–162. [Google Scholar] [CrossRef]
  20. Wu, E. Learning in Peer-to-Peer Markets: Evidence from Airbnb. Master’s Thesis, FGV—Fundação Getulio Vargas, Rio de Janeiro, Brazil, 9 May 2016. [Google Scholar]
  21. Xiao, P.; Kadiyali, V.; Chan, T. Structural Models of Pricing. In Handbook of Pricing Research in Marketing; Edward Elgar Publishing: Camberley, UK, 2009; pp. 108–131. [Google Scholar]
  22. Casamatta, G.; Giannoni, S.; Brunstein, D.; Jouve, J. Host type and pricing on Airbnb: Seasonality and perceived market power. Tour. Manag. 2022, 88, 104433. [Google Scholar] [CrossRef]
  23. Teruel-Gutierrez, R.; Maté-Sánchez-Val, M. The impact of Instagram on Airbnb’s listing prices in the city of Barcelona. Ann. Reg. Sci. 2021, 118, 2411–2502. [Google Scholar]
  24. Chatterjee, D.; Dandona, B.; Mitra, A.; Giri, M. Airbnb in India: Comparison with hotels, and factors affecting purchase intentions. Int. J. Cult. Tour. Hosp. Res. 2019, 13, 430–442. [Google Scholar] [CrossRef]
  25. Veronica, L.; William, N. Dynamic pricing and revenues of Airbnb listings: Estimating heterogeneous causal effects. Int. J. Hosp. Manag. 2021, 95, 102914. [Google Scholar]
  26. Lawani, A.; Reed, M.R.; Mark, T.; Zheng, Y. Reviews and price on online platforms: Evidence from sentiment analysis of Airbnb reviews in Boston. Reg. Sci. Urban. Econ. 2019, 75, 22–34. [Google Scholar] [CrossRef]
  27. Lladós-Masllorens, J.; Meseguer-Artola, A.; Rodríguez-Ardura, I. Understanding Peer-to-Peer, Two-Sided Digital Marketplaces: Pricing Lessons from Airbnb in Barcelona. Sustainability 2020, 12, 5229. [Google Scholar] [CrossRef]
  28. Roma, P.; Panniello, U.; Nigro, G.L. Sharing economy and incumbents’ pricing strategy: The impact of Airbnb on the hospitality industry. Int. J. Prod. Econ. 2019, 214, 17–29. [Google Scholar] [CrossRef]
  29. Chen, M.K. Dynamic Pricing in a Labor Market: Surge Pricing and Flexible Work on the Uber Platform. In Proceedings of the 2016 ACM Conference, New York, NY, USA, 24–28 July 2016. [Google Scholar]
  30. Armstrong, M. Competition in two-sided markets. Rand J. Econ. 2006, 37, 668–691. [Google Scholar] [CrossRef] [Green Version]
  31. Li, J.; Moreno, A.; Zhang, D. Pros vs Joes: Agent Pricing Behavior in the Sharing Economy. Soc. Sci. Electron. Publ. 2016, 1298. [Google Scholar] [CrossRef]
  32. Sainaghi, R.; Abrate, G.; Mauri, A. Price and RevPAR determinants of Airbnb listings: Convergent and divergent evidence. Int. J. Hosp. Manag. 2021, 92, 102709. [Google Scholar] [CrossRef]
  33. Rochet, J.C.; Tirole, J. Platform Competition in Two-Sided Markets. J. Eur. Econ. Assoc. 2003, 1, 990–1029. [Google Scholar] [CrossRef] [Green Version]
  34. FOLGER, J. Airbnb: Advantages and Disadvantages. Available online: https://www.investopedia.com/articles/personal-finance/032814/pros-and-cons-using-airbnb.asp (accessed on 24 January 2021).
  35. Juan, A.; Josep, S.; Jorge, G.; Alba, R. Sustainability Commitment, New Competitors’ Presence, and Hotel Performance: The Hotel Industry in Barcelona. Sustainability 2016, 8, 755. [Google Scholar]
  36. Belarmino, A.; Whalen, E.; Koh, Y.; Bowen, J.T. Comparing guests’ key attributes of peer-to-peer accommodations and hotels: Mixed-methods approach. Curr. Issues Tour. 2017, 22, 1–7. [Google Scholar] [CrossRef]
  37. Köseoglu, M.A. Conceptual Structure of Lodging-Context Studies: 1990–2016. J. Hosp. Tour. Res. 2019, 43, 573–594. [Google Scholar] [CrossRef]
  38. Liu, J.; Park, J.; Xie, K.; Song, H.; Chen, W. Effect of Commercial Neighbors on The Online Popularity of Peer-To-Peer Accommodation-Sharing Properties. J. Hosp. Tour. Res. 2020, 44, 780–805. [Google Scholar] [CrossRef]
  39. Hernández, J.; Bulchand-Gidumal, J.; Suárez-Vega, R. Using accommodation price determinants to segment tourist areas. J. Destin. Mark. Manag. 2021, 21, 100622. [Google Scholar]
Figure 1. With increasing t, the change curves of the cumulative market transaction value (red curve with dots), platform profit (black with inverted triangles), and number of participating hosts in the market (blue with diamonds) under p _ n o n p r o = 5.0 during the low-demand; (a) δ = 0.0 ; (b) δ = 0.5 ; (c) δ = 0.9 ; period ( λ ¯ = 50 , K ¯ = 100 ).
Sustainability 13 12331 g001aSustainability 13 12331 g001b
Figure 2. With increasing t, the change curves of the cumulative market transaction value (red curve with dots), platform profit (black with inverted triangles), and number of participating hosts in the market (blue with diamonds) under p _ n o n p r o = 20.0 during the low-demand; (a) δ = 0.0 ; (b) δ = 0.5 ; (c) δ = 0.9 ; period ( λ ¯ = 50 , K ¯ = 100 ).
Sustainability 13 12331 g002aSustainability 13 12331 g002b
Figure 3. With increasing t, the change curves of the cumulative market transaction value (red curve with dots), platform profit (black with inverted triangles), and number of participating hosts in the market (blue with diamonds) under p _ n o n p r o = 5.0 during the high-demand; (a) δ = 0.0 ; (b) δ = 0.5 ; (c) δ = 0.9 ; period ( λ ¯ = 100 , K ¯ = 50 ).
Sustainability 13 12331 g003aSustainability 13 12331 g003b
Figure 4. With increasing t, the change curves of the cumulative market transaction value (red curve with dots), platform profit (black with inverted triangles), and number of participating hosts in the market (blue with diamonds) under p _ n o n p r o = 20.0 during the high-demand; (a) δ = 0.0 ; (b) δ = 0.5 ; (c) δ = 0.9 ; period ( λ ¯ = 100 , K ¯ = 50 ).
Sustainability 13 12331 g004aSustainability 13 12331 g004b
Table 1. Notations used in the analysis.
NotationDescription
p n o n p r o A fixed price rate given exogenously and used by nonprofessional hosts, taking values in {5, 20} in this paper
p p r o The price rate selected endogenously by professional hosts to achieve the maximum average expected earning per listing transaction
σ The ratio of potential professional hosts to the overall potential suppliers in the sharing market
λ ¯ p r o The potential number of customers requesting professional hosts’ accommodation service
λ ¯ n o n p r o The potential number of customers requesting nonprofessional hosts’ accommodation service
λ p r o The realized number of customers requesting professional hosts’ accommodation service
λ n o n p r o The realized number of customers requesting nonprofessional hosts’ accommodation service
K ¯ The potential number of hosts who would participate in providing accommodation service
k p r o The realized number of professional hosts who provide accommodation service
k n o n p r o The realized number of nonprofessional hosts who provide accommodation service
q The average quality level of the accommodation properties offered in the market
θ A valuation rate with a value ranging from 0 to 1
r The reservation earnings rate each host expects to determine whether to participate in offering accommodation service, ranging from 0 to 1
R The maximum reservation earning rate
π The total market transaction value
π p r o The total market transaction value for the group of professional hosts
π n o n p r o The total market transaction value for the group of nonprofessional hosts
a e r The expected average profit each host (professional and nonprofessional) earns from rental service
a e r p r o The amount of earning professional hosts get by choosing optimal price p p r o
ω The fee rate customers pay to the platform for each listing transaction
δ The weight parameter the platform firm puts on hosts’ benefit
Table 2. The numerical experiment results for the base model with only nonprofessional hosts on the supply side.
λ ¯ = 50 , K ¯ = 100 λ ¯ = 50 , K ¯ = 100
π = π n o n p r o π = π n o n p r o π = π n o n p r o π = π n o n p r o
π = π n o n p r o 3.500.122.00.12
π = π n o n p r o 50.0208.0100.0104.0
π = π n o n p r o 5.010.205.05.10
π = π n o n p r o 10.020.4020.020.40
π = π n o n p r o 175.024.96200.012.48
π = π n o n p r o
Table 3. The numerical experiment results for the base model only with professional hosts on the supply side.
λ ¯ = 100 , K ¯ = 50 λ ¯ = 50 , K ¯ = 100
δ = 0.0 δ = 0.5 δ = 0.9 δ = 0.0 δ = 0.5 δ = 0.9
p p r o 6.26.59.44.24.24.5
ω 2.01.91.12.952.952.55
π 110.5116.2187.070.670.681.1
a e r 6.26.59.44.24.24.5
k 17.817.919.916.816.818.0
π ω 220.9220.9205.6208.3208.3206.8
q = 25 , R = 25 , σ = 1
Publisher’s Note: MDPI stays neutral with regard to jurisdictional claims in published maps and institutional affiliations.

