Article

Access to Secondary HSR Stations in the Urban Periphery: A Generalised Cost-Based Assessment

1
Transport Research Centre (TRANSyT-UPM), Universidad Politécnica de Madrid, 28040 Madrid, Spain
2
Department of Transport Engineering, Regional and Urban Planning, Universidad Politécnica de Madrid, 28040 Madrid, Spain
3
Department of Forest and Environmental Engineering and Management, MONTES (School of Forest Engineering and Natural Resources), Universidad Politécnica de Madrid, 28040 Madrid, Spain
*
Author to whom correspondence should be addressed.
Sustainability 2021, 13(21), 12286; https://doi.org/10.3390/su132112286
Submission received: 17 September 2021 / Revised: 30 October 2021 / Accepted: 2 November 2021 / Published: 7 November 2021
(This article belongs to the Special Issue Geographic Information Systems Applications in Transport Planning)

Abstract

:
Investments in high-speed rail (HSR) development contribute to reducing regional disparities and improving territorial cohesion. When studying the efficacy of HSR investments, the travel time (and effort) spent on getting to and from the HSR station is crucial. In large urban areas there may be more than one station, and a peripheral station may complement the central stations and become a powerful vector for development. The rationale of this paper revolves around the possibility of applying a methodology based on generalised cost (GC) functions to study the advantages of new HSR-related projects in different locations. With this aim, we evaluate a real example in Seville (Spain) to determine whether the improvement in metropolitan accessibility to HSR services justifies the implementation of a new peripheral station, using a methodology to assess the territorial accessibility based on GC functions and modal travel times obtained with GIS methods, followed by an economic assessment based on a cost-benefit analysis. The paper ends with the main conclusions and a discussion of the methodology applied, the reductions in generalised costs resulting from the new station, the relevance of the case study, the limitations of the approach and further research stemming from this study.

1. Introduction

The European Union’s White Paper on Transport considers HSR to be essential in passenger mobility and establishes the need to “triple the length of the existing high-speed network by 2030 and maintain a dense railway network in all Member States. By 2050, the majority of medium-distance passenger transport should go by rail” [1] Although some authors have questioned the major investments required and errors in the prediction of traffic volumes and profits [2,3], many others consider that the development of HSR contributes to reducing regional disparities and improving territorial cohesion [4,5,6,7].
When studying the efficacy of a HSR investment, it should be noted that most HSR trips are one part of a multimodal chain that combines the use of local and long-distance networks. Not only is good access to the network a critical factor in obtaining the benefits of HSR services [5,8], but, according to Givoni, M. & Banister, D. [9], the greatest proportion of the travel time (and effort) is spent on getting to and from the HSR station. Several factors are involved in the best transportation solution for these connections: the quality of the transportation network in the area, the geographic location of the station, the fare and the rail service frequency [10,11], the last two of which are related to the quality of the railway service. Focusing on the first factors, [8] report that attracting new passengers to a HSR line depends on the connection of the HSR station with local transit, and is therefore generally related to the geographic location of the station. Authors such as [12,13] suggest that new HSR stations should be sited in highly accessible densely populated central locations for both the city where the station is located and for its metropolitan conurbation [4,11]. Others onclude that urban sprawl negatively affects HSR accessibility levels due to the increase in the time in the first and last miles [12]. Suburbanization also implies a decentralization of activities, suggesting a potential increase in total travel times for the main potential HSR users (people with a medium/high income) [12]. In fact, the importance of accessibility to the nearest HSR station via the local network is a key element in the overall accessibility [9,14,15]. Monzón, A., Ortega, E. & López, E. [15] conclude that the distance to the station in a HSR corridor in Spain implies a difference in territorial accessibility of 10 and 50 percent in cities near and far from the station, respectively.
Accessibility to stations can be evaluated by the numbers of entrances/exits [10], the number of bus service routes in the surroundings [16], by combining access times to public transport (PT) and/or opportunities served by the PT system [17] and more frequently by the travel access on foot, by bus and by private car. For PT, studies such as [16,18] found that enhancing bus access to railway stations is critical for increasing railway use. This can be achieved by improving the quality, frequency or travel time of the public transport. Many authors identify travel time as the key aspect in the choice of HSR as a transport mode [19], and significant efforts are made to reduce it [20], including travel time to stations, which could be decisive for choosing a transport mode [21]. Moyano, A., Moya-Gómez, B. & Gutiérrez, J. [12] suggest that the temporal variations in travel times are due to the frequencies and adaptability of schedules. If urban public transport is not well connected with rail stations, road trips—which depend mainly on travel time—will be more efficient [8]. Moyano, A., Moya-Gómez, B. & Gutiérrez, J. [12] point to traffic congestion as being crucial for assessing the travel time to stations in the case of access by private car. In conclusion, most studies agree that the degree of accessibility to/from the stations either by public transport or private vehicle is related to the time taken to go there and back.
Despite the importance of access and egress travel times and the city’s central positioning to the success of HSR stations, some European countries have located a few HSR stations in the peripheries of urban areas, where traffic congestion and land costs are lower [22]. Large urban areas offer the possibility of having more stations, with peripheral stations that can complement the central stations and become a powerful vector for development, if strategically located near specific employment poles such as IT and RDI, logistics and recreation areas [23]. Givoni, M. & Rietveld, P. [24] found that reducing railway stations in a multi-station metropolitan area and relocating services in central stations would result in a utility loss for rail passengers.
Be that as it may, the advisability of positioning stations—and more particularly the advisability of establishing two or more stations in large urban areas—should be studied in monetary terms, including the gains or losses in accessibility. Generalised cost (GC) functions in transportation allow travel time parameters to be transformed into monetary terms [25]. GC-based assessments therefore have a twofold role: to analyse the overall functioning of a transport service or infrastructure and to consider accessibility issues. For the former, Casello, J.M. [26] examines the performance of the transport system (both transit and private vehicle) in Pennsylvania through the cumulative generalised transport costs, while Fadaei, M. & Cats, O. [27] evaluate some bus operational measures adding operating costs to monetized travel time savings. La Paix, L. & Geurs, K. [28] include latent variables in GC functions to estimate access to railway stations by bike. The monetisation of travel times through GC functions is well adapted to the cost-benefit analysis (CBA), which is a compulsory appraisal method for state-funded infrastructure projects in many countries [29]. However, urban public transport authorities appear reluctant to use CBA as a tool to support their planning decisions [30]. Apart from its well-known advantages, CBA has some drawbacks such as equity issues in travel time savings or the specific assumptions on how to monetize different types of benefits [31,32]. To resolve these objections, Bardal, K.G. [31] recommends choosing the different factors carefully and presenting them as transparently as possible.
The rationale of this paper revolves around the possibility of applying GC methodologies to study the location advantages of new HSR stations to improve the access/catchment area to this service. There is a considerable body of literature on HSR project evaluations based on territorial accessibility methods [7,11,15] or time savings [33]. However, to the best of our knowledge, GC based approaches have not been tested for their usefulness in these types of projects. A few studies have explored the effects of various stations located in the same metropolitan area with qualitative methods such as a spatial taxonomy definition [23], but there are no reports of the advantages of two HSR stations coinciding in the same urban area.
In order to cover this gap in the literature, we propose a specific methodological framework for secondary stations using a GC-based analysis. This framework is a valuable instrument for planners and decision-makers in an evidence-based, geographically dimensioned and open analytical approach. This paper studies the advantages of different HSR station locations through a real example in the metropolitan area of Seville, Spain, where a central station already exists. Santa Justa station is part of the first high-speed line in Spain between Madrid and Seville, inaugurated in 1992; it is therefore a station with a consolidated demand and a known urban development. The GC-based analysis presented in the paper assesses a hypothetical new scenario where two stations are in operation: the current central station and a hypothetical peripheral station (Cantaelgallo station). The study also establishes the maximum investment that should be earmarked for the construction of a second peripheral station by comparing the GC obtained in a 30-year projection. It should be noted that the aim of building a second station is to facilitate access to HSR for travellers who would take a long time to access the central station by private car due to congestion and parking, or by public transport due to poor connections, and who would therefore use alternative modes of transport instead of HSR on their journeys (plane or private car).
The paper is structured as follows. Section 2 describes the case study and the two scenarios under assessment. Section 3 explains the methodology developed, which is applied to the case study to measure the accessibility of the scenarios (Section 4) and their economic evaluation. Finally, Section 5 discusses the results and sets forth the conclusions of the study.

2. Background

This analysis is based on the province of Seville, in southern Spain, which covers an area of just over 14,000 square km and has a population of 1.9 million. Its capital, the city of Seville (hereafter Seville), has about 700,000 inhabitants, and is surrounded by a metropolitan area of about 800,000. The most populated cities in the metropolitan area are in the southeast—Dos Hermanas (130,000 inhabitants) and Alcalá de Guadaíra (75,000 inhabitants)—and in the west. The remaining half million people in the province live outside the metropolitan area (Figure 1).
The road infrastructure network in the province of Seville is composed of five radial highways centred on Seville, a complete inner ring road and an outer ring road that is partially in service. The PT network covers mainly the metropolitan area and comprises five suburban rail lines (Cercanías), two separate single-line light rail transit systems, the urban bus networks of Seville and four other cities, and the metropolitan bus network. The whole PT network registered a total of 116.7 million trips in 2018 [34] and is coordinated by the Consorcio de Transportes del Área de Sevilla (CTAS), the metropolitan PT Authority, including the zonal fare system and the prepaid smart card-based ticketing system. Fares depend on the number of zones crossed, the transport mode(s) and the number of transfers made. Long-distance transport is provided by an international airport and one main railway station. The airport is located 10 km northeast of the city centre, and in 2019 carried a total of 7.5 million passengers [35]. The main railway station is Seville—Santa Justa, which is located on the northeast edge of the city centre. It is managed by ADIF, the national rail infrastructure manager, and all train services there (suburban rail, regional rail and HSR) are provided by Renfe Operadora, the incumbent railway company.
In October 2019, which is considered as the reference month, about 60,000 access trips were identified as made by province dwellers, representing 13.6% of total trips. Figure 2 shows how the areas with the highest share of passengers belong to the city of Seville (64% of trips) or, to a lesser extent, to municipalities located in the southeast of Seville. This is the case of Dos Hermanas (6% of trips) and Alcalá de Guadaíra (3%), where passengers coming from these municipalities would possibly obtain a greater benefit from the implementation of the new Cantaelgallo station.
This paper compares the access to HSR stations in the province of Seville for two scenarios:
  • Base scenario: the current Santa Justa station only.
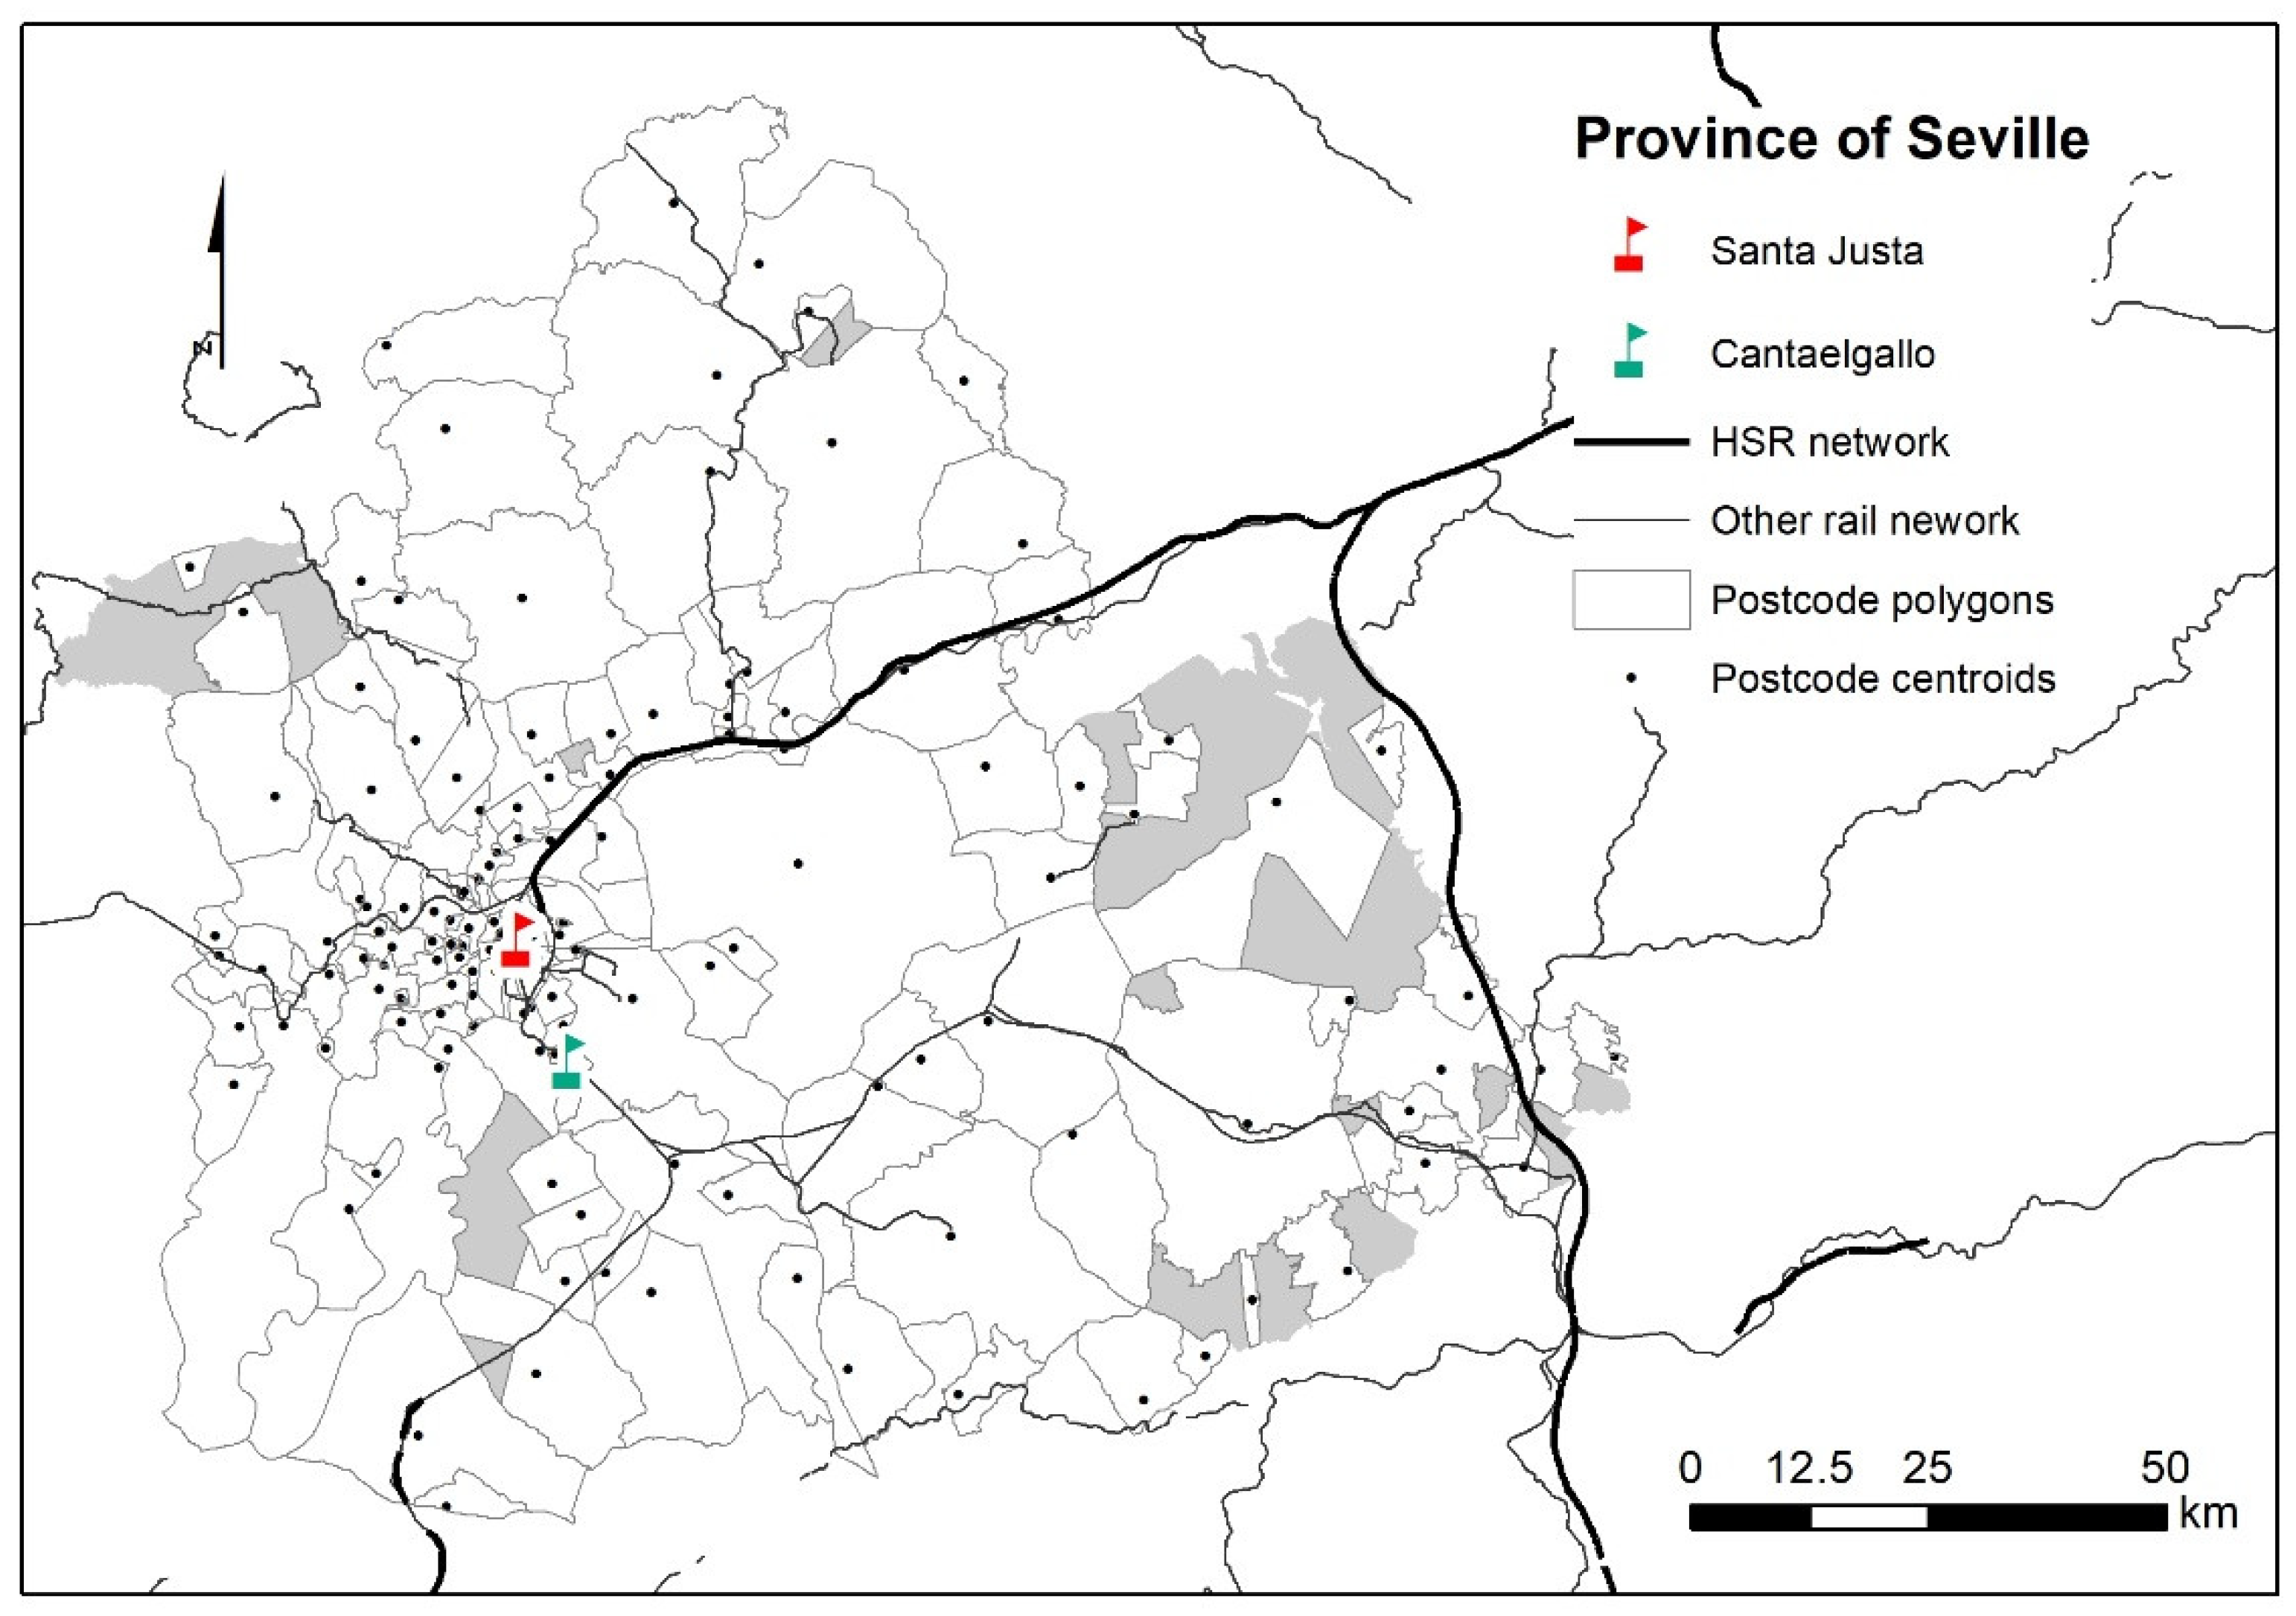
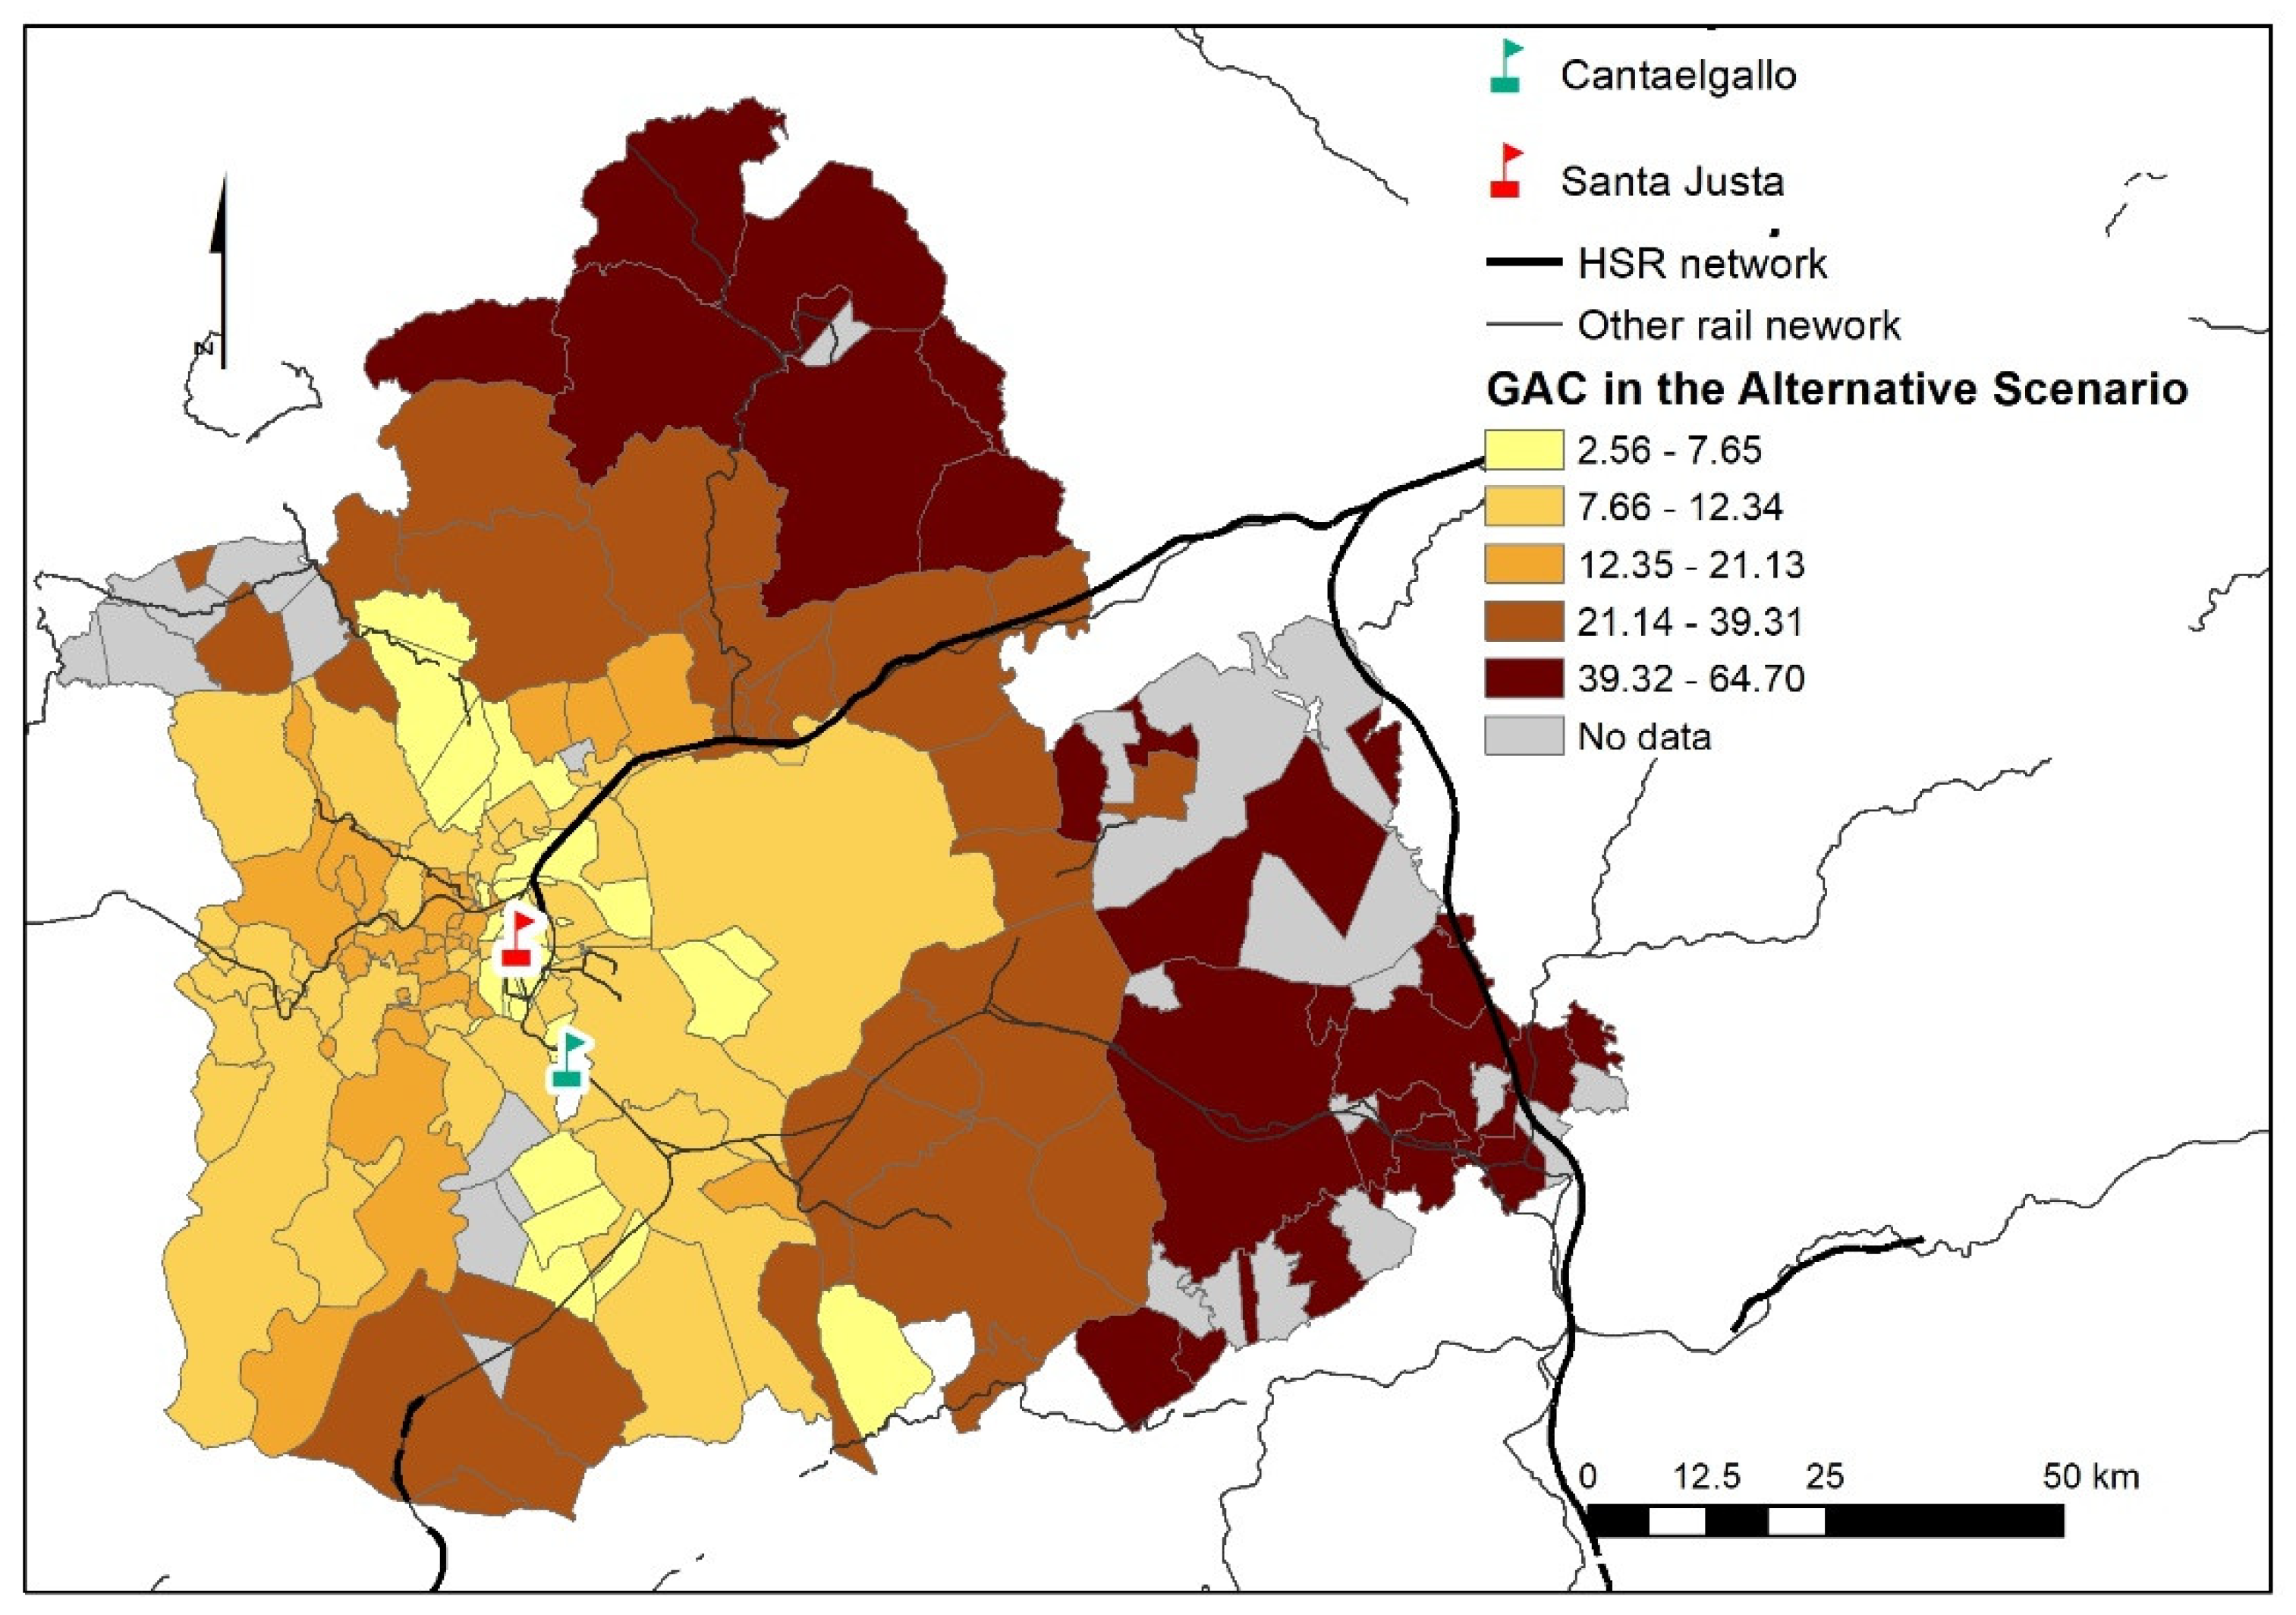
  • Alternative scenario: two stations operating simultaneously, the current Santa Justa station and a new station—Cantaelgallo—on the outskirts of the metropolitan area.
The road and public transportation networks are the same for both scenarios, which are described in detail below.

2.1. Base Scenario: Current Station

The base scenario consists of the actual situation in 2019, that is, only the Seville—Santa Justa station. Santa Justa is Seville’s main railway station and one of the most important in Spain. Its main service is the HSR route to Madrid, followed by HSR routes to Malaga, and regional rail services to nearby provinces such as Cadiz or Huelva, and the five suburban rail lines also have their terminus there. The annual ridership is 3.7 million HSR trips, 2.55 million regional trips and about 1.5 million suburban rail trips [36]. Apart from the suburban rail lines, access to the station includes two car parks, a taxi stand, a drop-off area and five urban bus lines.

2.2. Alternative Scenario: Two Stations

The alternative scenario comprises two stations working simultaneously: the existing station of Seville—Santa Justa, as described above, and a new HSR station, Cantaelgallo. This second station is located on the southern outskirts of the city of Dos Hermanas, on the Seville—Cadiz line and is currently a small station for suburban rail services. For the purposes of this work, the station will be remodelled to accommodate HSR services, with the aim of improving access to HSR services from the south and east of the metropolitan area of Seville. A taxi stand, a drop-off area and a free car park will be built next to the station, on a site currently used as an informal parking lot. We assume that these infrastructures will have enough capacity to supply the station demand. This new station will also operate the same HSR and regional train services and destinations as Santa Justa. The number of services required by each station to fulfil the potential demand, however, is beyond the scope of this study.

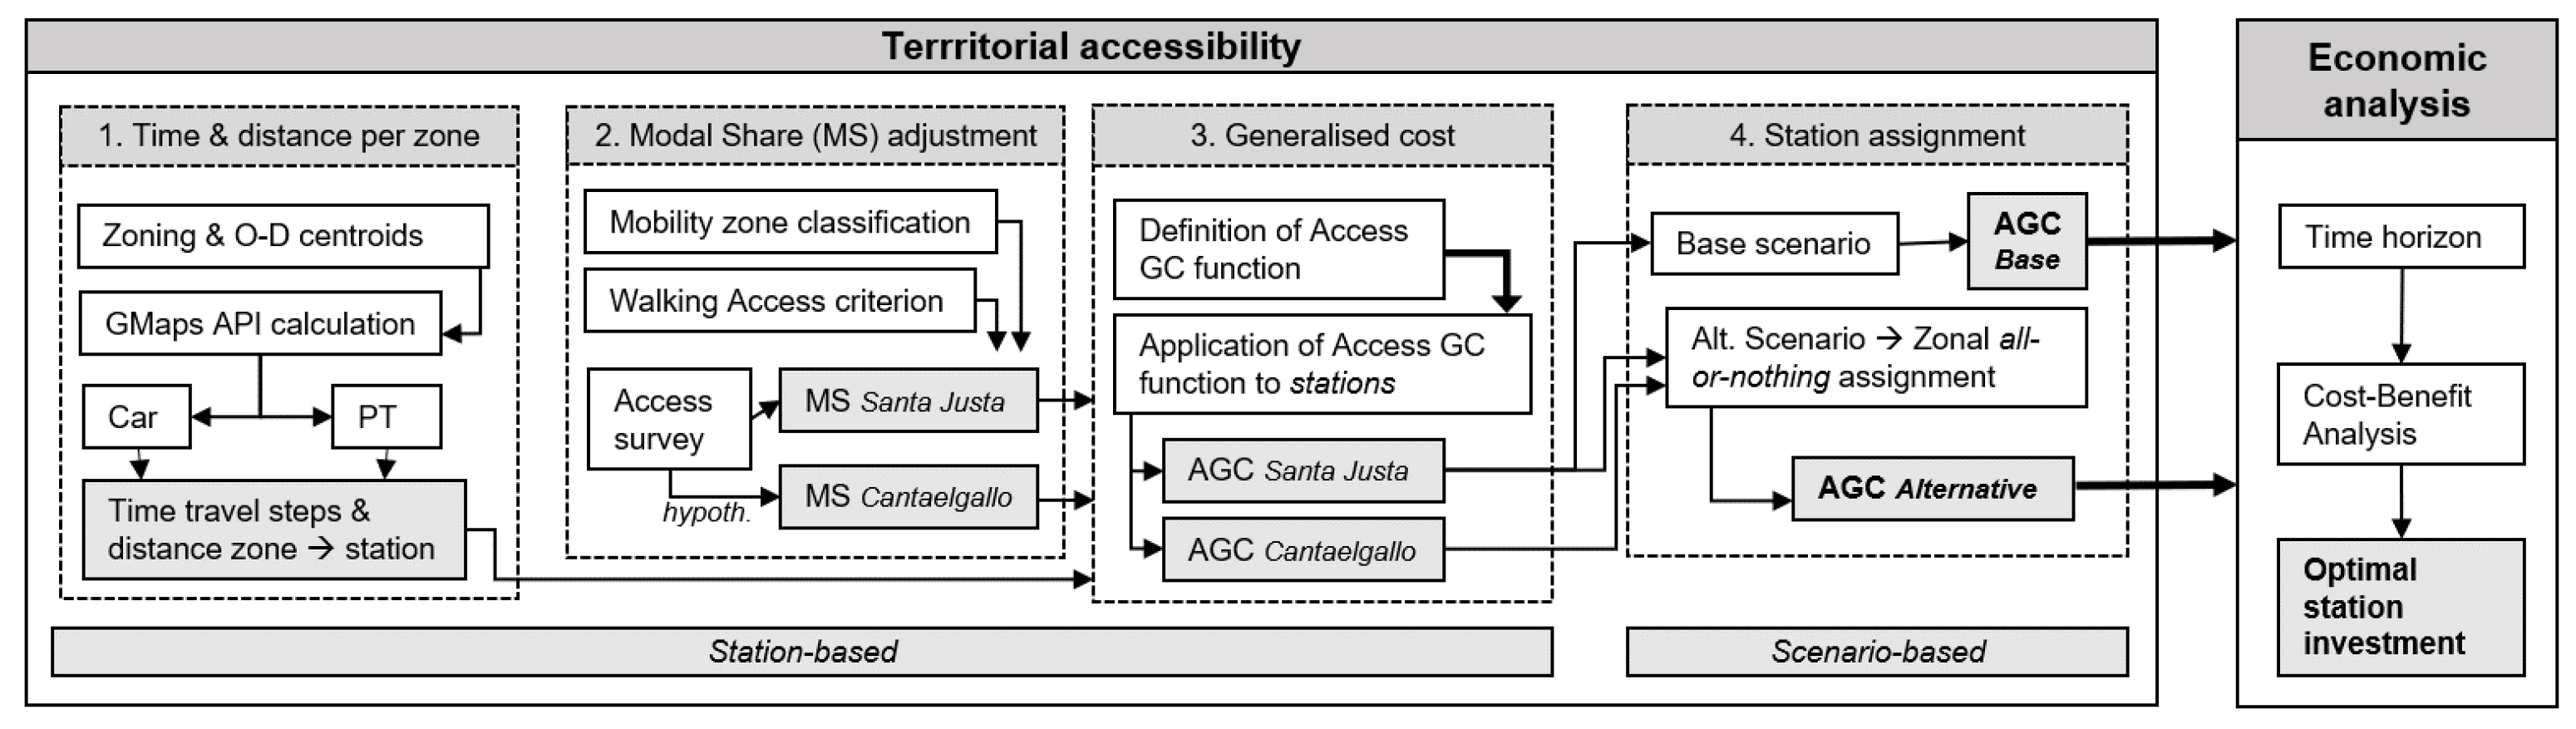
3. Methodological Framework

The main purpose of this work is to determine whether the improvement in metropolitan accessibility to HSR services would justify a new peripheral station. With this aim, a four-stage methodology based on generalised cost (GC) functions was designed using the available data to assess the territorial accessibility. This is followed by an economic assessment based on a CBA. The methodology and the data gathering and preparation processes are described below (Figure 3).

3.1. Data sources

As multiple data sources were used for this study, the data needed to be homogenised to adapt to the methodological framework. Most of the data are supplied by Renfe Operadora, from three data sources. The first dataset contains the number of passengers accessing Santa Justa for each residential postcode in October 2019, obtained from the ticketing system. These data zoning constraints make it necessary to consider only residents in the province of Seville, who account for 13% of total trips, with the remainder being from outside the province (40.5%) or not recorded (46.2%). The second dataset comprises the modal access to Santa Justa by municipality, from a specific survey conducted in autumn 2019, including walking, PT, taxi, car (both driving and as a passenger). Finally, Renfe’s annual traveller satisfaction survey in Santa Justa—also conducted in autumn 2019—provides aggregate information on trip purpose and parking choices.
Access times and distances by car and PT are obtained from the Google Maps API, while the travel time value according to trip purpose is extracted from the latest regional Catalan Handbook for Transport Investments [37], then adapted to the case study (Seville) using the regional consumer price index values from the Spanish Statistics Office.

3.2. Assessment of Territorial Accessibility Based on Generalised Cost Functions

The objective of this section is to assess the cost of access to rail services in the two scenarios all over the territory as a measure of the accessibility to the stations. This is accomplished by designing a four-step calculation. Steps 1 to 3 are performed for each station, and the results are applied to both scenarios in Step 4, given that the two stations coexist in the second scenario.

3.2.1. Step 1. Travel Time and Distance Access Per Zone

The initial step consists of calculating travel time and distance between origins and destinations via the street network or the public transport system. The same procedure is repeated for each destination, which are points located at each of the stations studied. The trip origins are also established as points, one for each polygon corresponding to the postcodes in the province (Figure 4). Specifically, 134 points are considered as origins. The procedure to obtain travel times and distances is then performed in three steps.
First, the spatial databases are prepared, consisting of a layer containing the destination point obtained from the station coordinates, and a layer containing the trip origin points obtained from the centroids of the polygons delimiting the postcodes. Centroids that are too far away from the transport network are edited manually to bring them closer to the transport network.
Second, the travel time and distance by car between origins (points in each postcode) and destinations (stations) is calculated using the tool created in Python for ArcGIS 10.X traveltime.py by [38], which has been adapted for this work. The tool obtains the travel time and distance between two layers of points from the Google Maps Directions API (application programming interface). This allows the use of Google Maps’ full modelling and database update capabilities of. The API returns information based on the route recommended by the Google Maps API, which the program chooses by looking for the shortest travel time. The choice of route and time is based on Google’s road network and average traffic conditions.
Finally, the same tool is adapted to obtain travel times and distances by public transport, using the same origins and destinations as in the previous case. The Google Maps Directions API returns information based on the route recommended by the Google Maps API, which the program chooses by looking for the shortest travel time using the public transport system. It gives the travel time and mode for each leg of the journey and includes walking travel times and distances to connect the different public transport modes. In this case, the calculations must be made for a specific time and date in the future, so the date chosen is 2 February 2021, and three different times: 8:00, 11:00 and 18:00. The value used for the subsequent calculations is the average of the three.

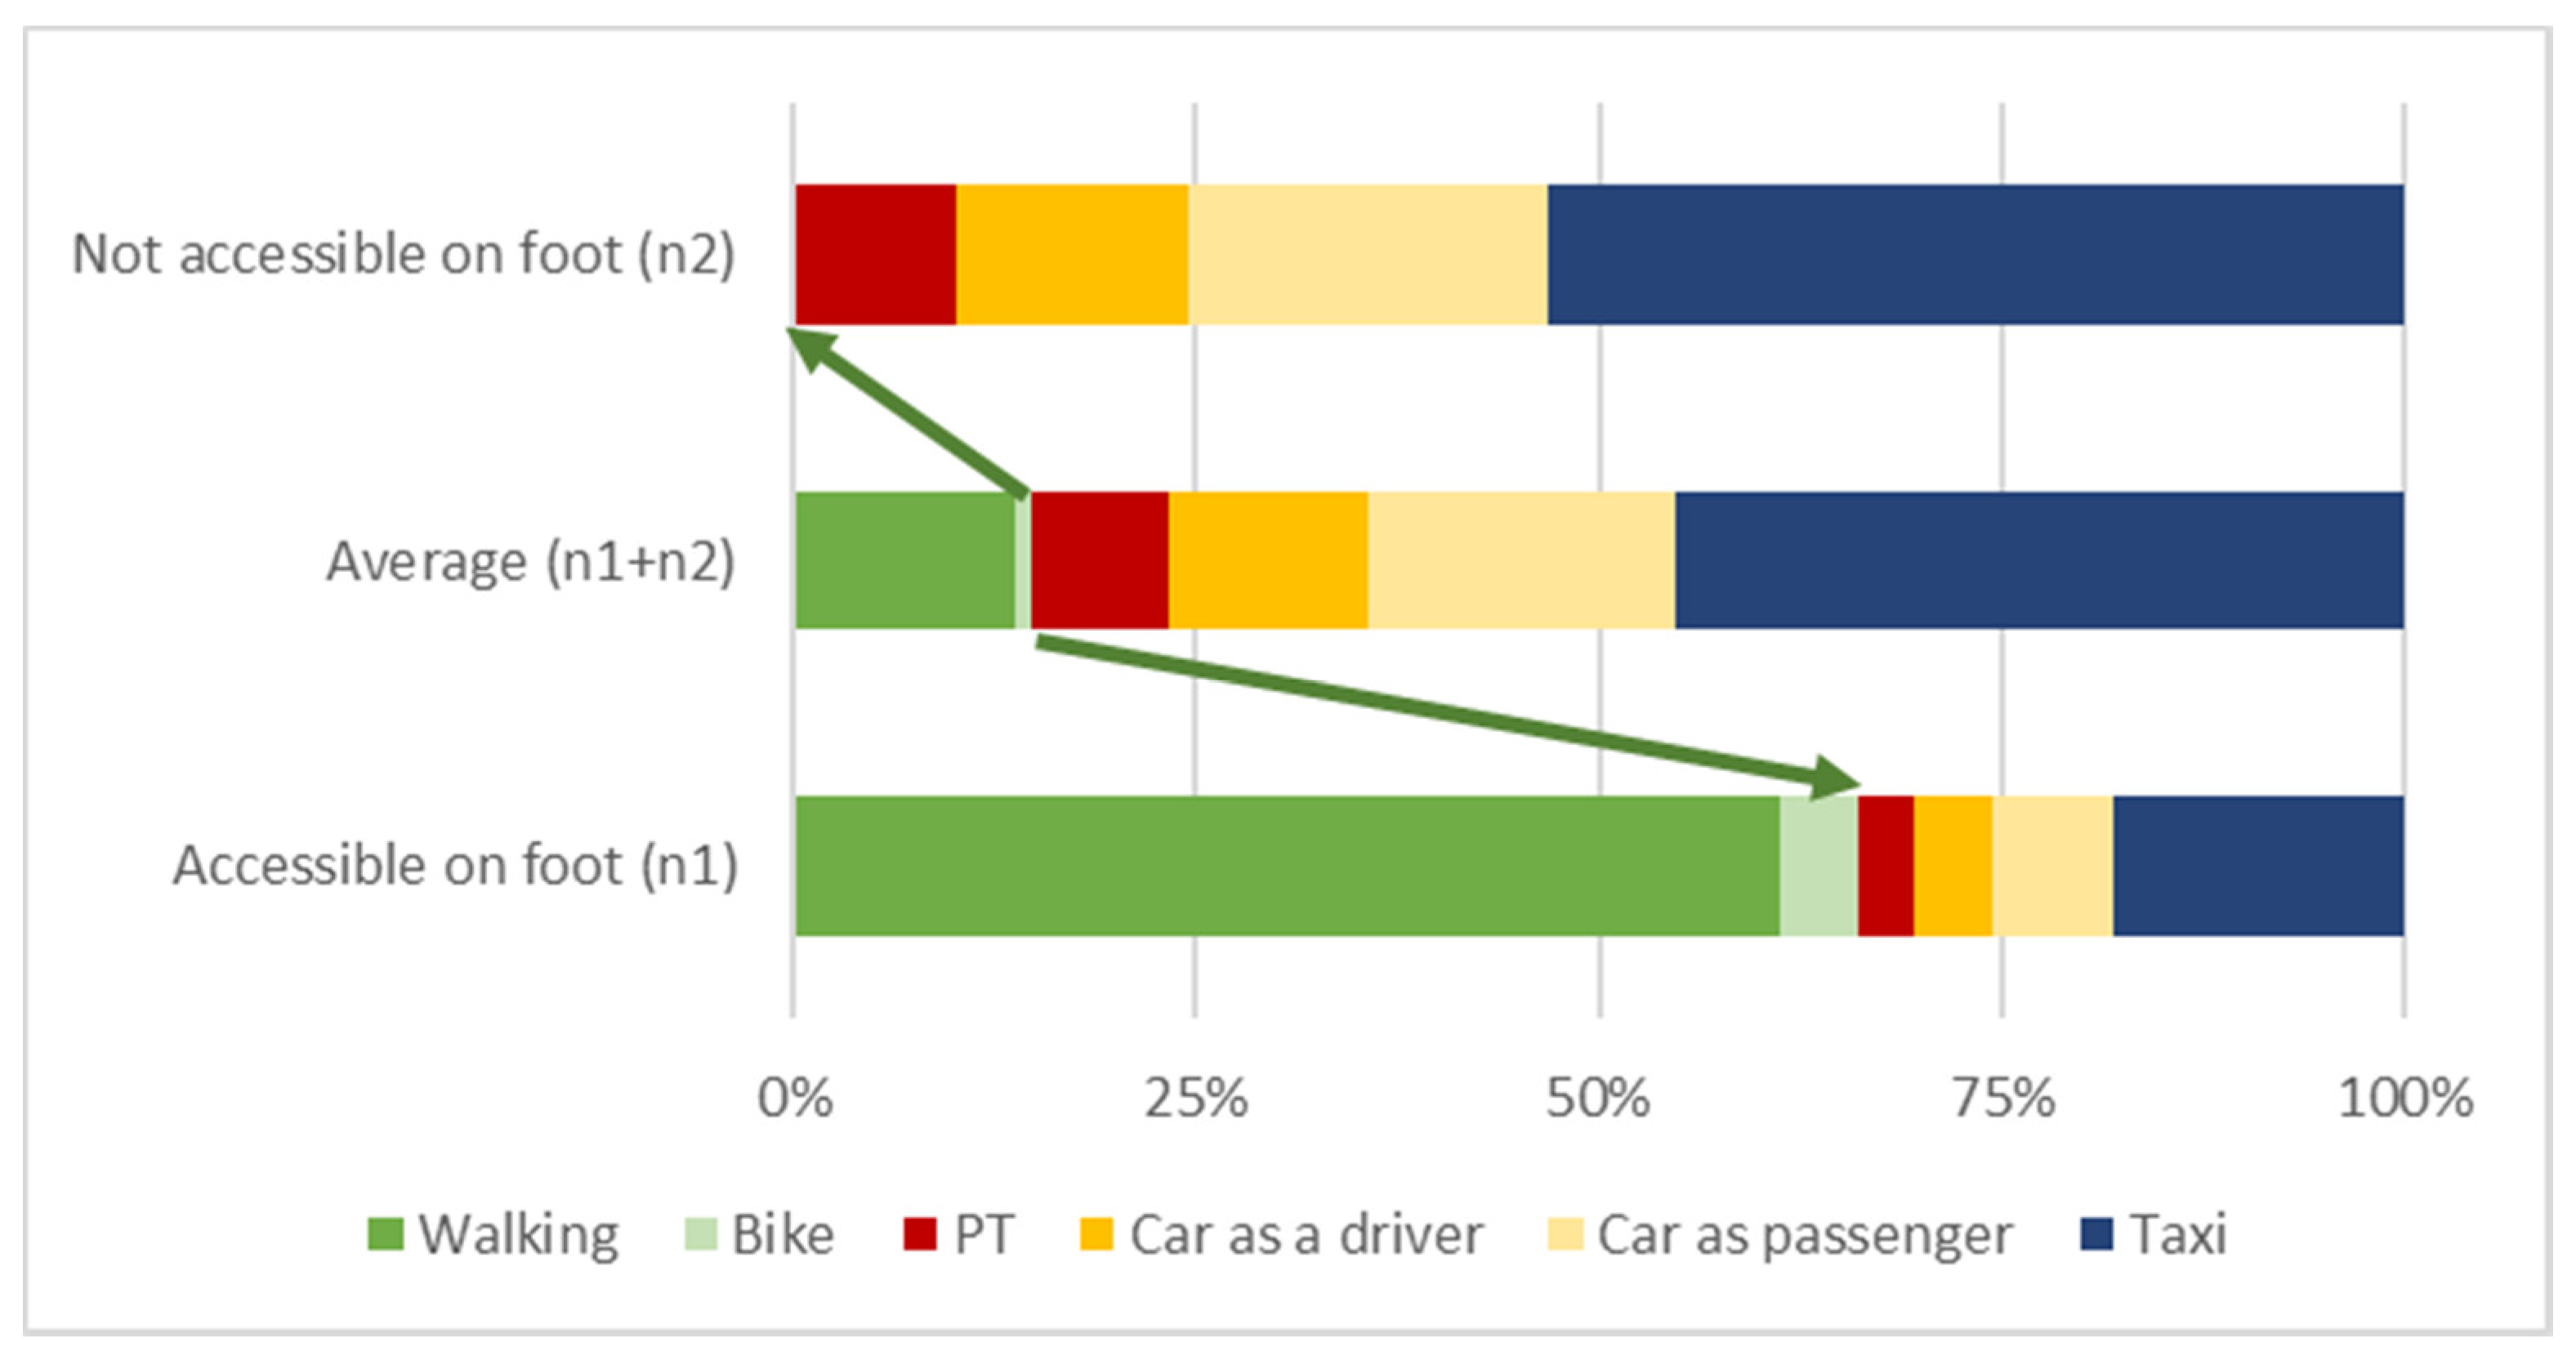
3.2.2. Step 2. Modal Share Adjustment Per Zone

The second step assigns a modal share to each zone for each station. The modal share calculation is based on the sample of the modal distribution of access to Santa Justa and the unavailability of data on the expected modal distribution of access to Cantaelgallo. While modal distribution to Santa Justa can be easily inferred from the data, the modal distribution to Cantaelgallo implies making several hypotheses. Each station therefore requires a different specific adjustment of the modal distribution, as explained below.
For Seville—Santa Justa the municipalities and their zones are first classified into five groups in accordance with the current PT fare-zoning system (Figure 1): A (Seville), B, C, D (this includes the D, E and F fare zones) and E (outside the metropolitan area). The average modal share is calculated for each municipality in the dataset and for each group. The modal split is then assigned to the different zones following two strategies: one for Seville and another for the remaining municipalities.
The data provide the overall modal share for the city of Seville, so it must be adjusted for the different zones of the city. This is estimated on the basis of users who access on foot, as these trips occur only in the zones closest to the station. The zones are therefore classified into those with and without feasible pedestrian access to the station—taking a 30-min distance as the threshold—assigning all the walking access trips in the city from the sample to these feasible zones. This results in three zones from which the station can be accessed on foot (n1) and 18 from which it cannot (n2). The modal split of the other modes is weighted in the two different types of zones, as shown in Figure 5. The remaining municipalities are assigned the modal distribution according to the existing data. If a municipality is included in the modal access dataset, its modal distribution is taken directly from there; otherwise, it takes the average modal split of its group. When a municipality has several postcodes, the same modal split is assigned to all areas.
Lastly, it is necessary to calculate the percentage of cars parked at the station (paying a fee) and outside the station (free) arriving from each zone. The overall value is obtained from the traveller satisfaction survey and applied equally to each zone by weighting the modal share of car drivers.
As for Cantaelgallo, there are no surveys on station access preferences, so the existing modal access distribution for Santa Justa is taken as a reference, assuming three hypotheses: (i) passengers from nearer zones will try to access on foot, (ii) municipalities in the Seville—Dos Hermanas corridor will have similar access patterns for both stations, and (iii) there is no PT access from municipalities outside the metropolitan area.
Consequently, access from zones in Dos Hermanas to Cantaelgallo station follows the same logic as from Seville to Santa Justa station, because the internal mobility patterns of Dos Hermanas may resemble those of Seville. The logic is: if pedestrian access from Seville is feasible (less than 30 min) from that zone, it is assigned the same modal split of walkable zones to Santa Justa, and if not, it is assigned the modal split of non-walkable zones to Santa Justa, resulting in four non-walkable zones and one walkable zone. The modal share from Seville to Cantaelgallo station is assumed to be the same as from Dos Hermanas to Santa Justa station. For zones belonging to the Dos Hermanas—Seville corridor and to the nearby city of Alcalá de Guadaíra, the same modal distribution is taken as in the access from these zones to Santa Justa station. The remaining municipalities are assigned the average modal split of their group (B and C combined; D; and E) in the base scenario.

3.2.3. Step 3. Generalised Cost Per Zone

This step results in a generalised access cost (GAC) for each zone, based on a GC function applied to each transport mode, weighted by the modal distribution of the zone. Hence the GAC value represents the average cost to access the HSR station from a given zone, as if it only that station exists.
First, the GC is defined for each mode and zone. As stated in the literature, the GC can be divided into three factors: direct costs, monetary value of travel time and other qualitative factors including convenience or comfort. These qualitative factors are not considered here due to the lack of stated-preferences surveys for the case study on this subject. The average car comfort cost (or time savings) is an intermediate value between the PT comfort cost value and the non-comfort cost value [39]. In short, by following the recommendations in the literature [25], the proposed GC equation includes only one term of direct cost and several terms of travel time to capture the different trip stages:
GC i , m = C i , m + v · ( 1.5 · t W 1 , m + t i , m + 1.5 · t W 2 , m + 1.5 · t TR , m + 2.5 · t P , m )
where:
GCi,m is the generalised cost of a trip (in euros) from zone i to the station in mode m.
Ci,m is the direct cost of a trip from zone i to the station, which may depend on the current PT fares or the distance d to the station, according to the mode m.
v is the average hourly travel time value.
ti,m is the in-vehicle time from zone i, calculated for each mode m.
tW1,m is the estimated walking time from the origin to the access mode m, and tW2,m is the estimated walking time to the station from the access mode m.
tTR,m is the transfer time in PT, calculated separately for each route. The value is 0 for other modes.
tP,m is the time spent searching for parking.
Values of C, tW1, tW2 and tP for each mode are shown in Table 1. It should be noted that trips are considered from the centroid of each zone, and that an average of five minutes has been estimated for tW1 for car and taxi to account for the urban fabric next to the centroid, while for PT this value depends on the actual frequency or timetabling and the distance to the station/bus stop. The value of tW2 varies based on the distance to the station entrance, and is practically null in the drop-off areas and higher for parking on nearby streets. tP values take into account the existing parking congestion in the station surroundings. The value of v is estimated as the average travel time for each trip purpose (as explained in Section 3.1) weighted by the overall percentage of each trip purpose (Table 2), resulting in 6.42 euro/h. Coefficients of walking and transfer time are set at 1.5, i.e., a 50% increment over in-vehicle time, while the coefficient for parking search is set at 1.7, as found in the literature meta-analysis of travel time costs [40]. Specific studies sometimes present higher in-vehicle time for transfers (around 2.0) [41], and adopting this coefficient could lead to slightly different results.
The GAC for each zone is then obtained as the sum of the generalised cost of each mode weighted by the modal share (MS) of access.
GAC i = m GC i , m · MS i , m   with   m MS i , m = 1

3.2.4. Step 4. Assignment to Station

Once the GAC per zone has been obtained for both stations, each zone must be assigned to a station following an all-or-nothing strategy for each scenario; that is, all access trips (and their generalised cost) in a zone are assigned to the same station. In the base scenario all zones are assigned to Santa Justa, as it is the only station existing.
The alternative scenario is slightly more complex as there are now two stations, so the creation of a second station will mean that some users will no longer use the Santa Justa station but the new Cantaelgallo station despite the extra travel time by HSR from the old to the new station. The complete variation in access cost, Δ(GACi), has therefore been defined in Equation (3) as the difference between the total access cost to the new station (that is, generalised access costs (GACinew) plus the extra travel time (HSRtt) multiplied by the value of time (v) to transform it into monetary values) and the generalised access cost to the existing station (GACiold).So for each zone i, all the passengers in a zone will be assigned to Cantaelgallo station if Δ(GACi) < 0 and otherwise they will be assigned to Santa Justa station.
Δ ( GAC i ) = ( GAC i new + v · HSRtt )   GAC i old
The GAC value for each zone in the alternative scenario will therefore be GACiold if Δ(GACi) > 0 and (GACinew + v · HSRtt) if Δ(GACi) < 0.

3.3. Economic Assessment

This economic analysis aims to determine to what extent the construction of the new station would be tentatively suitable in socioeconomic terms by comparing both scenarios. In summary, this economic assessment will reveal the upper limit of the acceptable construction costs. Here, a basic CBA is selected to perform this analysis, since accessibility to the station was measured directly in monetary terms in the previous step, and several assumptions have been made to simplify this analysis. While this CBA adheres to the European Commission’s guidelines on CBA [42], this paper proposes a new reference parameter, namely Investment to Access Savings ratio (IAS), after the CBA. The IAS is conceived as a helpful parameter for practitioners.
The main inputs for the CBA are costs and benefits. The costs included are the construction of the new station and its car park. As the new station cost is unknown a priori, a one-million euro incremental cost step is taken, starting at two million EUR and ending at ten million EUR. Construction costs are input in the first two years of the analysis. The only benefits included in the CBA are the time savings, which are the difference in GAC between the alternative scenario and the base scenario. The benefits start computing from the third year onwards. The GAC savings are considered for the base year and estimated to increase at 2.5% over the first ten years after the station opening—based on the actual 10-year growth rate of HSR passengers in Santa Justa station—and then to stabilize at a 1% growth rate until the end of the time horizon. One extra assumption is made to simplify the analysis: operation and maintenance costs will be paid in full from ticket revenues, so both would cancel each other out and can therefore be discarded from the calculation.
CBA also requires three more parameters: a time horizon, the residual value of the infrastructure, and the social discount rate, whose values are taken according to the European Commission’s recommendations [42]. First, a time horizon must be defined for the project; this is set at 30 years, enough to cover its longer-term effects (although the investment lifetime is estimated at 50 years) followed by the residual value, which is above zero since the infrastructure lifetime exceeds the time horizon. This is done using the straight-line depreciation method. Lastly, the social discount rate reflects the opportunity cost of capital for the investor and is set here at 5%.
Two common equivalent indicators were selected to assess the profitability of this project and hence the suitability of the station: the economic rate of return (ERR) and the net present value (NPV). For a project to qualify as minimally profitable, the conditions ERR > 5% or NPV > 0 must be met. To comply with the goal of the economic analysis, the CBA is calculated for each level of the station cost step (one million step from two to ten million euros), in order to establish the maximum station investment that makes the intervention profitable.
Lastly, the Investment to Access Savings ratio (IAS) is defined as the quotient between the total investment and the total GAC savings in the base year (Equation (4)) and it is calculated from each investment value. Its comparison with the ERR will provide a maximum value of the IAS ratio—below this number, the station investment becomes profitable.
IAS   = Investment / GACsav baseyear

4. Results

The estimation of the average GAC in the two scenarios is based on the modal split for accessing the station, as well as the generalised cost functions defined in the methodology. This section presents the outcomes of both scenarios separately, followed by the economic analysis based on the accessibility outcomes.

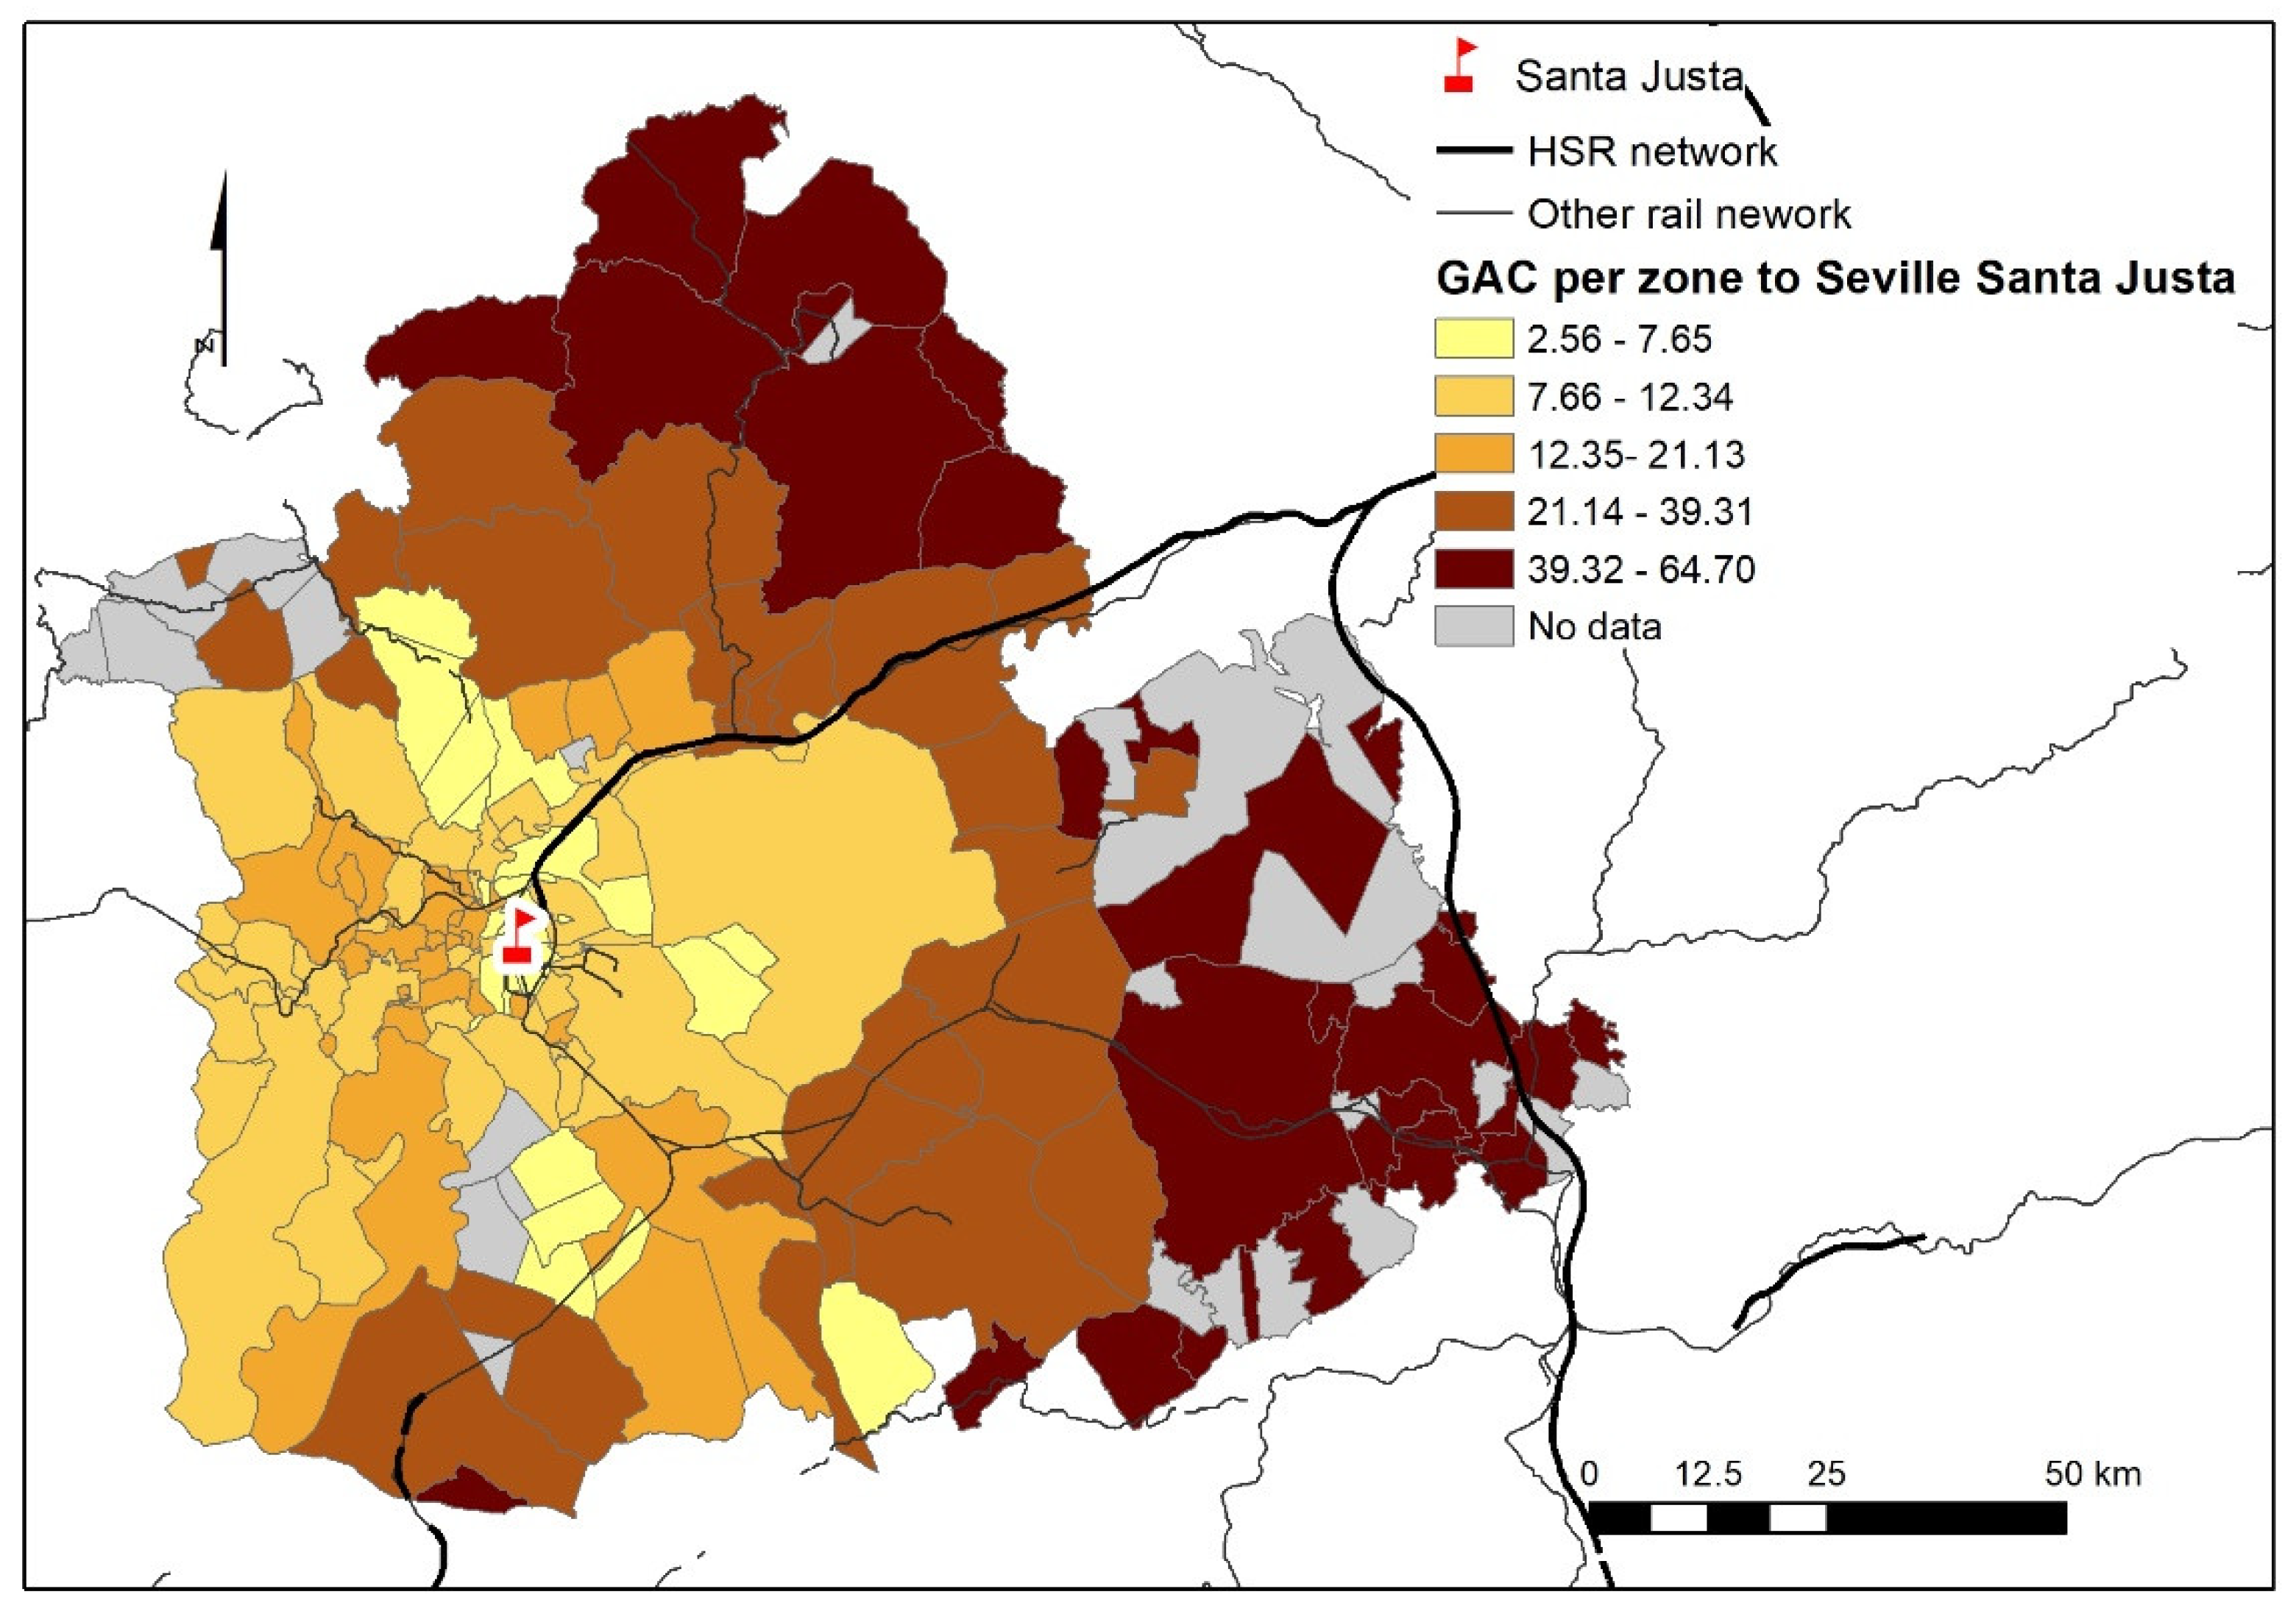
4.1. Accessibility in the Base Scenario: Santa Justa Station

The base scenario comprises the current access to the Seville—Santa Justa station. On average, travellers access the station mainly by taxi (41%) and car (37%), while PT and walking each account for 11%. However, the modal splits vary according to the different rings: taxi represents about half the trips in Seville and in the nearer ring, while car use ranges from 75 to 100% in the outer rings (D and E).
The mean value of the GAC in this scenario is 8.37 EUR/trip, with a wide variation between the different zones, ranging from 2.96 to 64.70 EUR/trip. Figure 6 shows the spatial distribution of the GAC per zone. It is especially low in areas closer to the station, with an average of as little as 3.15 EUR/trip. These are zones that many travellers can access on foot from, clearly producing a sharp reduction in GC. These adjacent areas also concentrate the largest volume of passengers and contribute to maintaining a low mean GAC for the city of Seville (6.26 EUR/trip). However, the existence of highways and public transport networks means that in some metropolitan corridors this generalised cost of access is clearly below the average (Figure 6). As an example, the northern sector of the metropolitan area is accessed mainly by public transport, which is efficiently connected to the HSR station. Finally, some outer areas present lower values of GAC than others that are somewhat nearer Seville—Santa Justa. For instance, the average GAC in ring D (8.77 EUR/trip) is lower than the value in ring C, at 10.27 EUR/trip (Table 3). Although it may appear counterintuitive, it should be noted that the GC is lower because most of the access trips from these zones are made by car passengers, thus avoiding direct costs for the passenger.

4.2. Accessibility in the Alternative Scenario

The alternative scenario is assessed in two steps: first, the outcomes derived solely from the Cantaelgallo station, and then the full alternative scenario, which comprises both scenarios. This is followed by the assignment of zones to each station.

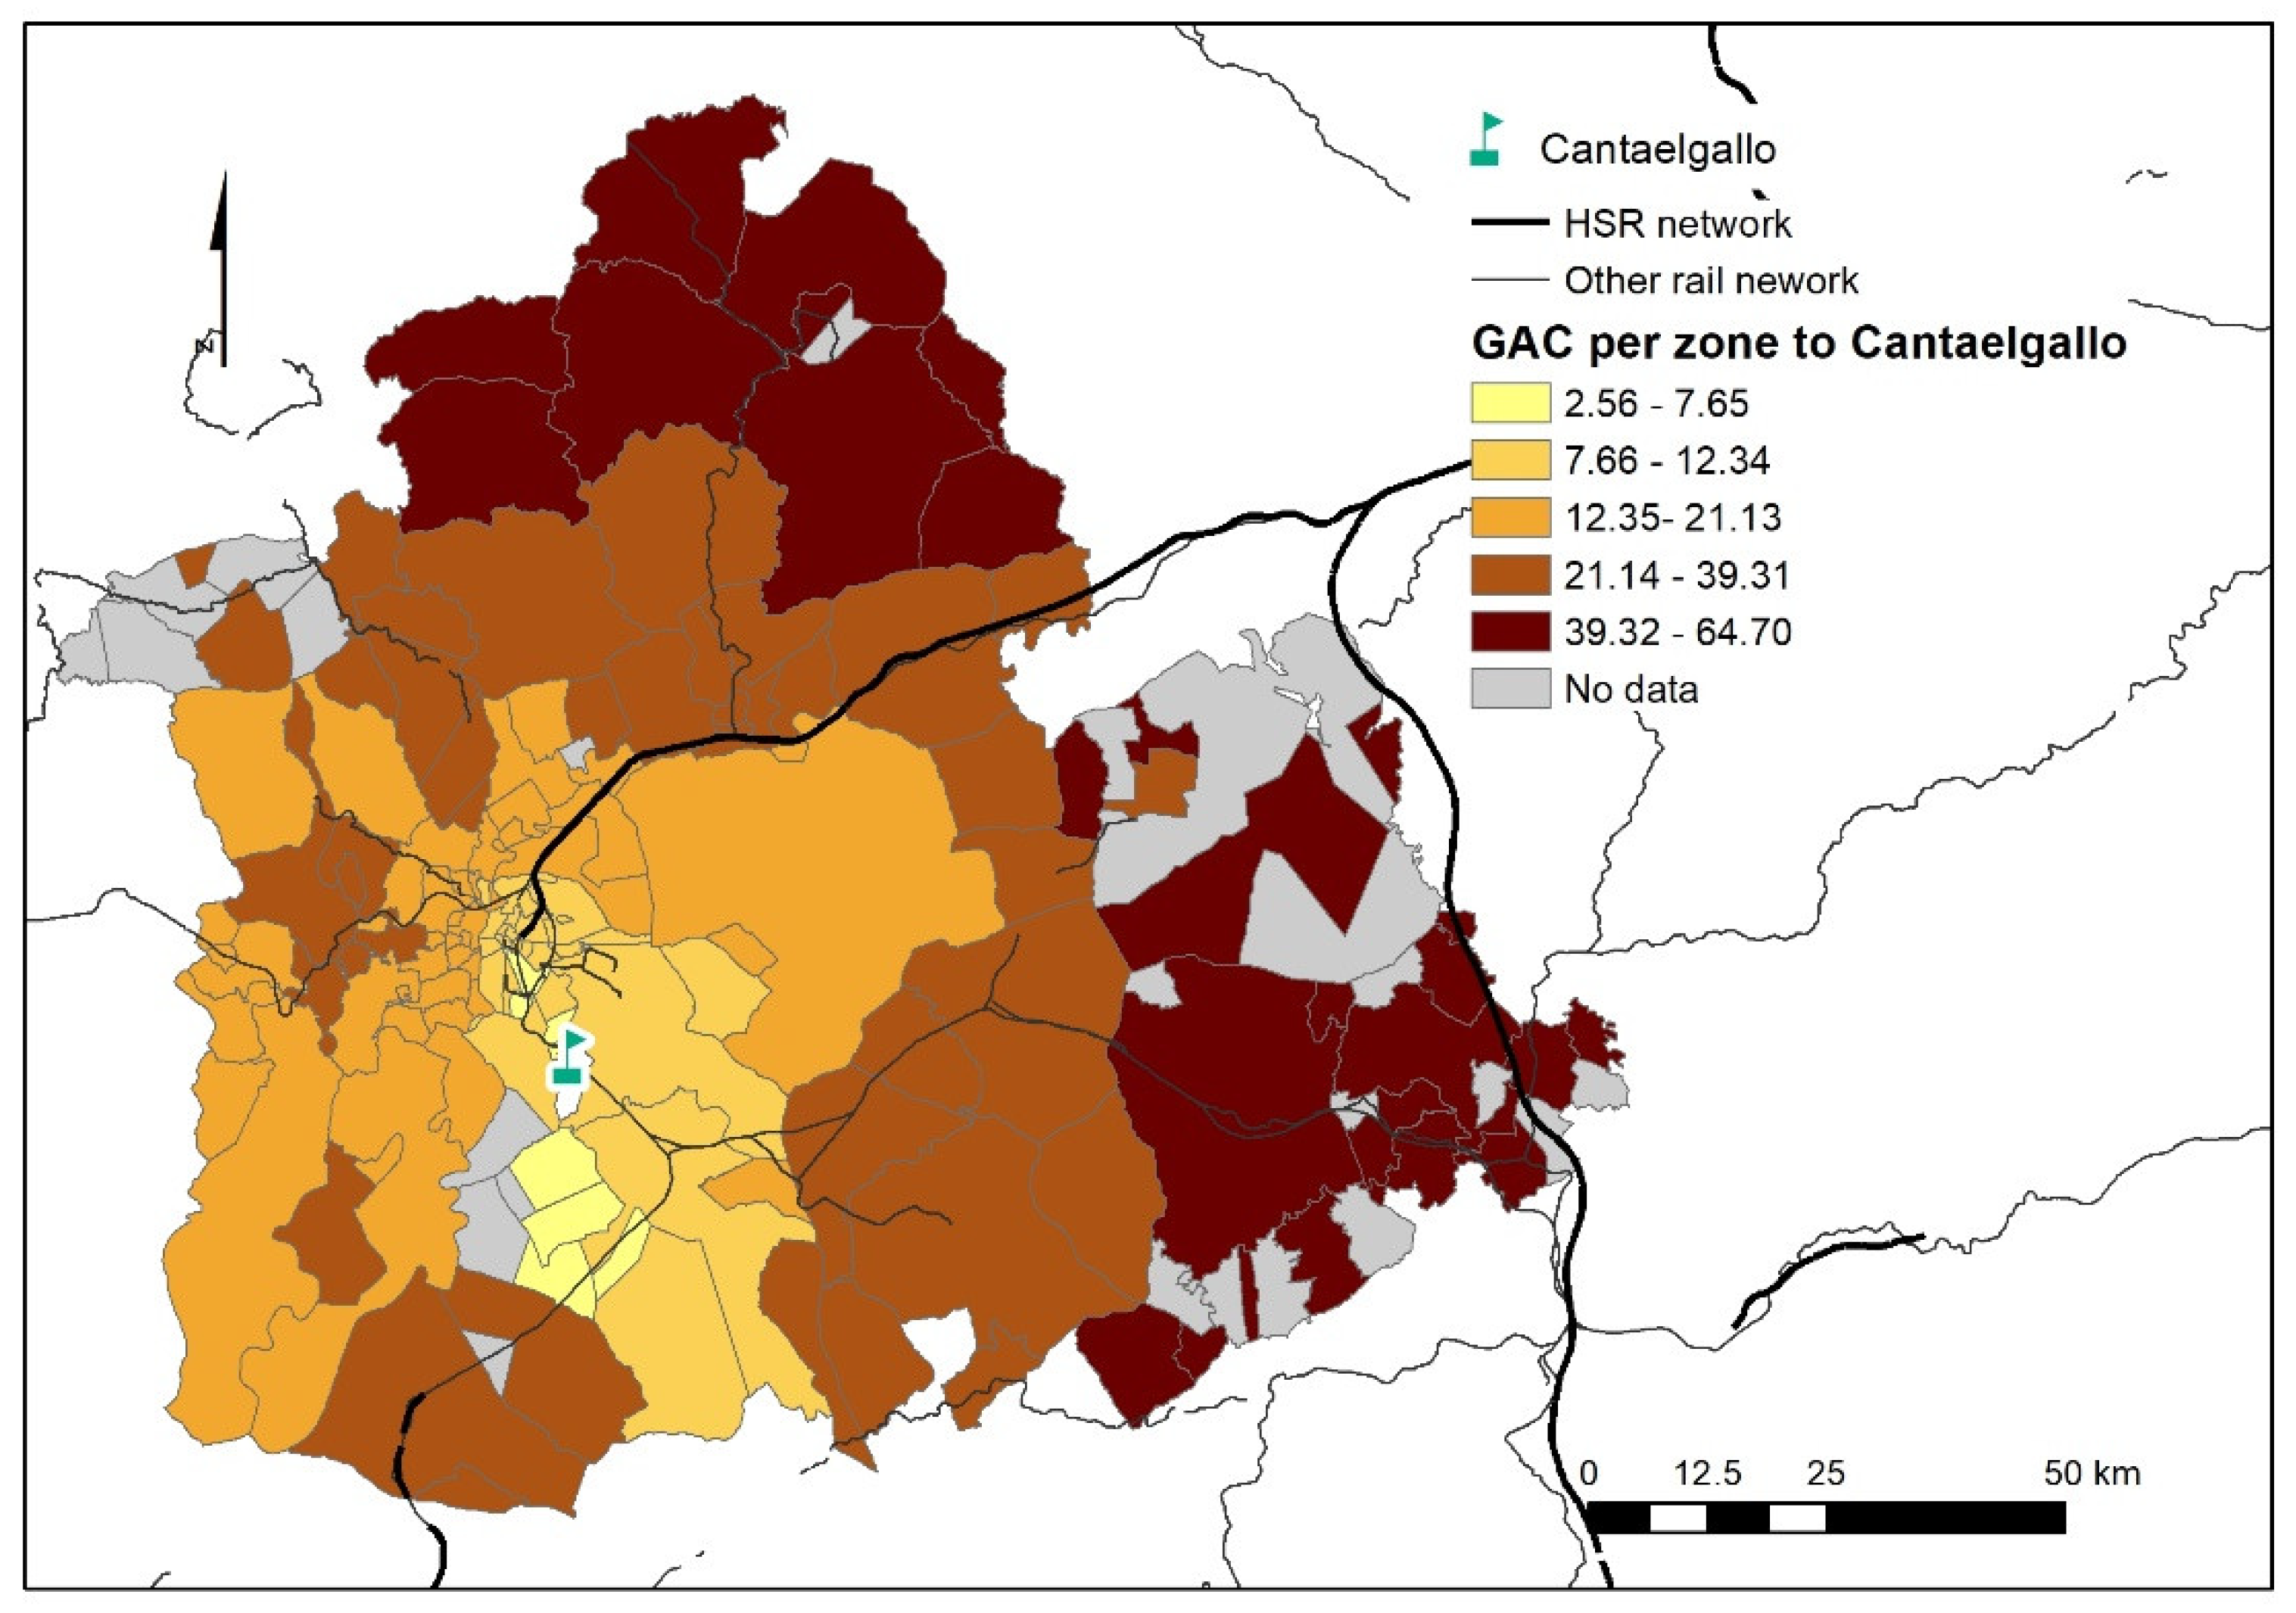
4.2.1. Cantaelgallo Station

On average, in terms of the modal access split, 44% of travellers access the station by car and 37% by PT; this last number is because it is estimated that half the passengers from Seville (who account for 64% of the total) access using this mode. Conversely, access on foot accounts for only 1% of trips, since only one zone has been identified as reachable by walking. Access from the station location in Dos Hermanas is mainly by taxi (48%), followed by car (34%).
The average GC of access per zone is 11.48 EUR/trip, which is 37.1% more than for the Seville—Santa Justa station, despite the elimination of the parking fee for Cantaelgallo. Figure 7 shows the territorial distribution of the estimated GAC to the Cantaelgallo station, where it can be seen to respond to the expected radial growth but is distorted by the existence of a transport corridor going southwards from Seville. This explains why peripheral areas located to the south and southeast of the province have a low generalised cost of access, as these areas are the main beneficiaries of the construction of this new station, while most metropolitan areas have a high generalised cost of access to the new station. Table 3 reveals that average costs from the B and C rings increase, while the E ring improves its access. The average GAC of Dos Hermanas, where the station is located, is 6.76 EUR/trip, quite similar to Seville’s GAC to Santa Justa in the base scenario. The result for the walkable zones is similar: the GAC to Cantaelgallo from walkable zones is 2.56 EUR/trip, compared to the 3.15 EUR/trip for Seville—Santa Justa.

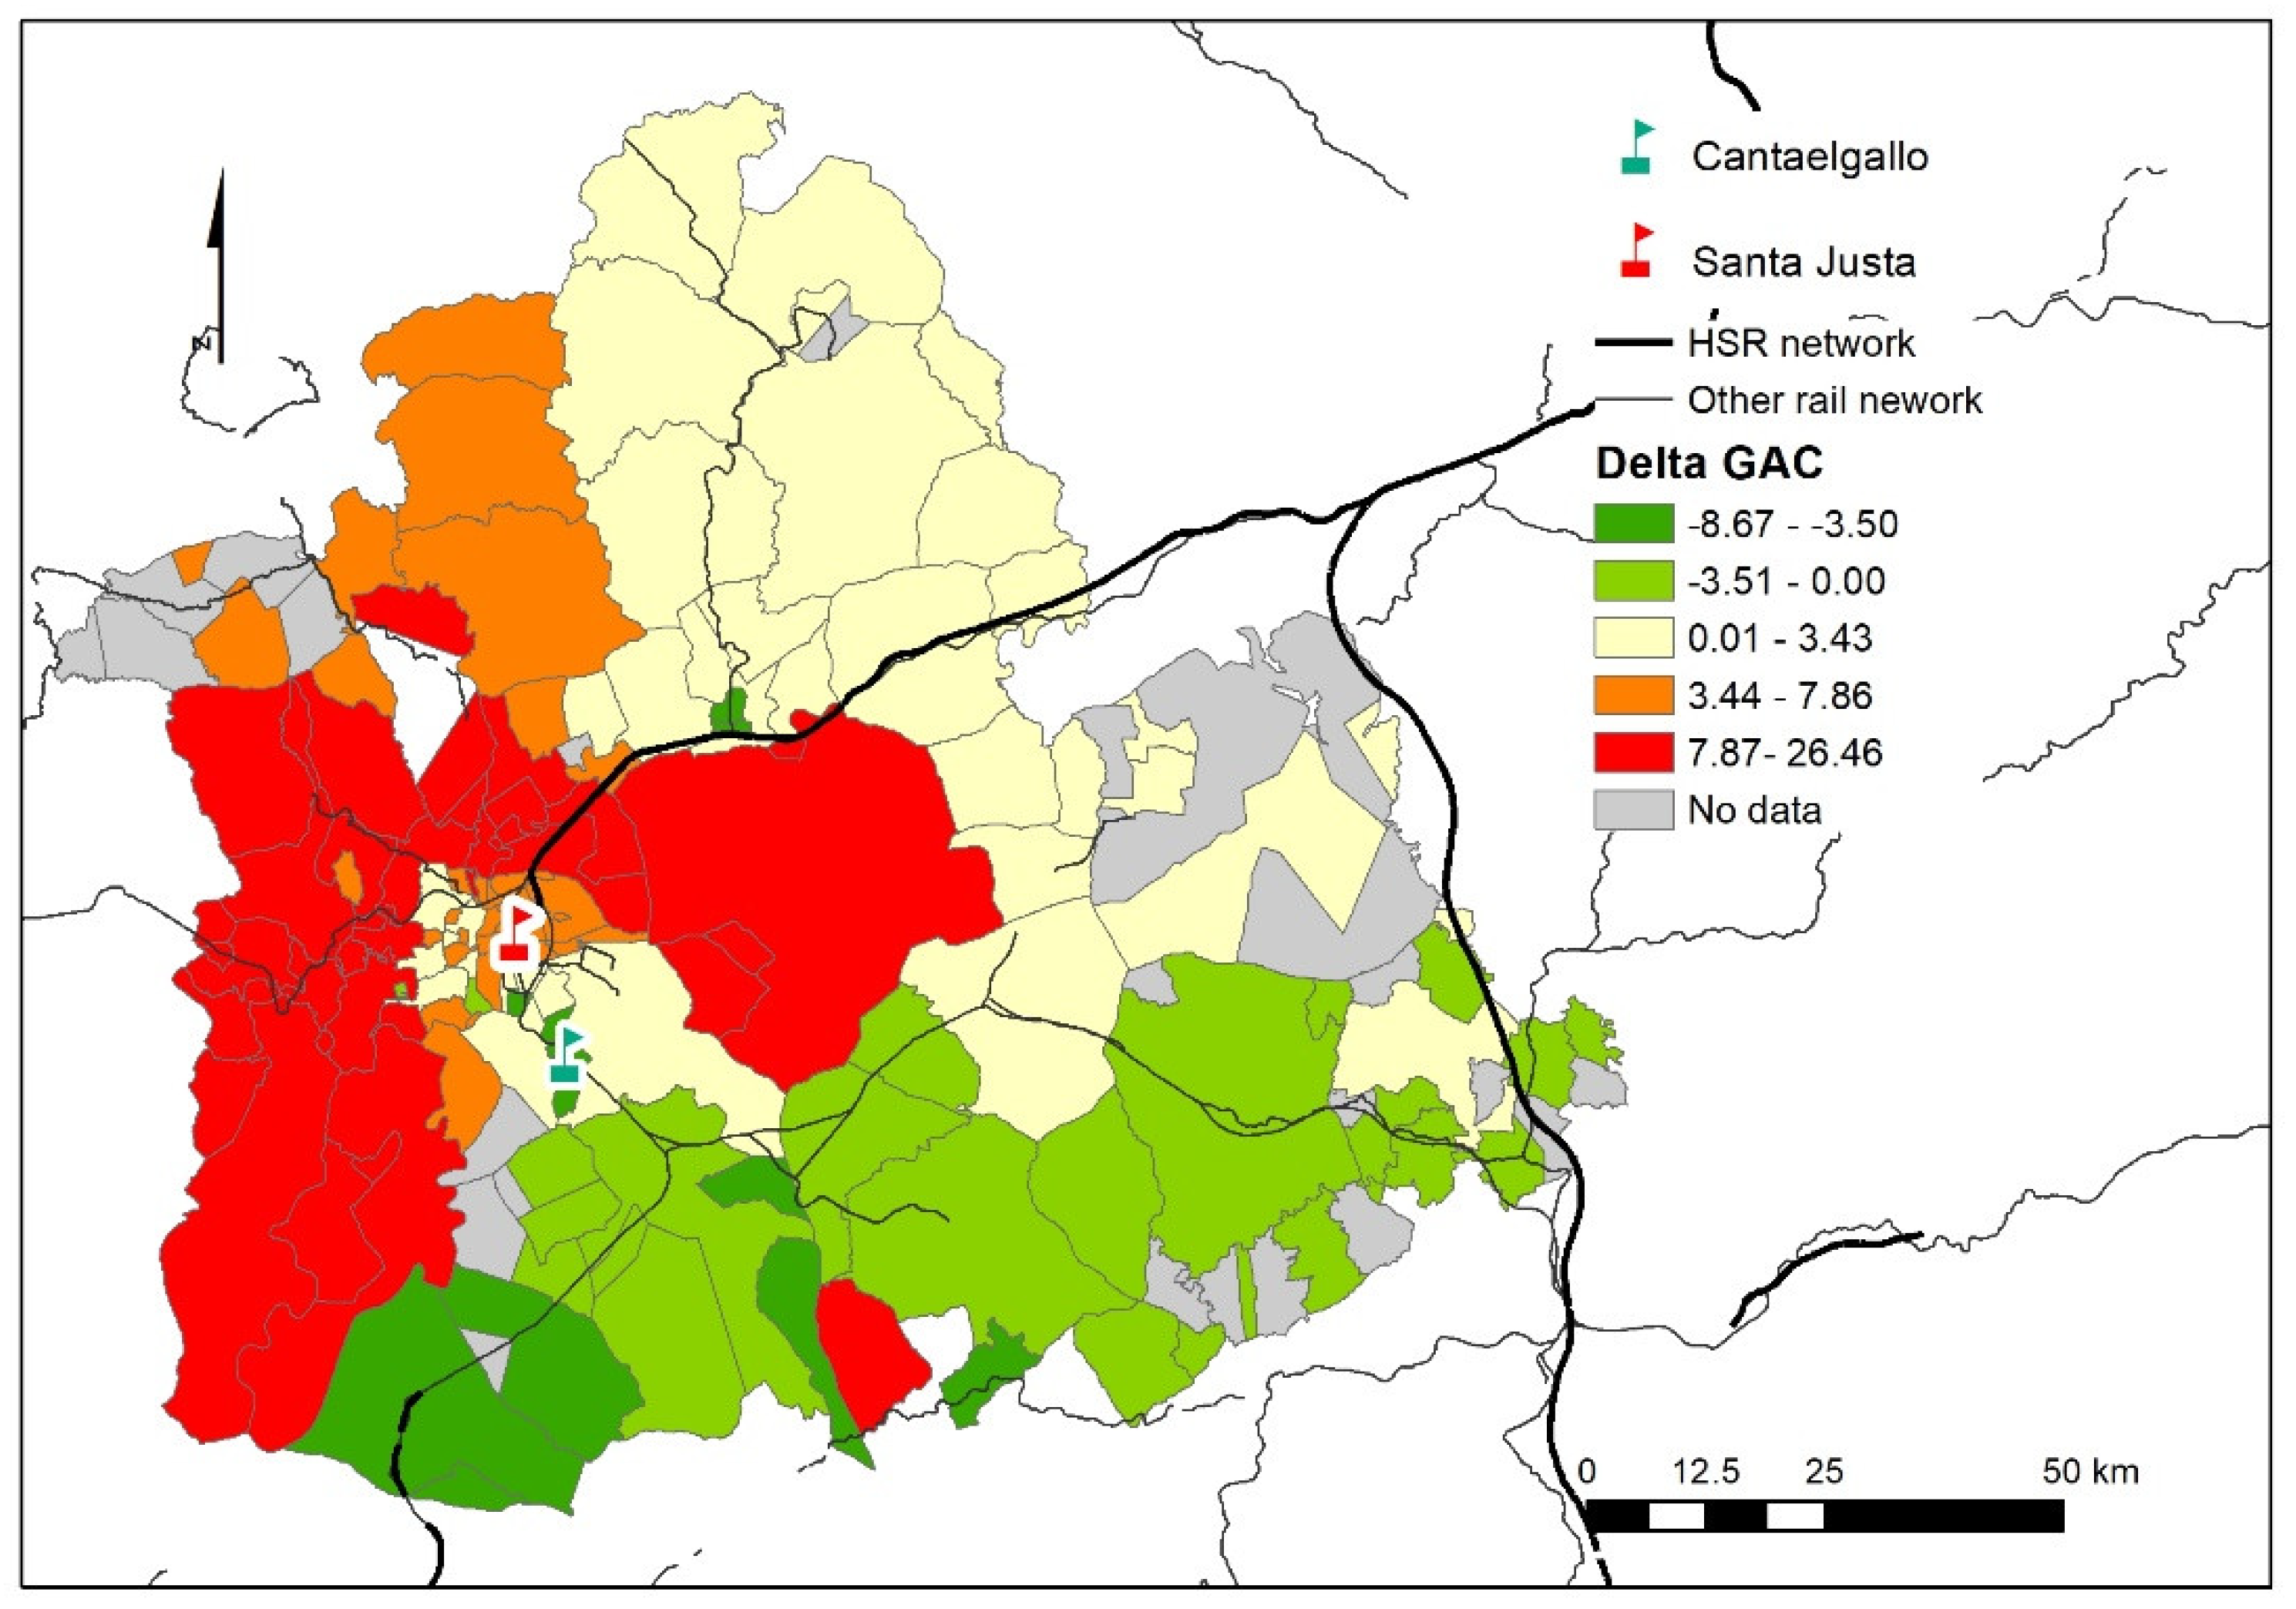
4.2.2. Zone Assignment to Stations and Full Alternative Scenario

The last step after the estimation of the GC of access to the alternative scenario is to assign passengers to one of the stations, either Santa Justa or Cantaelgallo. As explained previously, this was done according to an all-or-nothing procedure, based on the variation in GAC between both stations and the monetised extra travel time in HSR (15 min in this case). Figure 8 shows the Δ(GAC) per zone between Cantaelgallo and Santa Justa. Green zones have a lower total travel cost to Cantaelgallo implying that passengers in these zones would prefer to take a HSR train from that station than from Santa Justa, while passengers from yellowish and reddish areas would continue going to Santa Justa station. Overall, 34 zones have a lower GAC to Cantaelgallo and the remaining 101 to Santa Justa station. This is a considerable difference territorially (25% vs. 75% in number of zones), but the situation becomes more acute when accounting for the actual number of travellers: only 7.9% would access Cantaelgallo station (4880 passengers a month), whereas 92.1% would continue to go to Santa Justa station (56,857 passengers a month). As expected, passengers living in the south and south-eastern areas of the province of Seville are the ones who benefit from the new station. The extra travel time in HSR has a clear effect on this station assignment. If not considered, the number of zones accessing the new station would be 51 (38% of total zones) and the number of monthly passengers would be 9789 (15.9% of total passengers). Thus the estimated demand to the new station is reduced by half when the extra travel time is included, pointing to its importance in the joint analysis.
The GAC in the alternative scenario (Figure 9) is 8.08 EUR/trip, making it 3.4% cheaper for passengers (in GAC terms) than if they had only the Seville—Santa Justa station available. Logically, the value in this second scenario is lower than the first one, because the reduction in the generalised cost of access in the southern corridor (which has preferential access to Cantaelgallo) does not affect the GAC in the rest of the province, which is steadily reduced in each ring (Table 3). As expected, the maximum reduction in GAC occurs in ring C (4.7%), the location of the new station, but the GAC in the outer rings D and E is also reduced by 3.6% and 3.8% respectively. The territorial distribution therefore consists of two roughly concentric overlapping areas centred on the stations and expanding in a north-south direction.

4.3. Economic Analysis

The economic analysis consists of a basic economic CBA, and all monetary valuations are calculated in 2019 euros. The construction time for the new station and associated infrastructure has been estimated at two years, and costs have been equally divided. The residual value is estimated at 40% of the investment, since the straight-line depreciation method is used for a 30-year time horizon and a 50-year infrastructure lifetime. The benefits considered are the savings in access cost, which are obtained as the difference in GAC between the two scenarios. The total GAC savings are estimated at 15,921 EUR (2019 euros) in the reference month, hence 191,048 EUR/year. In addition, a demand ramp-up scheme has been assumed: an annual 2.5% increase in demand during the first ten years following the opening of Cantaelgallo station, and an annual 1% from then until the end of the project horizon.
Table 4 shows the results of the CBAs considering a one-million-euro incremental cost step, starting at two million euros and ending at ten million euros. The profitability threshold can be set at 3.8 million euro (ERR = 5%) although an investment cost of up to 5.4 million euros would have an ERR over 3%, a threshold sometimes considered for new Spanish HSR constructions. The results are consistent with current Spanish HSR construction costs. As a reference, Spanish medium-size HSR stations may cost as little as 1.5 million euros, provided the work consists of a station refurbishment and its adaptation to HSR standards [43], although the cost of a brand new station may add up to 15–20 million euros [44]. Cantaelgallo station may therefore be suitable in this situation provided that the station is upgraded from the current status (only for suburban rail) to the proposed HSR station.
Lastly, the Investment to Access Savings ratio (IAS) is used to perform a direct comparison between investment costs and GAC savings in the first year, which will help provide a reference value for quick assessments in the profitability of these projects. Table 4 shows this comparison for each level of investment. In the case of a second HSR station in a metropolitan suburb, the maximum IAS savings ratio is about 20.

5. Discussion and Conclusions

We successfully achieved the objective of this paper, which was to study the location advantages and feasibility of new secondary HSR stations using a GC-based analysis and to provide a new methodological framework that could be useful for planners and decision-makers. This framework is a valuable instrument in an exploratory and open analytical approach, and the application to the case study adds evidence-based geographically dimensioned information to prioritize actions for improving accessibility to HSR in the case study through new infrastructures. The literature has reported HSR evaluations based on other methods such as territorial accessibility, time savings and utility measurements [12,23]. In this paper we demonstrate the usefulness of CG approaches to support decision making on HSR station projects. The case study used to apply our rationale is a real example in the metropolitan area of Seville, Spain, which already has a central station and where a hypothetical peripheral station is added. The analysis was successfully performed by comparing two scenarios. The base scenario comprises the current access to Seville’s Santa Justa station, while the alternative scenario considers only the new Cantaelgallo station and the Santa Justa and Cantaelgallo stations together.
The case study is relevant because it examines a hypothetical situation for a mature HSR network such as the Spanish one. Spain does not have any case of station duplication in operation, although there are two separate stations in Madrid whose HSR connection is under construction, and a second HSR station is being built in Barcelona. In general, the existence of two stations on the same high-speed line in European metropolitan areas is infrequent. The most prominent examples of HSR station duplication are found in France and Italy. In French cities with duplicated HSR stations (e.g., Lyon and Paris), the Paris station is linked to a centre of attraction, namely Marne la Vallée-Chessy for Eurodisney, which makes it difficult to assess its impact on the accessibility by residents. In the other cases, the peripheral station has a higher percentage of passenger access by private vehicle and taxi than the central one [45], and a significant increase in the number of total passengers occurred after the construction of the second station. For example, Massy (in southern Paris) had three million passengers in 2017 [46]. In Italy, the considerable number of cities with duplicated HSR stations illustrates how the competition between two operators on a high-speed network can generate innovative initiatives to improve the overall service quality [47], including access by car to the peripheral stations and low prices for parking or car rental when purchased together with the rail ticket. There is therefore room to discuss the suitability of secondary HSR stations within the European context.
It has been demonstrated with this methodology that very interesting results can be achieved using generalised station access cost functions depending on the direct cost and the monetary value of time, when considering direct costs by mode of access, distance and the parking/taxi/PT drop-off infrastructure and the value of time depending on the travel time and trip purpose. It also provides a basis with which to assess the suitability of a station in economic terms. The results of the CG assessment serve as input for the subsequent CBA economic assessment, which is recommended by the Transportation Research Board and the European Commission [42,48] as a means of evaluating infrastructure projects. The use of CG allows the simultaneous monetization of the aforementioned costs of accessing the station by different modes, and the travel time and trip purpose, thereby solving some of the problems with CBA reported in the literature [32].
The application of the proposed methodology to the case study produces a slight reduction in the overall generalised cost, so the new station, Cantaelgallo, would only attract a limited number of passengers (7.9% of travellers dwelling in the province) from Santa Justa station. This would therefore remain the main gateway to and from Seville, even if Cantalgallo station were able to provide a higher turnover of parking spaces and relatively uncongested access routes. Despite this outcome, the peripheral station could be suitable with an investment of under 3.8 million EUR, equivalent to about 20 times the generalised cost savings in the base year.
It was to be expected that Santa Justa would remain the main station in Seville, given that the city and the Aljarafe area (west of the metropolitan area) reach 55% of the population and have better accessibility to the Santa Justa station, while residents in the south and southeast would opt for Cantaelgallo station. Seville city centre is also considered an important European tourist destination, with both monuments and tourist accommodation concentrated in its historic district [49]; it is also a large hub for highly skilled foreigners working in the education, research and culture sectors [50]. These two groups would clearly prefer the central station when traveling by rail from/to Seville. In addition, traffic congestion occurs only in the morning peak hour, and is otherwise quite homogeneous all day long [51]. For this reason, the study only considers residents in the area, who would be the group of users to benefit most from the construction of a peripheral station.
It should be noted that the study does not consider mobility constraints arising from COVID-19, or shifts in the access modal share or HSR demand, due to the authors’ belief that long-distance ridership will return to its previous state in the next few years. The preliminary evidence on post-COVID-19 mobility in Spain does not appear to suggest a massive shift from urban PT to individual or shared mobility solutions [52], so station access patterns are not expected to change. Although some of the assumptions we have adopted can be considered as methodological limitations, they can also be understood as opportunities for further research. The first limitation is that we could not use data from ad-hoc stated preference surveys on the perceptions of the new station. The necessary data for modal share and adjustment per zone in the Cantaelgallo station were adapted from the data obtained for the Seville-Santa Justa station, assuming a similar behaviour. Further analysis could include other factors in the generalised cost function such as comfort (luggage, etc.), information received or the perception of the quality of the access mode, which could be obtained from ad-hoc surveys of current and potential passengers [53]. In fact, the quality of the access and egress can affect the overall door-to-door journey as much as the long-distance rail stage [54]. Another limitation is that it is assumed in the economic assessment that operation and maintenance costs will be completely covered by the ticket revenues. This issue could be considered in further research combining the station location and the operative tactics for HSR projects [55,56]. Lastly, the territorial scope of this study goes beyond the metropolitan area, which could produce some distortion in the GAC assessment given the larger catchment area. To overcome this issue, zonal GAC has been weighted by the current number of trips, which lessens the effect of these outer areas on overall GAC, and we recommend further studies to look carefully at access effects generated by the metropolitan structure and scope.
This paper represents an interesting contribution to the socio-economic analysis of infrastructures and provides a useful framework for transport planners for assessing secondary stations in urban peripheries based on CG. We believe that it provides a better understanding of the scope of investment in new HSR stations aimed at promoting passenger rail transport, which is being fostered by international institutions such as the European Commission in its new Smart and Sustainable Mobility Strategy [57].

Author Contributions

Conceptualization, C.R. and C.Z.; methodology, C.R., C.Z., B.M. and E.O.; software, C.R., B.M. and E.O.; validation, C.R. and E.O.; formal analysis, C.R., B.M. and E.O.; investigation, C.R. and C.Z.; resources, C.R., C.Z., B.M. and E.O.; data curation, C.R., B.M. and E.O.; writing—C.R., B.M. and E.O.; writing—review and editing, C.R., B.M. and C.Z.; visualization, C.R. and B.M.; supervision, C.Z.; project administration, C.Z.; funding acquisition, C.Z. All authors have read and agreed to the published version of the manuscript.

Funding

This research did not receive any specific grant from funding agencies in the public, commercial, or not-for-profit sectors.

Data Availability Statement

Not applicable.

Acknowledgments

We the authors are thankful to Renfe Operadora for the provision of the needed data and guidance on setting the case study. We also appreciate the contribution from students Jorge Villa, Juan Gómez-Mangada and Ágata de Isidro in the early stages of this study.

Conflicts of Interest

The authors declare no conflict of interest.

References

  1. European Commission (EC). Roadmap to a Single European Transport Area—Towards a Competitive and Resource Efficient Transport System; White Paper, COM(2011) 144 Final; European Commission: Brussels, Belgium, 2011.
  2. European Court of Auditors. Special Report Nº 19/2018: A European High-Speed Rail Network: Not a Reality but an Ineffective Patchwork; European Union: Luxemburg, 2018.
  3. Beria, P.; Grimaldi, R.; Albalate, D.; Bel, G. Delusions of success: Costs and demand of high-speed rail in Italy and Spain. Transp. Policy 2018, 68, 63–79. [Google Scholar] [CrossRef]
  4. Garmendia, M.; Ribalaygua, C.; Ureña, J. High speed rail: Implication for cities. Cities 2012, 29, 26–31. [Google Scholar] [CrossRef]
  5. Givoni, M. Development and Impact of the Modern High-Speed Train: A Review. Transp. Rev. 2006, 26, 593–611. [Google Scholar] [CrossRef]
  6. Jacobs-Crisioni, C.; Silva, F.E.; Lavalle, C.; Baranzelli, C.; Barbosa, A.; Perpiña Castillo, C. Accessibility and territorial cohesion in a case of transport infrastructure improvements with changing population distributions. Eur. Transp. Res. Rev. 2016, 8, 9. [Google Scholar] [CrossRef] [Green Version]
  7. Ortega, E.; López, E.; Monzón, A. Territorial cohesion impacts of high-speed rail at different planning levels. J. Transp. Geogr. 2012, 24, 130–141. [Google Scholar] [CrossRef]
  8. Brons, M.; Givoni, M.; Rietveld, P. Access to railway stations and its potential in increasing rail use. Transp. Res. Part A Policy Pract. 2009, 43, 136–149. [Google Scholar] [CrossRef]
  9. Givoni, M.; Banister, D. Speed: The less important element of the High-Speed Train. J. Transp. Geogr. 2012, 22, 306–307. [Google Scholar] [CrossRef]
  10. Sung, H.; Choi, K.; Lee, S.; Cheon, S. Exploring the impacts of land use by service coverage and station-level accessibility on rail transit ridership. J. Transp. Geogr. 2014, 36, 134–140. [Google Scholar] [CrossRef]
  11. Monzón, A.; Ortega, E.; López, E. Efficiency and spatial equity impacts of high-speed rail extensions in urban areas. Cities 2013, 30, 18–30. [Google Scholar] [CrossRef] [Green Version]
  12. Moyano, A.; Moya-Gómez, B.; Gutiérrez, J. Access and egress times to high-speed rail stations: A spatiotemporal accessibility analysis. J. Transp. Geogr. 2018, 73, 84–93. [Google Scholar] [CrossRef]
  13. Guirao, B.; Campa, J. The construction of a HSR network using a ranking methodology to prioritise corridors. Land Use Policy 2014, 38, 290–299. [Google Scholar] [CrossRef]
  14. Reggiani, A. Accessibility, connectivity and resilience in complex networks. In Accessibility and Transport Planning; Geurs, K., Krizek, K., Reggiani, A., Eds.; Edward Elgar: Chelttenham, UK, 2012. [Google Scholar]
  15. Monzón, A.; Ortega, E.; López, E. Influence of the First and Last Mile on HSR Accessibility Levels. In Accessibility, Equity and Efficiency; Geurs, K., Patuelli, R., Ponce Dentinho, T., Eds.; Edward Elgar Publishing: Chelttenham, UK, 2016; pp. 125–143. [Google Scholar]
  16. Sung, H.; Oh, J.-T. Transit-oriented development in a high-density city: Identifying its association with transit ridership in Seoul, Korea. Cities 2011, 28, 70–82. [Google Scholar] [CrossRef]
  17. Rossetti, S.; Tiboni, M.; Vetturi, D.; Zazzi, M.; Caselli, B. Measuring Pedestrian Accessibility to Public Transport in Urban Areas: A GIS-based Discretisation Approach. Eur. Transp. Trasp. Eur. 2020, 76, 1–12. [Google Scholar]
  18. Loo, B.P.Y.; Chen, C.; Chan, E.T.H. Rail-based transit-oriented development: Lessons from New York City and Hong Kong. Landsc. Urban Plan. 2010, 97, 202–212. [Google Scholar] [CrossRef]
  19. Keijer, M.J.N.; Rietveld, P. How do people get to the railway station? The Dutch experience. Transp. Plan. Technol. 2000, 23, 215–235. [Google Scholar] [CrossRef] [Green Version]
  20. Vickerman, R. High-speed rail and regional development: The case of intermediate stations. J. Transp. Geogr. 2015, 42, 157–165. [Google Scholar] [CrossRef]
  21. Martín, J.C.; Román, C.; García-Palomares, J.C.; Gutiérrez, J. Spatial analysis of the competitiveness of the high-speed train and air transport: The role of access to terminals in the Madrid–Barcelona corridor. Transp. Res. Part A Policy Pract. 2014, 69, 392–408. [Google Scholar] [CrossRef] [Green Version]
  22. Sánchez-Mateos, H.S.M.; Givoni, M. The accessibility impact of a new High-Speed Rail line in the UK—A preliminary analysis of winners and losers. J. Transp. Geogr. 2012, 25, 105–114. [Google Scholar] [CrossRef]
  23. Mohino, I.; Loukaitou-Sideris, A.; Ureña, J. Impacts of High-Speed Rail on Metropolitan Integration: An Examination of London, Madrid and Paris. Int. Plan. Stud. 2014, 19, 306–334. [Google Scholar] [CrossRef]
  24. Givoni, M.; Rietveld, P. Do cities deserve more railway stations? The choice of a departure railway station in a multiple-station region. J. Transp. Geogr. 2014, 36, 89–97. [Google Scholar]
  25. Grey, A. The Generalised Cost Dilemma. Transportation 1978, 7, 261–280. [Google Scholar] [CrossRef]
  26. Casello, J.M. Transit competitiveness in polycentric metropolitan regions. Transp. Res. Part A 2007, 41, 19–40. [Google Scholar] [CrossRef]
  27. Fadaei, M.; Cats, O. Evaluating the impacts and benefits of public transport design and operational measures. Transp. Policy 2016, 48, 105–116. [Google Scholar] [CrossRef] [Green Version]
  28. La Paix, L.; Geurs, K. Integration of unobserved effects in generalised transport access costs of cycling to railway stations. Eur. J. Transp. Infrastruct. Res. 2016, 16, 385–405. [Google Scholar]
  29. Mackie, P.; Worsley, T.; Eliasson, J. Transport appraisal revisited. Res. Transp. Econ. 2014, 47, 3–18. [Google Scholar] [CrossRef]
  30. Vigren, A.; Ljungberg, A. Public Transport Authorities’ use of Cost-Benefit Analysis in practice. Res. Transp. Econ. 2018, 69, 560–567. [Google Scholar] [CrossRef] [Green Version]
  31. Bardal, K.G. Contradictory outcomes of cost-benefit analyses—Findings from Norwegian public-investment projects. Res. Transp. Econ. 2020, 82, 100874. [Google Scholar] [CrossRef]
  32. Martens, K.; Di Ciommo, F. Travel time savings, accessibility gains and equity effects in cost-benefit analysis. Transp. Rev. 2017, 37, 152–169. [Google Scholar] [CrossRef]
  33. Zhang, W.; Nian, P.; Lyu, G. A multimodal approach to assessing accessibility of a high-speed railway station. J. Transp. Geogr. 2016, 54, 91–101. [Google Scholar] [CrossRef]
  34. Observatorio de la Movilidad Metropolitana (OMM). Informe OMM-2018. [2018 Annual Report]. 2020. Available online: http://www.observatoriomovilidad.es/images/stories/07_jornadas/17_jornada_17_online/INFORME_FINAL_WEB.pdf (accessed on 12 April 2021).
  35. AENA. Annual Report 2019. 2021. Available online: http://www.aena.es/csee/ccurl/174/519/00.Definitivo_2019.pdf (accessed on 12 April 2021).
  36. Observatorio del Ferrocarril en España (OFE). Informe 2019 del Observatorio del Ferrocarril en España [Spanish Railway Observatory—2019 Annual Report]. 2020. Available online: https://www.mitma.gob.es/recursos_mfom/comodin/recursos/ofe_2019_mar2021.pdf (accessed on 12 April 2021).
  37. Generalitat de Catalunya. Manual del Sistema d’avaluació d’inversions en transport [Transportation Investment Appraisal System Handbook]. 2020. Available online: https://territori.gencat.cat/web/.content/home/03_infraestructures_i_mobilitat/01_carreteres/SAIT/manual-SAIT-v2020-01.pdf (accessed on 12 April 2021).
  38. Wang, F.; Xu, Y. Estimating O–D travel time matrix by Google Maps API: Implementation, advantages, and implications. Ann. GIS 2011, 17, 199–209. [Google Scholar] [CrossRef]
  39. Bouscasse, H.; de Lapparent, M. Perceived comfort and values of travel time savings in the Rhône-Alpes Region. Transp. Res. Part A Policy Pract. 2019, 124, 370–387. [Google Scholar] [CrossRef]
  40. Wardman, M.; Chintakayala, V.; de Jong, G. Values of travel time in Europe: Review and meta-analysis. Transp. Res. Part A Policy Pract. 2016, 94, 93–111. [Google Scholar] [CrossRef]
  41. García-Martínez, A.; Cascajo, R.; Jara-Díaz, S.R.; Chowdhury, S.; Monzon, A. Transfer penalties in multimodal public transport networks. Transp. Res. Part A Policy Pract. 2018, 114, 52–66. [Google Scholar] [CrossRef]
  42. European Commission (EC). Guide to Cost-Benefit Analysis of Investment Projects. Economic appraisal tool for Cohesion Policy 2014–2020; Publications Office of the European Union: Luxembourg, 2014. [CrossRef]
  43. Ministerio de Fomento. Fomento Somete a Información Pública el Proyecto de la Nueva Estación de alta Velocidad de Villena (Alicante) [Press Release]. 2011. Available online: https://www.mitma.gob.es/recursos_mfom/11021902.pdf (accessed on 12 April 2021).
  44. Ministerio de Fomento. Fomento Adjudica el Proyecto de Integración del Ferrocarril en Palencia. [Press Release]. 2011. Available online: https://www.fomento.gob.es/NR/rdonlyres/657957E7-F5D5-4ABF-B1AF-35C7E3EEAD2A/106920/11102502.pdf (accessed on 12 April 2021).
  45. Observatoire de la Mobilité en Île-de-France (OMNIL). La Fréquentation des Grandes Gares Franciliennes. [Ridership at Major Parisian Railway Stations]. 2015. Available online: http://www.driea.ile-de-france.developpement-durable.gouv.fr/IMG/pdf/La_frequentation_des_grandes_gares_parisiennes.pdf (accessed on 12 April 2021).
  46. SNCF. Fréquentation en Gares [Ridership at Stations] [Database]. 2021. Available online: https://ressources.data.sncf.com/explore/dataset/frequentation-gares (accessed on 12 April 2021).
  47. Desmaris, C.; Croccolo, F. The HSR competition in Italy: How are the regulatory design and practices concerned? Res. Transp. Econ. 2018, 69, 290–299. [Google Scholar] [CrossRef] [Green Version]
  48. Transit Cooperative Research Program (TCRP). Report 78: Estimating the Benefits and Cost of Public Transit Projects: A Guidebook for Practitioners; Transportation Research Board of the National Academies: Washington, DC, USA, 2002. [Google Scholar]
  49. Jover, J.; Díaz-Parra, I. Gentrification, transnational gentrification and touristification in Seville, Spain. Urban Stud. 2020, 57, 3044–3059. [Google Scholar] [CrossRef]
  50. Cachia, R.; Maya Jariego, I. Mobility types, transnational ties and personal networks in four highly skilled immigrant communities in Seville (Spain). Soc. Netw. 2018, 53, 111–124. [Google Scholar] [CrossRef] [Green Version]
  51. Christodoulou, A.; Christidis, P. Evaluating congestion in urban areas: The case of Seville. Res. Transp. Bus. Manag. 2020, 39, 100577. [Google Scholar] [CrossRef]
  52. Awad-Núñez, S.; Julio, R.; Gomez, J.; Moya-Gómez, B.; Sastre, J. Post-COVID-19 travel behaviour patterns: Impact on the willingness to pay of users of public transport and shared mobility services in Spain. Eur. Transp. Res. Rev. 2021, 13, 20. [Google Scholar] [CrossRef]
  53. Young, M.; Blainey, S. Railway station choice modelling: A review of methods and evidence. Transp. Rev. 2018, 38, 232–251. [Google Scholar] [CrossRef] [Green Version]
  54. Zhen, F.; Cao, X.; Tang, J. The role of access and egress in passenger overall satisfaction with high speed rail. Transportation 2019, 46, 2137–2150. [Google Scholar] [CrossRef]
  55. Cascetta, E.; Coppola, P. Assessment of schedule-based and frequency-based assignment models for strategic and operational planning of high-speed rail services. Transp. Res. Part A 2016, 84, 93–108. [Google Scholar] [CrossRef]
  56. Repolho, H.M.; Church, R.L.; Antunes, A.P. Optimizing station location and fleet composition for a high-speed rail line. Transp. Res. Part E 2016, 93, 437–452. [Google Scholar] [CrossRef]
  57. European Commission (EC). Sustainable and Smart Mobility Strategy—Putting European Transport on Track for the Future; COM(2020) 789 Final; European Commission: Brussels, Belgium, 2020.
Figure 1. Map showing the location of the main transportation network and the classification of the PT zone.
Sustainability 13 12286 g001
Figure 2. Total number of trips to Santa Justa station in October 2019 (current situation).
Sustainability 13 12286 g002
Figure 3. Methodological approach.
Sustainability 13 12286 g003
Figure 4. Zoning by postcodes: polygons and centroids.
Sustainability 13 12286 g004
Figure 5. Modal share adjustment for walking-reachable zones in the city of Seville.
Sustainability 13 12286 g005
Figure 6. Average GAC (euro/trip) per zone to Santa Justa station (base scenario).
Sustainability 13 12286 g006
Figure 7. Average GAC (euro/trip) per zone to the Cantaelgallo station.
Sustainability 13 12286 g007
Figure 8. Value of Δ(GAC) per zone. The reader is referred to the web version of this paper for the colour representation of this figure.
Sustainability 13 12286 g008
Figure 9. Average GAC to HSR stations (alternative scenario).
Sustainability 13 12286 g009
Table 1. Direct costs (euros) based on trip distance d (km) and time parameters (min) for each mode.
ModeDirect Cost (C)tW1tW2tP
Walking0000
Taxi 1.37 + 0.94d520
Car (parking lot)0.29d + 22522
Car (free parking)0.29d555
Car (as passenger)0500
Public transportPTA fares 1Google API 220
1 PTA fares obtained from the official PTA website (in Spanish): http://www.ctas.es/tarifa.php; 2 Average of the walking times for the three calculations with the Google API.
Table 2. Trip purposes and average value of time for each purpose.
Purpose% TravellersValue of Time (€/h)
Work or study23.2%7.48
Leisure or tourism38.6%5.10
Shopping0.4%6.40
Personal business (e.g., medical)5.6%10.83
Multipurpose32.2%7.45
Table 3. GAC (euro/trip) per ring in each station and scenario.
RingPassengers (% of Total)Seville—Santa Justa (Base Scenario)CantaelgalloBoth Stations (Alternative Scenario)
A64.2%6.269.726.04
B12.9%14.3215.6214.29
C15.7%10.2717.409.78
D4.0%8.7714.868.46
E3.2%39.6437.8938.15
Province average-8.3711.488.08
Table 4. Results of the CBA assessment.
Total Investment (M€)ERR (%)NPV (M€)IAS Ratio
210.3%1.5210.5
36.7%0.6915.7
44.7%−0.1520.9
53.4%−0.9926.2
62.5%−1.8331.4
71.8%−2.6636.6
81.2%−3.5041.9
90.8%−4.3447.1
100.4%−5.1752.3
Publisher’s Note: MDPI stays neutral with regard to jurisdictional claims in published maps and institutional affiliations.

