
The Use of Selected Landscape Metrics to Evaluate the Transformation of the Rural Landscape as a Result of the Development of the Mining Function—A Case Study of the Puchaczów Commune


Abstract
1. Introduction
2. Materials and Methods
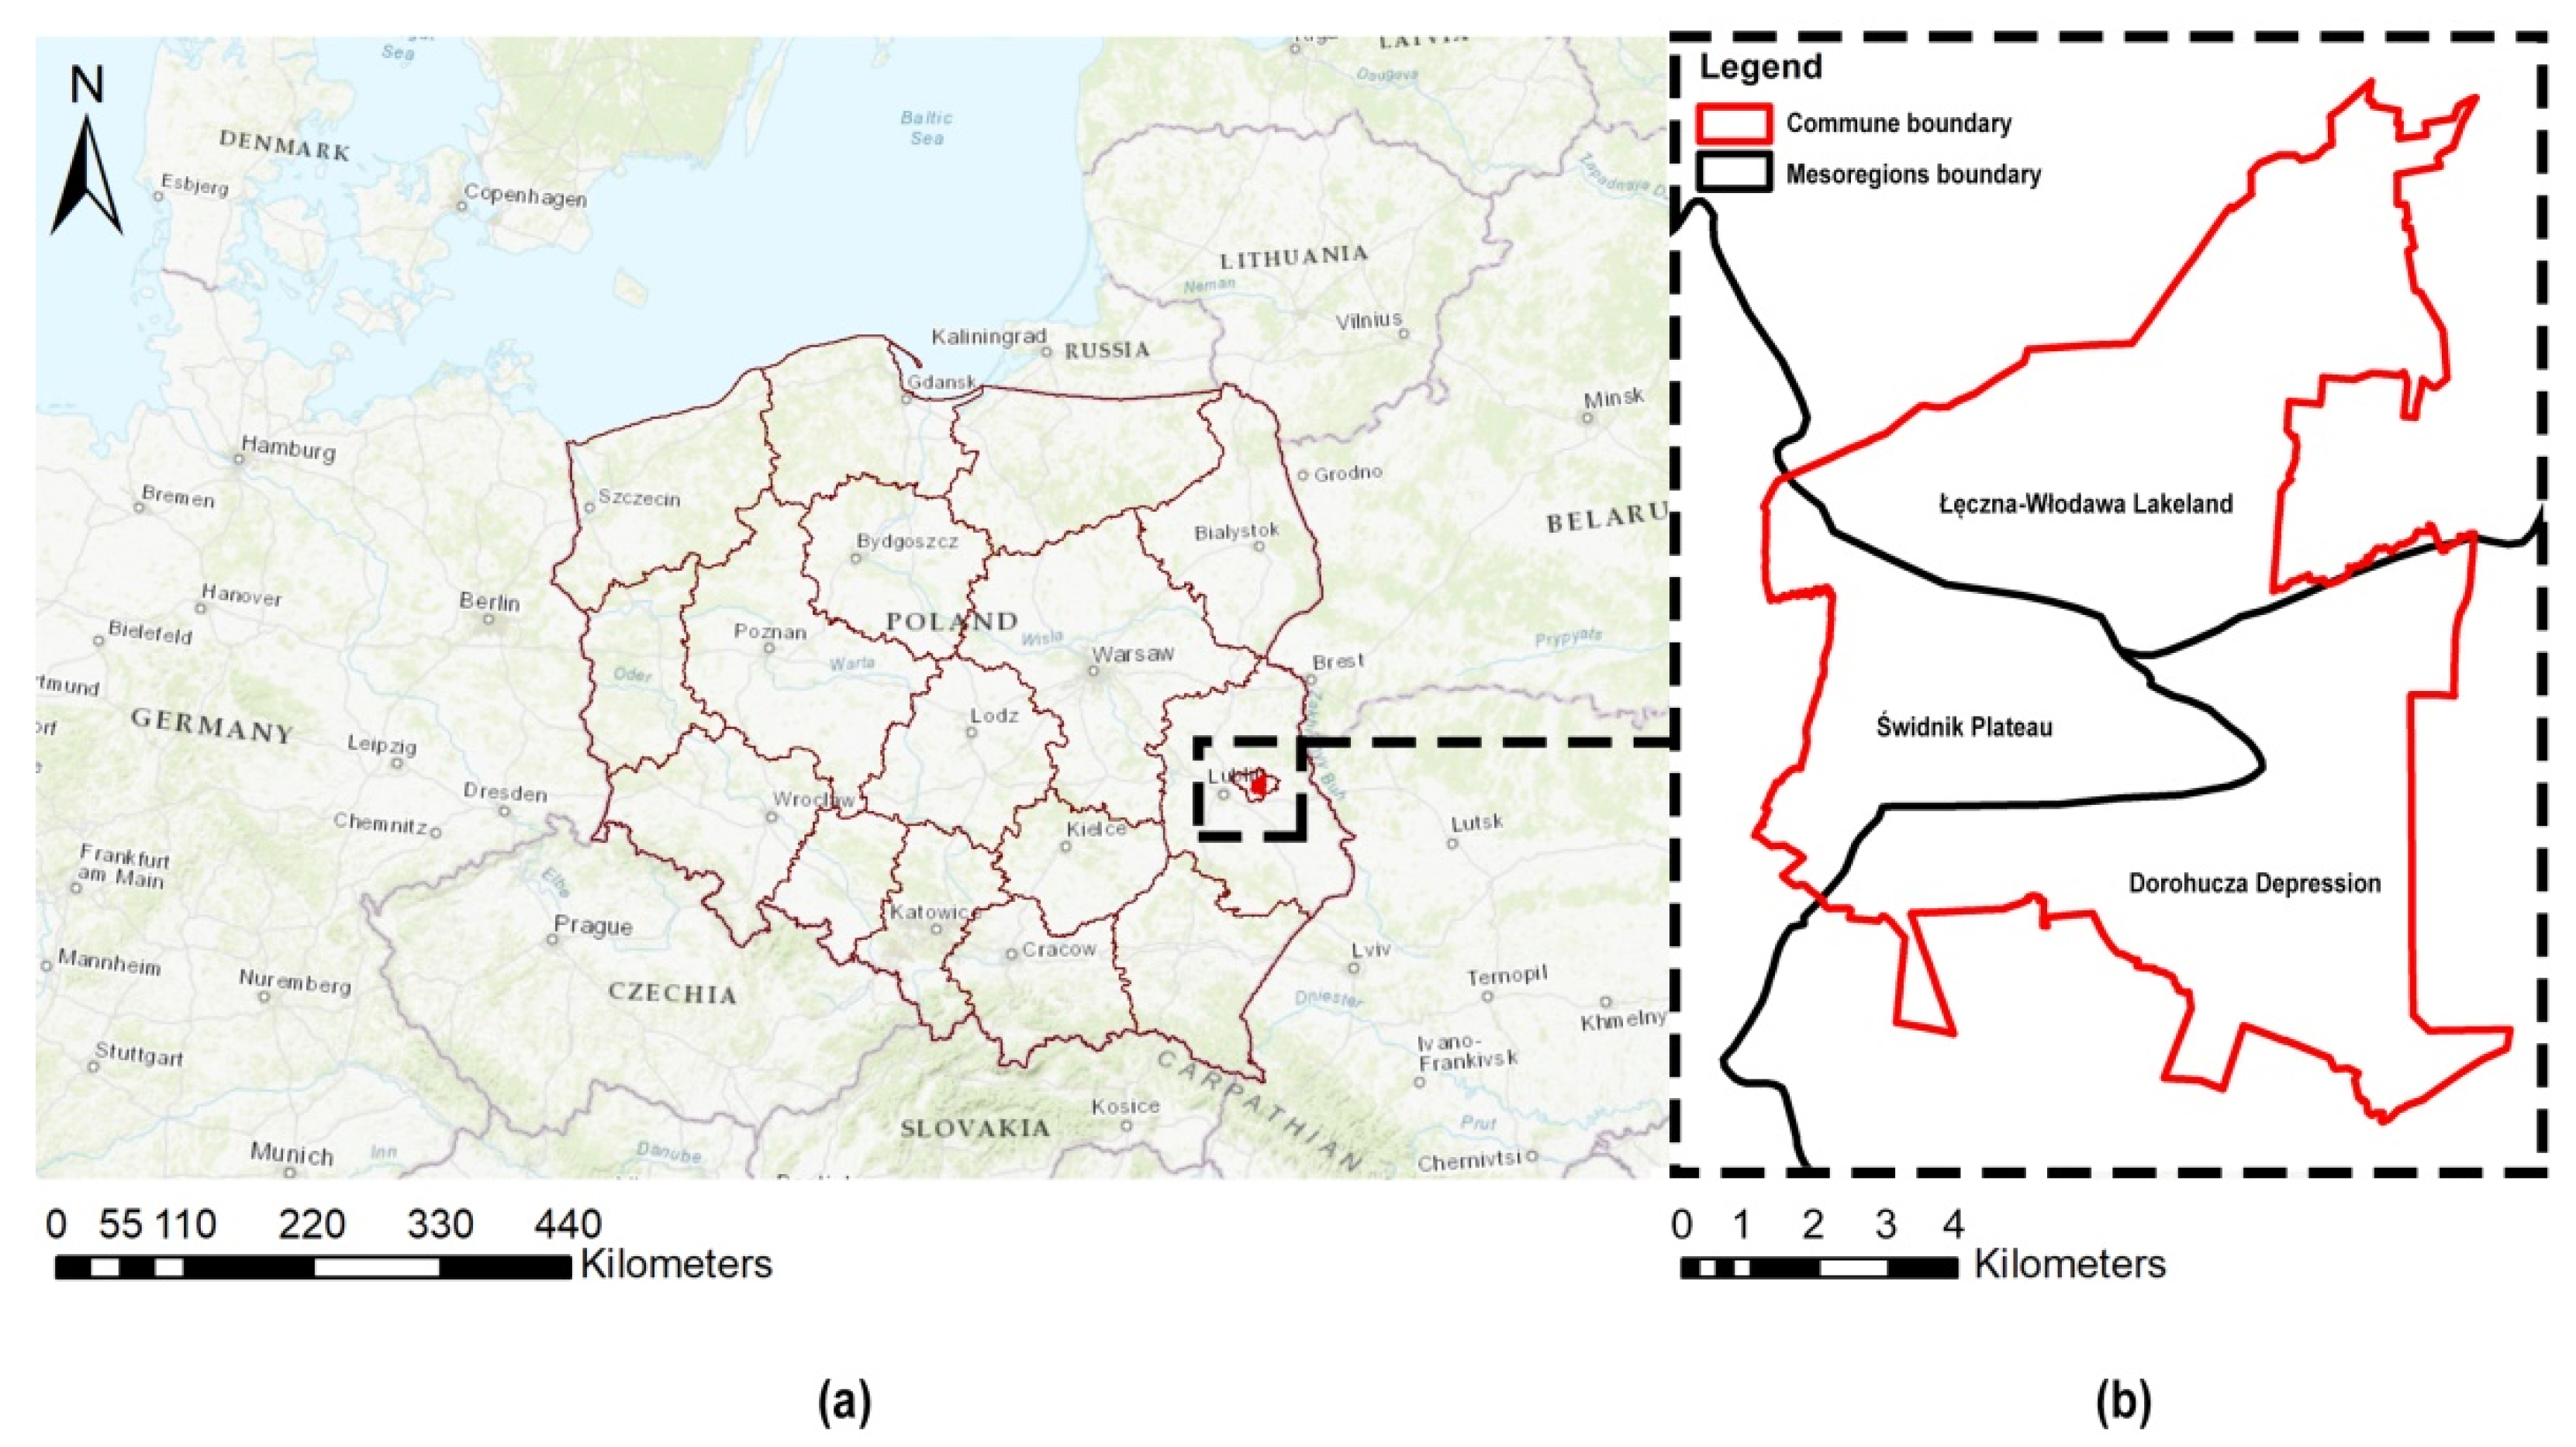
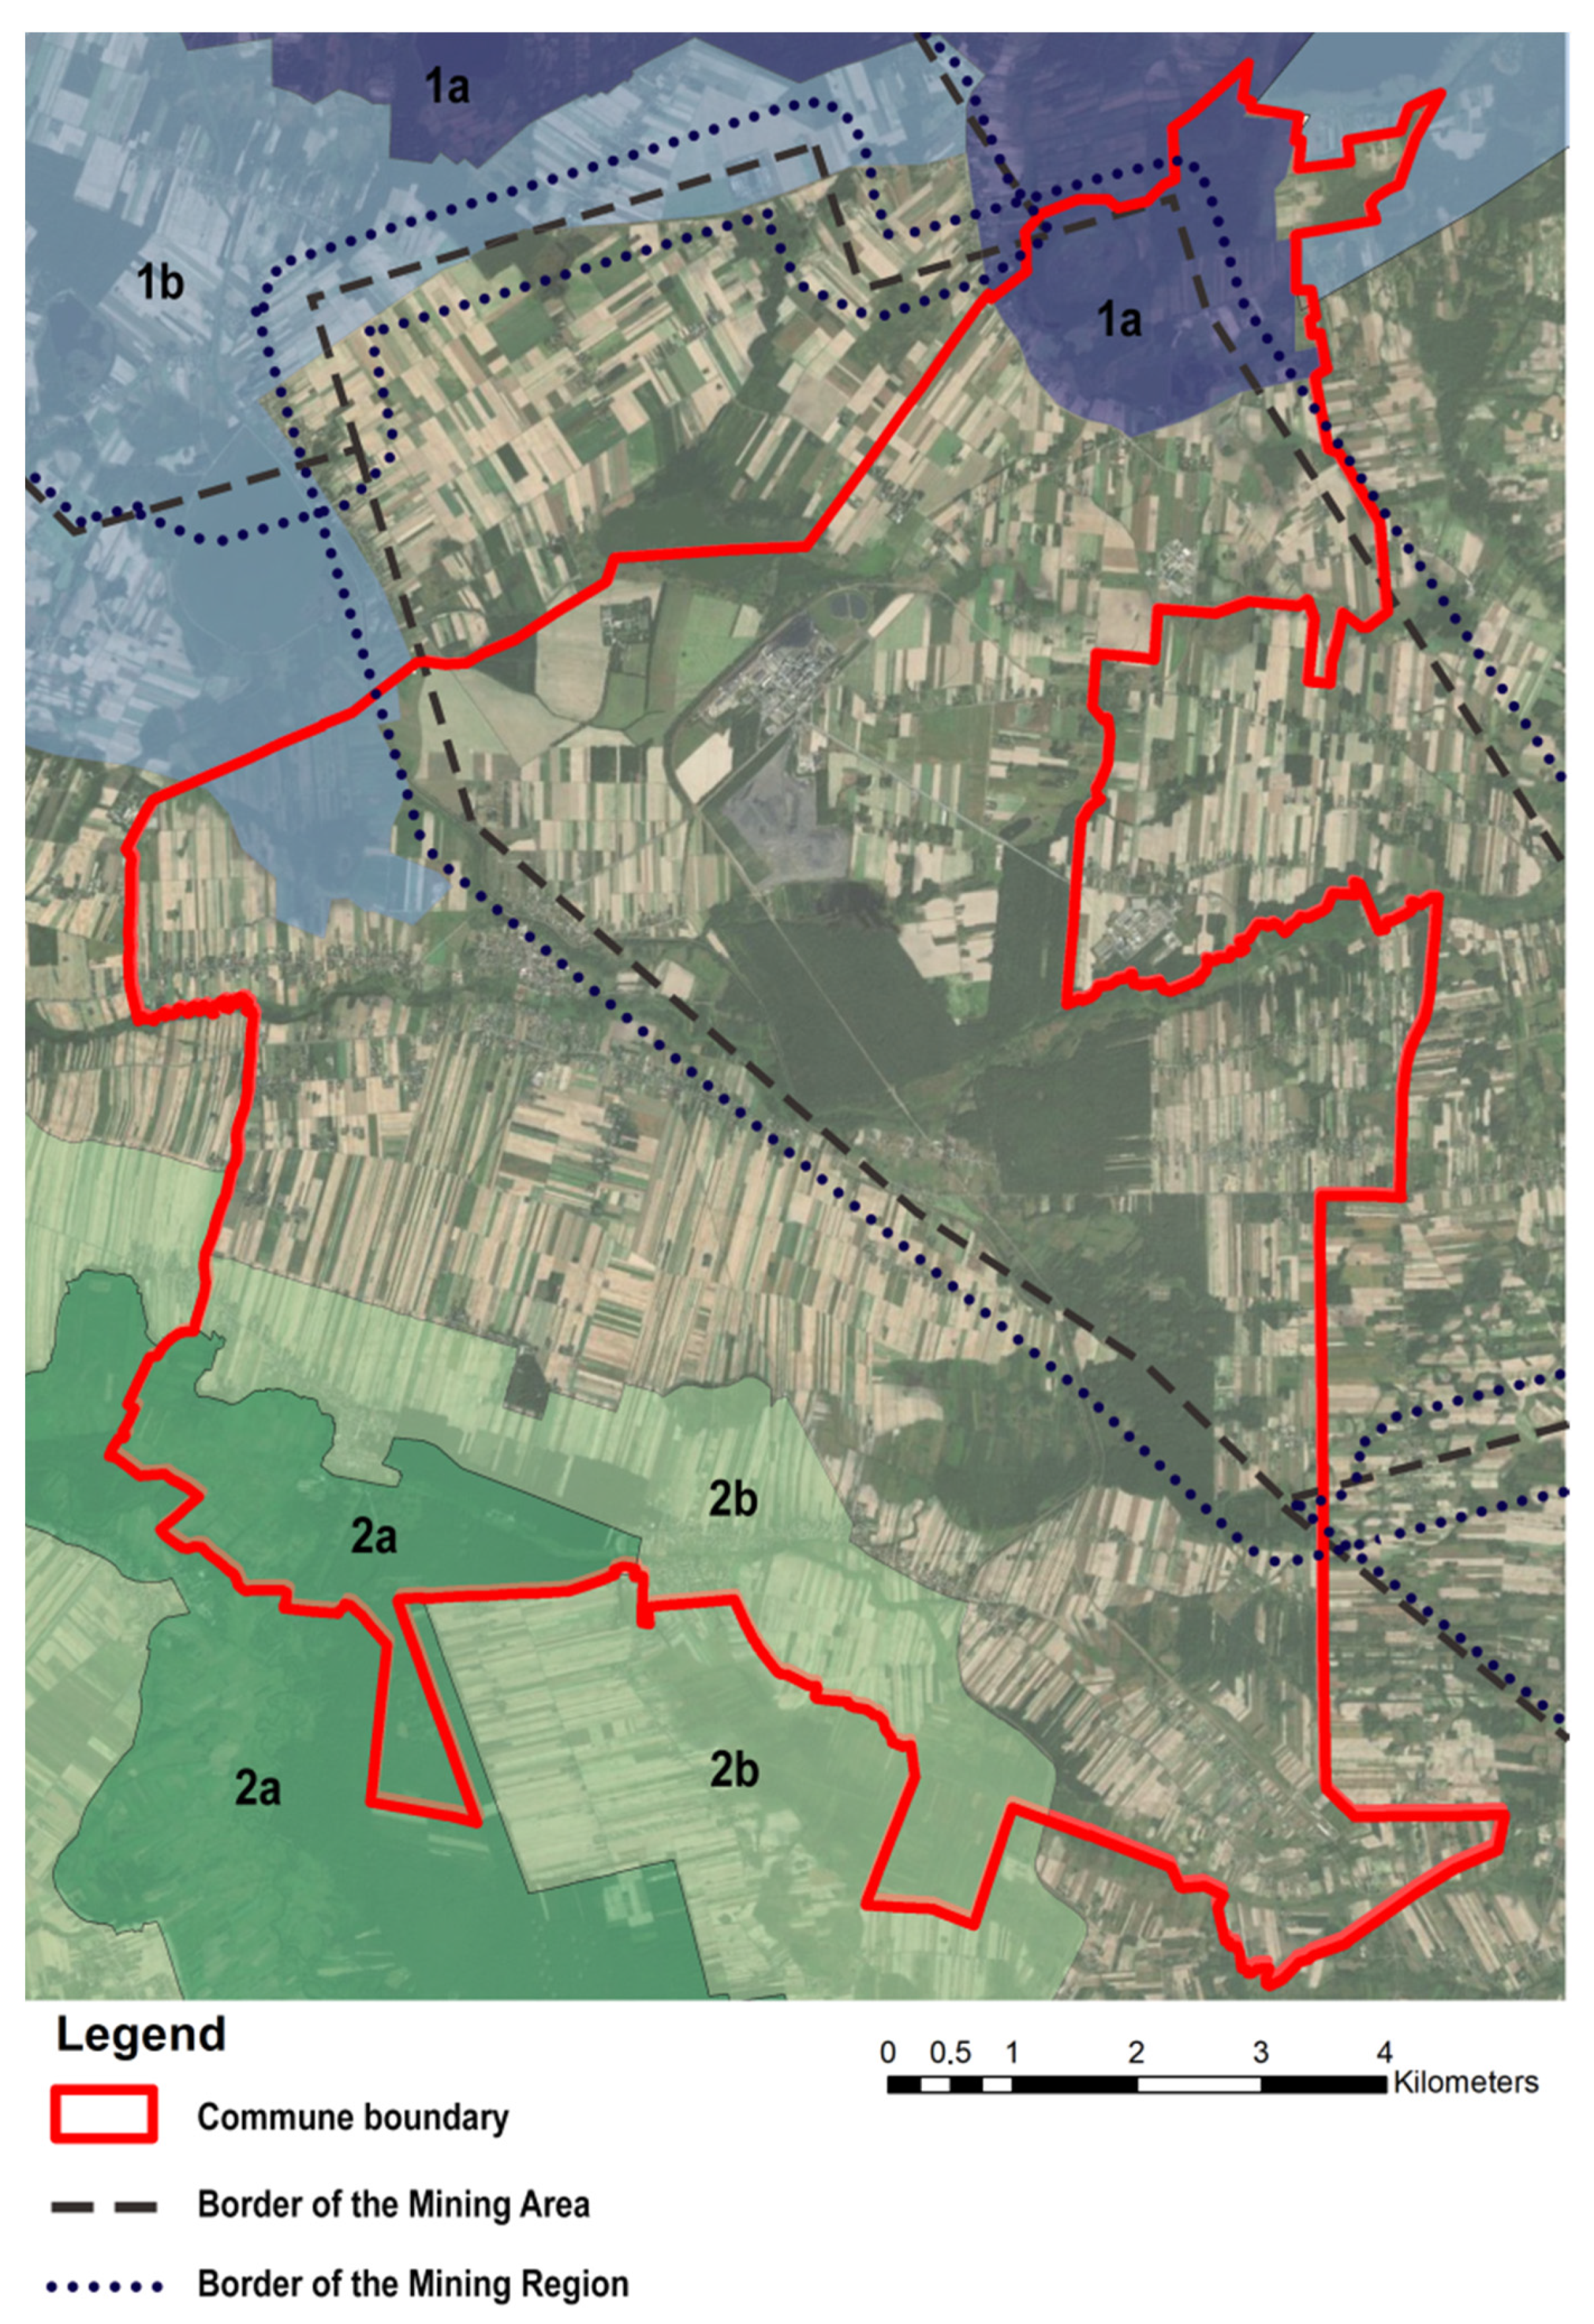
2.1. Study Area
2.2. Materials
2.3. Methods
- Forest complexes and trees;
- Meadows and pastures;
- Agricultural land;
- Compact settlement;
- Industrial areas;
- Road infrastructure;
- Surface waters.
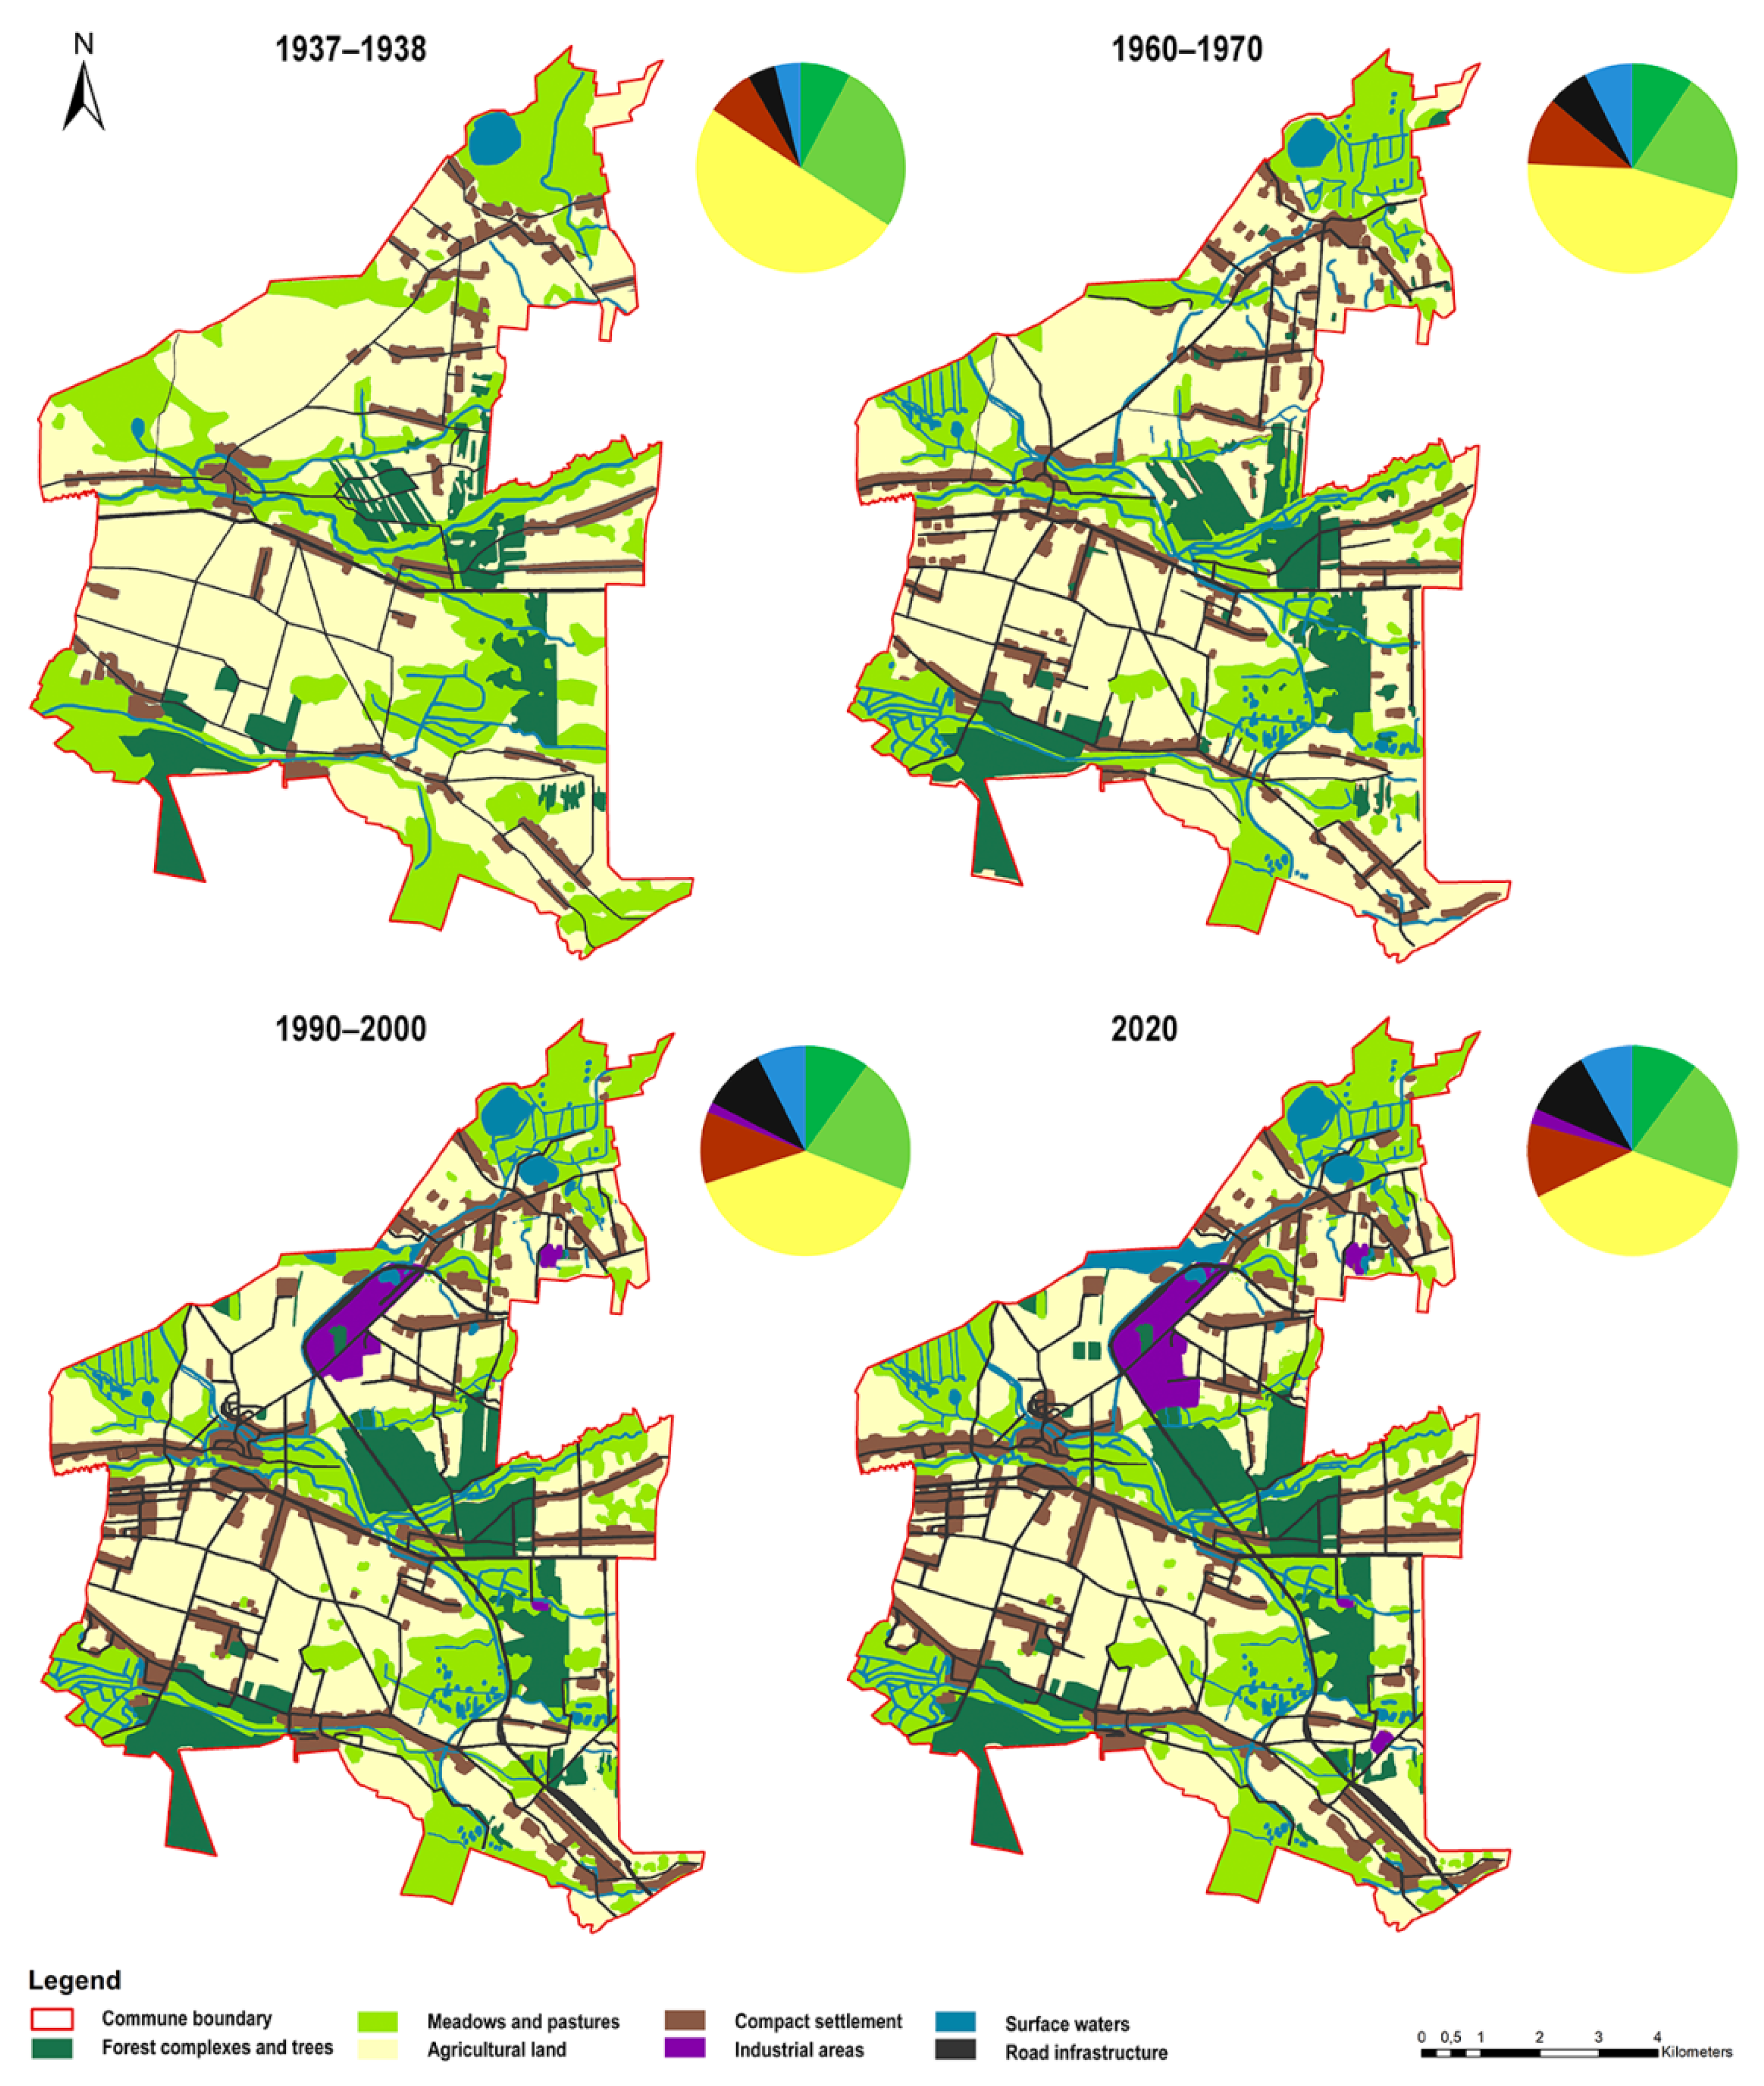
3. Results
3.1. Functional and Spatial Structure in the Years 1937–1938
3.2. Functional and Spatial Structure in the Years 1960–1970
3.3. Functional and Spatial Structure in the Years 1990–2000
3.4. Functional and Spatial Structure in the Year 2020
3.5. The Diversity of the Commune’s Landscape in the Years 1937–2020
4. Discussion
5. Conclusions
Author Contributions
Funding
Data Availability Statement
Conflicts of Interest
References
- Wiśniewska, M. Ekspansja zabudowy na tereny wiejskie. Acta Sci. Pol. Archit. 2008, 7, 56. [Google Scholar]
- Rzeszotarska-Pałka, M. Waloryzacja krajobrazu wsi popegeerowskich z terenu pomorza zachodniego. Przestrz. Forma 2016, 26, 283–292. [Google Scholar] [CrossRef]
- Jezierska-Thöle, A. Modele rozwoju obszarów wiejskich w ujęciu teoretycznym. Studia Obszarów Wiejskich. Regionalny wymiar przemian polskiej wsi—Aspekty przestrzenno-ekonomiczne. Studia Obszrów Wiejskich. 2013, 34, 23–37. [Google Scholar]
- Bierkat, M.; Długozima, A. Przemiany układów ruralistycznych Mazowsza Wschodniego na przykładzie wybranych wsi powiatu siedleckiego. MAZOWSZE Studia Reg. 2017, 23, 13–30. [Google Scholar] [CrossRef]
- Wlazły, A. Zrównoważony rozwój obszarów wiejskich w aspekcie teorii wielofunkcyjności. Prog. Econ. Sci. 2018, 5, 65–94. [Google Scholar]
- Michalewska-Pawlak, M. Zarządzanie Rozwojem Obszarów Wiejskich W Polsce W Warunkach Integracji Europejskiej; Wydawnictwo Aspra: Warszawa, Poland, 2015; pp. 29–35. [Google Scholar]
- Raszeja, E. Ochrona Krajobrazu W Procesie Przekształceń Obszarów Wiejskich; Wydawnictwo Uniwersytetu Przyrodniczego w Poznaniu: Poznań, Poland, 2013; pp. 9–10, 27–28. [Google Scholar]
- Heffner, K. Transformacja układów osadniczych wsi a wielofunkcyjny rozwój obszarów wiejskich. In Wieś i Rolnictwo Na Przełomie Wieków; Rosner, A., Bukraba-Rylska, I., Eds.; PAN IRWiR, Centrum Naukowo-Wdrożeniowe SGGW: Warszawa, Poland, 2001. [Google Scholar]
- Bański, J.; Stola, W. Przemiany Struktury Przestrzennej I Funkcjonalnej Obszarów Wiejskich W Polsce; Studia Obszarów Wiejskich; PTG: Warszawa, Poland, 2002; Volume 3. [Google Scholar]
- Szczepańska, M.; Wilkaniec, A. Rola zasobów krajobrazu kulturowego obszarów wiejskich w procesie odnowy wsi i rozwoju lokalnego na przykładzie Długiej Gośliny w województwie wielkopolskim. Studia Obsz. Wiejskich. Sr. I Kult. Zasoby Obsz. Wiej. 2017, 45, 85–104. [Google Scholar] [CrossRef]
- Wilkaniec, A.; Raszeja, E.; Szczepańska, M. Wykorzystanie zasobów krajobrazowych w polityce przestrzennej gmin na obszarze aglomeracji poznańskiej—Między strategią a praktyką. Studia Obsz. Wiejskich. Sr. I Kult. Zasoby Obsz. Wiej. 2017, 45, 105–123. [Google Scholar] [CrossRef]
- Woźniak, M. Wpływ globalizacji na rozwój obszarów wiejskich na przykładzie województwa podkarpackiego. Rocz. Nauk. Stowarzyszenia Ekon. Rol. Agrobiz. 2009, 11, 367–371. [Google Scholar]
- Antolak, M. Przekształcenia krajobrazów gminy wiejskiej Ostróda. Archit. Kraj. 2013, 3, 78–93. [Google Scholar]
- Morton, D.C.; DeFries, R.S.; Shimabukuro, Y.E.; Anderson, L.O.; Arai, E.; Espirito-Santo, F.; Freitas, R.; Morisette, J. Cropland expansion changes deforestation dynamics in the southern Brazilian Amazon. Proc. Natl. Acad. Sci. USA 2006, 103, 14637–14641. [Google Scholar] [CrossRef] [PubMed]
- Anand, V.; Oinam, B. Future land use land cover prediction with special emphasis on urbanization and wetlands. Remote Sens. Lett. 2020, 11, 225–234. [Google Scholar] [CrossRef]
- Solon, J. Kierunki standaryzacji metod badań krajobrazu do celów praktycznych. Przegląd Geogr. 2008, 80, 39–54. [Google Scholar]
- Pukowiec-Kurda, K.; Sobala, M. Nowa metoda oceny stopnia antropogienczego przekształcenia krajobrazu na podstawie metryk krajobrazowych. Pr. Kom. Kraj. Kult. 2016, 31, 71–84. [Google Scholar]
- Chmielewski, T.J. Systemy Krajobrazowe. Struktura—Funkcjonowanie—Planowanie, 1st ed.; Wydawnictwo Naukowe PWN: Warszawa, Poland, 2013; pp. 154–156. [Google Scholar]
- McAlpine, C.A.; Eyre, T.J. Testing landscape metrics as indicators of habitat loss and fragmentation in continuous eucalypt forests (Queensland, Australia). Landsc. Ecol. 2002, 17, 711–728. [Google Scholar] [CrossRef]
- Roo-Zielińska, E.; Solon, J.; Degórski, M. Ocena Stanu I Przekształceń Środowiska Przyrodniczego Na Podstawie Wskaźników Geobotanicznych, Krajobrazowych I Glebowych: (Podstawy Teoretyczne I Przykłady Zastosowań); Instytut Geografii i Przestrzennego Zagospodarowania im. Stanisława Leszczyckiego PAN: Warszawa, Poland, 2007; pp. 107–109. [Google Scholar]
- Pitchford, A.M.; Denver, J.M.; Olsen, A.R.; Ator, S.W.; Cormier, S.; Nash, M.S.; Mehaffey, M.H. Testing Landscape Indicators for Stream Condition Related to Pesticides and Nutrients: Landscape Indicators for Pesticides Study for Mid-Atlantic Coastal Streams (LIPS-MACS); Unpublished Materials; US EPA: Washington, DC, USA, 2000. [Google Scholar]
- McGarigal, K.; Marks, B. FRAGSTATS: Spatial Pattern Analysis Program for Quantifying Landscape Structure; General Technical Report; PNW-GTR-351; USDA Forest Service, Pacific Northwest Research Station: Portland, OR, USA, 1995. [Google Scholar]
- Radecka, A.; Osińska-Skotak, K. Analiza zmian struktury przestrzennej krajobrazu warszawskiej dzielnicy Wilanów w latach 2002–2011 z wykorzystaniem zdjęć satelitarnych SPOT. Teledetekcja Sr. 2015, 52, 51–65. [Google Scholar]
- McGarigal, K. Fragstats Help. 2015, pp. 77–171. Available online: https://www.umass.edu (accessed on 1 February 2020).
- Krajewski, P. Wykorzystanie wskaźnika zmienności w audycie krajobrazowym. Infrastrukt. I Ekol. Teren. Wiej. 2018, 1, 89–104. [Google Scholar]
- Sun, X.; Tan, X.; Chen, K.; Song, S.; Zhu, X.; Hou, D. Quantifying landscape-metrics impacts on urban green-spaces andwater-bodies cooling effect: The study of Nanjing, China. Urban For. Urban Green. 2020, 55, 126838. [Google Scholar] [CrossRef]
- Macias, A.; Bródka, S.; Stanek, B. Przestrzenne aspekty zmian krajobrazowych na terenach chronionych na przykładzie Wielkopolskiego Parku Narodowego. Probl. Ekol. Kraj. 2012, 33, 123–134. [Google Scholar]
- Sahraoui, Y.; Clauzel, C.; Foltete, J.C. A metrics-based approach for modeling covariation of visual and ecological landscape qualities. Ecol. Indic. 2021, 123, 107331. [Google Scholar] [CrossRef]
- Kaminski, A.; Bauer, D.M.; Bell, K.P.; Loftin, C.S.; Nelson, E.J. Using landscape metrics to characterize towns along an urban-rural gradient. Landsc. Ecol. 2021, 36, 2937–2956. [Google Scholar] [CrossRef]
- Zheng, X.; Wu, B.; Weston, M.V.W.; Zhang, J.; Gan, M.; Zhu, J.; Deng, J.; Wang, K.; Teng, L. Rural Settlement Subdivision by Using Landscape Metrics as Spatial Contextual Information. Remote Sens. 2017, 9, 486. [Google Scholar] [CrossRef]
- Pôças, I.; Cunha, M.; Pereira, L.S. Remote sensing based indicators of changes in a mountain rural landscape of Northeast Portugal. Appl. Geogr. 2011, 31, 871–880. [Google Scholar] [CrossRef]
- Wu, K.L.; Kuo, H.F.; Zhang, D. Monitoring Landscape Changes of Rural Townships in the Cold Region of China Using RS, GIS, and Landscape Metrics. Int. Forum Electr. Eng. Autom. 2016, 368–372. [Google Scholar] [CrossRef]
- Herzog, F.; Lausch, A.; Muller, E.; Thulke, H.H.; Steinhardt, U.; Lehmann, S. Landscape Metrics for Assessment of Landscape Destruction and Rehabilitation. Environ. Manag. 2001, 27, 91–107. [Google Scholar] [CrossRef] [PubMed]
- Baker, W.L.; Cai, Y. The r.le programs for multiscale analysis of landscape structure using the GRASS geographical information system. Landsc. Ecol. 1992, 7, 291–302. [Google Scholar] [CrossRef]
- Solon, J.; Borzyszkowski, J.; Bidłasik, M.; Richling, A.; Badora, K.; Balon, J.; Brzezińska-Wójcik, T.; Chabudziński, Ł.; Dobrowolski, R.; Grzegorczyk, I.; et al. Physico-geographical mesoregions of Poland: Verification and adjustment of boundaries on the basis of contemporary spatial data. Geogr. Pol. 2018, 91, 143–170. [Google Scholar] [CrossRef]
- Szczegółowa Mapa Geologiczna Polski W Skali 1: 50 000, Arkusz Łęczna, Ostrów Lubelski, Orzechów Nowy. Available online: http://metadane.pgi.gov.pl (accessed on 1 February 2020).
- Mapa Glebowo-Rolnicza Województwa Lubelskiego W Skali 1:100 000. Available online: http:/gis.lubelskie.pl (accessed on 10 April 2019).
- Graniczny, M.; Mizerski, W. Zasługi Jana Samsonowicza dla rozwoju polskiego górnictwa. In Proceedings of the XI Konferencja „Dziedzictwo I Historia Górnictwa Oraz Wykorzystanie Pozostałości Dawnych Robót Górniczych”, Zabrze, Poland, 20–22 April 2017; pp. 30–32. [Google Scholar]
- Mącik, E. Studium Uwarunkowań I Kierunków Zagospodarowania Przestrzennego Gminy Puchaczów. Załącznik 1 Do Uchwały Nr XXVIII/166/12 Rady Gminy Puchaczów Z Dnia 18 Grudnia 2012 R; Biuro projektów urbanistyki i architektury EM: Lublin, Poland, 2012. [Google Scholar]
- Szefler, S. Visual analysis of the cultural landscape in terms of vegetation for the purposes of revitalization of rural areas. Rocz. Ochr. Sr. 2021, 23. Available online: https://ros.edu.pl (accessed on 2 August 2021).
- Mapa Taktyczna W Skali 1: 100 000 Aktualna Na Lata 1937-1938, Łęczna Pas 43 Słup 36; Wojskowy Instytut Geograficzny. Available online: https://polona.pl (accessed on 1 February 2020).
- Available online: https://pro.arcgis.com/es/pro-app/2.7/get-started/get-started.htm (accessed on 2 August 2021).
- Shannon, C.E. A mathematical theory of communication. Bell Syst. Tech. J. 1948, 27, 379–423. [Google Scholar] [CrossRef]
- Simpson, E.H. Measurement of diversity. Nature 1949, 163, 688. [Google Scholar] [CrossRef]
- McGariga, K.; Cushman, S.A.; Ene, E. FRAGSTATS v4: Spatial Pattern Analysis Program for Categorical and Continuous Maps. Computer Software Program Produced by the Authors at the University of Massachusetts. Amherst. 2012. Available online: http://www.umass.edu/landeco/research/fragstats/fragstats.html (accessed on 2 August 2021).
- Kot, R.; Leśniak, K. Ocena georóżnorodności za pomocą miar krajobrazowych—Podstawowe trudności metodyczne. Przegląd Geogr. 2006, 78, 25–45. [Google Scholar]
- Zwierzchowska, I.; Stępniewska, M.; Łowicki, D. Możliwości wykorzystania programu FRAGSTATS w badaniach środowiska przyrodniczego. Przegląd Geogr. 2010, 82, 85–102. [Google Scholar]
- Kozak, J.; Luc, M.; Ostapowicz, K.; Ziółkowski, E. Pozyskiwanie i analiza danych o pokryciu terenu a badania struktury przestrzennej krajobrazu. In Struktura Środowiska Przyrodniczego a Filozofia Krajobrazu; Ziaja, W., Jodłowski, M., Eds.; IGiGP UJ: Kraków, Poland, 2014; pp. 63–84. [Google Scholar]
- Wu, J.; Shen, W.; Sun, W.; Tueller, P.T. Empirical patterns of effects of changing scale on landscape metrics. Landsc. Ecol. 2002, 17, 761–782. [Google Scholar] [CrossRef]
- Wu, J. Effects of changing scale on landscape pattern analysis: Scaling relations. Landsc. Ecol. 2004, 19, 125–138. [Google Scholar] [CrossRef]
- Szot-Gabryś, T. Strategia Rozwoju Lokalnego Gminy Puchaczów Na Lata 2007–2015; Fundacja Centrum Rozwoju Lokalnego: Lublin, Poland, 2008. [Google Scholar]


| Land Cover Unit | Form of Land Use |
|---|---|
| Forest complexes and trees | Forests |
| Forest clearings | |
| Bushes | |
| Parks | |
| Meadows and pastures | Wetlands |
| Fallow lands | |
| Meadows | |
| Pastures | |
| Agricultural land | Farmlands |
| Fruit orchards | |
| Areas of scattered farm buildings | |
| Compact settlement | Compact housing development |
| Compact service buildings | |
| Industrial areas | Mining industry areas |
| Mining heaps | |
| Road infrastructure | Roads |
| Railway lines | |
| Surface waters | Lakes |
| Rivers | |
| Other water reservoirs |
| The Name of the Metric | Unit | Value Range | Characteristics |
|---|---|---|---|
| Percentage of landscape | [%] | 0 < land ≤ 100 | The percentage share of the unit area in the landscape |
| Mean class area | [ha] | 0 < MN | Average area size of the patches in a given unit |
| Number of patches | [number] | 0 < NP | The total number of patches of the unit |
| Shannon’s diversity index | [number] | 0 ≤ SHDI | The indicator is high with the increase in the number of patches and when the proportions of the terrain occupied by different classes of patches are equal |
| Simpson’s diversity index | [number] | 0 ≤ SIDI < 1 | SIDI increases as the number of different patch types increases and the proportional distribution of area among patch types becomes more equitable |
| The Name of the Metric | Land Cover Unit | Year | |||
|---|---|---|---|---|---|
| 1937–1938 | 1960–1970 | 1990–2000 | 2020 | ||
| Percentage of landscape | Forest complexes and trees | 7.74% | 9.50% | 9.90% | 10.17% |
| Meadows and pastures | 26.47% | 20.17% | 21.15% | 20.57% | |
| Agricultural land | 50.16% | 46.06% | 38.92% | 37.05% | |
| Compact settlement | 7.32% | 10.44% | 11.06% | 11.39% | |
| Industrial areas | - | - | 1.54% | 2.34% | |
| Road infrastructure | 4.31% | 6.36% | 9.95% | 10.29% | |
| Surface waters | 4.00% | 7.47% | 7.48% | 8.19% | |
| Mean class area [ha] | Forest complexes and trees | 12.64 | 11.28 | 16.78 | 18.14 |
| Meadows and pastures | 22.19 | 11.18 | 7.89 | 7.63 | |
| Agricultural land | 27.27 | 22.06 | 13.28 | 14.34 | |
| Compact settlement | 1.79 | 1.74 | 3.06 | 3.86 | |
| Industrial areas | - | - | 4.72 | 17.65 | |
| Road infrastructure | 131.59 | 193.38 | 303.59 | 468.11 | |
| Surface waters | 14.65 | 8.16 | 5.40 | 6.34 | |
| Number of patches | Forest complexes and trees | 56 | 77 | 54 | 51 |
| Meadows and pastures | 109 | 165 | 245 | 245 | |
| Agricultural land | 168 | 191 | 268 | 235 | |
| Compact settlement | 373 | 547 | 330 | 268 | |
| Industrial areas | - | - | 30 | 12 | |
| Road infrastructure | 3 | 3 | 3 | 2 | |
| Surface waters | 25 | 84 | 126 | 117 | |
| Shannon’s diversity index | 1.3523 | 1.5084 | 1.6561 | 1.6995 | |
| Simpson’s diversity index | 0.6638 | 0.7176 | 0.7660 | 0.7792 | |
Publisher’s Note: MDPI stays neutral with regard to jurisdictional claims in published maps and institutional affiliations. |
© 2021 by the authors. Licensee MDPI, Basel, Switzerland. This article is an open access article distributed under the terms and conditions of the Creative Commons Attribution (CC BY) license (https://creativecommons.org/licenses/by/4.0/).
Share and Cite
Barwicka, S.; Milecka, M. The Use of Selected Landscape Metrics to Evaluate the Transformation of the Rural Landscape as a Result of the Development of the Mining Function—A Case Study of the Puchaczów Commune. Sustainability 2021, 13, 12279. https://doi.org/10.3390/su132112279
Barwicka S, Milecka M. The Use of Selected Landscape Metrics to Evaluate the Transformation of the Rural Landscape as a Result of the Development of the Mining Function—A Case Study of the Puchaczów Commune. Sustainability. 2021; 13(21):12279. https://doi.org/10.3390/su132112279
Chicago/Turabian StyleBarwicka, Sylwia, and Małgorzata Milecka. 2021. "The Use of Selected Landscape Metrics to Evaluate the Transformation of the Rural Landscape as a Result of the Development of the Mining Function—A Case Study of the Puchaczów Commune" Sustainability 13, no. 21: 12279. https://doi.org/10.3390/su132112279
APA StyleBarwicka, S., & Milecka, M. (2021). The Use of Selected Landscape Metrics to Evaluate the Transformation of the Rural Landscape as a Result of the Development of the Mining Function—A Case Study of the Puchaczów Commune. Sustainability, 13(21), 12279. https://doi.org/10.3390/su132112279