
Correlation of Respiratory Aerosols and Metabolic Carbon Dioxide

 ,
,  ,
,  and
and 
Abstract
:1. Introduction
2. Methods
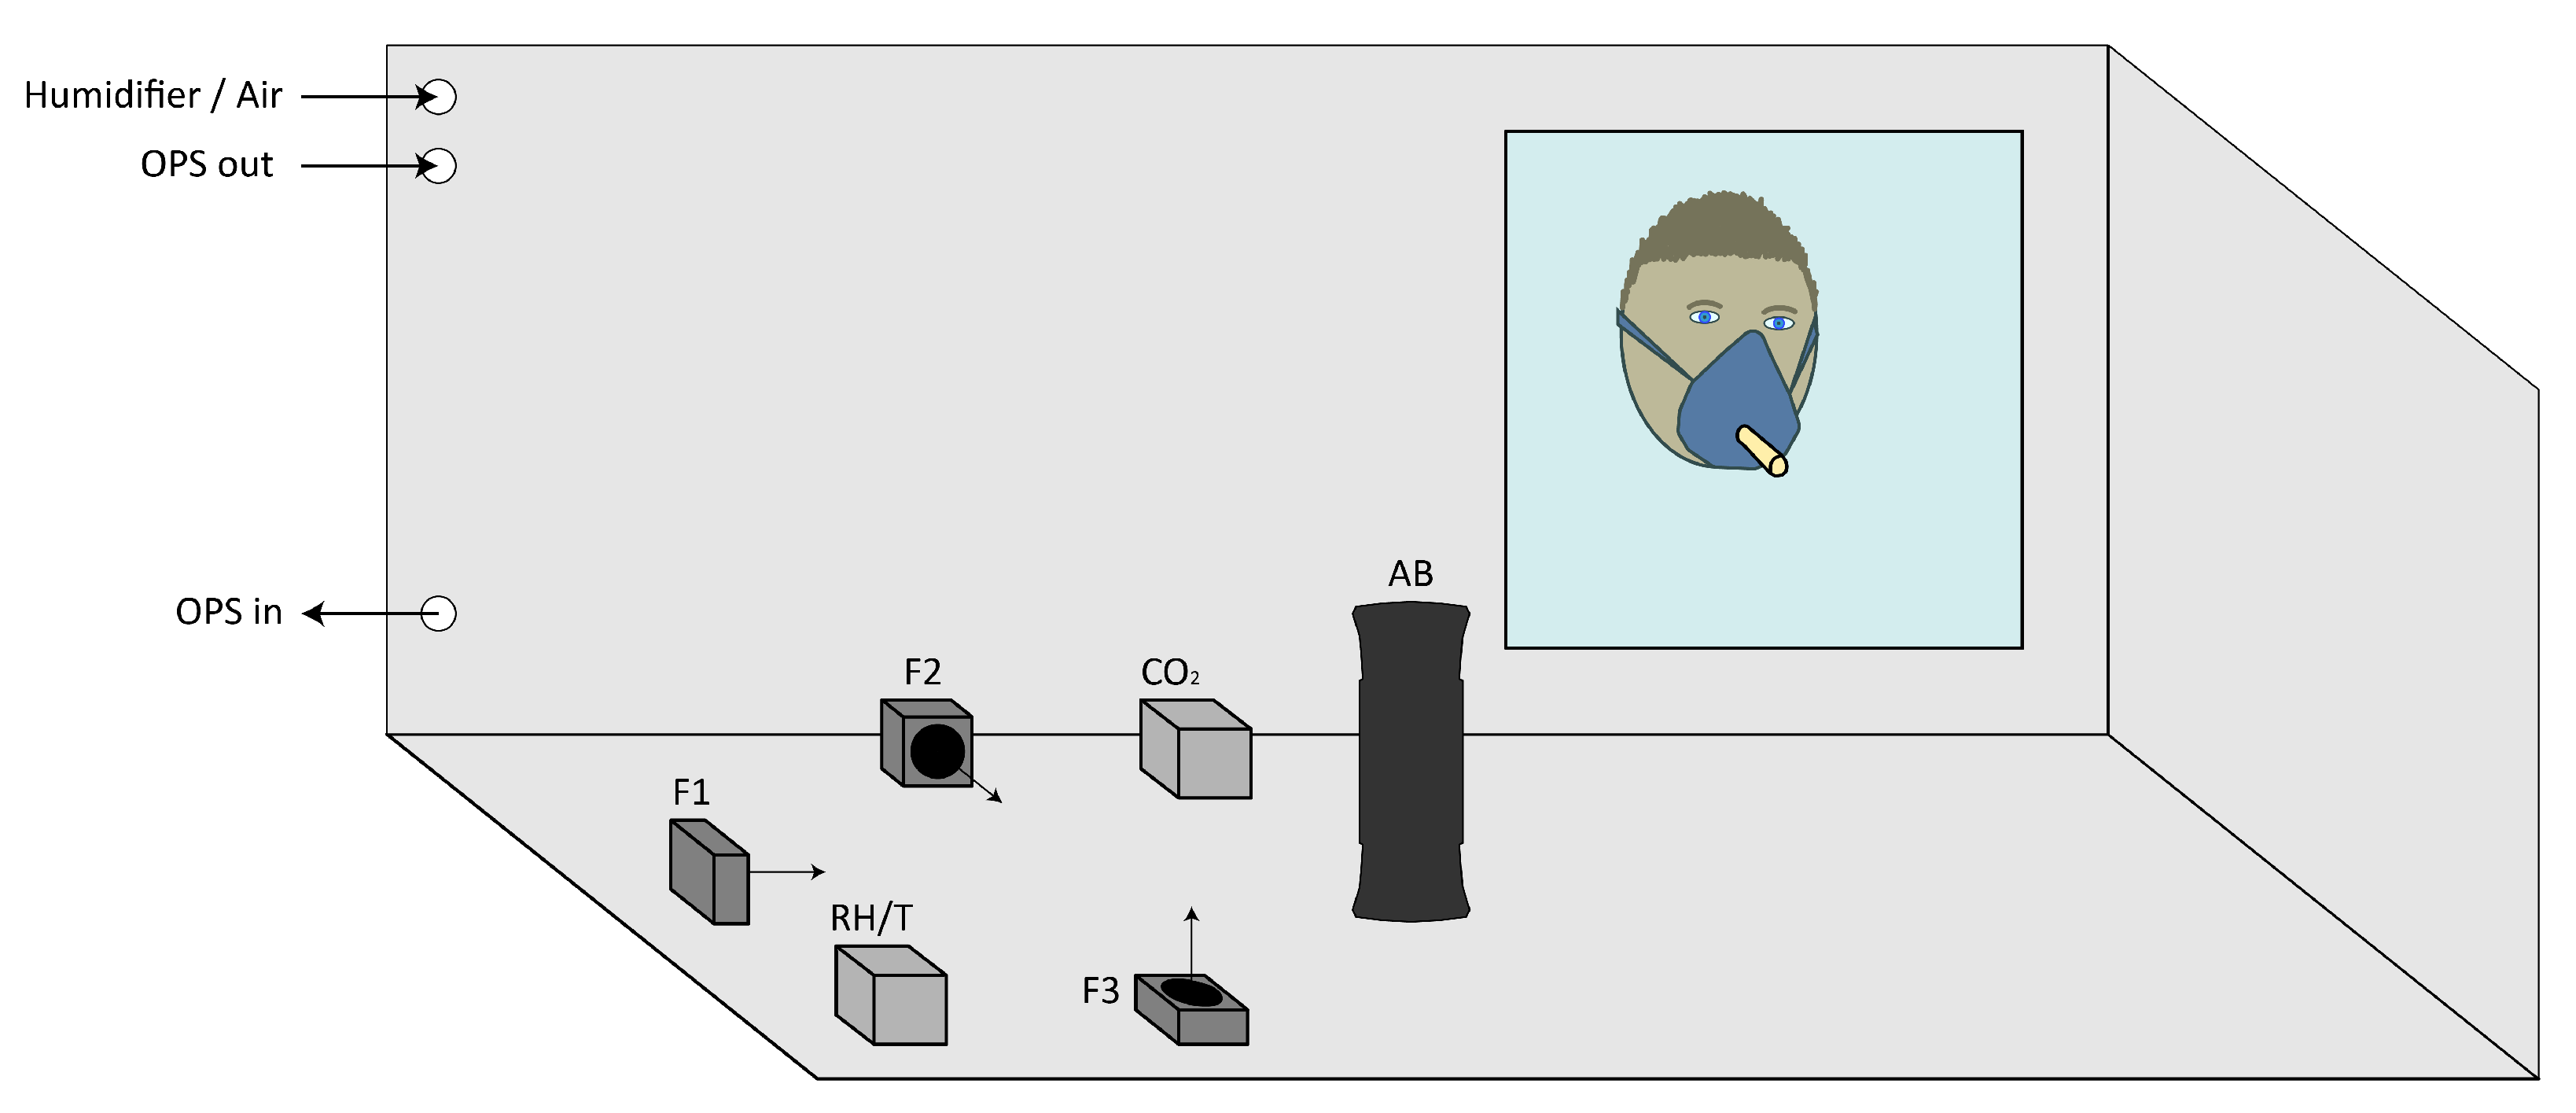
2.1. Setup
2.2. Protocol
2.3. Data Treatment
2.4. Estimation of Volume Concentrations
3. Results
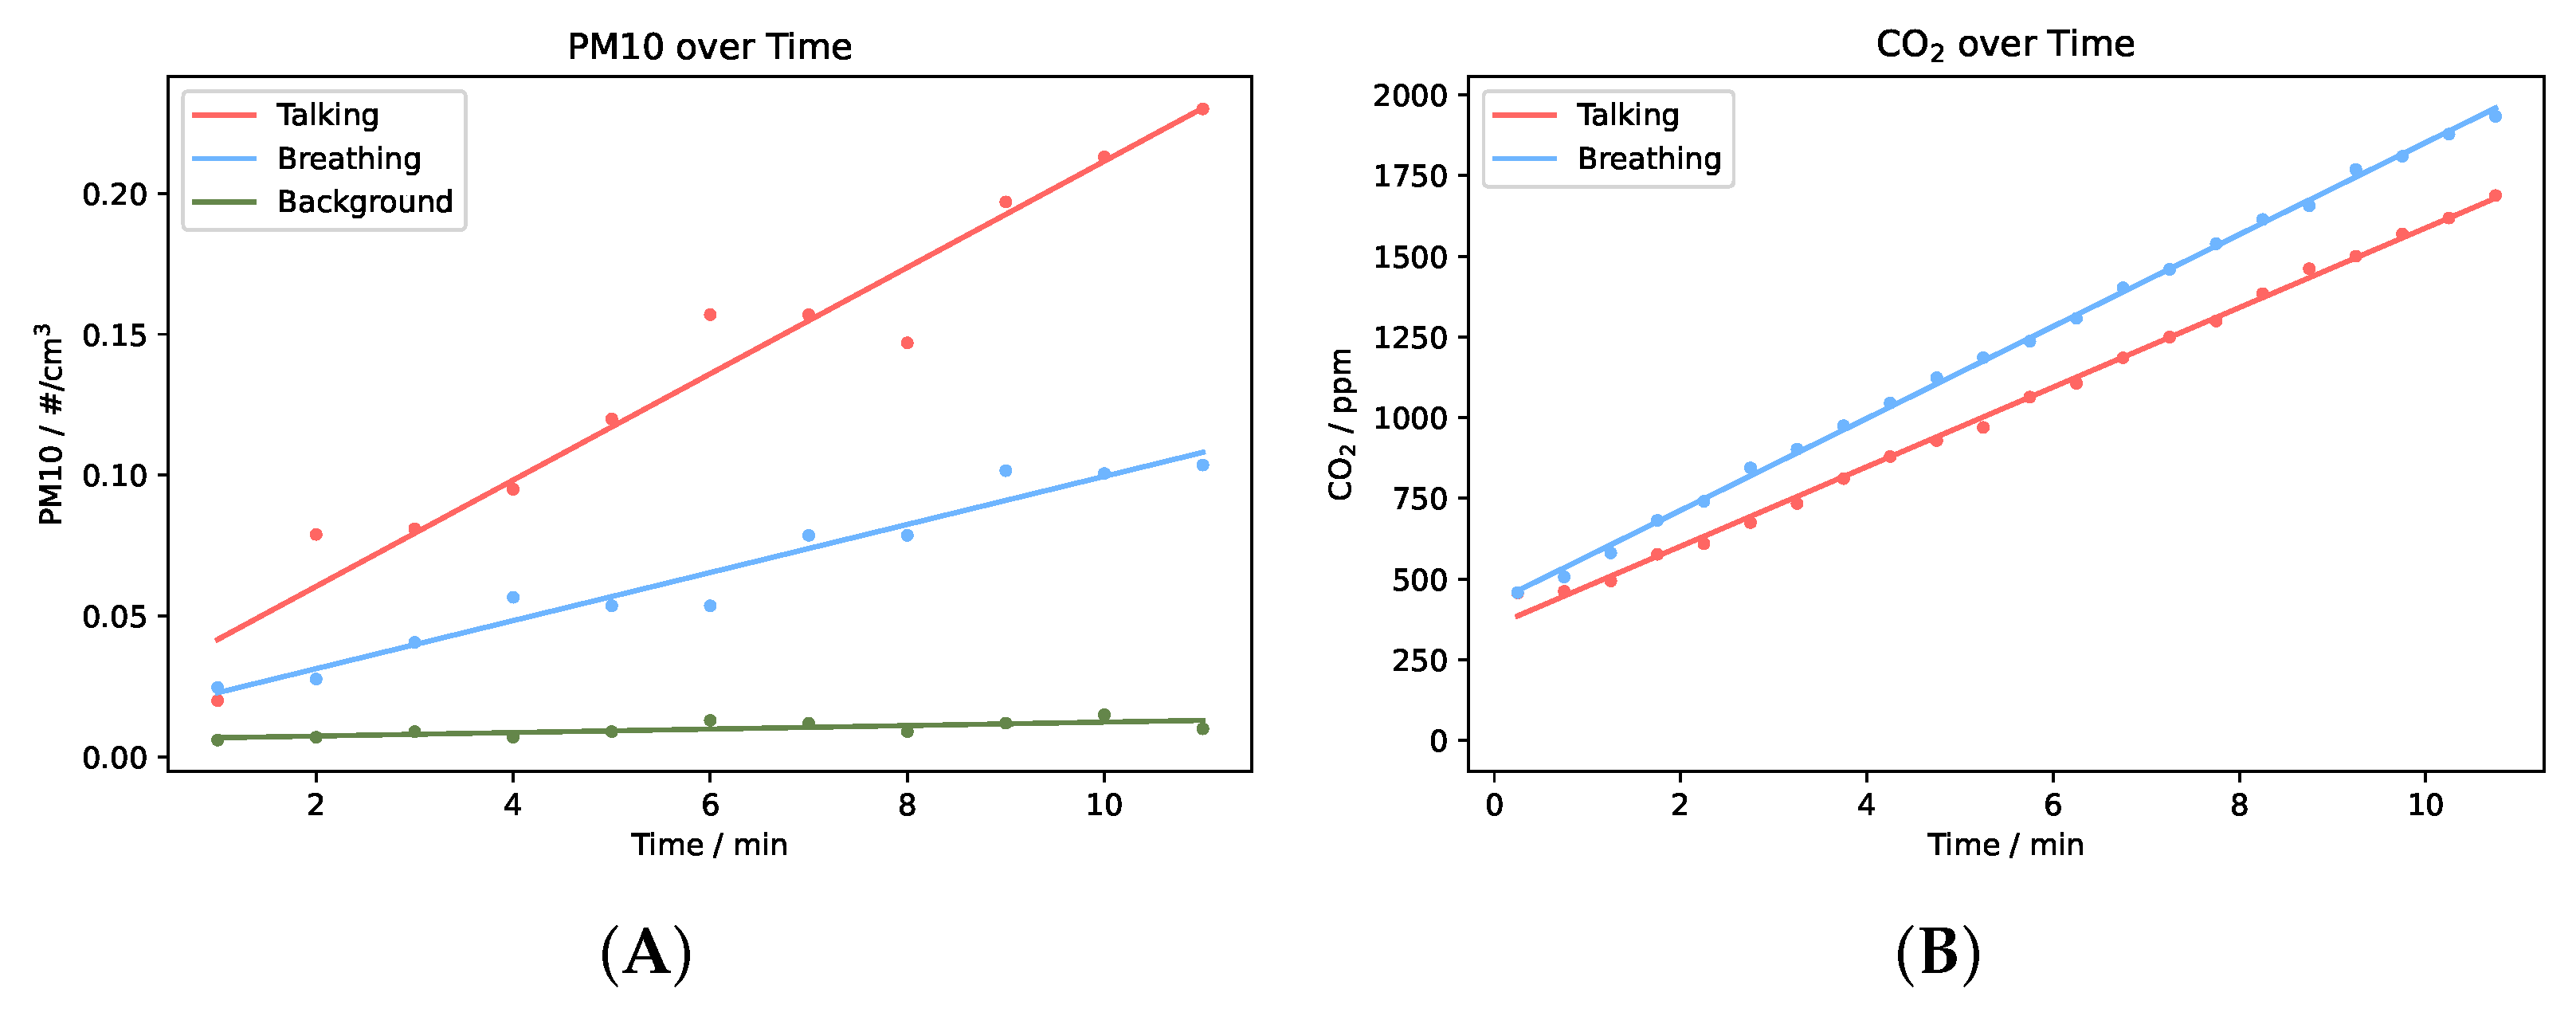
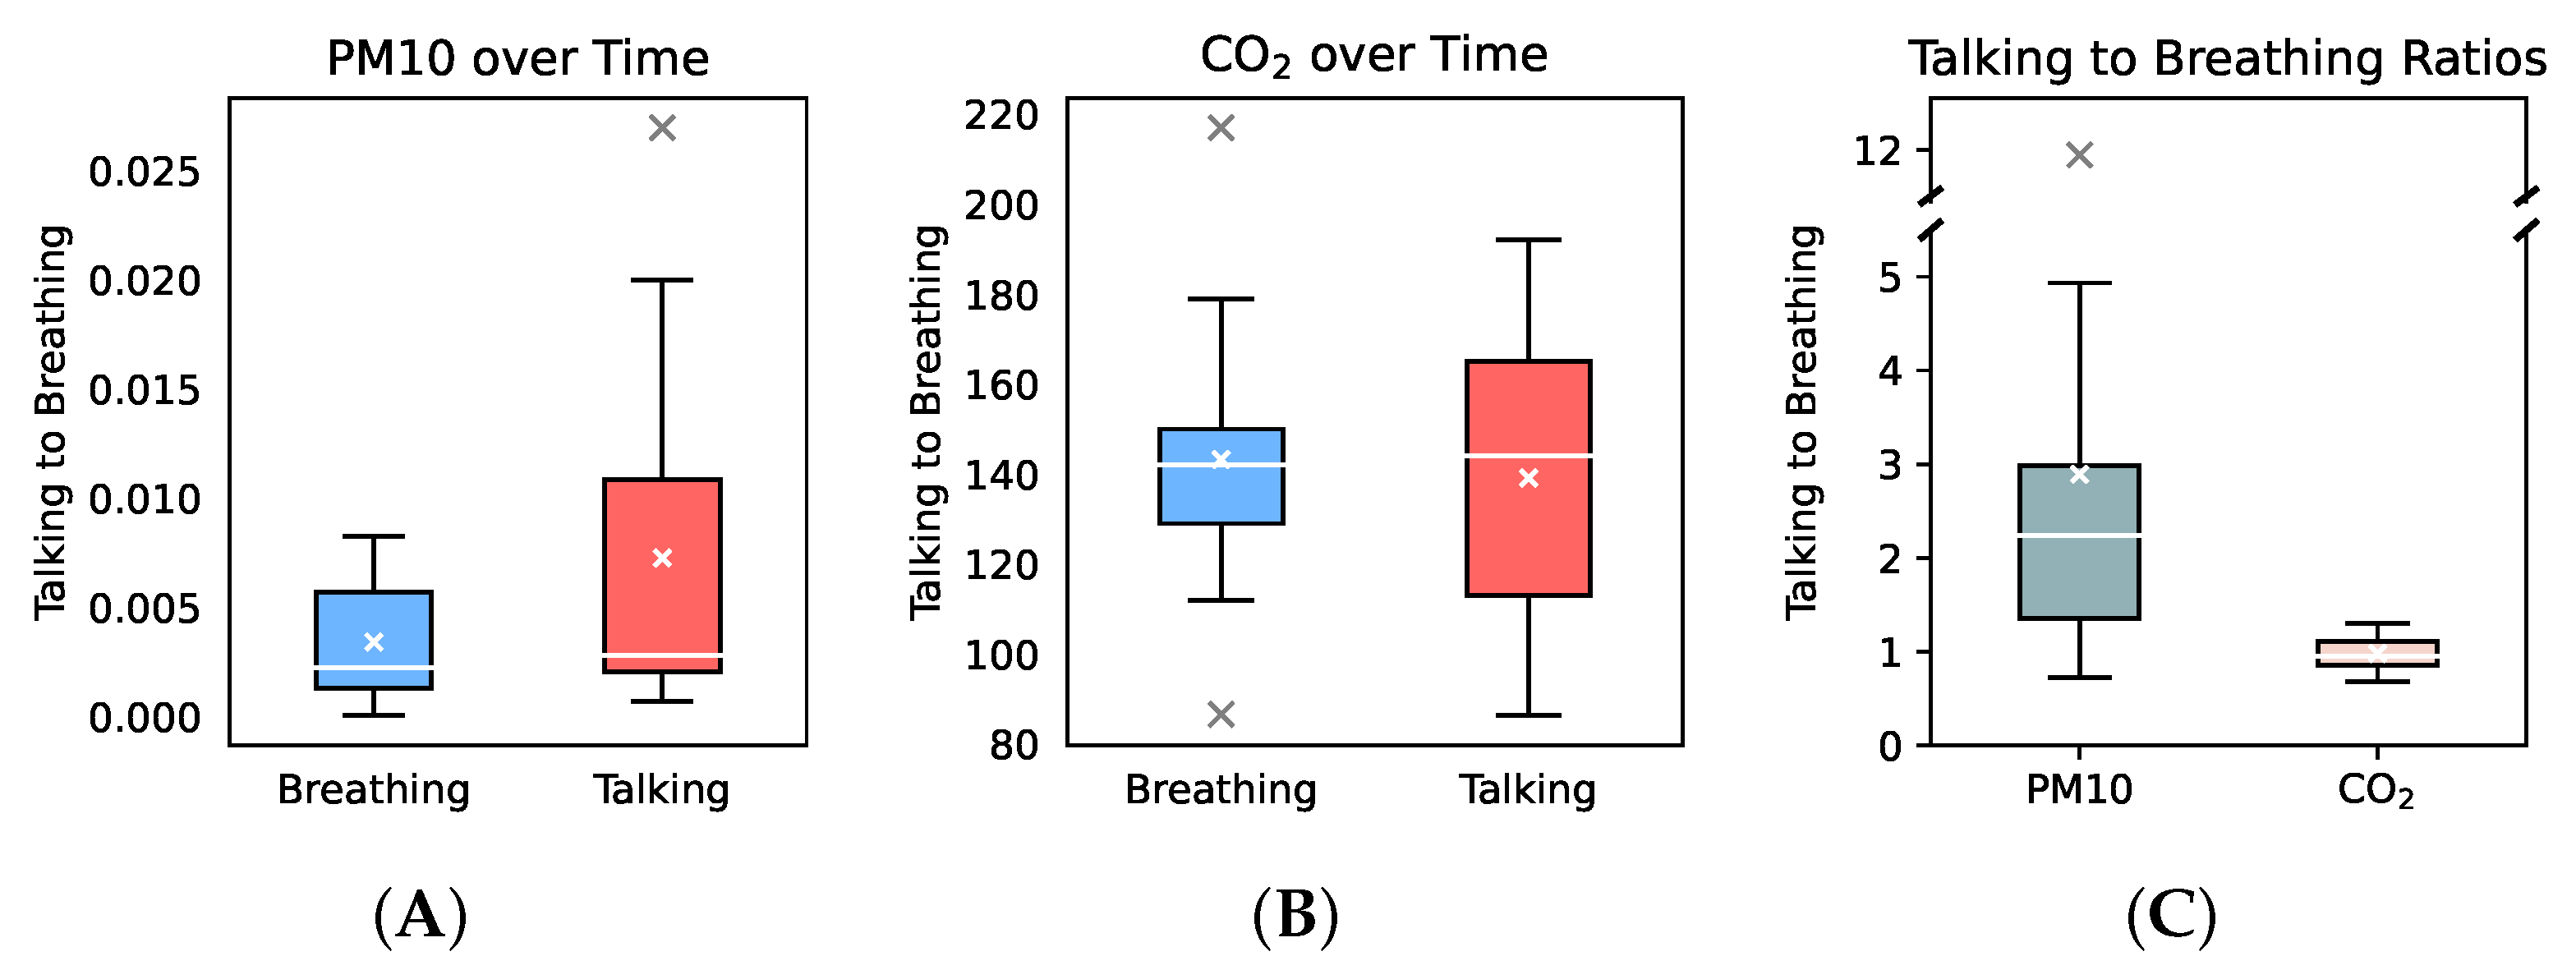
3.1. Respiratory Aerosol and CO2 Increase over Time
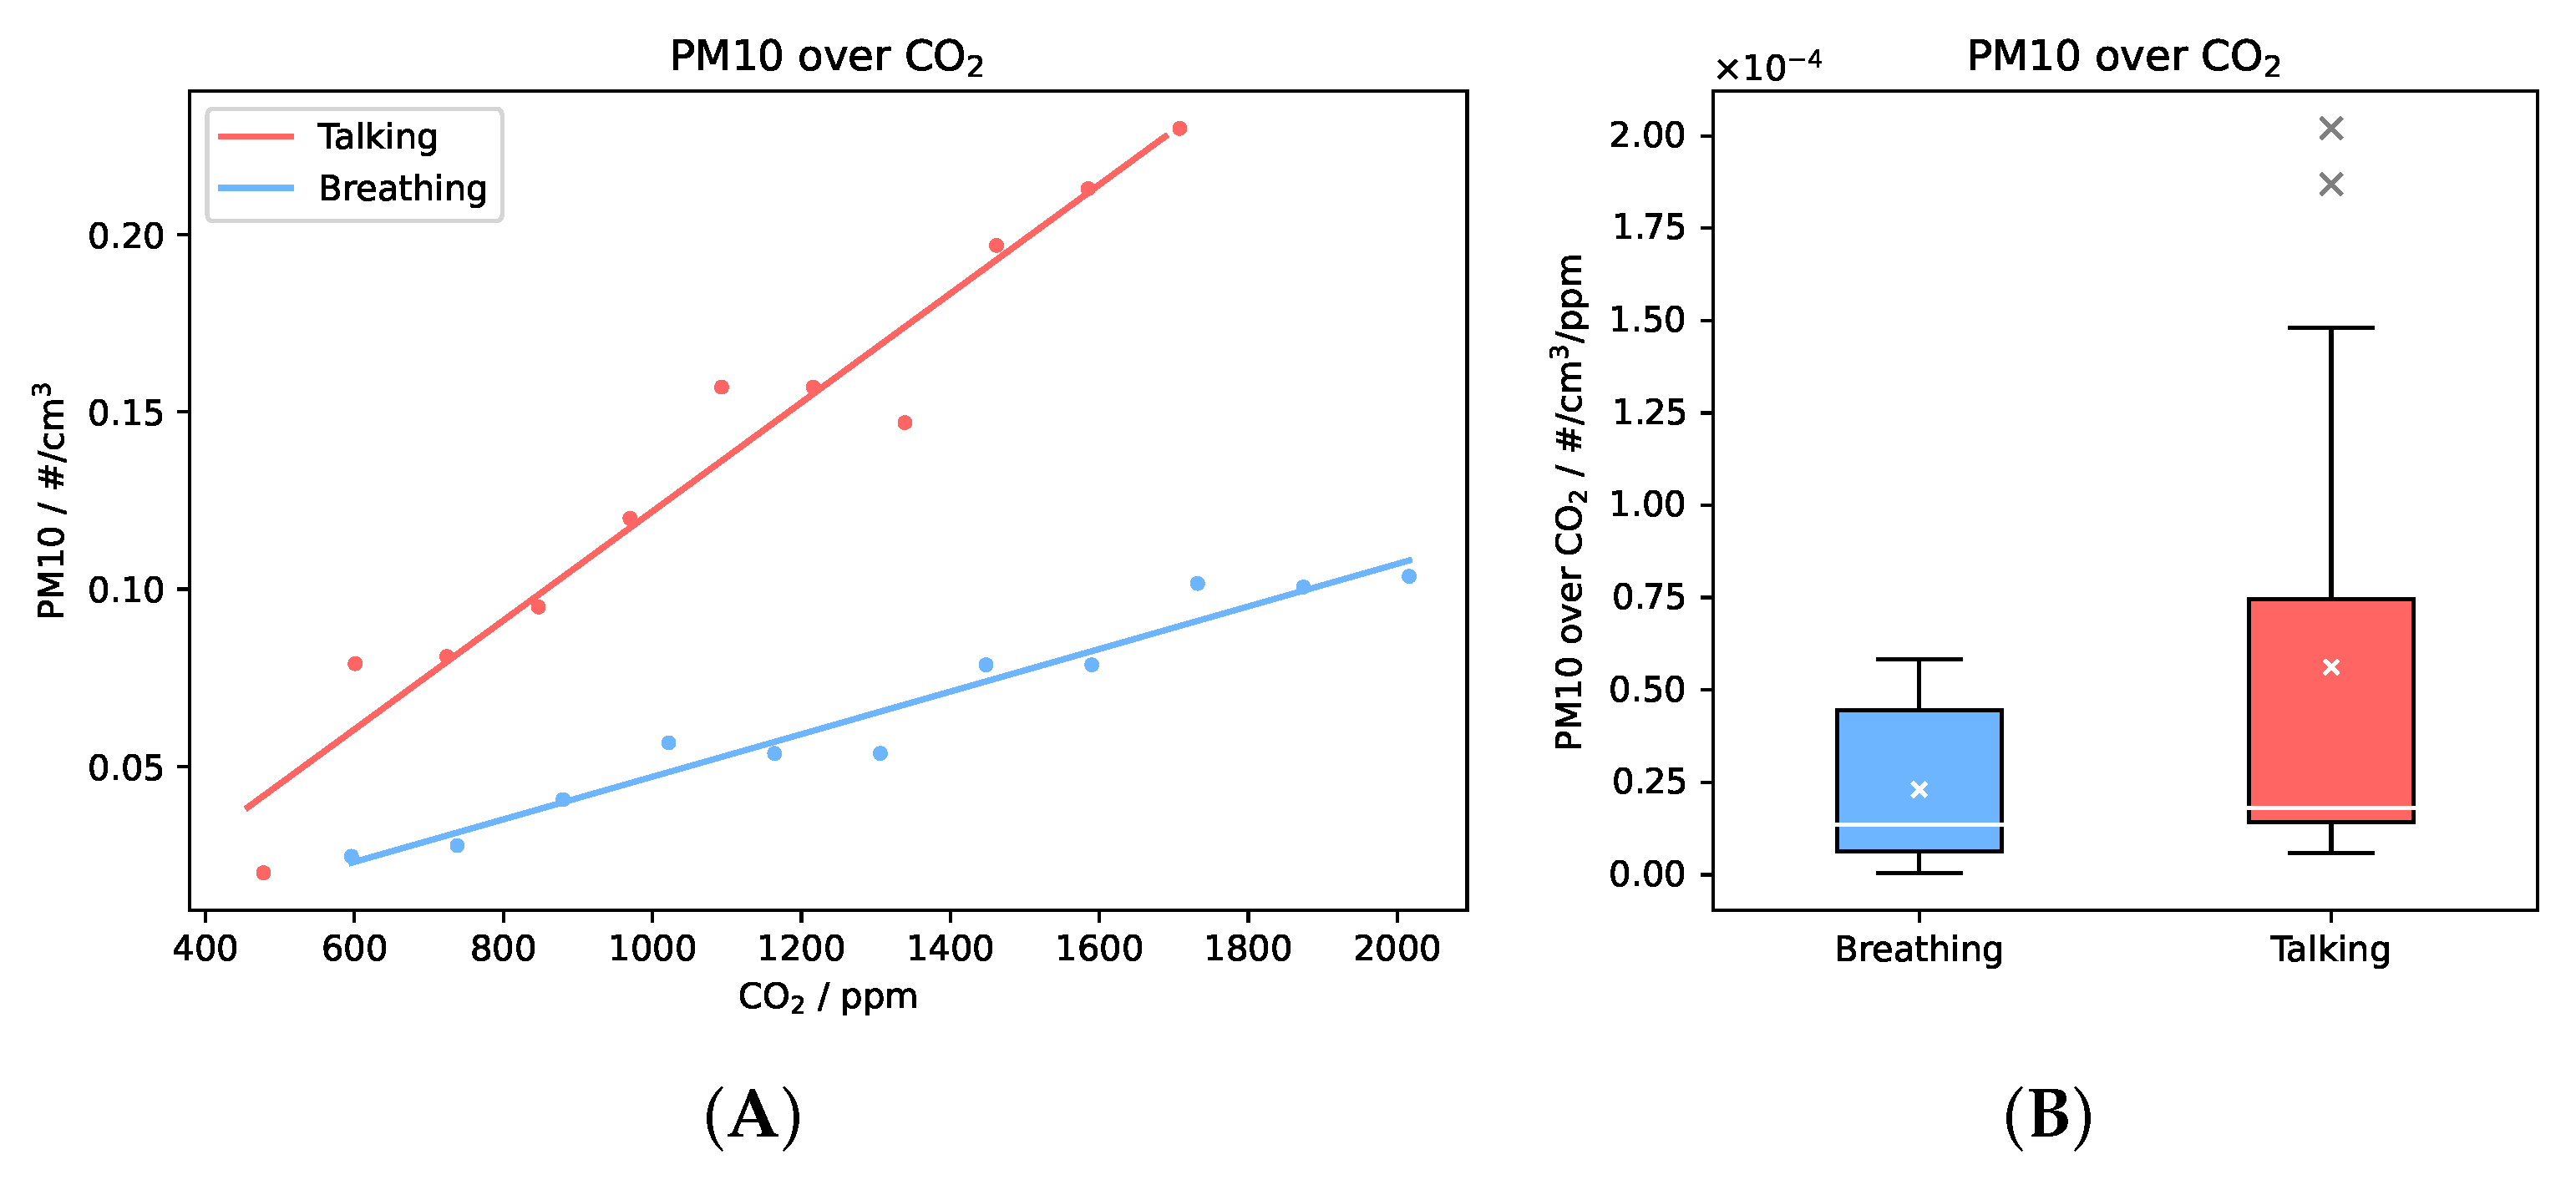
3.2. Correlation of Respiratory Aerosols and CO2 and Estimation of Suspended RNA
4. Discussion
Author Contributions
Funding
Institutional Review Board Statement
Informed Consent Statement
Data Availability Statement
Conflicts of Interest
References
- Morawska, L.; Milton, D.K. It Is Time to Address Airborne Transmission of Coronavirus Disease 2019 (COVID-19). Clin. Infect. Dis. 2020, 71, 2311–2313. [Google Scholar] [CrossRef] [PubMed]
- Morawska, L.; Johnson, G.R.; Ristovski, Z.D.; Hargreaves, M.; Mengersen, K.; Corbett, S.; Chao, C.Y.; Li, Y.; Katoshevski, D. Size distribution and sites of origin of droplets expelled from the human respiratory tract during expiratory activities. J. Aerosol Sci. 2009, 40, 256–269. [Google Scholar] [CrossRef] [Green Version]
- Asadi, S.; Wexler, A.S.; Cappa, C.D.; Barreda, S.; Bouvier, N.M.; Ristenpart, W.D. Aerosol emission and superemission during human speech increase with voice loudness. Sci. Rep. 2019, 9, 2348. [Google Scholar] [CrossRef] [PubMed] [Green Version]
- Holmgren, H.; Ljungström, E.; Almstrand, A.C.; Bake, B.; Olin, A.C. Size distribution of exhaled particles in the range from 0.01 to 2.0 μm. J. Aerosol Sci. 2010, 41, 439–446. [Google Scholar] [CrossRef]
- Xie, X.; Li, Y.; Chwang, A.T.; Ho, P.L.; Seto, W.H. How far droplets can move in indoor environments—Revisiting the Wells evaporation-falling curve. Indoor Air 2007, 17, 211–225. [Google Scholar] [CrossRef] [PubMed]
- Santarpia, J.L.; Rivera, D.N.; Herrera, V.L.; Morwitzer, M.J.; Creager, H.M.; Santarpia, G.W.; Crown, K.K.; Brett-Major, D.M.; Schnaubelt, E.R.; Broadhurst, M.J.; et al. Aerosol and surface contamination of SARS-CoV-2 observed in quarantine and isolation care. Sci. Rep. 2020, 10, 12732. [Google Scholar] [CrossRef]
- Liu, Y.; Ning, Z.; Chen, Y.; Guo, M.; Liu, Y.; Gali, N.K.; Sun, L.; Duan, Y.; Cai, J.; Westerdahl, D.; et al. Aerodynamic analysis of SARS-CoV-2 in two Wuhan hospitals. Nature 2020, 582, 557–560. [Google Scholar] [CrossRef]
- Van Doremalen, N.; Bushmaker, T.; Morris, D.H.; Holbrook, M.G.; Gamble, A.; Williamson, B.N.; Tamin, A.; Harcourt, J.L.; Thornburg, N.J.; Gerber, S.I.; et al. Aerosol and Surface Stability of SARS-CoV-2 as Compared with SARS-CoV-1. N. Engl. J. Med. 2020, 382, 1564–1567. [Google Scholar] [CrossRef]
- Yu, I.T.; Li, Y.; Wong, T.W.; Tam, W.; Chan, A.T.; Lee, J.H.; Leung, D.Y.; Ho, T. Evidence of Airborne Transmission of the Severe Acute Respiratory Syndrome Virus. N. Engl. J. Med. 2004, 350, 1731–1739. [Google Scholar] [CrossRef] [Green Version]
- Kim, S.H.; Chang, S.Y.; Sung, M.; Park, J.H.; Kim, H.B.; Lee, H.; Choi, J.P.; Choi, W.S.; Min, J.Y. Extensive Viable Middle East Respiratory Syndrome (MERS) Coronavirus Contamination in Air and Surrounding Environment in MERS Isolation Wards. Clin. Infect. Dis. 2016, 63, 363–369. [Google Scholar] [CrossRef] [Green Version]
- Yan, J.; Grantham, M.; Pantelic, J.; De Mesquita, P.J.B.; Albert, B.; Liu, F.; Ehrman, S.; Milton, D.K. Infectious virus in exhaled breath of symptomatic seasonal influenza cases from a college community. Proc. Natl. Acad. Sci. USA 2018, 115, 1081–1086. [Google Scholar] [CrossRef] [Green Version]
- Wölfel, R.; Corman, V.M.; Guggemos, W.; Seilmaier, M.; Zange, S.; Müller, M.A.; Niemeyer, D.; Jones, T.C.; Vollmar, P.; Rothe, C.; et al. Virological assessment of hospitalized patients with COVID-2019. Nature 2020, 581, 465–469. [Google Scholar] [CrossRef] [Green Version]
- Du, C.R.; Wang, S.C.; Yu, M.C.; Chiu, T.F.; Wang, J.Y.; Chuang, P.C.; Jou, R.; Chan, P.C.; Fang, C.T. Effect of ventilation improvement during a tuberculosis outbreak in underventilated university buildings. Indoor Air 2020, 30, 422–432. [Google Scholar] [CrossRef] [PubMed]
- Rudnick, S.N.; Milton, D.K. Risk of indoor airborne infection transmission estimated from carbon dioxide concentration. Indoor Air 2003, 13, 237–245. [Google Scholar] [CrossRef] [PubMed]
- Peng, Z.; Jimenez, J.L. Exhaled CO2 as a COVID-19 Infection Risk Proxy for Different Indoor Environments and Activities. Environ. Sci. Technol. Lett. 2021, 8, 392–397. [Google Scholar] [CrossRef]
- Harrichandra, A.; Ierardi, A.M.; Pavilonis, B. An estimation of airborne SARS-CoV-2 infection transmission risk in New York City nail salons. Toxicol. Ind. Health 2020, 36, 634–643. [Google Scholar] [CrossRef]
- Burrdige, H.C.; Fan, S.; Jones, R.L.; Noakes, C.J.; Linden, P. Predictive and retrospective modelling of airborne infection risk using monitored carbon dioxide. arXiv 2021, arXiv:2009.02999. [Google Scholar]
- Vouriot, C.V.M.; Burridge, H.C.; Noakes, C.J.; Linden, P.F. Seasonal variation in airborne infection risk in schools due to changes in ventilation inferred from monitored carbon dioxide. Indoor Air 2021, 31, 1154–1163. [Google Scholar] [CrossRef]
- Johnson, G.R.; Morawska, L.; Ristovski, Z.D.; Hargreaves, M.; Mengersen, K.; Chao, C.Y.; Wan, M.P.; Li, Y.; Xie, X.; Katoshevski, D.; et al. Modality of human expired aerosol size distributions. J. Aerosol Sci. 2011, 42, 839–851. [Google Scholar] [CrossRef]
- Deng, X.; Gong, G.; He, X.; Shi, X.; Mo, L. Control of Exhaled SARS-CoV-2-Laden Aerosols in the Interpersonal Breathing Microenvironment in a Ventilated Room with Limited Space Air Stability. J. Environ. Sci. (China) 2021, 108, 175–187. [Google Scholar] [CrossRef]
- Bhagat, R.K.; Wykes, M.S.D.; Dalziel, S.B.; Linden, P.F. Effects of ventilation on the indoor spread of COVID-19. J. Fluid Mech. 2020, 903. [Google Scholar] [CrossRef]
- Li, X.; Niu, J.; Gao, N. Co-Occupant’s Exposure to Exhaled Pollutants with Two Types of Personalized Ventilation Strategies under Mixing and Displacement Ventilation Systems. Indoor Air 2013, 23, 162–171. [Google Scholar] [CrossRef] [PubMed]
- Ai, Z.; Mak, C.M.; Gao, N.; Niu, J. Tracer Gas Is a Suitable Surrogate of Exhaled Droplet Nuclei for Studying Airborne Transmission in the Built Environment. Build. Simul. 2020, 13, 489–496. [Google Scholar] [CrossRef] [PubMed] [Green Version]
- Hudson, J.B.; Sharma, M.; Petric, M. Inactivation of Norovirus by ozone gas in conditions relevant to healthcare. J. Hosp. Infect. 2007, 66, 40–45. [Google Scholar] [CrossRef] [PubMed]
- Sharma, M.; Hudson, J.B. Ozone gas is an effective and practical antibacterial agent. Am. J. Infect. Control 2008, 36, 559–563. [Google Scholar] [CrossRef] [PubMed]
- Pedregosa, F.; Varoquaux, G.; Gramfort, A.; Michel, V.; Thirion, B.; Grisel, O.; Blondel, M.; Prettenhofer, P.; Weiss, R.; Dubourg, V.; et al. Scikit-learn: Machine Learning in Python. J. Mach. Learn. Res. 2011, 12, 2825–2830. [Google Scholar]
- Papieni, R.S.; Rosenthal, F.S. The Size Distribution of Droplets in the Exhaled Breath of Healthy Human Subjects. J. Aerosol Med. 1997, 10, 105–116. [Google Scholar] [CrossRef]
- Edwards, D.A.; Man, J.C.; Brand, P.; Katstra, J.P.; Sommerer, K.; Stone, H.A.; Warded, E.; Scheuch, G. Inhaling to mitigate exhaled bioaerosols. Proc. Natl. Acad. Sci. USA 2004, 101, 17383–17388. [Google Scholar] [CrossRef] [Green Version]
- Lloyd-Smith, J.O.; Schreiber, S.J.; Kopp, P.E.; Getz, W.M. Superspreading and the effect of individual variation on disease emergence. Nature 2005, 438, 355–359. [Google Scholar] [CrossRef]
- Miller, S.L.; Nazaroff, W.W.; Jimenez, J.L.; Boerstra, A.; Buonanno, G.; Dancer, S.J.; Kurnitski, J.; Marr, L.C.; Morawska, L.; Noakes, C. Transmission of SARS-CoV-2 by inhalation of respiratory aerosol in the Skagit Valley Chorale superspreading event. Indoor Air 2020, 31, 314–323. [Google Scholar] [CrossRef]
- Gupta, J.K.; Lin, C.H.; Chen, Q. Characterizing exhaled airflow from breathing and talking. Indoor Air 2010, 20, 31–39. [Google Scholar] [CrossRef] [PubMed]
- Patel, S.; Sankhyan, S.; Boedicker, E.K.; Decarlo, P.F.; Farmer, D.K.; Goldstein, A.H.; Katz, E.F.; Nazaroff, W.W.; Tian, Y.; Vanhanen, J.; et al. Indoor Particulate Matter during HOMEChem: Concentrations, Size Distributions, and Exposures. Environ. Sci. Technol. 2020, 54, 7107–7116. [Google Scholar] [CrossRef] [PubMed]


| Parameter | Breathing | Talking | Unit |
|---|---|---|---|
| rPM | 3.11 × 10⁻³ | 7.29 × 10⁻³ | cm−3 min−1 |
| (rPM) | 2.82 × 10⁻³ | 8.41 × 10⁻³ | cm−3 min−1 |
| (rPM) | 0.627 | 0.806 | |
| rPM,V | 9.26 × 10⁻³ | 1.12 × 10⁻¹ | μm3 cm−3 min−1 |
| (rPM,V) | 8.40 × 10⁻³ | 1.29 × 10⁻¹ | μm3 cm−3 min−1 |
| rCO2 | 143 | 139 | ppm min−1 |
| (rCO2) | 29.4 | 33.2 | ppm min−1 |
| (rCO2) | 0.998 | 0.998 |
| Parameter | Breathing | Talking | Unit |
|---|---|---|---|
| rPMCO2 | 2.30 × 10⁻⁵ | 5.62 × 10⁻⁵ | cm−3 ppm−1 |
| (rPMCO2) | 2.12 × 10⁻⁵ | 6.84 × 10⁻⁵ | cm−3 ppm−1 |
| rPMCO2,V | 6.85 × 10⁻⁵ | 8.65 × 10⁻⁴ | μm3 cm−3 ppm−1 |
| (rPMCO2,V) | 6.31 × 10⁻⁵ | 10.5 × 10⁻⁴ | μm3 cm−3 ppm−1 |
| rRNA | 4.8 × 10⁻⁴ | 6.1 × 10⁻³ | m−3 ppm−1 |
| rRNA,max | 0.16 | 2.0 | m−3 ppm−1 |
Publisher’s Note: MDPI stays neutral with regard to jurisdictional claims in published maps and institutional affiliations. |
© 2021 by the authors. Licensee MDPI, Basel, Switzerland. This article is an open access article distributed under the terms and conditions of the Creative Commons Attribution (CC BY) license (https://creativecommons.org/licenses/by/4.0/).
Share and Cite
Kappelt, N.; Russell, H.S.; Kwiatkowski, S.; Afshari, A.; Johnson, M.S. Correlation of Respiratory Aerosols and Metabolic Carbon Dioxide. Sustainability 2021, 13, 12203. https://doi.org/10.3390/su132112203
Kappelt N, Russell HS, Kwiatkowski S, Afshari A, Johnson MS. Correlation of Respiratory Aerosols and Metabolic Carbon Dioxide. Sustainability. 2021; 13(21):12203. https://doi.org/10.3390/su132112203
Chicago/Turabian StyleKappelt, Niklas, Hugo Savill Russell, Szymon Kwiatkowski, Alireza Afshari, and Matthew Stanley Johnson. 2021. "Correlation of Respiratory Aerosols and Metabolic Carbon Dioxide" Sustainability 13, no. 21: 12203. https://doi.org/10.3390/su132112203
APA StyleKappelt, N., Russell, H. S., Kwiatkowski, S., Afshari, A., & Johnson, M. S. (2021). Correlation of Respiratory Aerosols and Metabolic Carbon Dioxide. Sustainability, 13(21), 12203. https://doi.org/10.3390/su132112203