Abstract
Fagopyrum spp. (buckwheat) is a dicotyledonous pseudocereal crop mainly cultivated in the north-western Himalayan regions for its highly nutritional, antioxidant and therapeutic values. In the present investigation, molecular characterization was performed by using ISSR (inter simple sequence repeat) markers on 42 accessions of four buckwheat species (Fagopyrum esculentum, F. sagittatum, F. tataricum and F. kashmirianum). The 12 pre-screened ISSR primers amplified 102 bands, and amongst them 85 bands exhibited polymorphism with an average polymorphism of 82.73%. The results revealed that Shannon’s information indices (I) and Nei’s genetic diversity (H) were low for F. tataricum (I = 0.1028 ± 0.2307; H = 0.0707 ± 0.1617) and high for F. esculentum (I = 0.1715 ± 0.2622; H = 0.1164 ± 0.1796). It was estimated that within the accessions of Fagopyrum species, the species diversity (HT) and mean diversity (HS) were 0.3200 and 0.1041, respectively. Molecular variance partitioning by AMOVA also indicated a significant genetic differentiation accounting for 73% among and 27% within the accessions of Fagopyrum species. Overall, accessions of F. esculentum had the greatest distance from the other accessions of buckwheat species, which includes F. sagittatum, F. tataricum and F. kashmirianum as revealed by FST distance and Nei’s unbiased genetic distance. The dendograms based on UPGMA and PCoA segregated 42 accessions of four buckwheat species into three major groups. This study clearly reveals a considerable amount of genetic diversity at the intra-specific level in F. esculentum, F. sagittatum and F. kashmirianum accessions. The factors responsible for it are diverse geographical conditions, pollinating behavior and cultivation practices adapted in these regions. The study also indicated a close phylogenetic relationship between F. tataricum and F. kashmirianum.
1. Introduction
Fagopyrum spp. (buckwheat) is a minor pseudocereal food crop from the family of Polygonaceae consisting of about 26 species (wild and cultivated) known so far [1,2,3]. Its grains are enriched with flavonoids, especially rutin (3,3′,4′,5,7-pentahydroxyflavone-3-rhamnoglucoside) and some vitamins (B1: thiamine; B2: riboflavin; B3: niacin; B6: pyridoxine; C: ascorbic acid and E: tocopherol). The biological value (BV) is higher due to presence of essential amino acids, particularly lysine, valine, tryptophan, arginine, threonine, isoleucine, leucine, phenylalanine and sulfur-containing amino acids such as cysteine and methionine [4,5,6]. The flowers of buckwheat during blossoming are enriched with a high quantity of flavonoids, especially rutin or sophorin which is known for anticancer, anti-mutagenic, antioxidant, antidiabetic, anti-inflammatory, anti-bacterial, anti-fungal, neuroprotective, cardioprotective, hepato-protective, nephron-protective, haemato-protective, anti-arthritis and anthelminthic properties [7,8,9,10,11]. Consequently, it has immense value in the functional food industry due to its unique nutritional status and considerable nutraceutical properties, which makes it a smart candidate for future crops. However, it is a minor crop and received little attention so far, especially in developing nations where it holds a great diversity in terms of species diversity, growth pattern and development. Despite having considerable genetic variation in the Fagopyrum genus, no significant contribution has been made in the development of improved cultivars. To address this problem, there is an urgent need to develop global databases and core collections of accessions available in the seed/genebanks for organized evaluation to decipher the enormous genetic ability of buckwheat germplasm. Although, due to inter-specific crossing between genetically distant buckwheat species, small achievements have been made, more efforts are needed to overcome certain barriers. Moreover, inter-specific crossing between wild and cultivated forms of buckwheat can help in the transfer of some of the desirable agronomic traits in the latter. For instance, the wild relatives of F. cymosum, F. urophyllum and F. gracilipes consist of a high content of amino acids, proteins, phenols and flavonoids in comparison to cultivated species (F. esculentum and F. tataricum), and these characteristics (genetic variations) could be utilized for crop improvement programmes of buckwheat [12].
Buckwheat has been first reported to be grown in China around 1000 BC, and from here it was introduced to other parts of the world [13,14]. It is still being cultivated throughout the world, especially in high altitude mountainous regions possessing diverse topography. This is of great advantage as it conserves the diversity in the germplasm of different buckwheat species. The assessment of genetic diversity is an important aspect of any program aimed at improving crops. Relationships and variability within and among the accessions/landraces of buckwheat species and their population structure have been elucidated by using a wide range of molecular markers, viz., allozymes [15,16], RFLP (restriction fragment length polymorphism) [17], ITS (internal transcribed spacer) and the conserved sequences based on mitochondrial and chloroplast DNA [18,19,20], RAPD (random amplified polymorphic DNA) [21,22,23], AFLP (amplified fragment length polymorphism) [24,25,26], SSR (simple sequence repeats) [27,28], SRAP (sequence-related amplified polymorphism) [29] and STS (sequence-tagged site) [30]. The markers based on ISSRs are quite efficient for determining genetic diversity at low levels. It is a promising DNA based dominant marker system for studying genetic diversity, population genetics, gene tagging, genome mapping, phylogeny and evolutionary biology in many plant species [31]. In some ways, the ISSR marker technique has alleviated the limitations of RAPD (low reproducibility), AFLP (high cost) and creates species-specific primers for SSR markers [32]. ISSR is an arbitrarily primed PCR-based technique first reported by Zietkiewicz et al. [33] in which the primers amplify the sequences between two microsatellite regions, producing a multi-locus marker system that is useful for the identification of species, genotypes, cultivars or populations and for evaluating genetic variation at intra-and inter-specific level [34,35]. It involves primers that are based on repeat sequences along with a selective nucleotide degenerate 3′ anchor, such as (CA)6 RG or (ACG)8TY. Furthermore, ISSR markers use longer primers, usually 16–25 mer, as opposed to 10 mer primers in RAPD, which allows higher annealing temperatures and, thus, improves reproducibility [32,33].
There is great significance with respect to inter-specific hybridization among Fagopyrum species as it allows the transfer of agronomically important traits such as cold tolerance, enhanced fertility, low seed shattering, increased content of rutin and other neutraceutically important compounds from domesticated and wild relatives of Fagopyrum species. Furthermore, genome mapping and conventional breeding are the essential biotechnological tools that are important in the crop improvement of buckwheat germplasm through the identification and transfer of important genetic traits within and among the species [36,37]. Studies based on various types of molecular markers in sweet buckwheat (F. esculentum Moench) revealed that its local populations are actually represented as highly heterozygous and heterogeneous. Moreover, it has also been reported that certain South-European landraces exhibit a lower amount of genetic variation when compared to Asian and North-European landraces in addition to greater genetic differentiation that can even be visualized as variations in seed groat colour [38].
The genus Fagopyrum is represented in Kashmir and Ladakh regions by four distinct cultivated species consisting of sweet (F. esculentum Moench), bitter (F. tataricum Gilib), coarse (F. sagittatum Gaertn) and kashmir (F. kashmirianum Munshi) buckwheats [39,40]. Although in contrast to the mixed cropping used in other areas of India, buckwheat is more commonly grown as a healthy crop in the north-western Himalayan region. It has been recently reported that buckwheat species grown in these regions are enriched with significant concentrations of phenolic and flavonoid compounds, in addition to possessing higher antioxidant potential and essential macro-and micronutrients revealing their therapeutic value and, therefore, can be considered as a potential crop for bio-fortification [41]. In light of the above, this study used ISSR markers to analyse intra-specific and inter-specific variability as well as population structure of four buckwheat species grown in these regions.
2. Materials and Methods
2.1. Plant Materials
The accessions of buckwheat species (F. esculentum M., F. sagittatum G., F. tataricum G. and F. kashmirianum M.) were collected from several locations of Gurez, Kargil and Leh districts of Kashmir and Ladakh regions (Jammu and Kashmir (UT) and Ladakh (UT), India) as shown in Figure 1. In this experiment, 42 accessions from four different buckwheat species were used to perform genetic analysis utilising inter simple sequence repeat (ISSR) DNA based markers. These include 16 accessions of F. esculentum (FESG1, FESG2, FESG3, FESG4, FESG5, FESG6, FESK1, FESK2, FESK3, FESK4, FESK5, FESK6, FESL1, FESL2, FESL5 and FESL6), 11 accessions of F. sagittatum (FSGG1, FSGG4, FSGK3, FSGK4, FSGK5, FSGK6, FSGL1, FSGL2, FSGL3, FSGL4 and FSGL5), 9 accessions of F. tataricum (FTRG2, FTRG4, FTRG6, FTRK1, FTRK4, FTRK6, FTRL1, FTRL2 and FTRL5) and 6 accessions of F. kashmirianum (FKMG1, FKMG4, FKMK1, FKMK3, FKML3 and FKML5). The identification based data on the accessions of Fagopyrum species are presented in Table 1. Initially, the seeds were kept in petri-plates, and a few drops of distilled water were added to check their germination. A total of five to eight seeds of each accession of buckwheat species were sown in labeled plastic pots containing soil and sand in a 2:1 ratio for germination to obtain leaf material for genomic DNA extraction. Labeled plastic pots were placed in the growth chamber at the Department of Bioresources, University of Kashmir, and monitored regularly for seed germination. On the fourteenth day, as the seedlings attained a height of 12–25 cm, young and tender leaves were harvested for DNA extraction. Immediately after harvesting, the leaf material was wrapped in aluminum foils and stored (−80 °C) until the extraction of DNA was performed.
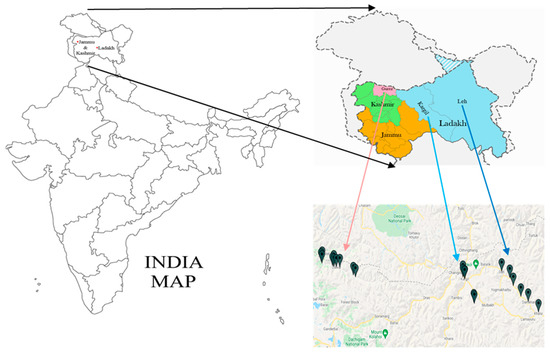
Figure 1.
Distribution map of collection sites of accessions of buckwheat species procured from Kashmir (district Gurez) and Ladakh (districts: Kargil and Leh) regions.

Table 1.
The collection sites of buckwheat accessions along with coordinates.
2.2. DNA Isolation
Total genomic DNA extraction was performed on the young tender leaves of different accessions of Fagopyrum species by following the Cetyltrimethyl Ammonium Bromide (CTAB) method proposed by Allen et al. [42] with some modifications. The purified DNA concentration was determined by comparing intensities of the sample bands with a band of uncut Lambda DNA (300 ng/µL, Merck Biosciences), which was loaded in parallel with the samples of these buckwheat species (Figure 2). For PCR amplification, each sample was diluted to 20 ng/µL concentration.
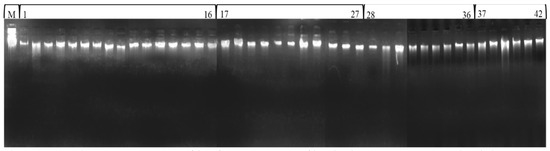
Figure 2.
Total genomic DNA profile of 42 accessions of buckwheat species (uncut lambda DNA M, F. esculentum 1–16, F. sagittatum 17–27, F. tataricum 28–36 and F. kashmirianum 37–42).
2.3. Optimization of PCR Program and ISSR Marker Analysis
ISSR fingerprinting was performed with 12 randomly selected 15–20 mer primers, either anchored or unanchored by arbitrary and often degenerate nucleotides, at the 3′ and 5′ end of microsatellites. ISSR, which is a DNA-based PCR marker, was employed to examine the degree of variation in the accessions of Fagopyrum species. The reaction volume of 20 uL comprised genomic DNA (40 ng), 1 X Taq buffer, MgCl2 (3 mM), dNTPs (0.2 mM), Primers (0.5 mM) and Taq polymerase (0.5 U) (Merck Biosciences). PCR amplification was performed in a Mastercycler (SureCycler 8800, Agilent Technologies) by using the thermal cycling conditions such as initial denaturation (94 °C; 3 min) followed by 35 cycles with denaturation (94 °C; 1 min), annealing ™ (44–61 °C for 1 min) depending upon primers used, extension (72 °C; 2 min) and a final extension (72 °C; 7 min). The PCR amplified products were run on agarose gel (1.8 percent (w/v)) at 75–80 V for roughly 2 h, following which the gels were imaged with a gel documentation device (UVC-1200, Major Science).
2.4. Scoring of Bands and Data Analysis
The bands were represented as (1) or (0) depending upon their presence or absence. In this study, the bands that were consistently showing on replicates and reproducible on separate runs were included.
Polymorphisms revealed by ISSR markers were used to evaluate the amount of genetic heterogeneity present at intra-specific and inter-specific levels in buckwheat species. POPGENE (Population Genetic Analysis software version 1.32) was used to calculate percentage polymorphic bands (PPB), Nei’s genetic diversity (H), Shannon’s information index of phenotypic diversity (I), coefficient of genetic differentiation (GST), degree of gene flow (Nm) and Nei’s unbiased genetic distance coefficient [43]. Nei’s molecular genetic diversity (related to expected heterozygosity) was computed for each marker locus as well as entire loci as H = 1 − Σ pi2 (pi = frequency of a given amplicon) [44]. Using Shannon’s information index, the phenotypic diversity of marker alleles was calculated as I = −Σ pi2 log pi2 [45,46]. The total genetic diversity (HT) and intra-specific genetic diversity (HS) were measured using Nei’s genetic diversity statistics [44]. In order to measure distinction among populations at gene level, the coefficient of gene differentiation (GST) is used to calculate GST= 1 − HS/HT. Gene flow is defined as the average per generation of migrants transferred across populations and calculated as Nm = 0.5 × (1 − GST)/GST. Here, Nm < 1 implies that populations are differentiated locally, whereas Nm > 1 shows that populations are not differentiated at all [47]. The population’s genetic divergence (GD) was estimated by Nei’s unbiased genetic distances and genetic identities [48]. For buckwheat accessions, Nei’s unbiased genetic distances were computed, and a dendrogram was constructed by UPGMA and cluster analysis by PHYLIP (version 3.5) [49]. The UPGMA tree was viewed with TreeViewX (version 0.5.0) [50]. The data matrix samples were also subjected to a bootstrap statistical analysis with 1000 resampling replicates to determine their stability.
Furthermore, FST (fixation index) and AMOVA (analysis of molecular variance) were estimated using software GenAlEx (Genetic Analysis in Excel) version 6.502 [51]. The proportionate depletion in overall heterozygosity because of differences in ISSR allele frequencies across distinct sub-populations is the FST measure of the genetic effect of the entire population subdivision (i.e., accessions of buckwheat species) [52]. AMOVA was performed to partition genetic variation at intra-specific and inter-specific levels in the accessions of buckwheat species based on pair-wise squared Euclidean distances between molecular haplotypes [53].
DARwin (Dissimilarity Analysis and Representation for Windows, version 6.0.21) was used to analyse genetic dissimilarity by using the binary data matrix produced [54]. A dendrogram was created using data from the UPGMA dissimilarity matrix. DARwin was also used for principal coordinate analysis (PCoA) on the dissimilarity matrix generated by ISSR data.
3. Results
3.1. Data Scoring and Polymorphism
ISSR is a DNA based marker technique that provides a simple, robust and inexpensive method of fingerprinting buckwheat germplasm. Based on the consistency of amplification, readability and scoring of amplicons or bands, 12 of the 30 random ISSR primers tested were chosen for diversity analysis. All ISSR reactions were repeated at least twice to assess the repeatability of the amplification profiles. The PCR primers were run on 1.8% (w/v) agarose gel at 75–80 V for two hours. The gel was finally analysed for banding patterns by using gel documentation unit, and the bands or loci were scored (Figure 3). The amplification of primers generated 102 identifiable bands, of which 85 (83.33%) were polymorphic and 17 (16.66%) were monomorphic. The number of amplicons per primer varied between 6 (UBC 854) and 12 (UBC 888). The amplicons ranged in size from 250 to 3000 bp, with an average of 8.5 bands per primer and 7.08 polymorphic bands. UBC 888 amplified the most polymorphic bands out of all the ISSR primers tested. The polymorphism percentage ranged from 57.14% for UBC 855 to 100% for UBC 856. The GA, TC, AC, ACC, GGAGA, AG and CA repeat motifs displayed above 80% polymorphism (Table 2). An examination of 42 accessions from four buckwheat species using 12 pre-screened ISSR primers produced 102 amplicons of which 18 (17.65) in F. tataricum to 33 (32.35%) in F. esculentum were polymorphic among the accessions of buckwheat species (Table 3).
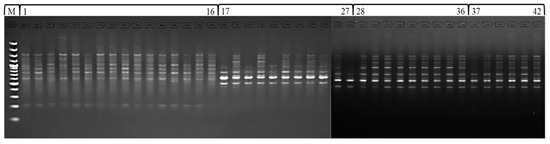
Figure 3.
ISSR amplification profile of 42 accessions of buckwheat species (100 bp DNA ladder M, F. esculentum 1–16, F. sagittatum 17–27, F. tataricum 28–36 and F. kashmirianum 37–42).
Table 2.
ISSR primer details used for detecting polymorphism levels.
Table 3.
Percentage of polymorphic bands (PPB), Nei’s genetic diversity (H) and Shannon’s information indices (I) for ISSR data in Fagopyrum species.
3.2. Analysis of Genetic Diversity by ISSR Markers
In order to analyse genetic diversity both within and among the accessions of buckwheat species gathered from multiple geographical locations in Kashmir and Ladakh, ISSR markers were utilized. Analysis of ISSR data revealed that accessions of Fagopyrum tataricum (TR) showed the lowest frequency of percentage polymorphic bands (17.65%), whereas accessions of Fagopyrum esculentum (ES) exhibited the highest frequency of percentage polymorphic bands (32.35%) with an average of PPB (26.23%) as shown in Table 3. Similarly, Shannon’s information indices of phenotypic diversity (I) and Nei’s genetic diversity (H) were low for accessions of F. tataricum (I = 0.1028 ± 0.2307; H = 0.0707 ± 0.1617) and high for accessions of F. esculentum (I = 0.1715 ± 0.2622; H = 0.1164 ± 0.1796). The average values of Shannon’s information indices of phenotypic diversity (I) and Nei’s genetic diversity (H) were (I = 0.1521 ± 0.2622; H = 0.1041 ± 0.1826) as depicted in Table 3.
Based on the results of Nei’s genetic diversity within and among the accessions of Fagopyrum species, a substantial degree of genetic difference was identified. Nei’s diversity index based analysis provides the information about total species diversity (HT), its estimated value was 0.3200. Moreover, mean diversity within accessions of Fagopyrum species (HS) was at an estimated value of 0.1041, as shown in Table 4. The proportion of diversity among the accessions of Fagopyrum species (GST) also referred to as the coefficient of genetic differentiation was found to be 0.6747, suggesting that 67.47% of the genetic diversity was disseminated among the buckwheat species. The latter comprised 0.3253 amount of the total diversity i.e., 32.53% of the total diversity was contributed within the accessions of Fagopyrum species. Limited gene flow (Nm = 0.2411) and low seed dispersion among the cultivars further showed a significant level of genetic diversity.
Table 4.
Nei’s estimates of total genetic diversity, intra-specific genetic diversity, proportion of diversity within and among the accessions and degree of gene flow in Fagopyrum species.
AMOVA revealed comparable findings with 27% variation existed within the accessions of Fagopyrum species, which was statistically significant at p < 0.01, whereas 73% of total molecular variance was observed among the accessions of buckwheat species as depicted in Table 5.
Table 5.
Analysis of molecular variance (AMOVA) of ISSR data from accessions of Fagopyrum species.
The FST (fixation index) distance between accessions of Fagopyrum species ranged from 0.618 (between F. kashmirianum (KM) and F. tataricum (TR)) to 0.898 (between F. tataricum (TR) and F. esculentum (ES)), as depicted in Table 6. Nei’s unbiased measure of genetic distance between accessions of Fagopyrum species ranged from 0.1607 (between F. kashmirianum (KM) and F. tataricum (TR)) to 0.6701 (between F. tataricum (TR) and F. esculentum (ES)), as shown in Table 7. Overall, accessions of Fagopyrum esculentum (ES) had the greatest distance from the other accessions of Fagopyrum species, which includes F. sagittatum (SG), F. tataricum (TR) and F. kashmirianum (KM). Using the POPGENE programme, a dendrogram was created by using the same distance matrix. In this dendrogram, the accessions of buckwheat species are represented as a single unit. The accessions of buckwheat species were partitioned into two primary groups using a UPGMA dendrogram based on distance matrix (Figure 4). Group-I comprised the accessions of F. esculentum, and group-II consisted of the remaining accessions of the buckwheat species (F. sagittatum, F. tataricum and F. kashmirianum). Group-I is based on the collections procured from different locations of Kashmir and Ladakh revealing variations due to independent domestications, altitudinal ranges and intra-species differences. Similarly, group-II is based on the collections of F. sagittatum, F. tataricum and F. kashmirianum suggesting that these three species are closely related as they may share some of the important ancestral traits.
Table 6.
FST distances among accessions of Fagopyrum species.
Table 7.
Nei’s unbiased measures of genetic identity and distance among the accessions of Fagopyrum species.
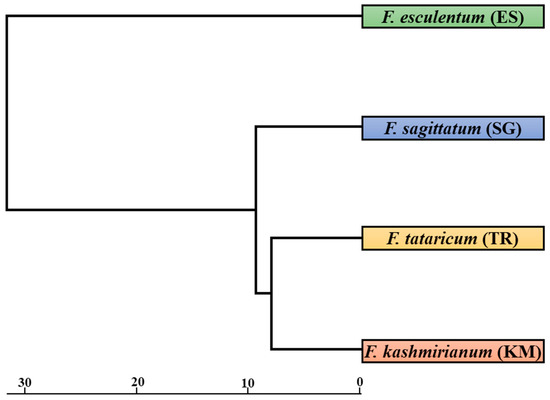
Figure 4.
UPGMA dendrogram based on Nei’s genetic diversity coefficient showing relationships among accessions of buckwheat species. Bootstrap analysis was conducted with 1000 bootstrap samples in the data matrix.
Principal coordinate analysis (PCoA) and UPGMA radial and hierarchical dendrograms were constructed using the DARwin program. The PCoA plot genetically differentiated accessions of buckwheat species into their respective groups along the coordinate axes (Figure 5). The accessions of F. esculentum were more dispersed in comparison to accessions of F. sagittatum and formed separate groups. However, the accessions of F. tataricum and F. kashmirianum were less dispersed and shared the same group in the coordinate axes.
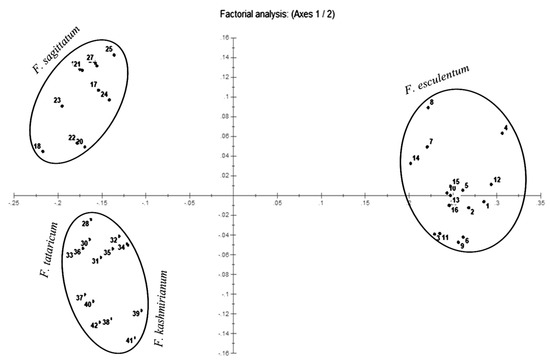
Figure 5.
PCoA plot constructed with 42 accessions of Fagopyrum species on the basis of ISSR marker data.
DARwin based UPGMA dendrogram also resolved 42 accessions of buckwheat species into three groups and four major clusters, respectively (Figure 6A,B). These clusters were exclusively formed based on genetic differences present in the accessions of respective buckwheat species. Cluster-I comprised a total of 16 accessions of F. esculentum, cluster-II had 9 accessions of F. tataricum, cluster-III had 6 accessions of F. kashmirianum and cluster-IV had 11 accessions of F. sagittatum. Based on genetic variations among the accessions, these four primary clusters create sub-clusters. The clustering of accessions of buckwheat species into three groups exhibited reasonable variability, which may be further exploited for the improvement of buckwheat genetic resources.
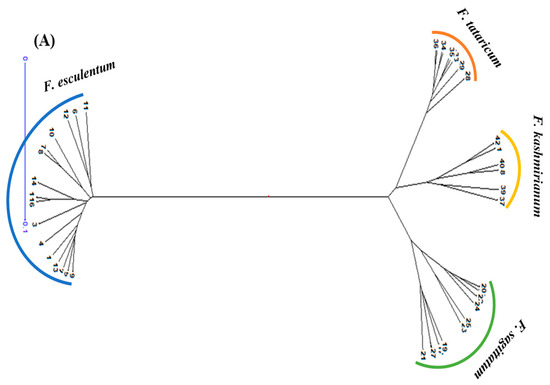
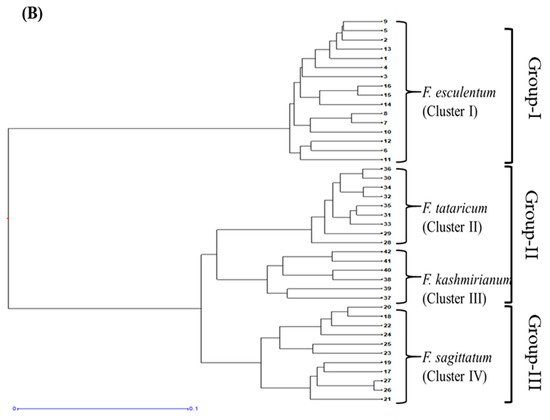
Figure 6.
UPGMA based dendograms (A) radial and (B) hierarchical of 42 accessions of Fagopyrum species on the basis of ISSR marker data using Jaccard’s dissimilarity coefficient.
4. Discussion
In the present study, 42 accessions of four buckwheat species (F. esculentum, F. sagittatum, F. tataricum and F. kashmirianum) were collected from Kashmir (Gurez district) and Ladakh (Kargil and Leh districts) in order to acquire a deeper insight into their population structure and genetic variability at the species level. The present investigation utilizing ISSR markers revealed the availability of considerable polymorphism for the development of buckwheat cultivars by assessing the extent and distribution of genetic variability, as well as percentage polymorphic bands (PPB). The genetic structure of buckwheat species also provides an idea about the various interactive processes including its long-term evolutionary history (changes in distribution pattern, habitat isolation, species variation and population structure) in addition to mating strategy, mutation, genetic drift, selection and gene flow. Moreover, the ecological and geographical distributions also influence the genetic diversity of different plant species [55].
4.1. Genetic Variability at Intra-Specific and Inter-Specific Level in Fagopyrum Species
The genome of Fagopyrum species indicated a high amount of allelic genetic variation, variety and differentiation. The extent of variation observed has been based on geographical distribution, fertilization, habitat isolation, gene flow and selection pressure that results in the evolution of genotypes in divergent agro-ecological zones. The data obtained using 12 ISSR primers presented different levels of percentage polymorphic bands (PPB) as F. esculentum (32.35%), F. sagittatum (28.43%), F. tataricum (17.65%) and F. kashmirianum (26.47%) within the accessions of buckwheat species (Table 3). This suggests that accessions of F. esculentum, F. sagittatum and F. kashmirianum exhibited significant levels of genetic variation in comparison to accessions of F. tataricum during the present study. This significant level of percentage polymorphism and genetic variation within the accessions (F. esculentum, F. sagittatum and F. kashmirianum) may be attributed to its diverse geographical distribution, pollinating behaviour, biological traits and selection pressure. Conversely, a comparatively low level of percentage polymorphism and genetic variability within the accessions of F. tataricum may be due to its declined cultivation among farmers, least consumption rate, self-pollination and absence of germplasm exchange among farmers. In addition, low levels of genetic diversity in plant species depend upon various factors from breeding systems, seed dispersal mechanism, altitudinal/geographical ranges and natural selection. It has been considered that altitudinal/geographical ranges play a crucial role in the maintenance of genetic variation among most of the factors mentioned above [56,57]. Thus, a close relationship has been found within the populations/accessions collected from similar locations having the same environmental conditions followed by seed exchange among these regions. These geographical variables result in the populations/accessions having a restricted genetic base. Furthermore, a certain geographic region may possess stable ecological characteristics, and low temperature may be a decisive factor in this case. Other variables that might contribute to limited intra-specific genetic diversity include altitude fluctuation and human involvement. Moreover, it has also been reported that cross-pollinating plant species tend to exhibit more diversity within populations than species that are mostly self-pollinating and genetically less diverse [58,59]. In the case of accessions of F. tataricum, which is a self-pollinating plant species, and, thus, exhibits a comparatively low level of genetic variation in addition to the factors discussed above, although the accessions were collected from diverse ecological sites. In this study, the ISSR markers that worked on accessions of buckwheat species proved to be quite efficient in detecting the significant level of polymorphism percentage (Table 2). Given the advantages of ISSR markers, the present study was based on genetic diversity and relationships within and among the accessions of buckwheat species (Figure 3). Furthermore, the use of pre-screened and randomly selected highly informative primers contributed to the study’s effectiveness in detecting significant polymorphism.
Furthermore, Nei’s genetic diversity (H) and Shannon’s information indices (I) values suggested that a significant amount of genetic variation present within the accessions of buckwheat species. Nei’s genetic diversity (H) and Shannon’s information indices (I) were significantly high within the accessions of F. esculentum (H = 0.1164; I = 0.1715), F. sagittatum (H = 0.1144; I = 0.1691) and F. kashmirianum (H = 1149; I = 0.1649). However, both the values were comparatively low within the accessions of F. tataricum (H = 0.0707; I = 0.1028), as depicted in Table 3. Likewise, the genetic diversity of 10 wild and 2 cultivated buckwheat species including four newly discovered wild species from South-Western Sichuan buckwheats has been analysed using karyotypes, allozymes and ISSR markers, which revealed a high degree of genetic variation especially among South-Western Sichuan buckwheats due to the complex domestication process in this crop [60]. Similar results were obtained from the genetic variability study in Tartary buckwheat using SSR and ISSR markers [61,62]. Furthermore, using a set of eight nuclear SSR markers, molecular characterization of 11 accessions of common buckwheat (Fagopyrum esculentum Moench), 9 from Italy and 2 from Poland and Nepal revealed that the majority of genetic diversity was found within populations of common buckwheat [38].
The values of Nei’s genetic diversity (H) at the intra-specific and inter-specific levels are the indicators of total genetic polymorphism present in the species. The Nei’s genetic diversity (H) revealed that total species diversity (HT = 0.3200) has been significantly higher than intra-specific genetic diversity (HS = 0.1040), signifying the distinctiveness of each species analysed in this study. It is, therefore, not unexpected to find the low extent of diversity existing at the intra-specific level (32.53%) than at the inter-specific level (67.47%) during the present study (Table 4). When the findings of this study have been compared to the results of AMOVA, it has been observed that 27% of variation existed within the accessions of buckwheat species (intra-specific diversity), whereas 73% of variation existed among the accessions of buckwheat species (inter-specific diversity) and thereby confirmed the above findings (Table 5). The coefficient of genetic differentiation value (GST = 0.6747) also indicates that a significant degree of genetic variation has been distributed across the accessions of Fagopyrum species. Similar findings have been reported on 27 cultivars (5 of F. tataricum and 22 of F. esculentum) of buckwheat species collected from diverse geographical areas of the world which indicated significant intra-specific polymorphism using ISSR markers. It has also been reported from the same study that domestic cultivars of F. esculentum exhibited greater inter-varietal polymorphism than wild forms [63]. Senthilkumaran et al. [64] made a similar finding while evaluating the genetic diversity of F. esculentum, F. tataricum and F. cymosum accessions by using phenotypic and RAPD markers. These regions also follow conventional agricultural practices and utilizing the stored germplasm in succeeding generations without any germplasm exchange, which may contribute to maintaining its genetic diversity through stabilization of specific local adaptations [62,65,66].
A rather high amount of genetic variation was identified among the accessions of the Fagopyrum species in this study (Table 4 and Table 5). Analysis of ISSR data using various statistical software programs such as Popgene, GenAlEx and DARwin ascertained comparable findings about the genetic structure of the buckwheat species. One of the major reasons for a higher level of genetic diversity amongst the buckwheat accessions is the inter-specific genetics and also the contributions made from altitudinal/geographical ranges. In order to retain their wide geographic spread, plants of a specific species must adapt to a variety of environmental conditions. Consequently, many common species have evolved into a succession of ecological races or exhibit significant phenotypic flexibility as a result of their great genetic variety [67,68]. As a result, the level of genetic variability present in a plant species, as well as its distribution, is a critical element in determining its long-term viability, fitness and evolutionary potential [69].
The presence of genetic variations as reflected by the varying number of alleles at each locus and their frequency of distribution determines the amount of polymorphism in a given species or population. Heterozygosity refers to the chance of utilizing DNA-based molecular markers to identify two alleles randomly selected from a population. Thus, Nei’s genetic diversity (H), Shannon’s information index (I), coefficient of genetic differentiation (GST) and estimate of gene flow (Nm) in plant populations may be used to provide a quantitative assessment of marker utility and polymorphism identified. Moreover, it has been proposed that plants adjust variously to selection pressures in diverse environments [62].
4.2. Relationship at Intra-Specific and Inter-Specific Level in Fagopyrum Species
The present study revealed that the FST (fixation index) distance between accessions of buckwheat species ranged from 0.618 (between accessions of F. kashmirianum (KM) and F. tataricum (TR)) to 0.898 (between accessions of F. tataricum (TR) and F. esculentum (ES)), as shown in Table 6. Similarly, Nei’s unbiased measures of genetic distance between accessions of buckwheat species ranged from 0.1607 (between accessions of F. kashmirianum (KM) and F. tataricum(TR)) to 0.6701 (between accessions of F. tataricum (TR) and F. esculentum (ES)) (Table 7). Thus, the values from both the analyses indicated that accessions of F. esculentum have the greatest distance from the other accessions of F. sagittatum, F. kashmirianum and F. tataricum. UPGMA dendrogram also indicated that accessions of F. esculentum are genetically most distant as compared to other accessions of buckwheat species (Figure 4). Its unusual genetic architecture can be attributed to several factors including cross-pollinating nature and can even be confirmed by its unique morphological features than the other species of buckwheat.
PCoA combined with cluster analysis is a powerful method for extracting valuable details from molecular data. Principal coordinate analysis (PCoA) revealed the distribution pattern of accessions of buckwheat species along the 2D-coordinate axes. Accessions of F. esculentum have been distributed on one side of the coordinate axes and also exhibit more dispersion in comparison to the accessions of other species. Conversely, accessions of F. sagittatum, F. tataricum and F. kashmirianum have been distributed on the other side of the coordinate axes (Figure 5). Moreover, the accessions of F. tataricum and F. kashmirianum have been closely dispersed and shared the same space along with the coordinate system. This indicates that the genetic similarity shared by the accessions of Fagopyrum tataricum and Fagopyrum kashmirianum, respectively. Conversely, the UPGMA dendrogram based on Jaccard’s dissimilarity coefficient grouped the 42 accessions of buckwheat species into four major clusters and three groups. Cluster-I comprised the accessions of F. esculentum, cluster-II comprised F. tataricum, cluster-III comprised F. kashmirianum and cluster-IV comprised F. sagittatum (Figure 6). Here, the accessions of F. tataricum and F. kashmirianum have also been grouped as they are evolving from the same root of UPGMA dendrogram indicating that they might have descended from the common ancestor. Moreover, different accessions collected from various sites of each species were assembled into the same major cluster. In general, the results obtained from PCoA and cluster analysis complemented one another during the present study. Similar observations were made during morphological characterization of 18 F. esculentum Moench and 18 F. sagittatum Gilib accessions gathered from diverse agro-ecological locations of north-western regions of India [70].
The need for the improvement of buckwheat genetics by various breeding programmes has been realized globally. Buckwheat is a promising pseudocereal crop; therefore, substantial information about the intra-specific and inter-specific genetic variation of its germplasm collections is of fundamental importance for crop improvement. Nevertheless, little is known about intra-specific and inter-specific genetic variations and the relations within and among the buckwheat accessions, and the results presented in this study might augment a new understanding.
5. Conclusions
This study indicates the effectiveness of ISSR markers in molecular characterization of buckwheat germplasm. The investigation reveals that buckwheat species possess a significant level of genetic diversity especially within accessions of F. esculentum, F. sagittatum and F. kashmirianum. On the other hand, a low level of genetic variation has been detected within the accessions of F. tataricum, which, therefore, needs to be conserved by the development and adoption of an appropriate conservation strategy. The diverse eco-geographical conditions, pollinating behavior and the low germplasm exchange among farmers are the major factors in dictating the extent of genetic variation at intra-specific and inter-specific levels in buckwheat germplasm, especially in Kashmir and Ladakh regions. In addition, the phylogenetic analysis indicated a close relationship between the two species, i.e., F. tataricum and F. kashmirianum. The present study also suggests the utilization of this buckwheat germplasm by breeders for the improvement and development of new varieties.
Author Contributions
F.A.D., I.T. and R.U.R. conceived the problem, set up the experimental design and contributed to the writing and final preparation of the manuscript. F.A.D. collected the seed material for experimentation, conducted the experiments, took readings and also performed data analysis. S.H.Q., A.A.A. and M.A., have revised the manuscript and support with funding. H.F.A. and K.R.H. have critically analyzed the data and edited and revised the manuscript. All authors have read and agreed to the published version of the manuscript.
Funding
This research received no external funding.
Institutional Review Board Statement
Not Applicable.
Informed Consent Statement
Not Applicable.
Data Availability Statement
All new research data were presented in this contribution.
Acknowledgments
We are grateful to the University of Kashmir, Hazratbal, Srinagar, for allowing us to conduct this research and providing necessary support.
Conflicts of Interest
The authors declare that they have no conflict of interest.
References
- Wang, C.L.; Ding, M.Q.; Zou, C.Y.; Zhu, X.M.; Tang, Y.; Zhou, M.L.; Shao, J.R. Comparative Analysis of Four Buckwheat Species Based on Morphology and Complete Chloroplast Genome Sequences. Sci. Rep. 2017, 7, 6514. [Google Scholar] [CrossRef]
- Chen, Q.F.; Huang, X.Y.; Li, H.Y.; Yang, L.J.; Cui, Y.S. Recent Progress in Perennial Buckwheat Development. Sustainability 2018, 10, 536. [Google Scholar] [CrossRef]
- Zhou, M.; Kreft, I.; Suvorova, G.; Tang, Y.; Sun-Hee, W. Buckwheat Germplasm in the World, 1st ed.; Academic Press: Cambridge, MA, USA, 2018; p. 382. [Google Scholar]
- Christa, K.; Soral-Śmietana, M. Buckwheat Grains and Buckwheat Products-Nutritional and Prophylactic Value of Their Components: A Review. Czech J. Food Sci. 2008, 26, 153–162. [Google Scholar] [CrossRef]
- Zhu, F. Chemical Composition and Health Effects of Tartary Buckwheat. Food Chem. 2016, 203, 231–245. [Google Scholar] [CrossRef]
- Sytar, O.; Chrenkova, M.; Ferencova, J.; Polacikova, M.; Rajsky, M.; Brestic, M. Nutrient Capacity of Amino Acids from Buckwheat Seeds and Sprouts. J. Food Nutr. Res. 2018, 57, 38–47. [Google Scholar]
- Ren, W.; Qiao, Z.; Wang, H.; Zhu, L.; Zhang, L. Flavonoids: Promising Anticancer Agents. Med. Res. Rev. 2003, 23, 519–534. [Google Scholar] [CrossRef]
- Kalinová, J.; Dadáková, E. Varietal and Year Variation of Rutin Content in Common Buckwheat (Fagopyrum esculentum Moench). Cereal Res. Commun. 2006, 34, 1315–1321. [Google Scholar] [CrossRef]
- Ganeshpurkar, A.; Saluja, A.K. The Pharmacological Potential of Rutin. Saudi Pharm. J. 2017, 25, 149–164. [Google Scholar] [CrossRef] [PubMed]
- Enogieru, A.B.; Haylett, W.; Hiss, D.C.; Bardien, S.; Ekpo, O.E. Rutin as a Potent Antioxidant: Implications for Neurodegenerative Disorders. Oxid. Med. Cell. Longev. 2018, 2018, 1–17. [Google Scholar] [CrossRef]
- Prasad, R.; Prasad, S.B. A Review on the Chemistry and Biological Properties of Rutin, a Promising Nutraceutical Agent. Asian J. Pharm. Pharmacol. 2019, 5, 1–20. [Google Scholar] [CrossRef]
- Joshi, D.C.; Chaudhari, G.V.; Sood, S.; Kant, L.; Pattanayak, A.; Zhang, K.; Fan, Y.; Janovská, D.; Meglič, V.; Zhou, M. Revisiting the Versatile Buckwheat: Reinvigorating Genetic Gains Through Integrated Breeding and Genomics Approach. Planta 2019, 250, 783–801. [Google Scholar] [CrossRef]
- Guo, Y.Z.; Chen, Q.F.; Yang, L.Y.; Huang, Y.H. Analyses of the Seed Protein Contents on the Cultivated and Wild Buckwheat Fagopyrum esculentum Resources. Genet. Resour. Crop Evol. 2007, 54, 1465–1472. [Google Scholar] [CrossRef]
- Farooq, S.; Rehman, R.U.; Pirzadah, T.B.; Malik, B.; Dar, F.A.; Tahir, I. Cultivation, Agronomic Practices, and Growth Performance of Buckwheat. In Molecular Breeding and Nutritional Aspects of Buckwheat; Zhou, M., Ed.; Academic Press: Cambridge, MA, USA; Elsevier Inc.: Oxford, UK, 2016; pp. 299–320. ISBN 978-0-12-803692-1. [Google Scholar]
- Ohnishi, O. Search for the Wild Ancestor of Buckwheat III. The Wild Ancestor of Cultivated Common Buckwheat, and of Tartary Buckwheat. Econ. Bot. 1998, 52, 123–133. [Google Scholar] [CrossRef]
- Yamane, K.; Ohnishi, O. Phylogenetic Relationships Among Natural Populations of Perennial Buckwheat, Fagopyrum cymosum Meisn. Revealed by Allozyme Variation. Genet. Resour. Crop Evol. 2001, 48, 69–77. [Google Scholar] [CrossRef]
- Ohnishi, O.; Matsuoka, Y. Search for the Wild Ancestor of Buckwheat. II. Taxonomy of Fagopyrum (Polygonaceae) species Based on Morphology, Isozymes and cpDNA Variability. Genes Genet. Syst. 1996, 71, 383–390. [Google Scholar] [CrossRef]
- Yasui, Y.; Ohnishi, O. Interspecific Relationships in Fagopyrum (Polygonaceae) Revealed by the Nucleotide Sequence of the rbcL and accD and Their Intergenetic Region. Am. J. Bot. 1998, 85, 1134. [Google Scholar] [CrossRef] [PubMed]
- Yasui, Y.; Ohnishi, O. Phylogenetic Relationships Among the Fagopyrum species Revealed by the Nucleotide Sequences by the ITS Region of the Nuclear rRNA Gene. Genes Genet. Syst. 1998, 73, 201–210. [Google Scholar] [CrossRef] [PubMed]
- Yamane, K.; Yasui, Y.; Ohnishi, O. Interspecific cpDNA Variations of Diploid and Tetraploid Perennial Buckwheat, Fagopyrum cymosum (Polygonaceae). Am. J. Bot. 2003, 90, 339–346. [Google Scholar] [CrossRef] [PubMed]
- Kump, B.; Javornik, B. Evaluation of Genetic Variability Among Common Buckwheat (Fagopyrum esculentum) Populations by RAPD Markers. Plant Sci. 1996, 114, 149–158. [Google Scholar] [CrossRef]
- Sharma, R.; Jana, S. Species Relationships in Fagopyrum Revealed by PCR-Based DNA Fingerprinting. Theor. Appl. Genet. 2002, 105, 306–312. [Google Scholar] [CrossRef]
- Yang, X.Y.; Wu, Z.F.; Chen, H.; Shao, J.R.; Wu, Q. Karyotype and Genetic Relationship Based on RAPD Markers of Six Wild Buckwheat Species (Fagopyrum spp.) from Southwest of China. Genet. Resour. Crop Evol. 2010, 57, 649–656. [Google Scholar] [CrossRef]
- Iwata, H.; Imon, K.; Tsumura, Y.; Ohsawa, R. Genetic Diversity Among Japanese Indigenous Common Buckwheat (Fagopyrum esculentum) Cultivars as Determined from Amplified Fragment Length Polymorphism and Simple Sequence Repeat Markers and Quantitative Agronomic Traits. Genome 2005, 48, 367–377. [Google Scholar] [CrossRef] [PubMed]
- Konishi, T.; Yasui, Y.; Ohnishi, O. Original Birthplace of Cultivated Common Buckwheat Inferred from Genetic Relationships Among Cultivated Populations and Natural Populations of Wild Common Buckwheat Revealed by AFLP Analysis. Genes Genet. Syst. 2005, 80, 113–119. [Google Scholar] [CrossRef]
- Gupta, N.; Sharma, S.K.; Rana, J.C.; Chauhan, R.S. AFLP Fingerprinting of Tartary Buckwheat Accessions (Fagopyrum tataricum) Displaying Rutin Content Variation. Fitoterapia 2012, 83, 1131–1137. [Google Scholar] [CrossRef] [PubMed]
- Li, Y.Q.; Shi, T.L.; Zhang, Z.W. Development of Microsatellite Markers from Tartary Buckwheat. Biotechnol. Lett. 2007, 29, 823–827. [Google Scholar] [CrossRef] [PubMed]
- Hou, S.; Sun, Z.; Linghu, B.; Xu, D.; Wu, B.; Zhang, B.; Wang, X.; Han, Y.; Zhang, L.; Qiao, Z.; et al. Genetic Diversity of Buckwheat Cultivars (Fagopyrum tartaricum Gaertn.) Assessed with SSR Markers Developed from Genome Survey Sequences. Plant molecular biologen Rep. 34. Plant Mol. Biol. Rep. 2016, 34, 233–241. [Google Scholar] [CrossRef]
- Li, Y.; Fan, X.; Shi, T.; Zhang, Q.; Zhang, Z. SRAP Marker Reveals Genetic Diversity in Tartary Buckwheat in China. Front. Agric. China 2009, 3, 383–387. [Google Scholar] [CrossRef]
- Archak, S.; Rana, J.C.; Singh, P.; Gaikwad, A.B. Potential of Gene-Specific Sequence-Tagged-Sites (STS) as Trait-Specific Markers in Buckwheat (Fagopyrum spp.). J. Plant Biochem. Biotechnol. 2016, 26, 160–171. [Google Scholar] [CrossRef]
- Reddy, M.P.; Sarla, N.; Siddiq, E.A. Inter Simple Sequence Repeat (ISSR) Polymorphism and Its Application in Plant Breeding. Euphytica 2002, 128, 9–17. [Google Scholar] [CrossRef]
- Feyissa, T.; Nybom, H.; Bartish, I.V.; Welander, M. Analysis of Genetic Diversity in the Endangered Tropical Tree Species Hageniaabyssinica Using ISSR Markers. Genet. Resour. Crop Evol. 2007, 54, 947–958. [Google Scholar] [CrossRef]
- Zietkiewicz, E.; Rafalski, A.; Labuda, D. Genome Fingerprinting by Simple Sequence Repeat (SSR) Anchored Polymerase Chain Reaction Amplification. Genomics 1994, 20, 176–183. [Google Scholar] [CrossRef]
- Wang, H.Z.; Wu, Z.X.; Lu, J.J.; Shi, N.N.; Zhao, Y.; Zhang, Z.T.; Liu, J.J. Molecular Diversity and Relationships Among CymbidiumGoeringii Cultivars Based on Inter Simple Sequence Repeat (ISSR) Markers. Genetica 2009, 136, 391–399. [Google Scholar] [CrossRef]
- Dar, F.A.; Verma, S.; Rehman, R.U. Genetic Diversity Assessment of Phaseolus vulgaris L. in Two Himalayan Districts of India. Proc. Natl. Acad. Sci. India Sect. B Biol. Sci. 2018, 88, 165–173. [Google Scholar] [CrossRef]
- Mendler-Drienyovszki, N.; Cal, A.J.; Dobránszki, J. Progress and Prospects for Interspecific Hybridization in Buckwheat and the Genus Fagopyrum. Biotechnol. Adv. 2013, 31, 1768–1775. [Google Scholar] [CrossRef] [PubMed]
- Dar, F.A.; Pirzadah, T.B.; Malik, B.; Tahir, I.; Rehman, R.U. Molecular Genetics of Buckwheat and Its Role in Crop Improvement. In Buckwheat Germplasm in the World; Zhou, M., Kreft, I., Suvorova, G., Tang, Y., Woo, S.H., Eds.; Academic Press: Cambridge, MA, USA; Elsevier Inc.: Chennai, India, 2018; pp. 271–286. [Google Scholar]
- Barcaccia, G.; Volpato, M.; Gentili, R.; Abeli, T.; Galla, G.; Orsenigo, S.; Citterio, S.; Sgorbati, S.; Rossi, G. Genetic Identity of Common Buckwheat (Fagopyrum esculentum Moench.) Landraces Locally Cultivated in the Alps. Genet. Resour. Crop Evol. 2016, 63, 639–651. [Google Scholar] [CrossRef]
- Munshi, A.H. A New Species of Fagopyrum from Kashmir Himalaya. J. Econ. Taxon. Bot. 1982, 3, 627–630. [Google Scholar]
- Tahir, I.; Farooq, S. Review Article on Buckwheat. Fagopyrum 1988, 8, 33–53. [Google Scholar]
- Dar, F.A.; Pirzadah, T.B.; Tahir, I.; Rehman, R.U. Deciphering the In Vitro Antioxidant Potential and Mineral Analysis of Fagopyrum species from Kashmir and Ladakh Regions. J. Rep. Pharm. Sci. 2020, 9, 235–245. [Google Scholar]
- Allen, G.C.; Flores-Vergara, M.A.; Krasynanski, S.; Kumar, S.; Thompson, W.F. A Modified Protocol for Rapid DNA Isolation from Plant Tissue Using Cetyltrimethylammonium Bromide. Nat. Protoc. 2006, 1, 2320–2325. [Google Scholar] [CrossRef]
- Yeh, F.C.; Yang, R.C.; Boyle, T.; Ye, Z.H.; Mao, J.X. POPGENE: The User-Friendly Shareware for Population Genetic Analysis; University of Alberta, Molecular Biology and Biotechnology Centre: Edmonton, AB, USA, 1997. [Google Scholar]
- Nei, M. Analysis of Gene Diversity in Subdivided Populations. Proc. Natl. Acad. Sci. USA 1973, 70, 3321–3323. [Google Scholar] [CrossRef]
- Shannon, C.E.; Weaver, W. The Mathematical Theory of Communication; University of Illinois Press: Urbana, Italy, 1949. [Google Scholar]
- Lewontin, R.C. The Genetic Basis of Evolutionary Change; Columbia University Press: New York, NY, USA, 1974. [Google Scholar]
- McDermott, J.M.; McDonald, B.A. Gene Flow in Plant Pathosystems. Annu. Rev. Phytopathol. 1993, 31, 353–373. [Google Scholar] [CrossRef]
- Nei, M. Estimation of Average Heterozygosity and Genetic Distance from a Small Number of Individuals. Genetics 1978, 89, 583–590. [Google Scholar] [CrossRef] [PubMed]
- Felsentein, J. PHYLIP (Phylogeny Inference Package), Version 3.6; Department of Genetics, University of Washington: Seattle, WA, USA, 2000. [Google Scholar]
- Page, R.D.M. TREE VIEW: An Application to Display Phylogenetic Trees in Computers. Comput. Appl. Biosci. 2001, 12, 357–358. [Google Scholar] [CrossRef] [PubMed]
- Peakall, R.; Smouse, P.E. GenAlEx 6.5: Genetic Analysis in Excel. Population Genetic Software for Teaching and Research—An Update. Bioinformatics 2012, 28, 2537–2539. [Google Scholar] [CrossRef]
- Slatkin, M. A Measure of Population Subdivision Based on Microsatellite Allele Frequencies. Genetics 1995, 139, 457–462. [Google Scholar] [CrossRef]
- Excoffier, L.; Smouse, P.E.; Quattro, J.M. Analysis of Molecular Variance Inferred from Metric Distances Among DNA Haplotypes: Application to Human Mitochondrial DNA Restriction Sites. Genetics 1992, 131, 479–491. [Google Scholar] [CrossRef]
- Perrier, X.; Jacquemoud-Collet, J.P. Darwin Software. 2006. Available online: http://darwin.cirad.fr/darwin (accessed on 7 April 2021).
- Ge, X.J.; Yu, Y.; Zhao, N.X.; Chen, H.S.; Qi, W.Q. Genetic Variation in the Endangered Inner Mongolia Endemic Shrub Tetraenamongolica Maxim. (Zygophyllaceae). Biol. Conserv. 2003, 111, 427–434. [Google Scholar] [CrossRef]
- Maki, M. Population Genetics of Threatened Wild Plants in Japan. J. Plant Res. 2003, 116, 169–174. [Google Scholar] [CrossRef]
- Meloni, M.; Perini, D.; Filigheddu, R.; Binelli, G. Genetic Variation in Five Mediterranean Populations of Juniperusphoenicea as Revealed by Inter Simple Sequence Repeat (ISSR) Markers. Ann. Bot. 2006, 97, 299–304. [Google Scholar] [CrossRef] [PubMed]
- Nybom, H. Comparison of Different Nuclear DNA Markers for Estimating Genetic Diversity in Plants. Mol. Ecol. 2004, 13, 1143–1155. [Google Scholar] [CrossRef] [PubMed]
- Duminil, J.; Fineschi, S.; Hampe, A.; Jordano, P.; Salvini, D.; Vendramin, G.G.; Petit, R.J. Can Population Genetic Structure Be Predicted from Life –History Traits? Am. Nat. 2007, 169, 662–672. [Google Scholar] [CrossRef] [PubMed]
- Zhou, M.L.; Bai, D.Q.; Tang, Y.; Zhu, X.M.; Shao, J.R. Genetic Diversity of Four New Species Related to Southwestern Sichuan Buckwheats as Revealed by Karyotype, ISSR and Allozyme Characterization. Plant Syst. Evol. 2012, 298, 751–759. [Google Scholar] [CrossRef]
- Kishore, G.; Gupta, S.; Pandey, A. Assessment of Population Genetic Diversity of Fagopyrum tataricum Using SSR Molecular Marker. Biochem. Syst. Ecol. 2012, 43, 32–41. [Google Scholar] [CrossRef]
- Kishore, G.; Pandey, A.; Dobhal, R.; Gupta, S. Population Genetic Study of Fagopyrum tataricum from Western Himalaya Using ISSR Markers. Biochem. Genet. 2013, 51, 750–765. [Google Scholar] [CrossRef] [PubMed]
- Kadyrova, G.D.; Kadyrova, F.Z.; Martirosyan, E.V.; Ryzhova, N.N. Analysis of Genomic Diversity of Samples and Cultivars in Common Buckwheat (Fagopyrum esculentum Moench) by the ISSR-Method. Agric. Biol. 2010, 5, 42–48. [Google Scholar]
- Senthilkumaran, R.; Bisht, I.S.; Bhat, K.V.; Rana, J.C. Diversity in Buckwheat (Fagopyrum spp.) Landrace Populations from North-Western Indian Himalayas. Genet. Resour. Crop Evol. 2008, 55, 287–302. [Google Scholar] [CrossRef]
- Badiane, F.A.; Diouf, D.; Sane, D.; Diouf, O.; Goudiaby, V.; Diallo, N. Screening Cowpea (Vigna unguiculata (L.) Walp.) Varieties by Inducing Water Deficit and RAPD Analyses. Afr. J. Biotechnol. 2004, 3, 174–178. [Google Scholar]
- Hu, Y.; Wang, L.; Xie, X.; Yang, J.; Li, Y.; Zhang, H. Genetic Diversity of Wild Populations of Rheum tanguticum Endemic to China as Revealed by ISSR Analysis. Biochem. Syst. Ecol. 2010, 38, 264–274. [Google Scholar] [CrossRef]
- Hamrick, J.L.; Godt, M.J.W. Effects of Life History Traits on Genetic Diversity in Plant Species. Phil. Trans. R. Soc. Lond. B 1996, 351, 1291–1298. [Google Scholar]
- Chen, Y.H. Ecological Characteristics and Developing Counter Measures of Rheum palmatum L. and R. Tanguticum Maxim Bail. Qinghai Resour. Dev. Mark 2003, 19, 159–161. [Google Scholar]
- Maki, M.; Morita, H.; Oiki, S.; Takahashi, H. The Effect of Geographic Range and Dichogamy on Genetic Variability and Population Genetic Structure in Tricyrtis Section Flavae (Liliaceae). Am. J. Bot. 1999, 86, 287–292. [Google Scholar] [CrossRef] [PubMed]
- Dar, F.A.; Tahir, I.; Rehman, R.U. Morphological Characterization Reveals High Intraspecies Diversity in Fagopyrum esculentum Moench and Fagopyrum sagittatum Gilib from North-Western Himalayan Regions. Agric. Res. 2021, 1–12. [Google Scholar] [CrossRef]


Publisher’s Note: MDPI stays neutral with regard to jurisdictional claims in published maps and institutional affiliations. |
© 2021 by the authors. Licensee MDPI, Basel, Switzerland. This article is an open access article distributed under the terms and conditions of the Creative Commons Attribution (CC BY) license (https://creativecommons.org/licenses/by/4.0/).