Article

Broadening the Perspective of Zero-Deforestation Interventions in Peru by Incorporating Concepts from the Global Value Chain Literature

by
Augusto Carlos Castro-Nunez
1,*,
Ma. Eliza J. Villarino
1,2,
Vincent Bax
3,
Raphael Ganzenmüller
1,4 and
Wendy Francesconi
1
1
International Center for Tropical Agriculture (CIAT), Km 17 Recta Cali-Palmira, Cali 763537, Colombia
2
Department of Geosciences and Natural Resource Management, Faculty of Science, University of Copenhagen, Oster Voldgade 10, 1350 Copenhagen, Denmark
3
Centre for Interdisciplinary Science and Society Studies, Universidad de Ciencias y Humanidades, Av. Universitaria 5175, Los Olivos, Lima 15304, Peru
4
Department of Geography, Ludwig-Maximilians-Universität München, 80539 Munich, Germany
*
Author to whom correspondence should be addressed.
Sustainability 2021, 13(21), 12138; https://doi.org/10.3390/su132112138
Submission received: 24 August 2021 / Revised: 11 October 2021 / Accepted: 15 October 2021 / Published: 3 November 2021

Abstract

:
Global narratives around the links between deforestation and agricultural commodity production have led to the application of voluntary zero-deforestation agreements between companies, governments, and civil society. The continued tropical deforestation warrants a re-examination of this approach in order to customize its application for a particular location. Our paper contributes to this by exploring the spatial associations between deforestation and the production of cacao, coffee, and oil palm in the Amazon region in Peru. The geographical overlaps between deforestation, and the distribution of these commodity crops, indicate four types of spatial associations: (1) a high degree of deforestation and a high degree of commodity production (high-high); (2) a high degree of deforestation and a low degree of commodity production (high-low); (3) a low degree of deforestation and a high degree of commodity production (low-high); and (4) a low degree of deforestation and a low degree of commodity production (low-low). On the basis of these associations, we present four scenarios in which zero-deforestation supply chain interventions may operate in Peru and argue that broadening the perspective of such interventions by adopting a global value chain lens can improve the use of previously deforested lands, prevent unintended or future deforestation and, in turn, ensure that no forest area is left behind.

1. Introduction

Agriculture represents the leading driver of tropical deforestation [1] and contributes 16–27% to the total anthropogenic greenhouse gas emissions worldwide [2]. Within the last two decades, two major policy tools have emerged to protect tropical forests, based on the prevailing global narratives of what drives deforestation. REDD+, short for “reducing emissions from deforestation and forest degradation and the role of conservation, sustainable management of forests and enhancement of forest carbon stocks in developing countries,” is one of them [3]. Government-driven and donor-supported, REDD+ mechanisms seek to address deforestation mainly due to low-opportunity-cost agriculture. They do so by providing developing countries with financial rewards for undertaking measurable and verifiable actions to reduce deforestation, known as “results-based payments” [4]. Zero-deforestation supply chain (ZDSC) initiatives are another policy tool. They encompass actions stemming from commitments that corporations have made to eliminate deforestation along their supply chains [5]. The perspective of ZDSC initiatives may need to be broadened because they address emissions linked with international, but not domestic, markets, and because of the political nature of the actions taken to reduce deforestation [6]. This could be done by incorporating concepts from the literature on global value chains (GVC). Doing so would maximize the potential multiple benefits of zero-deforestation actions.
The formalization of voluntary zero-deforestation agreements between companies, governments, and civil society organizations embodies a forest conservation action that uses a supply chain approach [7]. These agreements mainly target deforestation from the production of agricultural commodities, including cocoa, coffee, and palm oil. Despite the potential of REDD+ and ZDSC initiatives to reduce deforestation, some scholars note the challenges of using these tools. In the case of REDD+, interventions require an integrated conservation and development approach, which has come to be viewed as a failure [8]. In the case of ZDSC initiatives, substantial challenges remain, despite the rapidly growing number of commitments [9] and promising results [10,11]. For instance, they can marginalize key forest conservation actors, such as smallholders and indigenous peoples [12]. Furthermore, to make gains on zero-deforestation efforts, scholars have recommended broadening their scope and impact by involving more companies, commodities, supply chains, and regions, and combining them with jurisdictional approaches [5,13,14]. This would prevent “leakage”, a situation where deforestation and forest degradation in one location increases because of an environmental policy or activity in another location. For instance, the implementation of strict environmental policies in one region can lead agricultural commodity producers to seek areas where the given policy is not enforced, and where the supply chain has not yet caused significant damage to forest areas [5,15,16,17]. The unabated unsustainable loss of tropical forests [18] backs the scholarly assessment. Yet, insights on how best to apply ZDSC interventions, and combine them with other policy instruments, are, to the best of our knowledge, still missing.
Most private sector commitments, and the related research, focus on regions where there is a clear link between specific commodities and deforestation. Examples include beef in Brazil, palm oil in Indonesia, and cocoa in Ghana and Côte d’Ivoire. Where linkages are clear, initiatives may benefit from mechanisms that allow stakeholders to trace, monitor, and assess the processes of producing commodities because they can clarify whether or not these processes cause forest loss [19]. Clear linkages, in turn, can inform the design of sanctions or incentives that encourage producer compliance [20]. For instance, producers whose practices comply with zero-deforestation criteria may benefit from a better market position and premium prices [21]. These criteria are key to tracking the progress of these initiatives and reinforcing their impacts on the ground. The role and implementation of ZDSC interventions in regions with complex links between deforestation and commodity production expansion are, however, less clearly understood.
The emerging literature suggests that integrating GVC and ZDSC concepts has the potential to fill in the gaps in the understanding of the complex links between deforestation and commodity production [22]. The GVC approach entails analyzing how and why leading firms and their suppliers undertake actions that allow them to gain more from global production systems in a way that reduces or avoids deforestation [23]. In this case, the analysis could focus on value chains involving forest-risk agricultural products, and on the actions of small-scale farmers and other relevant suppliers so they can be more profitable and have access to markets without causing forest loss. While the discourse around supply chain management focuses on how to manage relationships in order to serve customers and boost the chain’s competitive advantage [24], the GVC framework looks at how supply chains are governed, that is, who wields power within the chain, and how they wield it to create value for customers [25]. This focus on power is consistent with the political nature of actions on reducing deforestation, which is a limitation of ZDSC initiatives.
Within forest-agriculture landscapes, interlinkages between land and food systems may present pathways toward land use change. Agricultural commodity production could expand into primary forest areas; alternatively, it could transform underutilized or underperforming land, such as abandoned cropland, degraded land, pasture, and fallows, or replace illegal land use, such as illicit crop cultivation [17,26]. For instance, in conflict-affected countries, governments could assimilate agricultural commodity production into a wider peacebuilding strategy, such as in the case of Colombia [22]. Meanwhile, in the Peruvian Amazon, cacao, coffee, and oil palm production have become pillars of the efforts to end illicit coca cultivation [27,28]. Boosting the effectiveness of zero-deforestation initiatives, therefore, requires combining policy instruments and applying them according to the existing associations between deforestation and agriculture in a certain country or region [29,30,31,32].
This raises the question of how best to apply ZDSC interventions and combine them with other policy instruments. Rather than assessing how ZDSC interventions may affect deforestation dynamics, in this paper, we attempt to answer how best to apply ZDSC interventions in countries where small-scale subsistence agriculture is reported as the main driver of forest loss instead of large-scale commodity production. We respond to that question by, first, providing an overview of the geographical distribution of both deforestation and cacao, coffee, and oil palm production in the Peruvian Amazon. Second, we present the results of the spatially explicit analyses on the extent of the association between deforestation and commodity crop production in the Peruvian Amazon. Third, on the basis of these associations, we present different scenarios in which ZDSC interventions may operate in Peru. Finally, we discuss how on-the-ground zero-deforestation interventions may combine existing land- and incentive-based approaches and tools and argue for their integration with concepts from the GVC literature so that efforts to reduce deforestation can make more significant gains.

2. Materials and Methods

2.1. The Case Study

We chose Peru as our case study because what is happening there exemplifies a situation where a review of zero-deforestation initiatives could be useful. A megadiverse nation that continues to lose its natural forest areas [33], Peru has developed a national REDD+ strategy [34]. In 2014, the governments of Peru, Germany, and Norway signed a declaration of intent (DOI) to support REDD+ efforts in the South American country [35]. The DOI enjoins the establishment of a public-private coalition with multinational companies committed to ambitious zero-deforestation policies, focusing on the design and implementation of the Nationally Appropriate Mitigation Action (NAMA) practices for the sustainable production of cacao, coffee, biofuels, agrofuels/agroindustry, and cattle ranching, improving the use of lands already deforested, and avoiding new conversions of forest to agriculture. The stipulation calls for a supply chain approach and, thus, suggests links between high-value commercial agriculture and deforestation in Peru. It prompts the question as to how commodity production relates to deforestation in the Peruvian Amazon, as well as what role ZDSC initiatives could play in a country where subsistence agriculture and commodity production meant for the domestic market are reported as the main drivers of forest loss [36,37].
The study focused on the Peruvian Amazon lowland and all forested areas along the eastern flank of the Andes. We used the Peruvian Amazon district boundaries—365 districts within 15 departments—as the spatial units of analysis (Figure 1).
The Peruvian Amazon continues to have vast areas of pristine forests. Deforestation rates in the Peruvian Amazon, however, almost doubled between 2001 and 2018, although they varied considerably at the department and district levels (Figure 2). Most of the deforestation occurred in the San Martín, Loreto, Ucayali, and Huánuco departments. San Martín had the highest deforestation rates between 2001 and 2011, while Ucayali and Loreto have had the highest in recent years. The Huánuco, Pasco, and San Martin departments also had considerable forest area loss during the analyzed period. In contrast, deforestation rates were comparably low in the Huancavelica, La Libertad, Piura, Ayacucho, Puno, and Cajamarca departments.
The Ucayali, Huánuco, and Junín departments had particularly high deforestation (Figure 1). At the district level, from 2013 to 2018, the extent of deforestation ranged from around zero to around 30,000 hectares among districts located in Peru’s central region. In contrast, most districts in the north and south experienced less deforestation, except Inambar, which is located in Madre de Dios, in the country’s south.

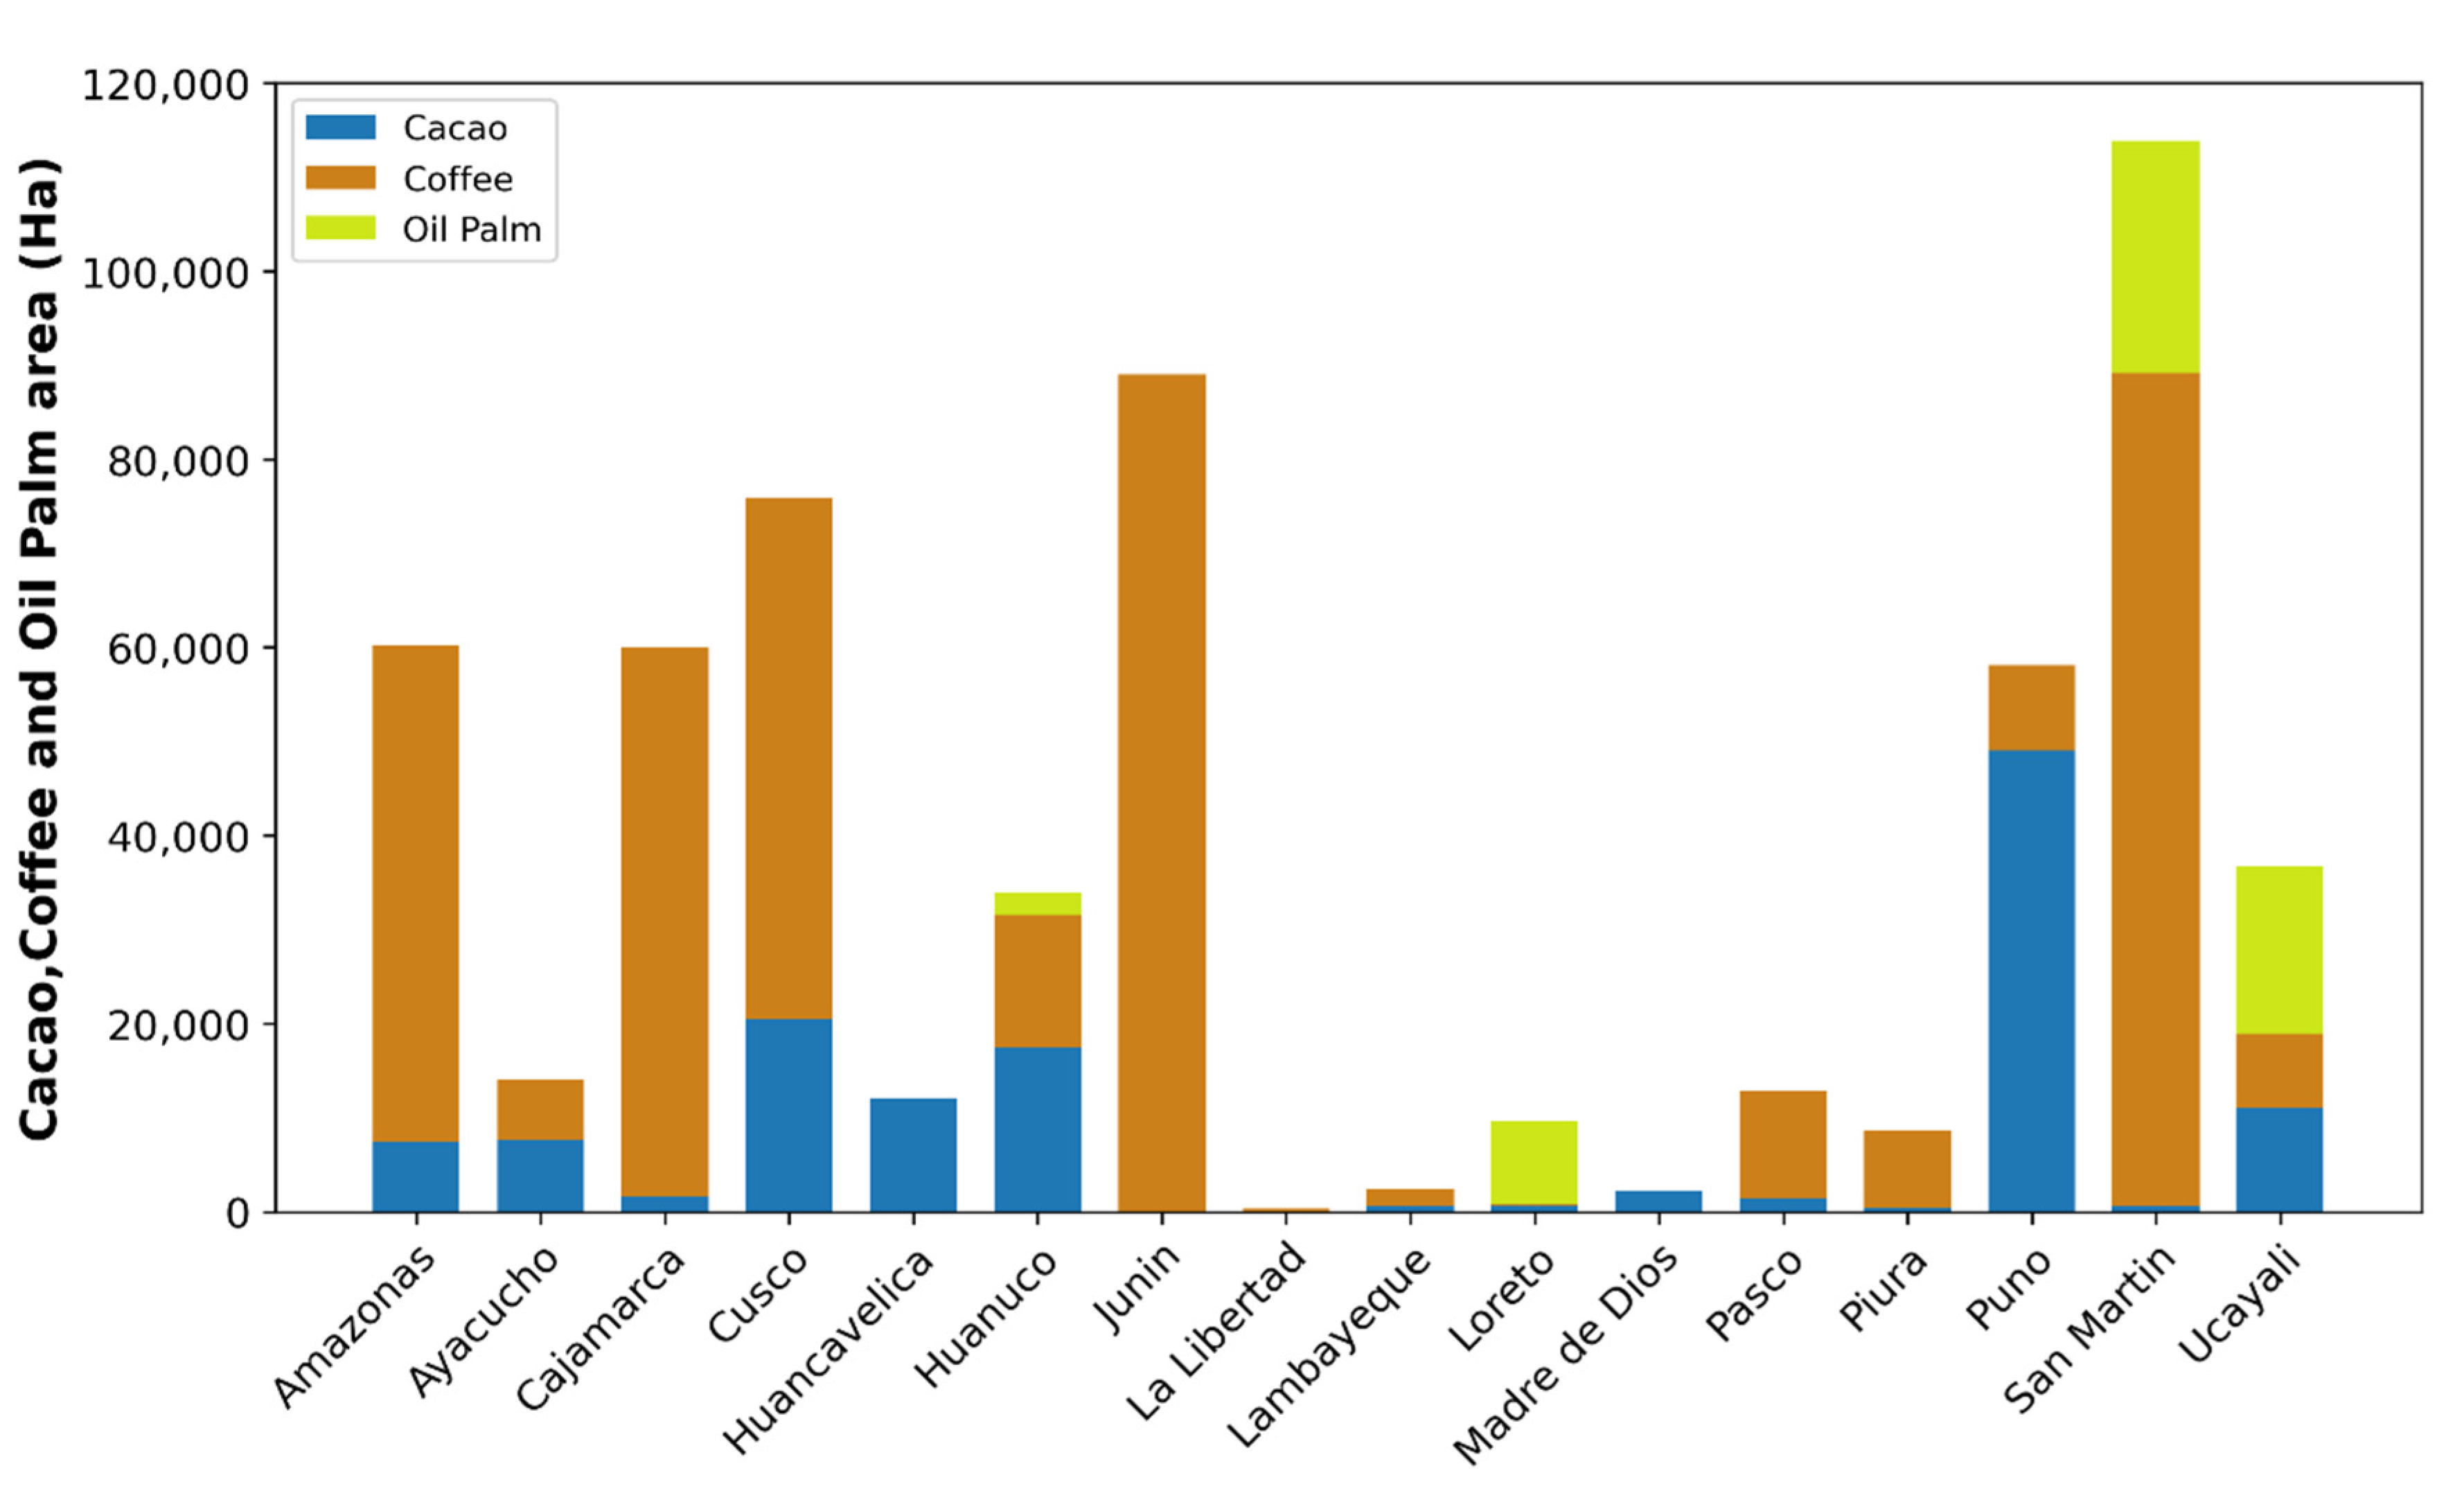
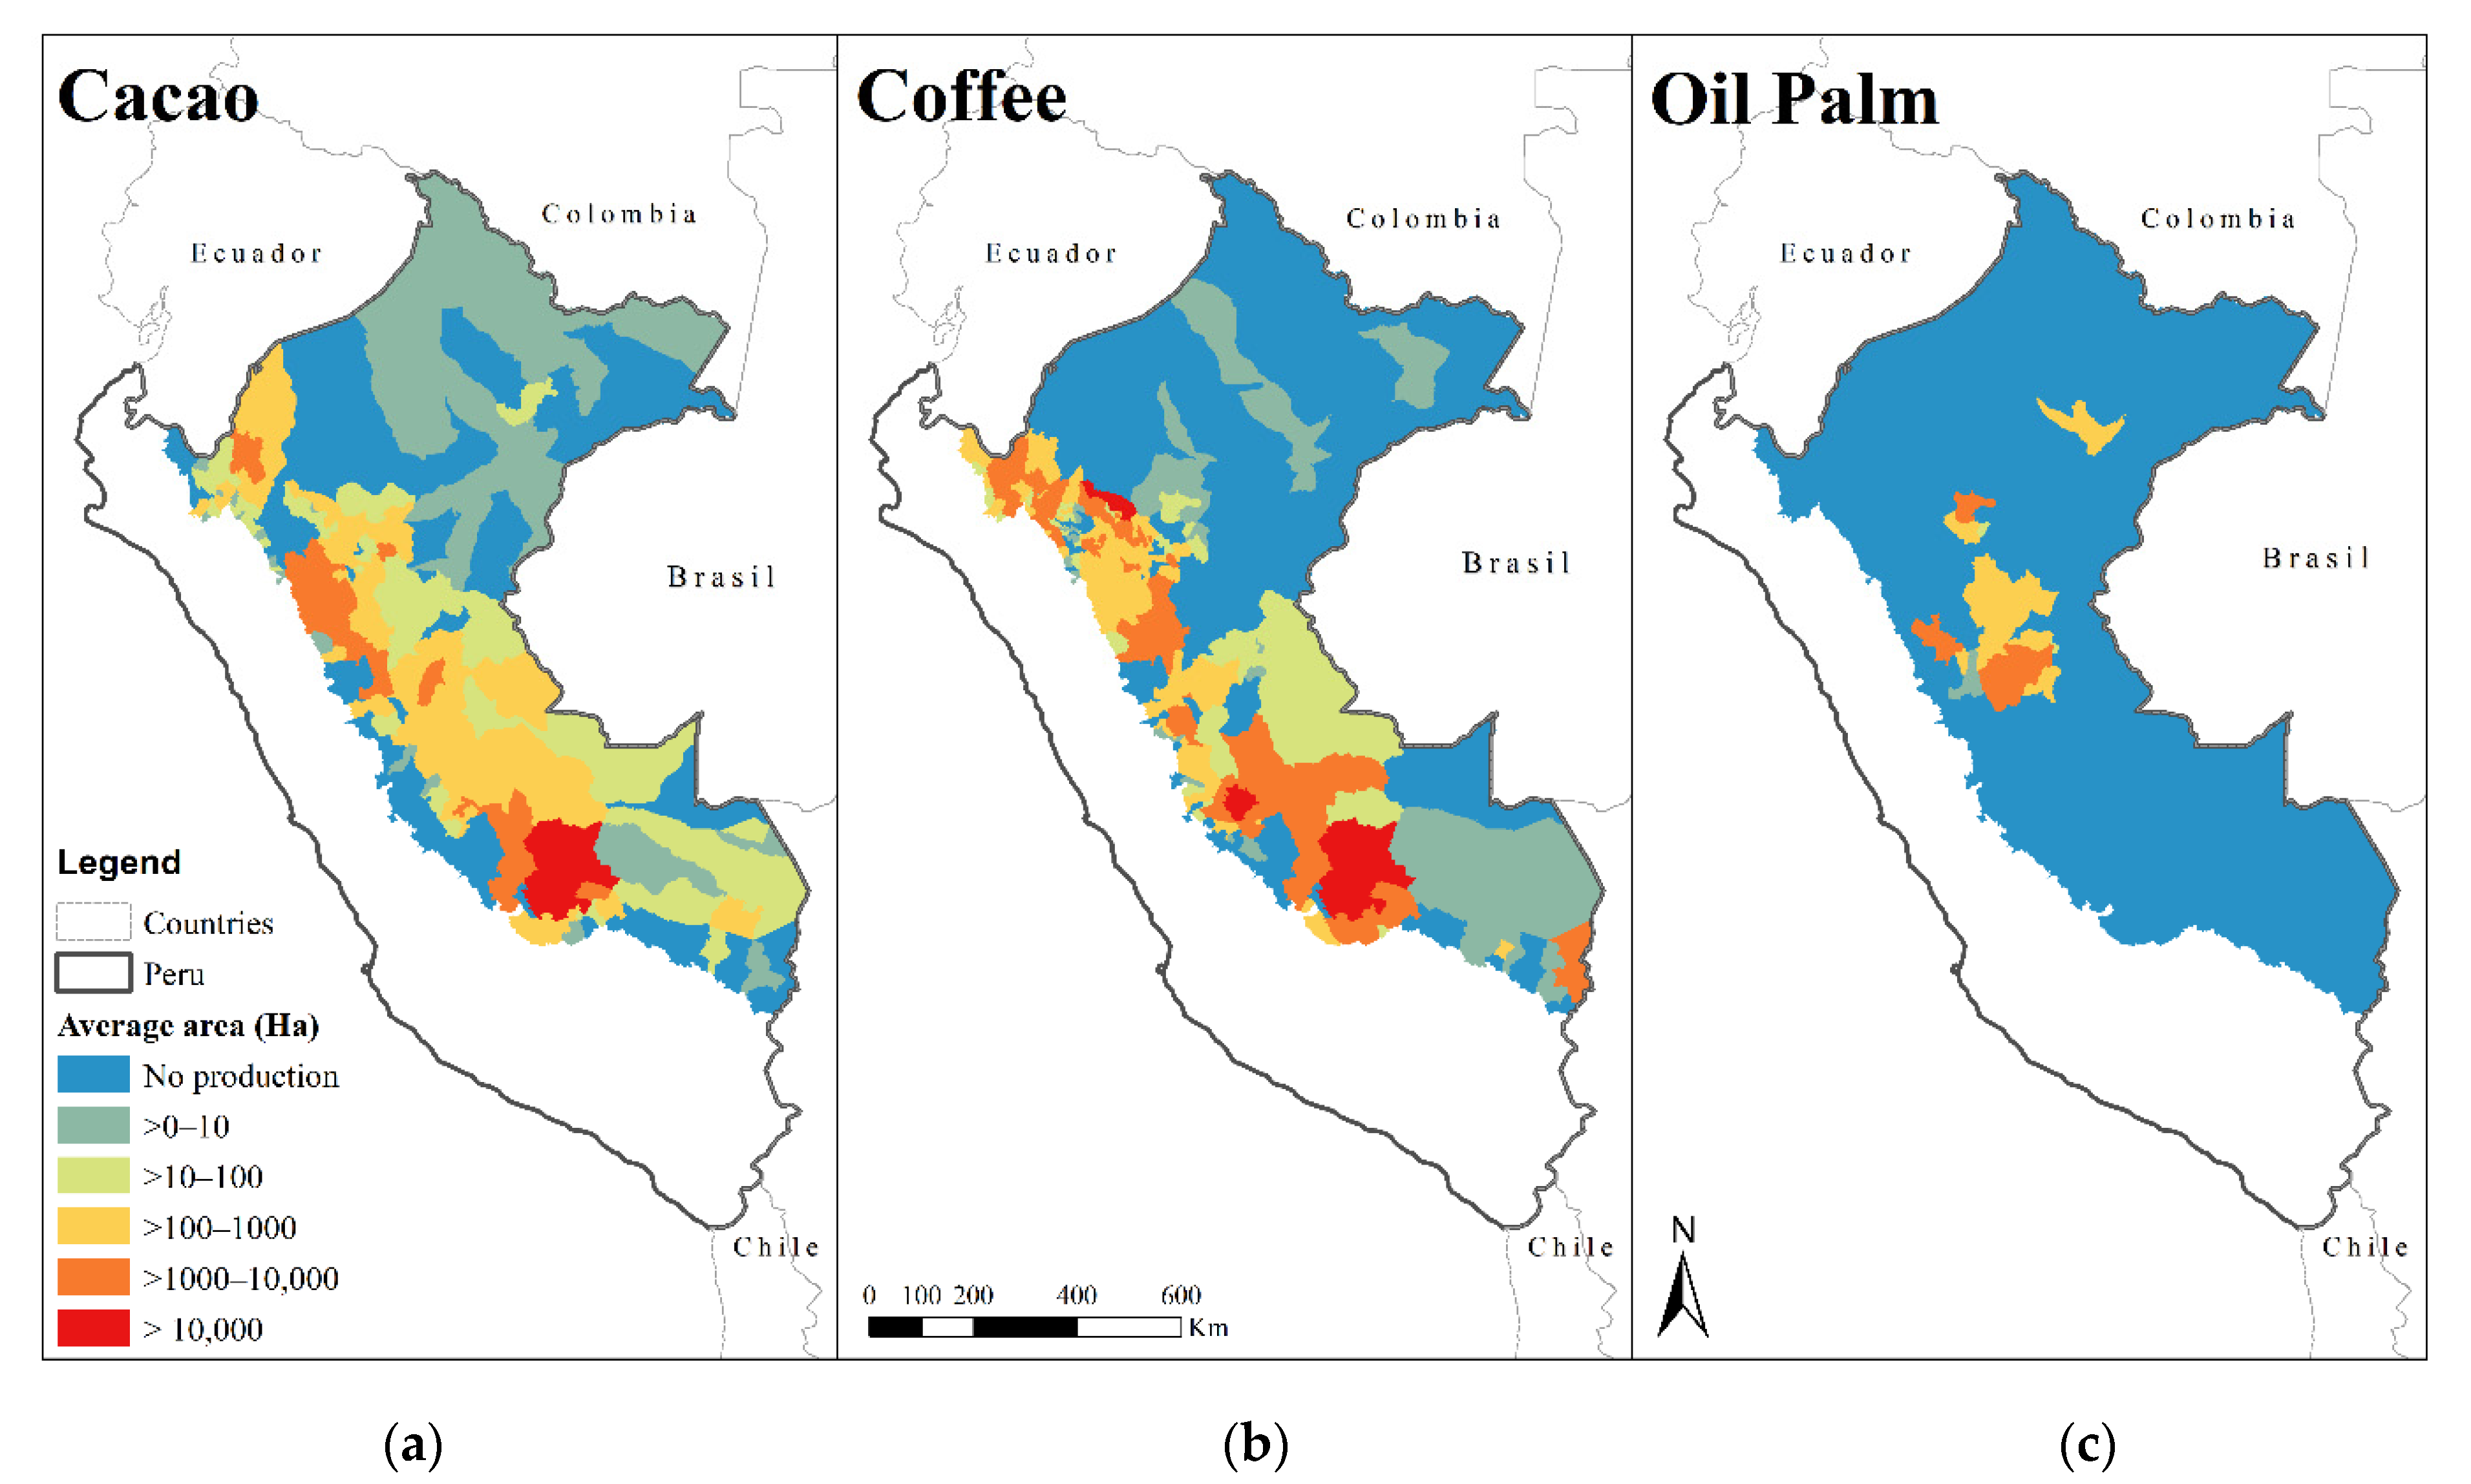
2.2. Cacao, Coffee, and Oil Palm Production in Peru

For consistency throughout this section, we use “cacao”, “coffee”, and “oil palm” to refer to commodity crops cultivated or produced in the analyzed spatial scales. Although defined in the above-mentioned DOI, we excluded cattle ranching from this study because of limitations in accessing complete datasets.
The areas cultivated with cacao, coffee, and oil palm at the department level, for the period from 2013–2018, show marked differences between the departments (Figure 3). San Martín stands out for having the largest area cultivated with all three crops. Coffee production is the most extensive activity in Amazonas, Cajamarca, Cusco, and Junín. The total area cultivated with the three crops in La Libertad, Huancavelica, Piura, and Puno is, by contrast, not significant.
The spatial distribution of the commodity production areas at the district level shows that cacao (215 districts) and coffee (259 districts) cultivation is present in most of the 365 Amazon districts (Figure 4). Oil palm cultivation, meanwhile, is only present in 21 Amazon districts in central Peru. Cacao cultivation is mainly concentrated in San Martín, Cusco, Junín, Amazonas, and Huánuco. Some of the main coffee cultivation areas are located in San Martín, Junín, and Cusco. Oil palm is cultivated only in a few districts within San Martín, Ucayali, Loreto, and Huánuco.

2.3. Spatial Associations
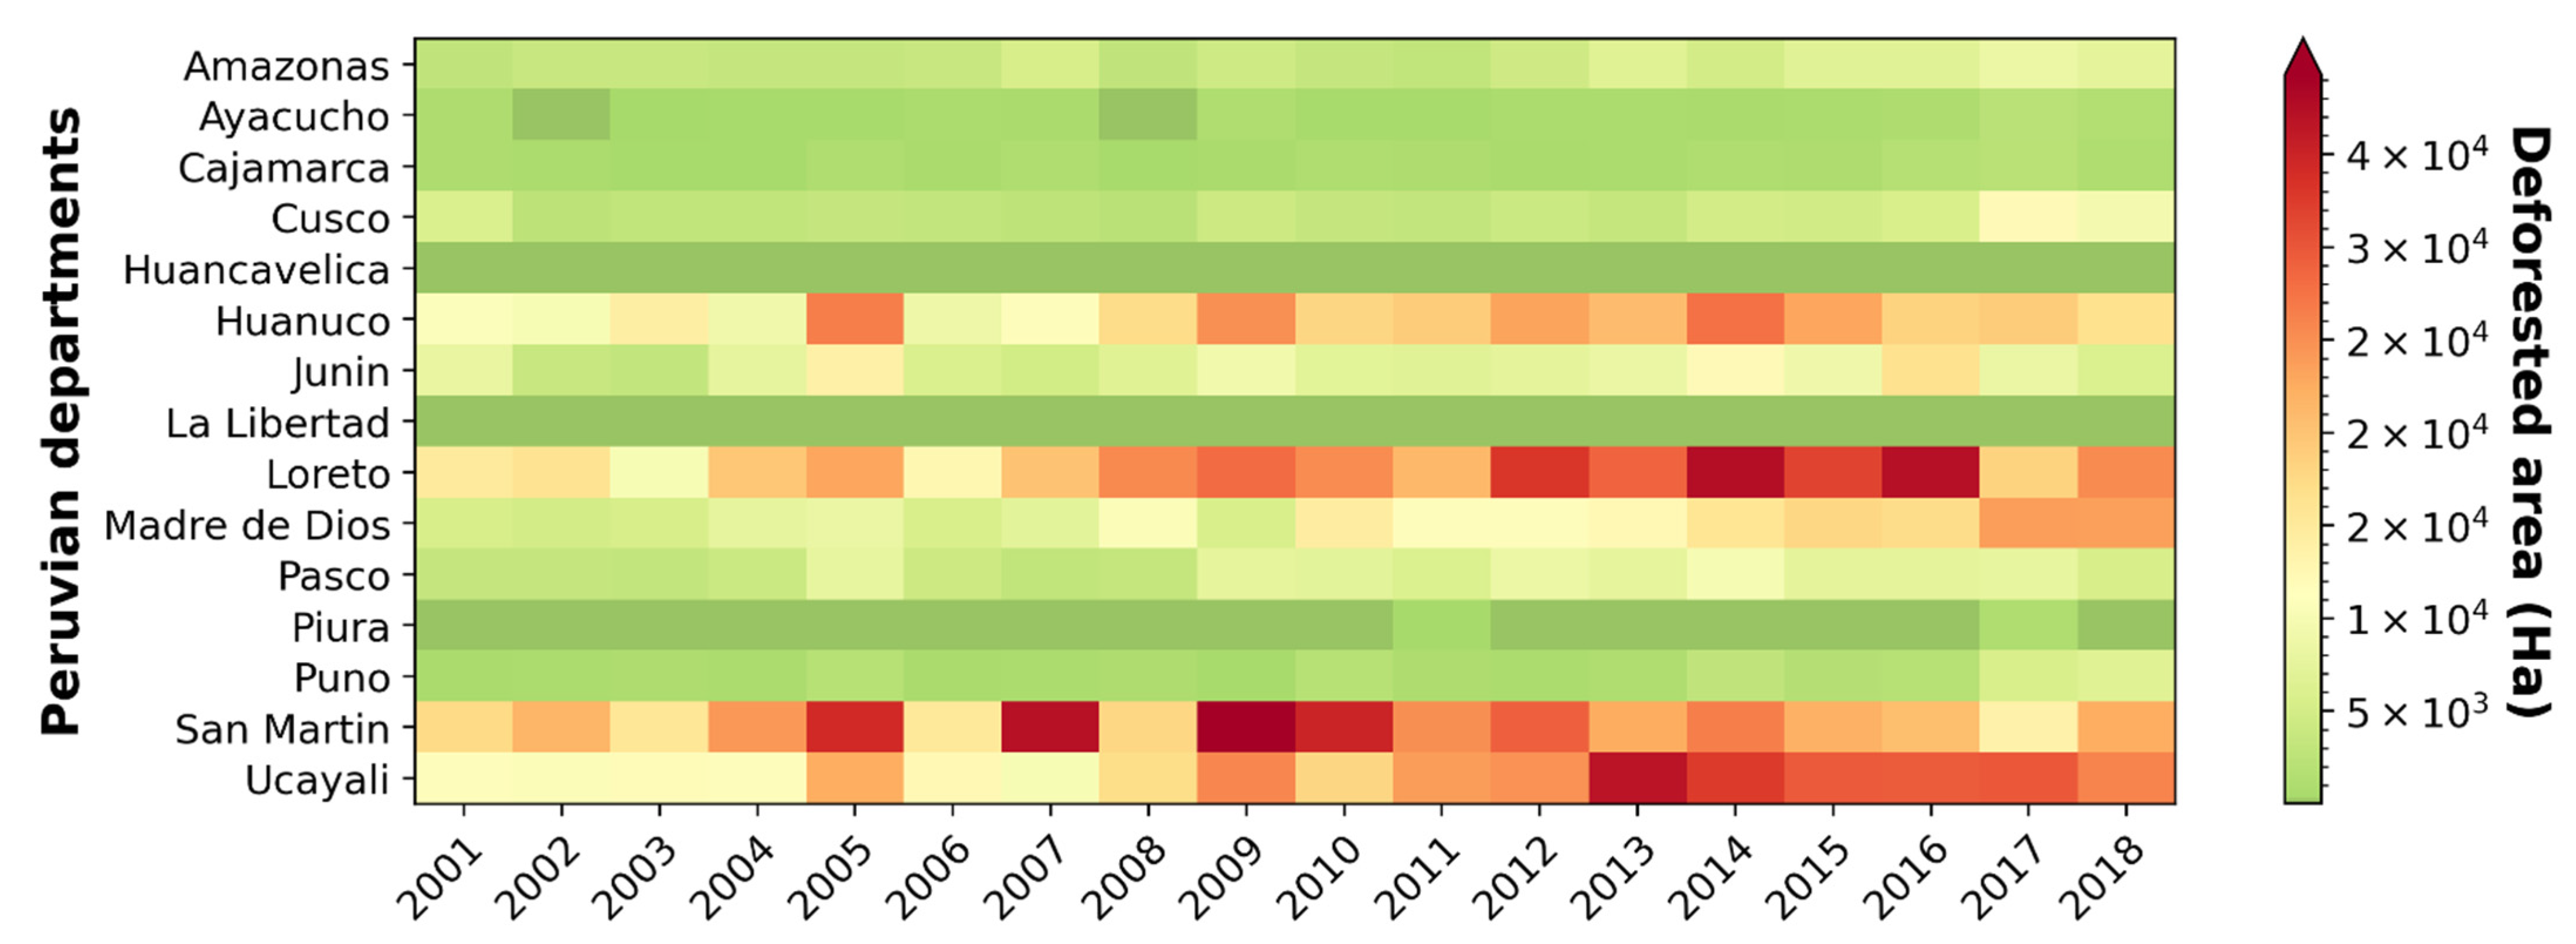
To provide insights into the association between deforestation and the cacao, coffee, and oil palm production areas, we conducted a Spearman’s rank correlation analysis. We computed the correlations using the average deforested area [38] and the average area cultivated for each crop from 2013 to 2018 [39,40]. Two spatial scales were used: at the (1) Peruvian Amazon basin, and (2) department levels. To better understand the association between deforestation and the production of these commodity crops in the Peruvian Amazon, we examined the patterns of spatial clustering, or positive spatial autocorrelation, by computing the bivariate local Moran’s I statistic, also known as local indicators of spatial association [41]. Specifically, we examined the spatial clustering of the deforestation and the production areas of the three crops at the district level using the datasets from MINAM [38], INEI [40] and MINAGRI [39]. Finally, we generated a Moran’s cluster map to characterize spatial associations between the average deforestation area in a given district, and the average commodity production area in its neighboring districts.

3. Results

3.1. Correlations between Deforestation and the Area Cultivated with Cacao, Coffee, and Oil Palm in Peru

At the Amazon level, we found low to moderate correlations between deforestation and the area cultivated with cacao (ρ = 0.46), as well as low correlations between deforestation and the areas cultivated with oil palm (ρ = 0.31) and coffee (ρ = 0.18). On the basis of the correlation analysis at the department level, we found large differences between the correlation coefficients across departments and crops (Table 1). There were significant correlations between deforestation and the areas cultivated with the three commodity crops solely in San Martín; a high correlation between deforestation and the areas cultivated with cacao and coffee in Ucayali and Junin; and low to moderate correlations between deforestation and the areas cultivated with at least two commodity crops for most of the other departments. We also observed statistically significant correlations between deforestation and the area cultivated with cacao in nine of the fifteen departments, with the highest correlation coefficients found in Pasco (0.75), Ucayali (0.72), and Madre de Dios (0.66). Correlations between deforestation and the areas cultivated with coffee were statistically significant in eight departments, while a low correlation coefficient (0.19) was found at the Peruvian Amazon basin level. We found the highest correlation coefficients associated with deforestation and coffee cultivation in the departments of Ayacucho (0.88), Ucayali (0.76), and Puno (0.74). Low to moderate correlations between deforestation and the areas cultivated with oil palm were found in two of the four departments where the crop is present: Loreto (0.35), and San Martín (0.38).

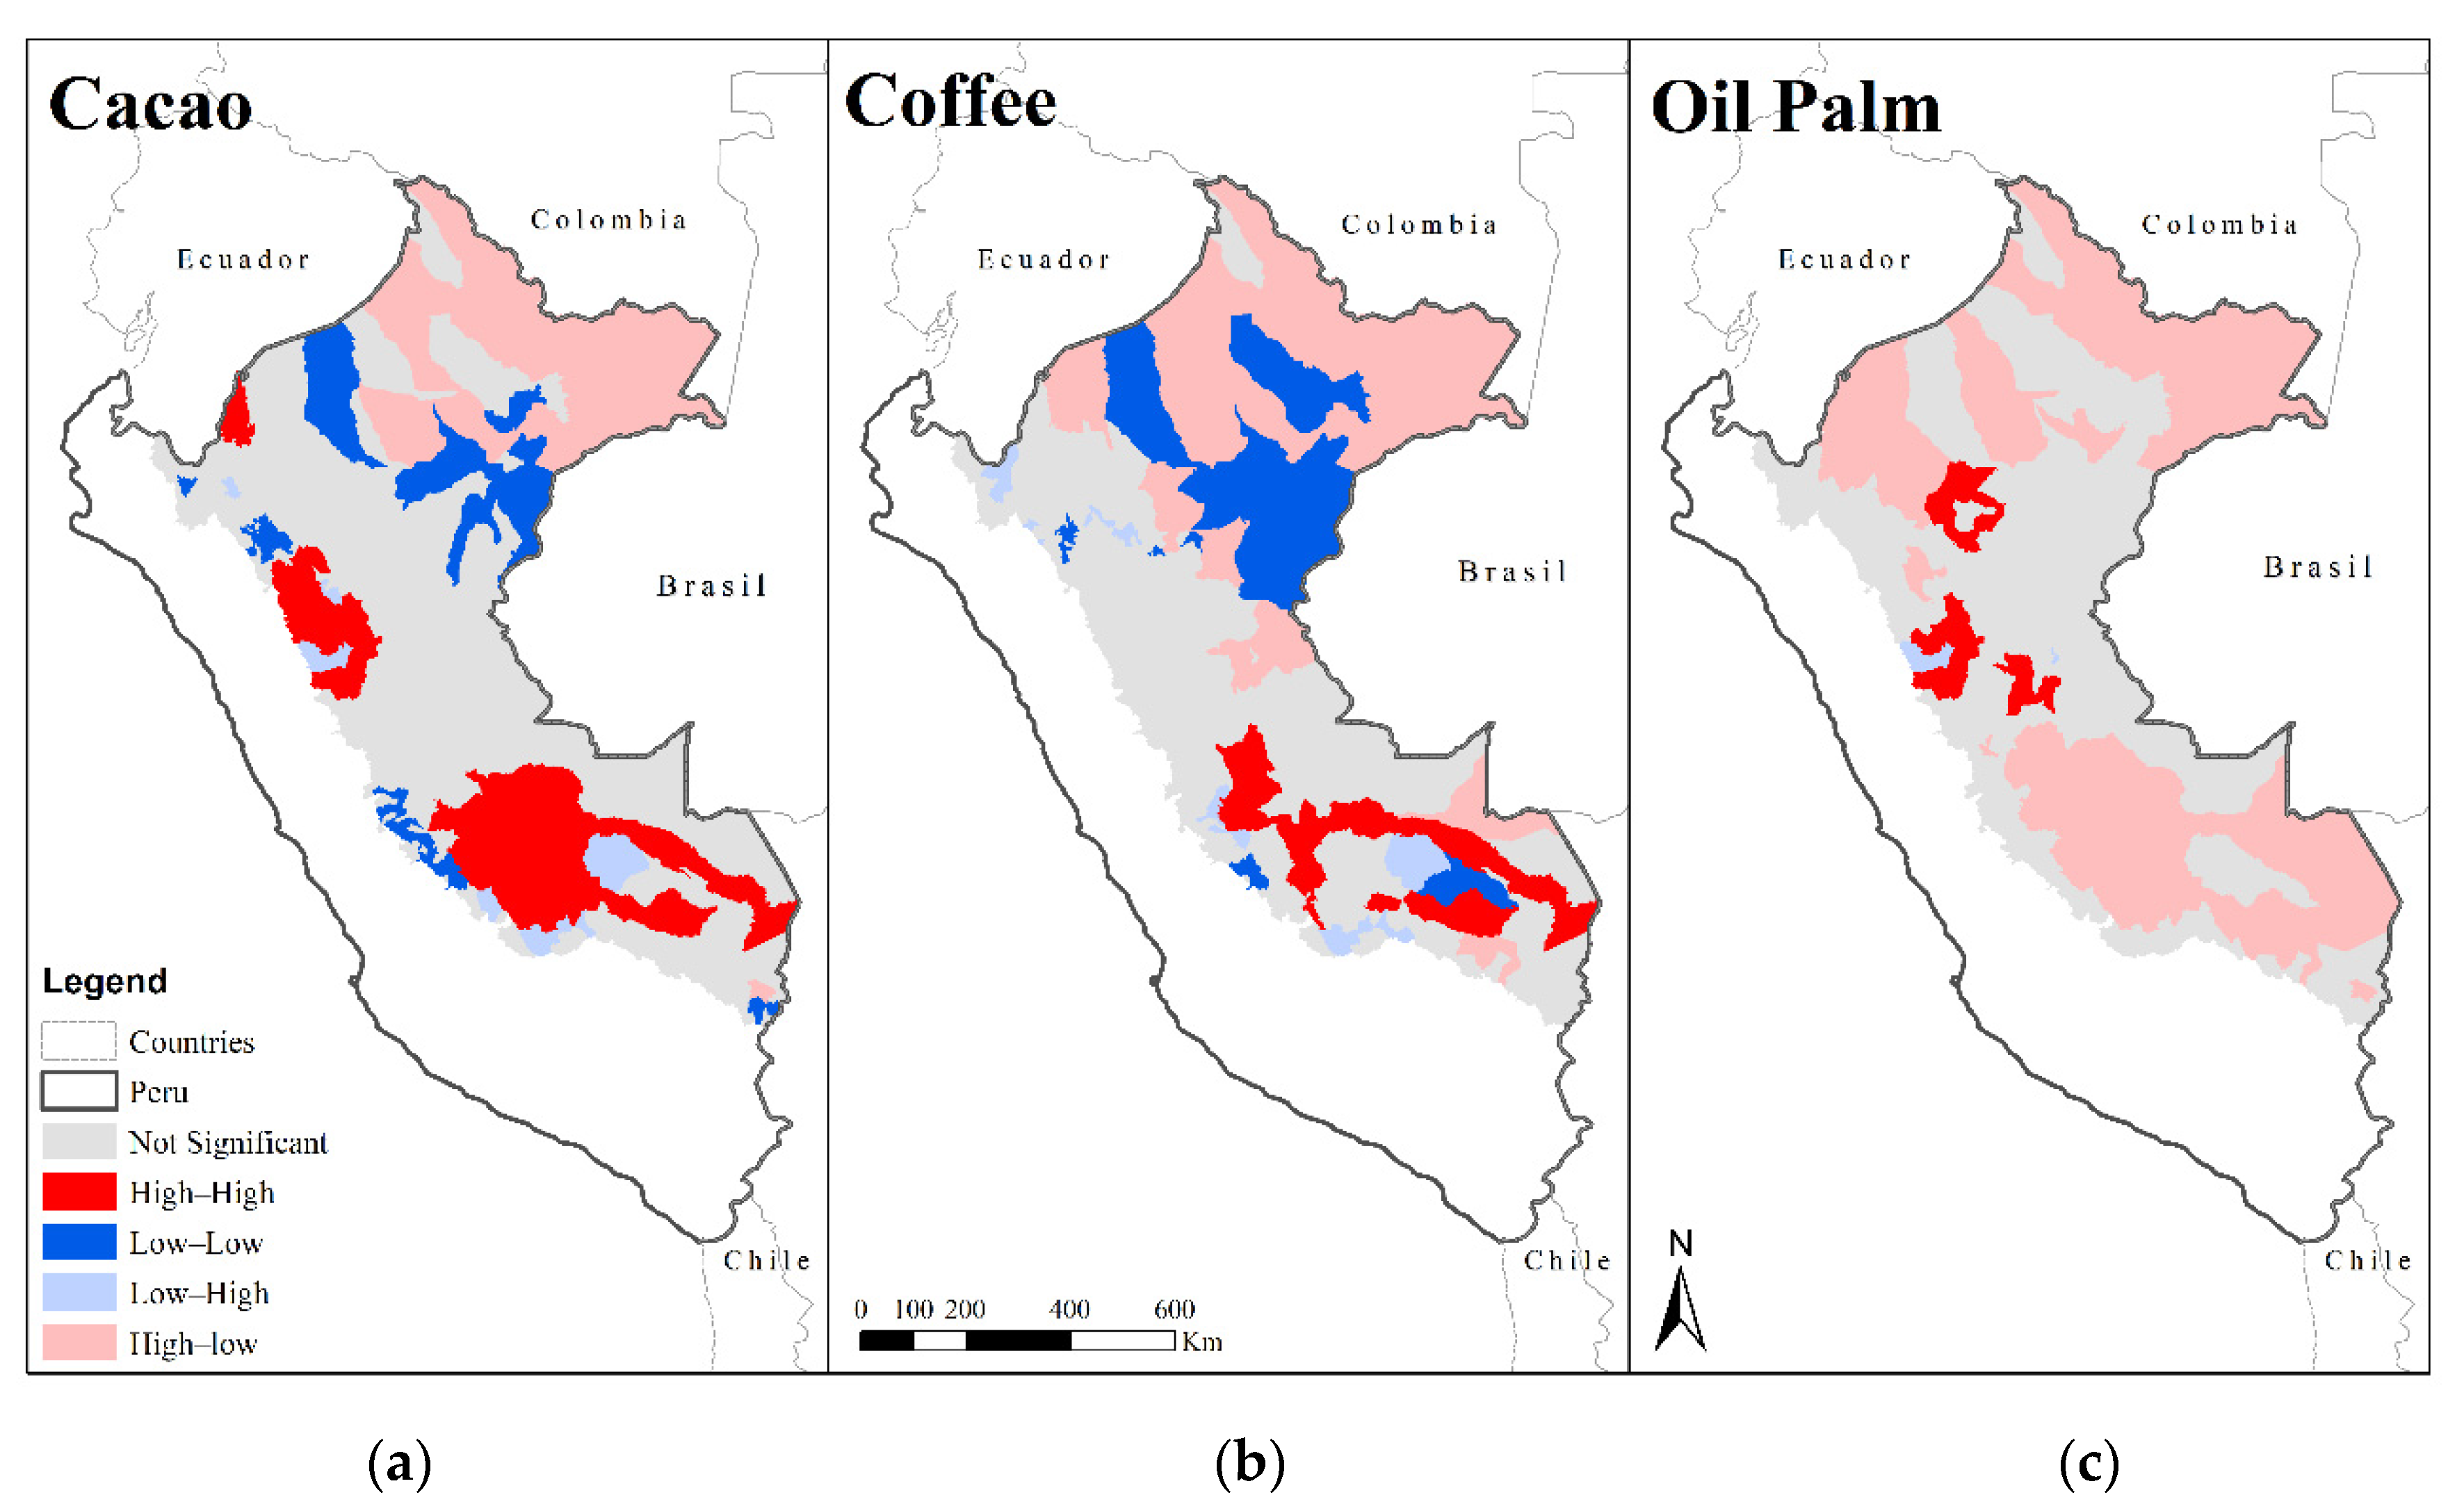
3.2. Spatial Associations between Deforestation and Areas Cultivated with Cacao, Coffee, and Oil Palm

The global bivariate Moran’s index values for deforestation and cacao (0.118), coffee (0.03), and oil palm (0.17) cultivation confirm low to moderate Amazon-level correlation coefficients. Figure 5 highlights the districts that have significant local Moran’s indices (p < 0.05) for different associations between deforestation and the production of the analyzed commodity crops. Table 2, meanwhile, shows the number of districts where these spatial associations exist.
The spatial clusters with high-high associations (red in Figure 5) denote districts with statistically significant high values of deforestation that are surrounded by districts with high values for the production of the analyzed commodities. The highest number of high-high associations was related to cacao production (22 districts). These districts are located in the Peruvian Amazon’s northern (nine in San Martin and Amazonas), central (nine in Junin, Huanuco, and Ucayali), and southern (four in Cuzco and Madre de Dios) departments. High-high associations related to coffee production were mainly identified in the central (five in Junín) and southern (four in Cuzco and Madre de Dios) departments. High-high associations related to oil palm production were identified within four departments: San Martín (six) and Loreto (four) in the north, and Huánuco (three) and Ucayali (two) in the center.
The spatial clusters with high-low associations (pink in Figure 5) denote districts with high values of deforestation that are surrounded by districts with low values for the production of the analyzed crops. Most districts with high-low associations are distributed within the Loreto department in the country’s north. This is particularly striking in the cases of coffee (21 of 29 districts) and cacao (all 14 districts) production. In the case of oil palm production, districts with high-low associations are more widely distributed, with a predominance within the Loreto (16 of 49 districts) and Madre de Dios (eight) departments.
The spatial clusters with low-high associations (light blue in Figure 5) denote districts with low values for the deforestation areas that are surrounded by districts with high values for the production of the analyzed crops. Districts with low-high associations are geographically dispersed. In the case of cacao and coffee production, low-high associations exist within the northern districts. Low-high associations linked to oil palm production are limited to five districts in the center of the Peruvian Amazon, specifically within the San Martín, Ucayali, Huánuco, and La Libertad departments.
The spatial clusters with low-low associations (dark blue in Figure 5) denote districts with low values for the deforestation areas that are surrounded by districts with low values for the analyzed crops. Low-low associations related to cacao and coffee production exist in several districts in Loreto, in Peru’s northeast. They are also prominent in the Amazonas department in the country’s north: Low-low associations related to cacao production exist in 43 of the 69 districts of Amazonas, and those related to coffee exist in 20 districts.

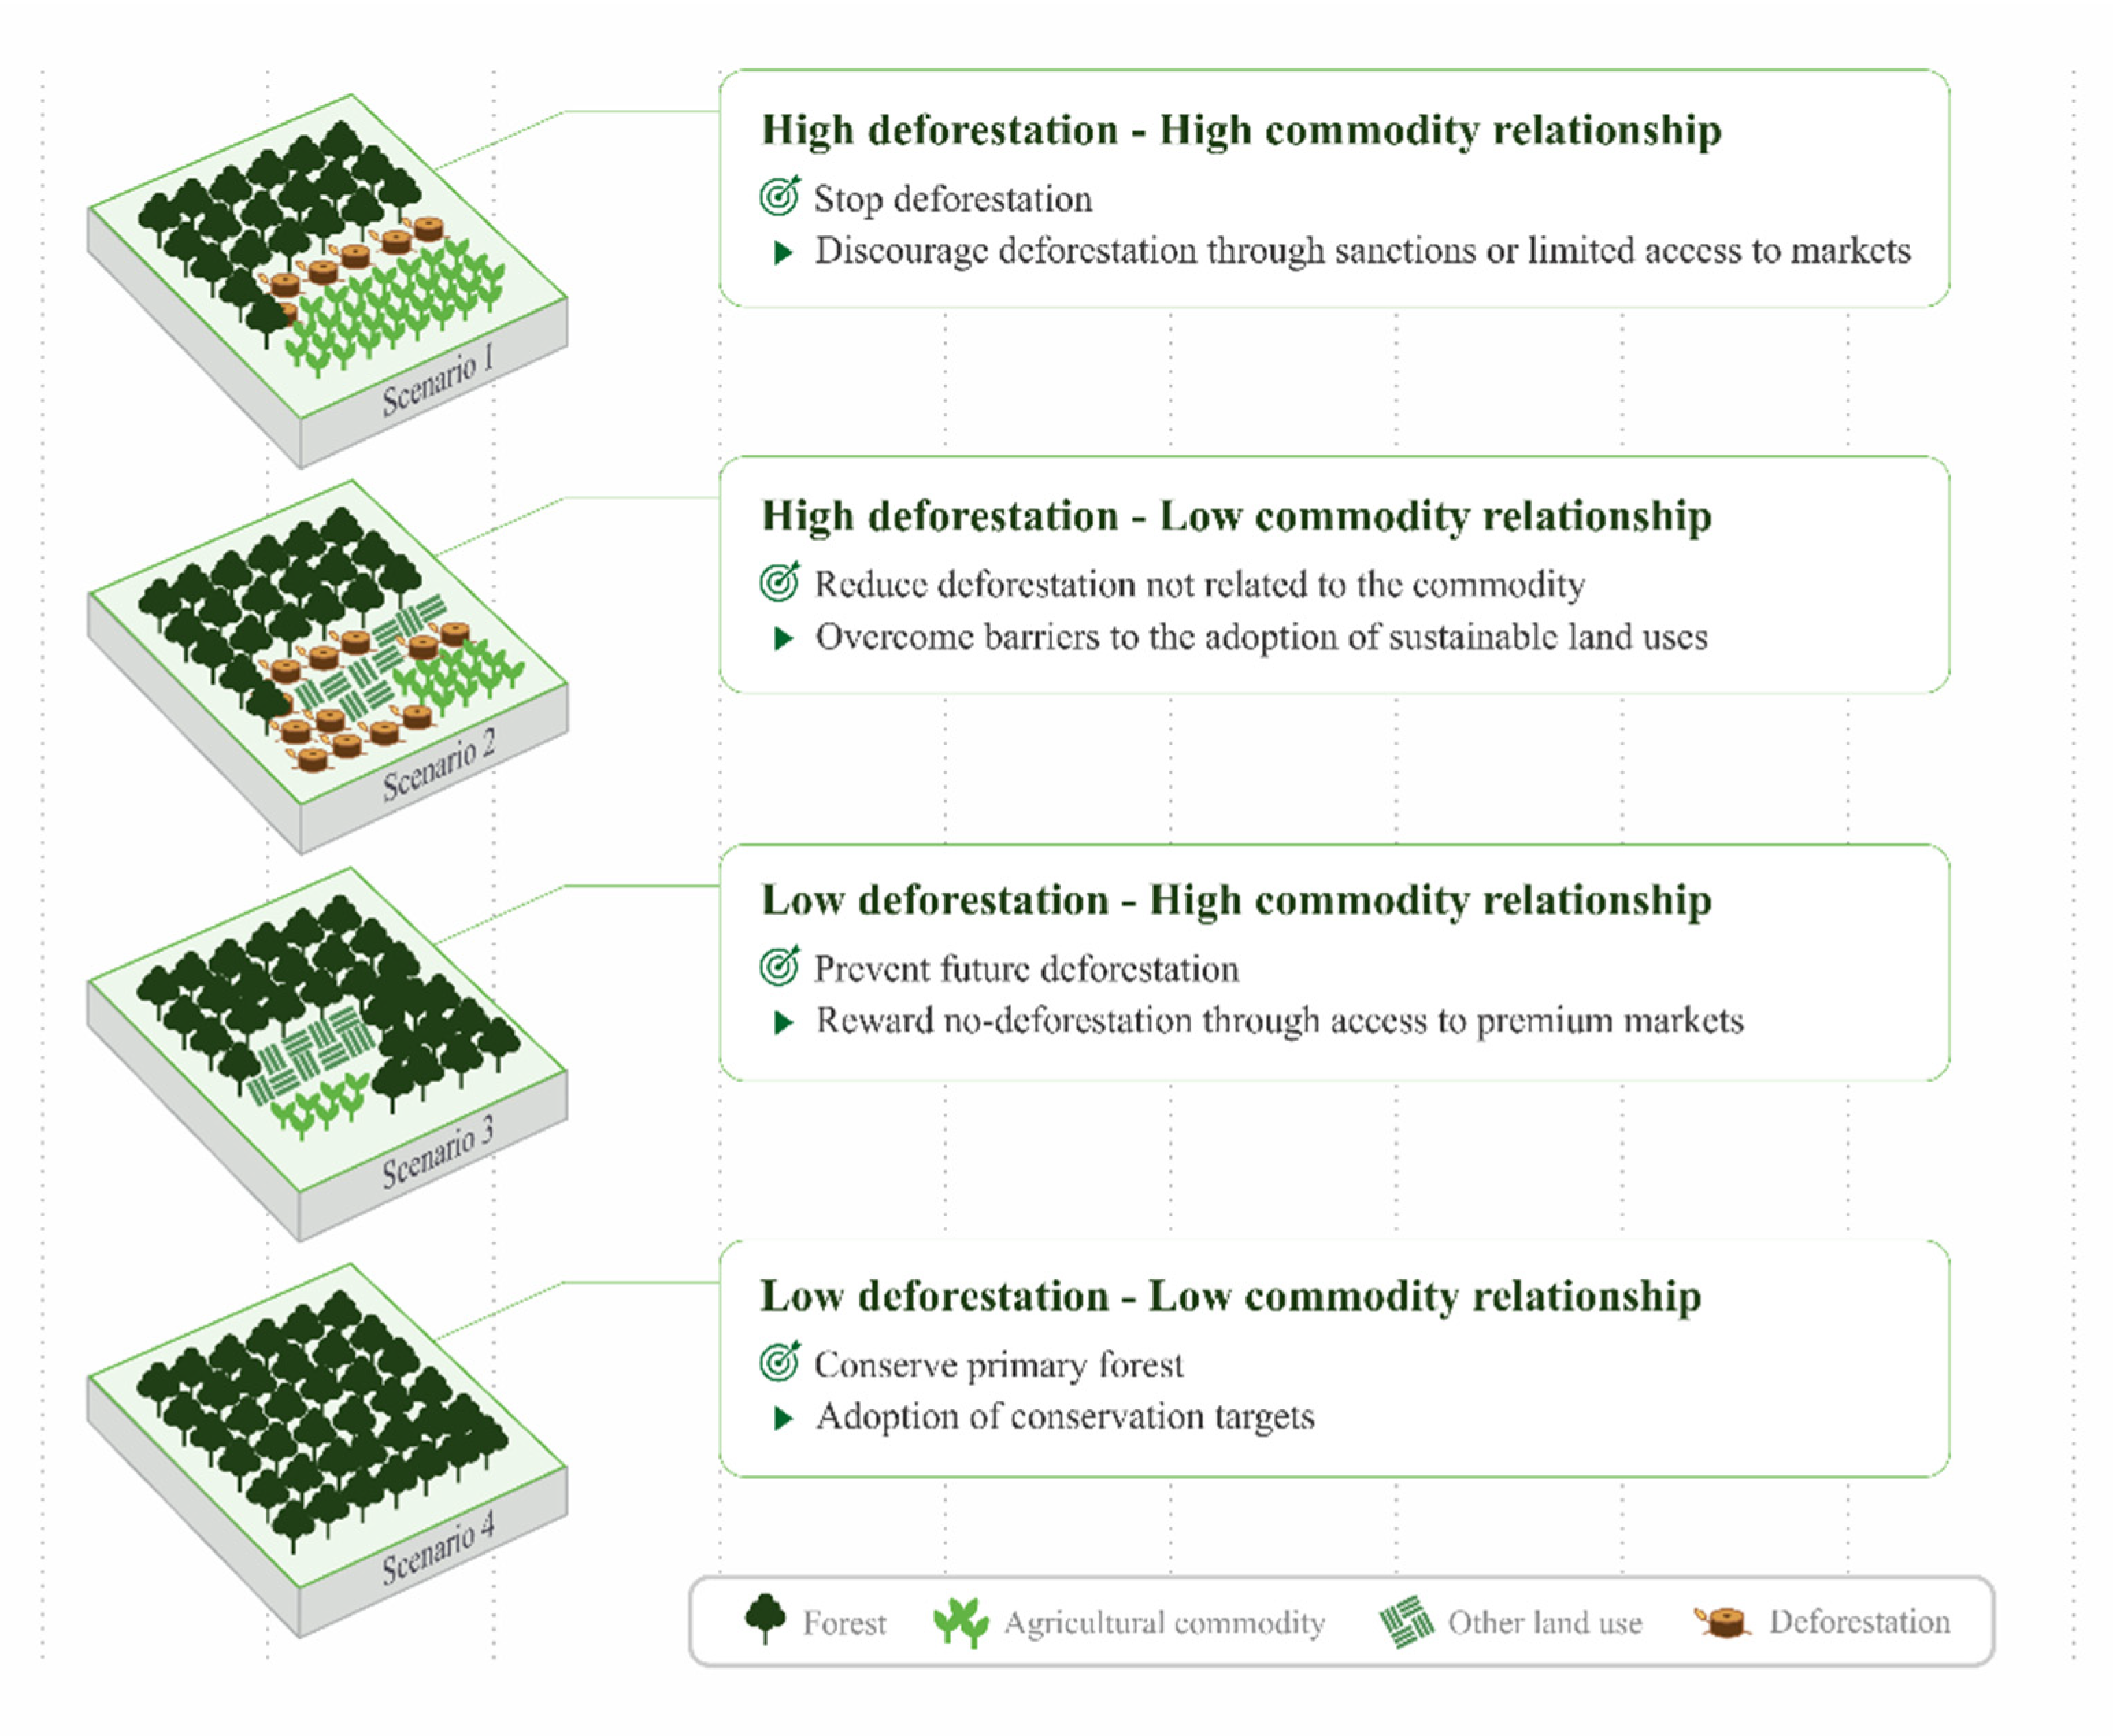
3.3. Scenarios under Which ZDSC Initiatives May Operate in Peru

On the basis of the above spatial associations, we propose four scenarios under which ZDSC initiatives may or may not operate in Peru, which we summarize in Figure 6. The first scenario describes a situation with a high degree of both deforestation and commodity crop production (high-high). Here, commodity crop production could be directly or indirectly part of land use transitions that cause deforestation. This scenario represents potential areas of interest for implementing ZDSC interventions because deforestation in these districts geographically overlaps with commodity production. The second scenario describes a situation with a high degree of deforestation and a low, or nonexistent, degree of commodity crop production (high-low). Here, commodity crop production may not drive deforestation, but other land uses and processes do. This scenario represents potential areas of interest for promoting deforestation-free agricultural production, improving the use of previously deforested lands, and avoiding the future conversion of forest areas to agricultural land. The third scenario describes a situation with a low degree of deforestation and a high degree of commodity crop production (low-high). Here, agriculture has yet to expand into forest areas, but high commodity crop production could pose a risk to intact or remaining forests in the foreseeable future, particularly in regions where such production exists near large tracts of unprotected forest areas. This scenario represents potential areas for sourcing deforestation-free commodities because low deforestation in these districts geographically overlaps with commodity crop production. The fourth scenario describes a situation with a low degree of both deforestation and commodity crop production (low-low).

4. Discussion

4.1. Spatial Associations between Deforestation and Cacao, Coffee, and Oil Palm Production

The results indicate different and geographically dispersed spatial associations between deforestation and cacao, coffee, and oil palm production, as estimated by the average deforested areas and the average cultivation areas for each commodity crop, both for the period between 2013 and 2018 in Peru. Amazon- and department-level Spearman’s rank correlations indicate spatial associations between deforestation and the production area of the analyzed crops, which are concentrated within specific Peruvian departments. The bivariate Moran’s index values show the local patterns of such spatial associations. Although Amazon-level correlations between deforestation and cacao, coffee, and oil palm production are low to moderate, correlations at the department level, and the Moran’s index values, highlight significant associations between some of Peru’s deforestation hotspots and higher-than-average commodity crop production, for instance, cacao in San Martín, coffee in Cusco, and oil palm in Ucayali. These associations, however, are located in specific districts. Local Moran maps for deforestation and the cultivated areas of the three commodity crops indicate that, depending on the district, deforestation could be: (1) high, where there is high commodity crop production (high-high); (2) high, where there is low commodity crop production (high-low); (3) low, where there is high commodity crop production (low-high); or (4) low, where there is low commodity crop production (low-low).

4.2. Scenarios Where ZDSC Initiatives May Operate in Peru

On the basis of this paper’s results, we argue that ZDSC initiatives may have a role under the high-high, high-low, and low-high scenarios. In contrast, under the low-low scenario, it may be strategic to create and maintain natural protected areas, setting conservation targets with local communities and establishing carbon markets to compensate for avoided deforestation from low-opportunity-cost agriculture [42,43]. Our arguments align with those derived from a recent global-level spatial assessment recommending adjustments to zero-deforestation commitments so that they do not leave behind any forest area where deforestation is not tied to international markets with high consumer awareness [31]. As the relation between commodities and deforestation differs between sites and crops, a more customized approach in the application of ZDSC may be required. A similar spatial analysis conducted in Colombia with cacao production also suggests the need for tailored zero-deforestation efforts because of the lack of a strong association between cacao production and deforestation there [22]. These spatial assessments highlight the need to have a greater understanding of spatial associations between deforestation and commodity production in order to determine where ZDSC interventions would be effective and combine them with other instruments to maximize zero-deforestation efforts.
Under the high-high scenario, ZDSC initiatives can play a clear role when deforestation is tied to international markets with high consumer awareness. Under this scenario, ZDSC commitments could require parties to provide commodity traceability and agreements to have sanctions imposed when breaking such commitments. Some researchers have proposed harsh sanctions for erring suppliers, such as excluding their participation in supply chains or limiting their access to markets [5,30,44,45]. Yet, alternatives to voluntary compliance through accessing premium markets may result in positive incentives for greater engagement [19,46]. For companies whose supply chains directly drive deforestation, but that choose not to join ZDSC initiatives, the state could introduce regulations to compel these companies to address the damage their supply chains have done to forests. Scholars have underscored such function of the state in order to ensure the sustainability of value chains [47,48]. Indeed, Peru can impose penalties under the Forest and Wildlife Law, which prohibits changing the use of land classified as a forest area to agriculture. It has done so against those that have cleared forest areas in Ucayali to produce oil palm [49]. For regulations to be enforced, however, effective monitoring mechanisms need to be in place in order to provide evidence against erring companies [50].
Under the high-low scenario, the role of ZDSC initiatives is not as straightforward as in the first scenario, particularly if deforestation is tied to domestic markets with low consumer awareness rather than to international markets. They could, nevertheless, help institutionalize the adoption of sustainable land use along the supply chain. This will require a detailed understanding of what drives deforestation. In Peru, this was the most common scenario, and it may be indicative of the disenfranchised nature of livelihood activities and subsistence agriculture in the country. One option for Peru is to couple ZDSC interventions with policies that promote sustainable agricultural production, such as agroforestry cacao, as a substitute for deforestation-causing livelihoods. Determining the approach’s unintended effects, such as leakage, warrants further investigation.
Under the low-high scenario, the role of ZDSC initiatives is also less clear, compared to the first, but could help limit deforestation, such as when parties agree to reward commodity producers who do not deforest. Peru may opt to blend ZDSC initiatives with carbon markets, premium market access, and funding mechanisms in order to incentivize actions against future deforestation [19,46], as well as with the provision of nonmonetary incentives, such as technical assistance and information access [5,14]. Because such producers potentially already meet zero-deforestation criteria, they could obtain benefits from engaging in ZDSC initiatives without making substantial changes to their production practices and, thus, undermine the purpose of such initiatives [20,51].

4.3. Additional Factors That ZDSC Interventions Need to Consider

The proposed scenarios exclude factors that may influence the above-mentioned spatial associations, including the presence of natural protected areas, REDD+ projects, land use policies, and existing ZDSC interventions. Other factors could be related to illegal practices and human displacement, or migration from urban areas to the countryside. Further survey-based and participatory research, as well as policy analyses that complement the results of existing satellite and geospatial analyses, can improve our findings given that executing some of the interventions needs to consider local realities, including the legal framework surrounding temporal land use trends [52].
In Peru’s case, the law prohibits agricultural production on land classified for forestry use, such as oil palm monoculture, but the government can grant concession on the use of such land for agroforestry systems, such as agroforestry cacao. Moreover, the data indicate that the production and consumption of agricultural and forest commodities linked to the domestic market pose a far greater deforestation risk than that of those linked to the international market [36]. Moreover, public sector and civil society discourses have pointed to small-scale low-opportunity-cost agriculture, rather than agricultural commodity production, as the main driver of deforestation in Peru overall [37]. However, evidence indicates that commercial agriculture causes significant deforestation, but in a localized manner [53].
For instance, recently released maps show massive deforestation linked to the cacao monocultures of United Cacao in Loreto, and monoculture oil palm plantations, including those attached to two awards from Grupo Palmas, in Loreto and Ucayali [54]. Another strategy pursued by companies, or other wealthy actors, is to engage in deforestation [55] with the intention to subsequently grab the land, or lease the cleared land, for commodity production [56]. This, in turn, may promote further land clearing, challenging zero-deforestation efforts. For instance, in the Colombian Amazon, migrant farmers establish “growth coalitions” with well-capitalized and organized actors, such as drug traffickers and armed groups, to produce illicit crops in remote forested areas. Returns from coca leaf production are then reinvested in deforestation activities to further expand the forest frontier [57]. A further examination of the interactions between smallholder commodity producers and enterprise-driven agriculture will be needed in order to evaluate if similar mechanisms apply to Peru.
The department of San Martín, in the north of Peru, exemplifies some of the complexities between commodity production and deforestation that prevail throughout the Peruvian Amazon. Deforestation rates in San Martín have remained consistently high during the past 15 years. The literature points to a broad range of deforestation drivers, some of which are associated with commodity agriculture, including coffee production [58], the expansion of oil palm plantations [53], and cacao production [59]. While our analysis confirms that the production of these commodities exists in San Martín, we find less conclusive evidence of their linkages with deforestation across the department. For instance, about 35,000 households are known to engage in coffee farming on an area of approximately 90,000 hectares [60], which could be expected to result in extensive pressure on forests. However, the outcomes of our spatial analyses show that, throughout San Martín, the production of coffee is not significantly associated with deforestation. Possibly, the coffee certification programs that are currently running in San Martín [61] incentivize farmers to operate on previously deforested lands. However, additional analyses, which are beyond the scope of this study, would be needed to confirm this.
In a similar manner, palm oil production has become more prominent in San Martín [62], but our analysis shows that significant associations with deforestation are also found in certain districts of the departments of Huánuco, Loreto, and Ucayali. Similarly, cacao production is prominent in certain districts in the departments of Ayacucho, Cuzco, Huánuco Junín, San Martín, and Ucayali. However, as both palm oil and cacao have been promoted as an alternative to coca cultivation [27], farmers may be turning other land use areas, such as coca plantations or pastures, into oil palm and cacao plantations, which might be an explanation for the weak links with deforestation in some locations.

4.4. Incorporating Concepts from the GVC Literature

Our study affirms the need to understand what causes deforestation at the jurisdictional or landscape scale in order to inform the mix of approaches and policy instruments to use for forest conservation. It might mean rethinking policy frameworks. Furthermore, the lack of homogeneity across commodities, regions, and institutional conditions points to challenges with regard to the definition of a reference date against which zero-deforestation initiatives would be designed, implemented, and assessed [5]. This lack of homogeneity also emphasizes the need for tailoring global goals and narratives to local contexts, as pointed out by others [5,19,30]. Where forests are indeed being replaced by specific commodities, the geographical targeting of supply chain initiatives could provide a means to stimulate the uptake of deforestation-free production practices [30]. In areas where deforestation-commodity relations are less straightforward, a better understanding of where, by whom, and for what reasons commodities are produced, and what types of land they replace, will be needed to guide the design of alternative modes of intervention.
Peru’s policy frameworks mainly focus on addressing deforestation due to both agricultural production for the global market, and low-opportunity-cost agriculture, but not so much on addressing deforestation connected with the domestic market. By verifying the associations between deforestation and agricultural commodity production within a particular context, stakeholders can maximize the benefits of their efforts of combining ZDSC and REDD+ interventions. Some on-the-ground initiatives have already done so. For instance, stakeholders of the cocoa and palm oil supply chains in Ucayali, Peru, have developed action plans that define opportunities along those supply chains and propose business models that promote deforestation-free oil palm production and a reduction in greenhouse gas emissions. They have done this through understanding the legal context for land use, and the links between commodity production and deforestation [63,64].
Our study likewise signals the need to broaden the perspective of the current strategies to ensure the success of zero-deforestation efforts by incorporating concepts from the GVC literature. On-the-ground initiatives in Peru, for instance, involve actions that align with the literature’s notions of governance and upgrading. The collaborative atmosphere under which the parties to the Coalition for Sustainable Production [65] have designed and implemented zero-deforestation interventions reflects a principle of public orchestration, a tool through which governments and intergovernmental organizations ensure the sustainable governance of value chains [47]. The above-mentioned zero-deforestation initiatives in Ucayali, Peru, promote sustainable business operations along the cocoa and palm oil supply chains that aim to upgrade actors, both economically, by increasing their competitiveness, and environmentally, by reducing their ecological footprint [23,65].

4.5. Limitations of the Methodology

The methods presented in this study followed a three-step approach to understanding deforestation-commodity relations at different spatial scales, whereby we narrowed down Peruvian Amazon-wide correlations to the subnational and district levels. Ideally, high-resolution crop and deforestation data should be used to better examine these relationships, but remote sensing datasets that can identify agricultural land uses for the entire Peruvian Amazon are currently not available. Alternatively, we obtained official survey-based crop datasets from the Peruvian Ministry of Agriculture, or MINAGRI, along with deforestation data, at the district level, from Peru’s Ministry of the Environment, or MINAM. The use of these relatively coarse datasets may have influenced our results to some extent. To our knowledge, however, they are the finest available. We also noticed that the overall deforestation and crop production patterns are in general agreement with the literature and public information. Despite this, the outcomes of this study provide novel insights for overcoming barriers to zero deforestation in the context of unclear deforestation-commodity relations. More specifically, reducing tropical deforestation requires a range of approaches and policies that are customized to respond to the complexity and dynamism of the drivers of deforestation at the landscape level [30].

5. Conclusions

Most ZDSC initiatives tend to focus on forest loss attached to large-scale commercial agriculture, aligning with global narratives around what drives deforestation. These initiatives can benefit from encompassing other factors that influence forest cover and addressing the risks to achieving the desired outcome, for instance, leakage due to the exclusion of erring producers who may also be essential to zero-deforestation efforts, such as smallholders and indigenous communities. By identifying associations between deforestation and agricultural commodity production in a particular area, the stakeholders of zero-deforestation initiatives can design interventions that are tailored to regions where agricultural commodity production does cause deforestation. This may then prevent leakage into areas where the agricultural commodity production does not yet cause, or is not causing, significant damage to the forest. Furthermore, blending these initiatives with policy instruments, such as REDD+, and broadening their perspective by adopting a GVC lens can maximize the benefits. All these, in turn, will help ensure that zero-deforestation initiatives will not leave any forest area behind.

Author Contributions

Conceptualization, A.C.C.-N., R.G. and M.E.J.V.; methodology, A.C.C.-N. and R.G; software, R.G.; formal analysis, R.G. and A.C.C.-N.; investigation, A.C.C.-N., M.E.J.V.; writing—original draft preparation, M.E.J.V., V.B. and A.C.C.-N.; writing—review and editing, A.C.C.-N., M.E.J.V., W.F., V.B., R.G.; visualization, R.G.; supervision, A.C.C.-N.; project administration, A.C.C.-N.; funding acquisition, A.C.C.-N. All authors have read and agreed to the published version of the manuscript.

Funding

This research results from the collaboration between the projects 18_III_101_PER_A_Drivers of Deforestation and 18_III_106_COL_A_Sustainable productive strategies. These projects are part of the International Climate Initiative (IKI). The Federal Ministry for the Environment, Nature Conservation and Nuclear Safety (BMU) supports this initiative on the basis of a decision adopted by the German Bundestag. The authors thank CIAT’s Erika Mosquera and Jonnathan Cespedes for providing graphic design support. This work is also part of the CGIAR Research Program on Water, Land and Ecosystems (WLE).

Institutional Review Board Statement

In undertaking this study, we complied with applicable guidelines and regulations relating to studies with human subjects, including the regulations of the institutional review board at the International Center for Tropical Agriculture (CIAT).

Informed Consent Statement

Not applicable.

Conflicts of Interest

The authors declare no conflict of interest.

References

  1. Pendrill, F.; Persson, U.M.; Godar, J.; Kastner, T. Deforestation Displaced: Trade in Forest-Risk Commodities and the Prospects for a Global Forest Transition. Environ. Res. Lett. 2019, 14, 055003. [Google Scholar] [CrossRef]
  2. IPCC. Climate Change and Land: An IPCC Special Report on Climate Change, Desertification, Land Degradation, Sustainable Land Management, Food Security, and Greenhouse Gas Fluxes in Terrestrial Ecosystems; Shukla, P.R., Skea, J., Calvo Buendía, E., Masson-Delmotte, V., Pörtner, H.-O., Roberts, D., Zhai, P., Slade, R., Connors, S., van Diemen, R., et al., Eds.; IPCC: Geneva, Switzerland, 2019. [Google Scholar]
  3. UNFCCC. Conference of Parties Report of the Conference of the Parties on Its Thirteenth Session, Held in Bali from 3 to 15 December 2007 Part One: Proceedings; UNFCCC: Bali, Indonesia, 2008. [Google Scholar]
  4. UNFCCC. Report of the Conference of the Parties on Its Nineteenth Session, Held in Warsaw from 11 to 23 November 2013. Addendum. Part Two: Action Taken by the Conference of the Parties at Its Nineteenth Session; UNFCCC: Warsaw, Poland, 2014. [Google Scholar]
  5. Lambin, E.F.; Gibbs, H.K.; Heilmayr, R.; Carlson, K.M.; Fleck, L.C.; Garrett, R.D.; le Polain de Waroux, Y.; McDermott, C.L.; McLaughlin, D.; Newton, P.; et al. The Role of Supply-Chain Initiatives in Reducing Deforestation. Nat. Clim. Chang. 2018, 8, 109–116. [Google Scholar] [CrossRef]
  6. Umunay, P.; Lujan, B.; Meyer, C.; Cobián, J. Trifecta of Success for Reducing Commodity-Driven Deforestation: Assessing the Intersection of REDD+ Programs, Jurisdictional Approaches, and Private Sector Commitments. Forests 2018, 9, 609. [Google Scholar] [CrossRef] [Green Version]
  7. Neeff, T.; Linhares-Juvenal, T. Zero-Deforestation Commitments A New Avenue towards Enhanced Forest Governance? FAO: Rome, Italy, 2018. [Google Scholar]
  8. Sunderlin, W.D.; Ekaputri, A.D.; Sills, E.O.; Duchelle, A.E.; Kweka, D.; Diprose, R.; Doggart, N.; Ball, S.; Lima, R.; Enright, A.; et al. The Challenge of Establishing REDD+ on the Ground Insights from 23 Subnational Initiatives in Six Countries; Center for International Forestry Research: Bogor, Indonesia, 2014. [Google Scholar]
  9. Donofrio, S.; Rothrock, P.; Leonard, J. Supply Change: Tracking Corporate Commitments to Deforestation-Free Supply Chains, 2017; Forest Trends Association: Washington, DC, USA, 2017. [Google Scholar]
  10. Assuncąo, J.; Gandour, C.; Rocha, R. Deforestation Slowdown in the Brazilian Amazon: Prices or Policies? Environ. Dev. Econ. 2015, 20, 697–722. [Google Scholar] [CrossRef] [Green Version]
  11. Alix-Garcia, J.; Gibbs, H.K. Forest Conservation Effects of Brazil’s Zero Deforestation Cattle Agreements Undermined by Leakage. Glob. Environ. Chang. 2017, 47, 201–217. [Google Scholar] [CrossRef]
  12. Bastos Lima, M.G.; Persson, U.M. Commodity-Centric Landscape Governance as a Double-Edged Sword: The Case of Soy and the Cerrado Working Group in Brazil. Front. For. Glob. Chang. 2020, 3, 27. [Google Scholar] [CrossRef]
  13. Essen, M.; Lambin, E.F. Jurisdictional Approaches to Sustainable Resource Use. Front. Ecol. Environ. 2021, 19, fee.2299. [Google Scholar] [CrossRef]
  14. Tropenbos International. Zero Deforestation: A Commitment to Change; Pasiecznik, N., Savenije, H., Eds.; Tropenbos International: Wageningen, The Netherlands, 2017; ISBN 978-90-5113-134-5. [Google Scholar]
  15. Garrett, R.D.; Levy, S.; Carlson, K.M.; Gardner, T.A.; Godar, J.; Clapp, J.; Dauvergne, P.; Heilmayr, R.; le Polain de Waroux, Y.; Ayre, B.; et al. Criteria for Effective Zero-Deforestation Commitments. Glob. Environ. Chang. 2019, 54, 135–147. [Google Scholar] [CrossRef]
  16. Heilmayr, R.; Carlson, K.M.; Benedict, J.J. Deforestation Spillovers from Oil Palm Sustainability Certification. Environ. Res. Lett. 2020, 15, 075002. [Google Scholar] [CrossRef]
  17. Meyfroidt, P.; Börner, J.; Garrett, R.; Gardner, T.; Godar, J.; Kis-Katos, K.; Soares-Filho, B.S.; Wunder, S.; Meyfroidt, P. Focus on Leakage and Spillovers: Informing Land-Use Governance in a Tele-Coupled World. Environ. Res. Lett. 2020, 15, 090202. [Google Scholar] [CrossRef]
  18. Food and Agriculture Organization. Global Forest Resource Assessment 2020; FAO: Rome, Italy, 2020. [Google Scholar]
  19. Newton, P.; Agrawal, A.; Wollenberg, L. Enhancing the Sustainability of Commodity Supply Chains in Tropical Forest and Agricultural Landscapes. Glob. Environ. Chang. 2013, 23, 1761–1772. [Google Scholar] [CrossRef]
  20. Blackman, A.; Rivera, J. Producer-Level Benefits of Sustainability Certification. Conserv. Biol. 2011, 25, 1176–1185. [Google Scholar] [CrossRef] [PubMed]
  21. European Commission EU Communication (2019) on Stepping up EU Action to Protect and Restore the World’s Forests. Available online: https://ec.europa.eu/environment/forests/eu_comm_2019.htm (accessed on 1 October 2021).
  22. Castro-Nunez, A.; Charry, A.; Castro-Llanos, F.; Sylvester, J.; Bax, V. Reducing Deforestation through Value Chain Interventions in Countries Emerging from Conflict: The Case of the Colombian Cocoa Sector. Appl. Geogr. 2020, 123, 102280. [Google Scholar] [CrossRef]
  23. de Marchi, V.; di Maria, E.; Krishnan, A.; Ponte, S. Environmental upgrading in global value chains. In Handbook on Global Value Chains; Ponte, S., Gary, G., Raj-Reichert, G., Eds.; Edward Elgar Publishing: Cheltenham, UK, 2019; pp. 310–323. ISBN 9781788113762. [Google Scholar]
  24. Mentzer, J.T.; DeWitt, W.; Keebler, J.S.; Min, S.; Nix, N.W.; Smith, C.D.; Zacharia, Z.G. Defining Supply Chain Management. J. Bus. Logist. 2001, 22, 1–25. [Google Scholar] [CrossRef]
  25. Gereffi, G.; Lee, J. Economic and Social Upgrading in Global Value Chains and Industrial Clusters: Why Governance Matters. J. Bus. Ethics 2016, 133, 25–38. [Google Scholar] [CrossRef]
  26. Lambin, E.F.; Gibbs, H.K.; Ferreira, L.; Grau, R.; Mayaux, P.; Meyfroidt, P.; Morton, D.C.; Rudel, T.K.; Gasparri, I.; Munger, J. Estimating the World’s Potentially Available Cropland Using a Bottom-up Approach. Glob. Environ. Chang. 2013, 23, 892–901. [Google Scholar] [CrossRef]
  27. Cabieses, H. The “miracle of San Martín” and Symptoms of “Alternative Development” in Peru Conclusions & Recommendations. Available online: https://www.tni.org/en/briefing/miracle-san-martin-and-symptoms-alternative-development-peru (accessed on 25 October 2021).
  28. Bennett, A.; Ravikumar, A.; Cronkleton, P. The Effects of Rural Development Policy on Land Rights Distribution and Land Use Scenarios: The Case of Oil Palm in the Peruvian Amazon. Land Use Policy 2018, 70, 84–93. [Google Scholar] [CrossRef]
  29. Meyer, C.; Miller, D. Zero Deforestation Zones: The Case for Linking Deforestation-Free Supply Chain Initiatives and Jurisdictional REDD+. J. Sustain. For. 2015, 34, 559–580. [Google Scholar] [CrossRef] [Green Version]
  30. Seymour, F.; Harris, N.L. Reducing Tropical Deforestation. Science 2019, 365, 756–757. [Google Scholar] [CrossRef] [PubMed] [Green Version]
  31. Leijten, F.; Sim, S.; King, H.; Verburg, P.H. Which Forests Could Be Protected by Corporate Zero Deforestation Commitments? A Spatial Assessment. Environ. Res. Lett. 2020, 15, 064021. [Google Scholar] [CrossRef]
  32. Ferrer Velasco, R.; Köthke, M.; Lippe, M.; Günter, S. Scale and Context Dependency of Deforestation Drivers: Insights from Spatial Econometrics in the Tropics. PLoS ONE 2020, 15, e0226830. [Google Scholar] [CrossRef] [PubMed]
  33. Global Forest Watch Peru Deforestation Rates & Statistics. Available online: https://www.globalforestwatch.org/dashboards/country/PER/ (accessed on 26 October 2020).
  34. Government of Peru Estrategia Nacional Sobre Bosques y Cambio Climático 2016. Available online: http://www.bosques.gob.pe/archivo/ff3f54_ESTRATEGIACAMBIOCLIMATICO2016_ok.pdf (accessed on 31 July 2021).
  35. Governments of Peru Germany and Norway Joint Declaration of Intent between the Government of the Republic of Peru, the Government of the Kingdom of Norway and the Government of the Federal Republic of Germany on “Cooperation on Reducing Greenhouse Gas Emissions from Deforestation and Forest De 2014. Available online: https://www.regjeringen.no/contentassets/b324ccc0cf88419fab88f2f4c7101f20/declarationofintentperu.pdf (accessed on 31 July 2021).
  36. Pendrill, F.; Persson, U.M.; Kastner, T. Deforestation Risk Embodied in Production and Consumption of Agricultural and Forestry Commodities 2005–2017. Available online: https://zenodo.org/record/4250532#.YXbAB44zZPY (accessed on 31 July 2021).
  37. Ravikumar, A.; Sears, R.R.; Cronkleton, P.; Menton, M.; Pérez-Ojeda del Arco, M. Is Small-Scale Agriculture Really the Main Driver of Deforestation in the Peruvian Amazon? Moving beyond the Prevailing Narrative. Conserv. Lett. 2017, 10, 170–177. [Google Scholar] [CrossRef] [Green Version]
  38. Ministerio del Ambiente (MINAM) Geobosques 2018. Available online: http://www.bosques.gob.pe/notasdeprensa/geobosques-del-minam-gano-premio-conectarse-para-crecer-2018-en-la-categoria-estado-nacional (accessed on 31 July 2021).
  39. Ministerio de Agricultura y Riego (MINAGRI) District Level Data on Cacao, Coffee, Palm Oil and Cattle Production in Peru (Unpublished Dataset) 2018.
  40. Instituto Nacional de Estadística e Informática (INEI) Encuesta Nacional Agropecuaria 2016. Available online: https://www.inei.gob.pe/media/MenuRecursivo/boletines/exposicion_ena2016.pdf (accessed on 31 July 2021).
  41. Anselin, L. Local Indicators of Spatial Association—LISA. Geogr. Anal. 1995, 27, 93–115. [Google Scholar] [CrossRef]
  42. Brown, S.; Zarin, D. What Does Zero Deforestation Mean? Science 2013, 342, 805–807. [Google Scholar] [CrossRef]
  43. Lyons-White, J.; Pollard, E.H.B.; Catalano, A.S.; Knight, A.T. Rethinking Zero Deforestation beyond 2020 to More Equitably and Effectively Conserve Tropical Forests. One Earth 2020, 3, 714–726. [Google Scholar] [CrossRef]
  44. Deans, H.; Ros-Tonen, M.A.F.; Derkyi, M. Advanced Value Chain Collaboration in Ghana’s Cocoa Sector: An Entry Point for Integrated Landscape Approaches? Environ. Manag. 2018, 62, 143–156. [Google Scholar] [CrossRef]
  45. Furumo, P.R.; Lambin, E.F. Scaling up Zero-Deforestation Initiatives through Public-Private Partnerships: A Look inside Post-Conflict Colombia. Glob. Environ. Chang. 2020, 62, 102055. [Google Scholar] [CrossRef]
  46. Carlson, K.M.; Heilmayr, R.; Gibbs, H.K.; Noojipady, P.; Burns, D.N.; Morton, D.C.; Walker, N.F.; Paoli, G.D.; Kremen, C. Effect of Oil Palm Sustainability Certification on Deforestation and Fire in Indonesia. Proc. Natl. Acad. Sci. USA 2018, 115, 121–126. [Google Scholar] [CrossRef] [PubMed] [Green Version]
  47. Ponte, S. Green Capital Accumulation: Business and Sustainability Management in a World of Global Value Chains. New Political Econ. 2020, 25, 72–84. [Google Scholar] [CrossRef]
  48. Navarrete, S.D.S.; Borini, F.M.; Avrichir, I. Environmental Upgrading and the United Nations Sustainable Development Goals. J. Clean. Prod. 2020, 264, 121563. [Google Scholar] [CrossRef]
  49. Instituto de Defensa Legal Ministry of Agriculture Denies Environmental Certification to Palm Grower Ocho Sur P. Available online: https://www.idl.org.pe/ministerio-de-agricultura-deniega-certificacion-ambiental-a-la-palmicultora-ocho-sur-p/ (accessed on 8 April 2021).
  50. Kaplinsky, R.; Morris, M. How Regulation and Standards Can Support Social and Environmental Dynamics in Global Value Chains. Available online: https://www.greengrowthknowledge.org/sites/default/files/downloads/resource/How%20Regulation%20and%20Standards%20Can%20Support%20Social%20and%20Environmental%20Dynamics%20in%20Global%20Value%20Chains.pdf. (accessed on 31 July 2021).
  51. Lambin, E.F.; Meyfroidt, P.; Rueda, X.; Blackman, A.; Börner, J.; Cerutti, P.O.; Dietsch, T.; Jungmann, L.; Lamarque, P.; Lister, J.; et al. Effectiveness and Synergies of Policy Instruments for Land Use Governance in Tropical Regions. Glob. Environ. Chang. 2014, 28, 129–140. [Google Scholar] [CrossRef]
  52. Pacheco, P.; Schoneveld, G.; Dermawan, A.; Komarudin, H.; Djama, M. Governing Sustainable Palm Oil Supply: Disconnects, Complementarities, and Antagonisms between State Regulations and Private Standards. Regul. Gov. 2018, 14, 568–598. [Google Scholar] [CrossRef]
  53. Vijay, V.; Reid, C.D.; Finer, M.; Jenkins, C.N.; Pimm, S.L. Deforestation Risks Posed by Oil Palm Expansion in the Peruvian Amazon. Environ. Res. Lett. 2018, 13, 114010. [Google Scholar] [CrossRef]
  54. Monitoring of the Andean Amazon Project MAAP # 134: Agriculture and Deforestation in the Peruvian Amazon | MAAP. Available online: https://maaproject.org/2021/deforestacion-agricultura-peru/ (accessed on 5 April 2021).
  55. Rudel, T.K.; Horowitz, B. Tropical Deforestation: Small Farmers and Land Clearing in the Ecuadorian Amazon; Columbia University Press: New York, NY, USA, 1993. [Google Scholar]
  56. Castro-Nunez, A.; Mertz, O.; Sosa, C.C. Geographic Overlaps between Priority Areas for Forest Carbon-Storage Efforts and Those for Delivering Peacebuilding Programs: Implications for Policy Design. Environ. Res. Lett. 2017, 12, 054014. [Google Scholar] [CrossRef] [Green Version]
  57. Castro-Nunez, A.; Mertz, O.; Buritica, A.; Sosa, C.C.; Lee, S.T. Land Related Grievances Shape Tropical Forest-Cover in Areas Affected by Armed-Conflict. Appl. Geogr. 2017, 85, 39–50. [Google Scholar] [CrossRef]
  58. Raschio, G.; Smetana, S.; Contreras, C.; Mathys, A.; Heinz, V. Spatiotemporal Tools for Regional Low-Carbon Development: Linking LCA and GIS to Assess Clusters of GHG Emissions from Cocoa Farming in Peru. In Sustainability Through Innovation in Product Life Cycle Design; Springer: Singapore, 2017; pp. 969–980. [Google Scholar]
  59. Jezeer, R.; Verweij, P. Shade Grown Coffee-Double Dividend for Biodiversity and Small-Scale Coffee Farmers in Peru; Hivos: Hague, The Netherlands, 2015. [Google Scholar]
  60. Palomino, E.R.; Hilario Meza, S.; Robles Montes, D.; Sotelo Raffo, F.; Wei-Shuo, L. Organic Coffee Supply Chain Management in the San Martin Region of Peru. Int. J. Innov. Manag. Technol. 2017, 8, 9–16. [Google Scholar] [CrossRef] [Green Version]
  61. Gutiérrez-Vélez, V.H.; DeFries, R.; Pinedo-Vásquez, M.; Uriarte, M.; Padoch, C.; Baethgen, W.; Fernandes, K.; Lim, Y. High-Yield Oil Palm Expansion Spares Land at the Expense of Forests in the Peruvian Amazon. Environ. Res. Lett. 2011, 6, 044029. [Google Scholar] [CrossRef]
  62. Charry, A.; Vélez, A.F.; Romero, M.; Ivanova, Y.; Tristán, M.C.; Lema, S.; Sánchez Choy, J.; Orjuela, F.; Jäger, M. Comprehensive Strategy to Strengthen the Competitiveness Plan of the Oil Palm Chain in Ucayali; Centro Internacional de Agricultura Tropical (CIAT): Palmira, Colombia, 2020. [Google Scholar]
  63. Ivanova, Y.; Tristán, M.C.; Romero, M.; Charry, A.; Lema, S.; Sánchez Choy, J.; Vélez, A.; Castro, A.; Quintero, M. Moving towards a Deforestation-Free Cacao and Chocolate Value Chain with Low Greenhouse Gas Emissions Current Status, Opportunities and an Action Plan for the Ucayali Region; Centro Internacional de Agricultura Tropical (CIAT): Palmira, Colombia, 2020. [Google Scholar]
  64. Earth Innovation Institute Peru-Based Coalition Releases Roadmap on Sustainability and Forest Protection-Earth Innovation Institute. Available online: https://earthinnovation.org/2020/07/peru-based-coalition-releases-roadmap-on-sustainability-and-forest-protection/ (accessed on 8 April 2021).
  65. Gereffi, G.; Fernandez-Stark, K. Global Value Chain Analysis: A Primer, 2nd ed.; Duke GVC Center: Durham, NC, USA, 2016. [Google Scholar]
Figure 1. Peruvian Amazon study area. The above map depicts deforestation at the district level for the period 2013–2018. Data were obtained from the Peruvian Ministry of the Environment, or MINAM [38].
Sustainability 13 12138 g001
Figure 2. Deforested area from 2001 to 2018 by department. Red indicates higher deforestation values, while green indicates lower deforestation values. Multiply the color bar values by 10,000 to obtain the deforested area in hectares.
Sustainability 13 12138 g002
Figure 3. Average cultivated area of cacao, coffee, and oil palm between 2013 and 2018 by department. Data were obtained from the Peruvian Ministry of Agriculture and Irrigation [39] and National Institute of Statistics and Informatics [40].
Sustainability 13 12138 g003
Figure 4. Map showing the distribution of average cultivated areas of cacao (a), coffee (b), and oil palm (c) between 2013 and 2018, by district.
Sustainability 13 12138 g004
Figure 5. Local Moran’s indices maps for the deforestation areas and the cultivated areas of cacao (a), coffee (b), and oil palm (c) for the period between 2013 and 2018. Districts with p-values < 0.05 are highlighted as follows: Red represents districts with high values of deforestation that are surrounded by municipalities with high values for areas cultivated with cacao, coffee, and oil palm (high-high); blue represents districts with low values of deforestation that are surrounded by districts with low values for areas cultivated with cacao, coffee, and oil palm (low-low); light blue represents districts with low values of deforestation that are surrounded by districts with high values for areas cultivated with cacao, coffee, and oil palm (low-high); and pink represents districts with high values of deforestation that are surrounded by districts with low values for areas cultivated with cacao, coffee, and oil palm (high-low). Light grey represents locations with nonsignificant (p > 0.05) local Moran’s statistics.
Sustainability 13 12138 g005
Figure 6. Possible scenarios for the application of ZDSC interventions.
Sustainability 13 12138 g006
Table 1. Spearman’s rank correlation coefficients for associations between deforestation areas and the areas cultivated with cacao, coffee, and oil palm between 2013 and 2018. Amazon Region ρ is the Spearman’s rank correlation coefficient for all districts in the Peruvian Amazon, whereas department ρ is the Spearman’s rank correlation coefficient for all districts within defined departments. Values assigned constitute significant correlation coefficients at the 0.05 level or lower.
DepartmentDistricts (#)CacaoCoffeeOil Palm
Amazonas830.390.55NA
Ayacucho7not sig.0.88NA
Cajamarca19not sig.0.68NA
Cusco180.48not sig.NA
Huancavelica4NANANa
Huanuco250.55not sig.not sig.
Junin270.60.72NA
La Libertad3NANANA
Loreto47not sig.not sig.0.35
Madre De Dios100.66not sig.NA
Pasco100.75not sig.NA
Piura5NAnot sig.NA
Puno160.650.74NA
San Martin770.610.480.38
Ucayali140.720.76not sig.
Amazon Region ρ3650.460.180.31
Table 2. Number of districts associated with the four different spatial associations between the presence of deforestation and the production of cocoa, coffee, and oil palm.
AssociationCacaoCoffeeOil Palm
High deforestation-high crop production221015
High deforestation-low crop production142949
Low deforestation-high crop production17305
Low deforestation-low crop production6944-
Not significant243252296
Publisher’s Note: MDPI stays neutral with regard to jurisdictional claims in published maps and institutional affiliations.

