
Cross-Contamination as a Problem in Collection and Analysis of Environmental Samples Containing Microplastics—A Review


Abstract
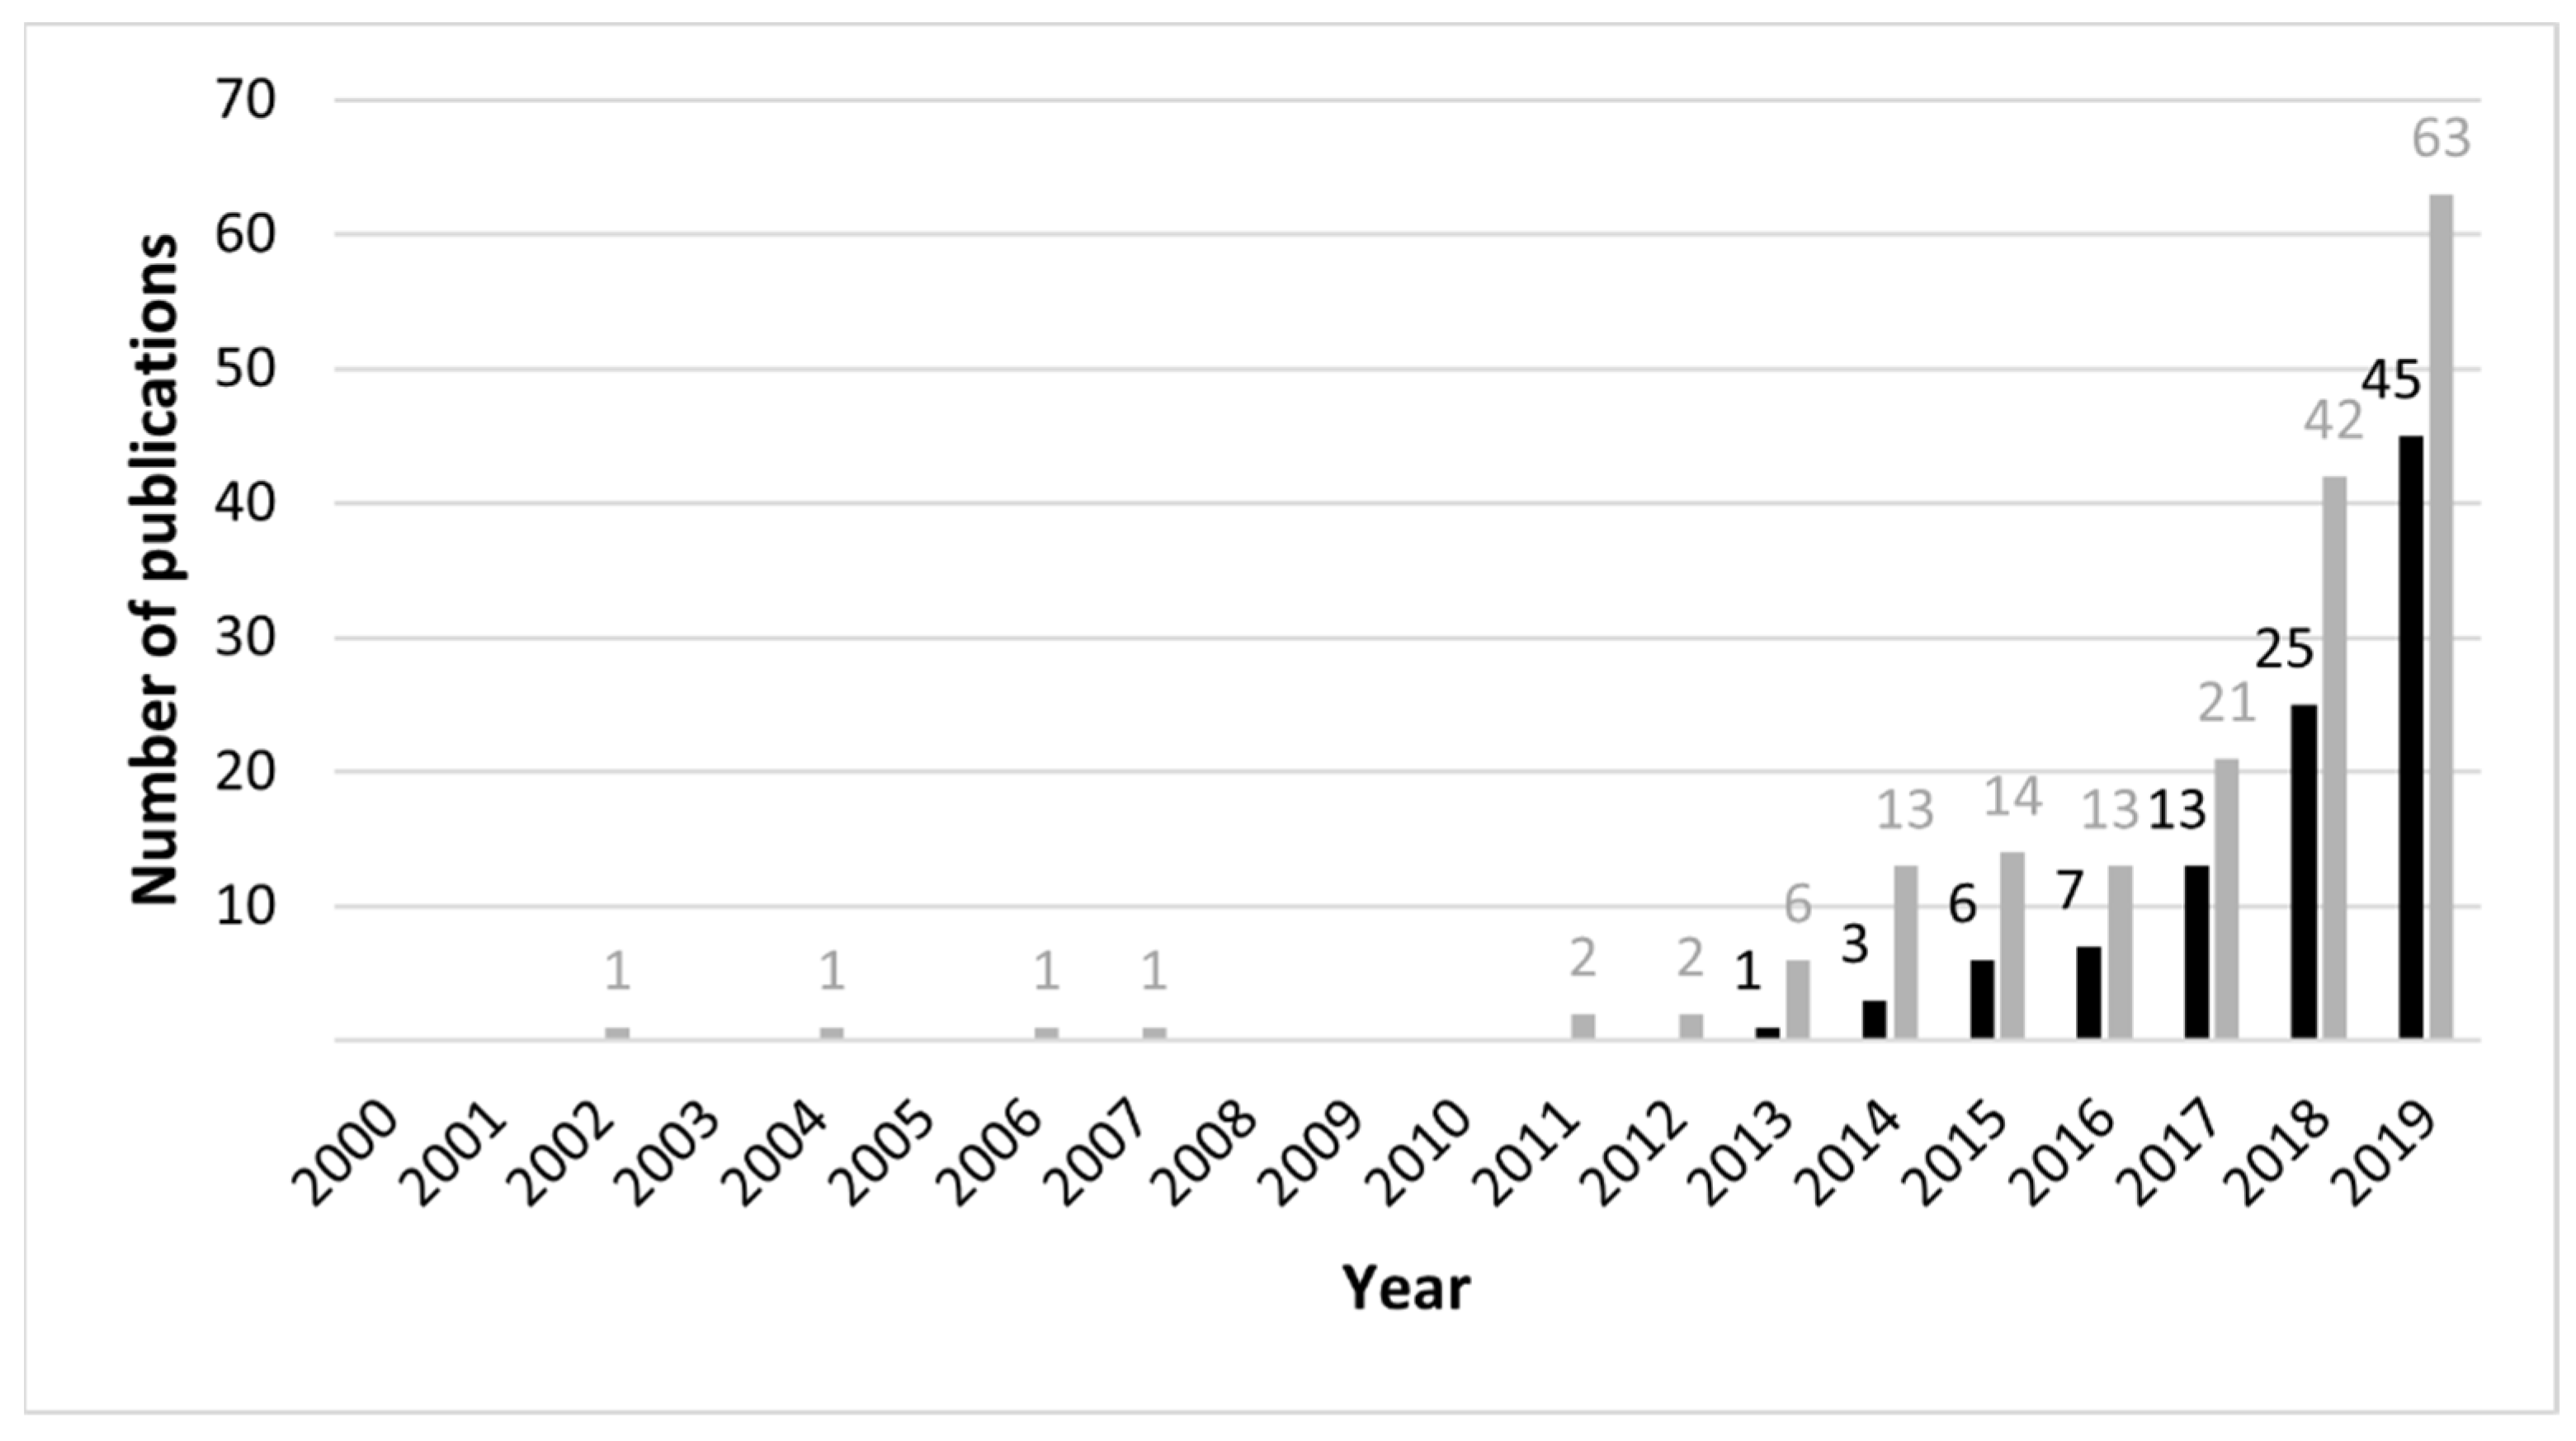
:1. Introduction
2. Sources of Cross-Contamination
3. Methods of Reducing Cross-Contamination
4. Assessment of Cross-Contamination
5. Control of Cross-Contamination in Practice
6. Conclusions
Supplementary Materials
Author Contributions
Funding
Institutional Review Board Statement
Informed Consent Statement
Data Availability Statement
Conflicts of Interest
Appendix A

| Type of Sample | Sampling Location | Control Samples (Yes/No) | Level of Microplastic Contamination (±SD) | Cross-Contamination Mitigation Methods | Ref. |
|---|---|---|---|---|---|
| water, biota | North Atlantic Ocean, Rockall Trough | Yes | 70.8 items/m3 | Whenever possible, equipment made of metal or glass was used during sampling and sample analysis. All equipment was wiped three times with 70% ethanol prior to use. Deck was flushed with water from the ship’s fire hose prior to work. The number of people working with the samples was reduced to a minimum. Personal protective equipment was worn during sampling. Samples of fibres from clothing, ropes from the ship, or other potential sources of contamination were collected for comparative analysis with water samples. All water filters and hoses on the deck were thoroughly checked for contamination. The spigot of each Niskin bottle was rinsed with deionised water prior to sampling. The door was kept closed throughout the experiment and the air ventilation was sealed. Work surfaces were cleaned three times with 70% ethanol prior to work. All equipment was inspected under a microscope before use. Samples were kept covered. Laboratory coats made of cotton and clothes made of natural fibres were worn. Control samples were run. | [13] |
| water | Canada, Vancouver Island, Baynes Sound | Yes | 5.28 (±4.17) items/L (1 L jar samples) 0.91 (±0.76) items/L (10 L bucket samples) | Sample analysis was carried out in a laminar flow hood. Coveralls made of cotton and headscarves were worn. The microscope was enclosed in a clear plastic cover during visual identification. Procedural blanks were run. | [14] |
| sediment | Baltic Sea, Isle of Rügen | Yes | 88.10 items/kg dry weight or 2862.56 items/m2 | Samples were covered with watch glasses between all processing steps. The humidity in the laboratory was increased. Laboratory coats made of cotton were worn. Blank tests were run. | [15] |
| water | South China Sea, Zhubi Reef | Yes | from 1400 to 8100 items/m3 | All tools used for sampling were washed with purified water before use. After sampling, the samples were sealed. Laboratory coats made of cotton were worn. Containers made of glass were used instead of plastic ones. Containers were rinsed three times with clean water and dried (120 °C, 4 h) before use. Blank controls were run. | [16] |
| water | Germany, Oldenburg–East Frisian water board | Yes | from 0 to 7 items/m3 | Filter units were rinsed with Milli-Q water prior to use. Laboratory coats made of cotton and clothes made of natural fibres were worn. Work surfaces were cleaned with 30% ethanol. All equipment was rinsed with Milli-Q water and ethanol before use, and then covered with aluminium foil. Samples were covered with aluminium foil. Blank samples were run. | [17] |
| water, sediment | Spain, Ebro Delta | Yes | 3.5 (±1.4) items/m3 (surface waters) 422 (±119) items/kg dry weight (sandy beaches) 2052 (±746) items/kg dry weight (estuarine benthic sediments) | Sample analysis was carried out in a laminar flow cabinet. Laboratory coats made of cotton were worn. Glass materials or stainless-steel materials were used when possible and all equipment was rinsed two times with Milli-Q water before use. Blanks were run. | [18] |
| water | Baltic Sea, Denmark, South Funen Archipelago | Yes | 0.07 (±0.02) items/m3 | Laboratory coats made of cotton were worn. Work surfaces were moistened prior to sample handling. The humidity in the laboratory was increased. Sample analysis was carried out in a fume hood. Samples were kept covered, e.g., with watch glasses. Procedural laboratory blanks were run. | [19] |
| sediment | United Kingdom, Birmingham, Edgbaston Pool | Yes | up to 25–30 items/100 g dry weight | Laboratory coats made of cotton were worn and clothes made of synthetic fibres were avoided. Samples were kept covered. All samples were processed by one person who used latex gloves. Whenever possible, nonplastic equipment was used. Plastic equipment was checked for its optical properties under the microscope. Procedural blanks were run. | [20] |
| water | China, Wuhan, Hanjiang River and Yangtze River | Yes | from 1660.0 (±639.1) to 8925 (±1591) items/m3 | Laboratory glassware was rinsed three times with distilled water before use and covered with tin foil after each step. Laboratory coats made of cotton and nitrile gloves were worn. Workplace for stereomicroscopic inspection was thoroughly cleaned prior to sample analysis. Field blank tests and method blank tests were run. | [21] |
| water, sediment, biota | China, Qinghai Lake | Yes | from 0.05 · 105 to 7.58 · 105 items/km2 (lake surface water) from 0.03 · 105 to 0.31 · 105 items/km2 (inflowing rivers) from 50 to 1292 items/m2 (lakeshore sediment) from 2 to 15 items/individual (fish samples) | Trawl was triple rinsed three before each sampling. Laboratory coats made of cotton, nitrile gloves, and shower caps were worn. All containers were covered with aluminium foil. Sample pretreatment was carried out in a fume hood. Sticky roller was used to clean the desktop, hands, and clothes. Blank controls were run. | [22] |
| water | China, urban estuaries | Yes | from 100.0 to 4100.0 items/m3 | All equipment was triple rinsed with filtered Milli-Q water and then covered with tin foil. Sample preparation was carried out in a clean laminar flow cabinet. Laboratory coats made of cotton and nitrile gloves were worn. Work surfaces in the laminar flow cabinet were cleaned with 70% alcohol. Laboratory operators cleaned their hands and forearms before analysis. The microscopic inspection stand was cleaned prior to sample analysis. Control samples were run. | [23] |
| biota | Red Sea, Saudi Arabian coast | Yes | 26 items in 178 examined individuals | Fish samples (the gastrointestinal tract of fish) were kept capped in Falcon tubes until analysis. Dissection tools were cleaned with 70% ethanol prior to use. Nitrile gloves, laboratory coats and clothing made of cotton were worn. Blank samples were run. | [24] |
| water | Atlantic Ocean, transect from the European Coast to the North Atlantic Subtropical Gyre | Yes | from 13 to 501 items/m3 | Sampling devices and filter meshes were cleaned with deionised and Milli-Q water prior to use. After sampling, samples were transferred to a Petri dish and sealed. Laboratory coats, head covers, and nitrile gloves were worn. Laboratory operators washed their hands and forearms before analysis. Laboratory work surfaces were cleaned before use. All instruments and vials were washed with Milli-Q water before use. Analysis devices were protected with aluminium foil when not in use. Control samples were run. | [25] |
| water | Jamaica, Kingston Harbour | Yes | from 0 to 5.73 items/m3 | Glass jars used to store the samples were cleaned with dilute nitric acid and rinsed with deionised water. Laboratory glassware and stainless steel tools were used during sample processing. Aluminium foil was used to cover samples. Laboratory coats and nitrile gloves were worn. The windows in the laboratory where the microscopic analysis was carried out were sealed and access to the laboratory was restricted. Procedural blanks were run. | [26] |
| air | Iran, Asaluyeh County | Yes | 900 items per 15 g of sample | All reagents and distilled water were filtered (through blue band filters) before use. Working surfaces were washed with ethanol. Laboratory glassware was cleaned with distilled water. Windows and doors were closed. Cotton laboratory coats, latex gloves, and face masks were worn. Samples and containers were covered with aluminium foil. Control samples were run. | [27] |
| water | Antarctica, Ross Sea | Yes | 0.17 (±0.34) items/m3 | Clothing made of cotton was worn. Latex gloves were worn when sorting and counting microplastics. Whenever possible, glassware was used instead of plastic. In cases where plastic equipment had to be used, it was washed with ethanol before use. Filters were stored in glass Petri dishes sealed with Parafilm. Blank samples were run. | [28] |
| water | Baltic Sea | No | from 0.07 to 2.6 items/L | All equipment, including filters, was rinsed with tap water prior to sampling. Each filter was sealed in a separate ziplock PE bag until analysis in the laboratory. Samples were examined under the microscope immediately after removal from the PE bags. Notes were made on the colour of the ship deck, colours and material of the crew clothing, etc., as possible sources of contamination. | [30] |
| water | Northeast Atlantic Ocean | Yes | 2.46 items/m3 | Collected samples were wrapped in aluminium foil. Laboratory coats, gloves and clothing made of cotton were worn. Laboratory glassware were cleaned with filtered water prior to use and covered after each step. Work surfaces were wiped with alcohol prior to sample analysis. All equipment were cleaned before use and examined under a microscope for airborne contamination. Control samples were run. | [31] |
| sediment | Italy, Po River | Yes | from 2.92 to 23.30 items/kg dry weight | PE bags in which the samples were stored for transport to the laboratory were checked for abrasion. Whenever possible, stainless steel and glass were used. Samples were covered with glass lids or aluminium foil. All reagents and water used for sample processing were filtered (over stainless steel mesh with pore size of 5 μm) before use. Cotton laboratory coats were worn during sample processing. | [32] |
| water, sediment | Portugal, Antuã River | Yes | from 58 to 193 items/m3 (water sample from March) from 71 to 1265 items/m3 (water sample from October) from 100 to 629 items/kg (sediment sample from March) from 18 to 514 items/kg (sediment sample from October) | Samples were covered and sealed with aluminium foil or Parafilm after each procedure. Equipment and work surfaces were cleaned before and during each step. Control samples were run. | [33] |
| water | Indonesia, Java, North Coast of Surabaya | Yes | from 0.38 to 0.61 items/L | Filtered samples were stored in a Petri dish closed with Parafilm sealing film. All instruments used for analysis were sterilised. Double-distilled deionised water was used in the laboratory procedures, e.g., to rinse laboratory equipment. Procedural blanks were run. | [34] |
| water | Pacific Ocean, Snake and Lower Columbia Rivers | Yes | from 0 to 5.405 items/L (grab samples) from 0 to 0.014 items/L (net samples) | Exposure time of the samples to air was limited. Samples were kept covered with jar lids, aluminium foil or glass eyewashes. Laboratory glassware and equipment were cleaned with Decon 90, triple rinsed with tap water, and then once rinsed with filtered water. Clothing made of cotton and white laboratory coats were worn. Samples were filtered in an air cabinet. After filtration, filters were kept in Petri dishes until visual identification. Control samples were run. | [35] |
| water | Atlantic Ocean, transect from the Bay of Biscay to Cape Town | Yes | 1.15 items/m3 | Laboratory coats, gloves and clothing made of cotton were worn during sample handling. Stainless steel sieve was covered with a wooden cover. All containers were covered and cleaned with distilled water prior to use. Method blanks and controls were run. | [36] |
| water | Turkey, Mersin Bay | No | 539,189 items/km2 (before the flood) 7,699,716 items/km2 (after the flood) | Laboratory equipment was rinsed with deionised water before and after each use. Procedures were carried out as quickly as possible. All used containers were kept closed. Sample analysis was carried out in a fume hood. Microscopic analysis of the samples was performed using a microscope in a plastic cover. | [38] |
| water | Italy, Tuscan coast | Yes | 0.26 items/m3 | All materials used for sampling were cleaned before use. Glassware was used during laboratory procedures. Sample analysis was carried out in a clean air flow cabinet. Blank controls were run. | [39] |
| water, biota | Baltic Sea | Yes | 0.21 (±0.15) items/m3 | All equipment was rinsed with acetone prior to use. Direct contact with filters and samples was limited. The use of plastic bottles was avoided. Sample processing, apart from microscopic observations, was carried out in a fume hood. Controls and blank samples were run. | [40] |
| water, sediment | China, Pearl River | Yes | 0.57 ± 0.71 items/L (river water) 685 ± 342 items/kg dry weight (river bed sediment) 258 ± 133 items/kg dry weight (estuarine sediment) | Buckets and nets used for sampling were wrapped in aluminium foil and kept covered in stainless steel barrels. Laboratory coats and gloves were worn. Laboratory glassware was cleaned with distilled water and covered with aluminium foil prior to use. Sample pretreatment were carried out in a fume hood. Visual identification was performed on an ultraclean laboratory bench. All reagents and solutions were filtered (through 0.7 mm glass microfibre filters) before use. Procedural and laboratory blanks were run. | [41] |
| biota | Mediterranean Sea, Northern Sicilian coasts | Yes | 2.7 items/specimens | Sample handling was performed in a closed room, access to which was strictly limited. Workspaces and equipment were cleaned prior to microplastic extraction. Samples were exposed to air for the shortest possible time. During microscopic analysis, microfibres were placed on corning slides and covered with a coverslip. Control blanks were run. | [43] |
| water, sediment | France, Brittany, Bay of Brest | Yes | 0.24 (±0.35) items/m3 (surface water) 0.97 (±2.08) items/kg dry weight (sediment) | Glass materials were used instead of plastic. All equipment was rinsed twice with distilled water, once with 70% ethanol, and then covered. Laboratory coats made of cotton were worn all the time. Work surfaces were wiped with 70% ethanol. Field and laboratory procedural blanks were run. | [44] |
| water | Germany, Berlin, urban watercourse | Yes | from 0.01 items/L to 95.8 items/L | All reagents were filtered (through 0.45 mm cellulose acetate filters) before use. Work surfaces were rinsed several times with pure water and 30% ethanol. Nonsynthetic clothing was worn. Blind controls were run. | [45] |
| air | Germany, Hamburg | Yes | 275 items/m2/day | Samples were covered and kept under fume hoods. Laboratory glassware was rinsed with acetone prior to use. The humidity in the laboratory was increased. An air filter was used. Procedural and laboratory blanks were run. | [46] |
| water, sediment | Bohai Sea | Yes | from 0.4 to 5.2 items/L | All tools and containers were cleaned with Milli-Q water prior to use. Devices used for sampling and analysis were covered with aluminium foil. Sample analysis (separation and identification) was conducted in a laboratory adapted to the analysis of microplastics. Nontextile robes, gloves, and head caps were worn. Procedural blanks were run. | [47] |
| water | United States, Western Lake Superior | Yes | from 0 to 110,000 items/km2 | Collection vessel of the Manta net was rinsed three times with Milli-Q water before use. Clothes made of cotton or wool were worn. Control samples were run. | [48] |
| water | Changjiang Estuary and East China Sea | Yes | 157.2 (±75.8) items/m3 (Changjiang Estuary) 112.8 (±51.1) items/m3 (East China Sea) | In the field, all containers were rinsed with filtered in situ seawater prior to use. HDPE tanks and steel sieves were rinsed with Milli-Q water before use and covered with aluminium foil. All reagents were filtered (through 0.45 mm glass filters) before use. Laboratory glassware was rinsed with Milli-Q water and heated (450 °C, 8 h) before use. Clean glassware was covered with combusted aluminium foil. Steel tweezers were rinsed with Milli-Q water and sterilised before use. Sample processing was carried out in a clean laminar flow cabinet. Laboratory coats made of cotton and nitrile gloves were worn. Procedural blanks were run. | [49] |
| water | UWA, New York City, Hudson River | Yes | 0.985 items/L | All equipment was rinsed three times and covered before use and between sample processing. The sampler collector rinsed their hands and forearms three times and had bare wrists, i.e., without any accessories such as watches or bracelets. Air and water blanks were run. | [50] |
| water | Japan, rivers | Yes | 1.6 items/m3 | Prior to use, sampling net was rinsed with river water collected and filtered in situ. Equipment made of plastic was avoided whenever possible. Laboratory robes made of cotton were worn. Blanks were run. | [53] |
| water | Western Mediterranean Sea | No | 0.10 (±0.09) items/m2 | Manta trawl used for sampling was deployed 2 m from the ship’s hull to avoid potential ship-based contamination. All materials used for sampling (plastic and nonplastic) were checked and rinsed with filtered seawater prior to use. Control samples were not run, but plastic fibres were excluded from further analysis to prevent potential bias in results caused by airborne contamination. | [56] |
References
- Crawford, C.B.; Quinn, B. 5-Microplastics, standardisation and spatial distribution. In Microplastic Pollutants, 1st ed.; Crawford, C.B., Quinn, B., Eds.; Elsevier: Amsterdam, Netherlands, 2017; pp. 101–130. ISBN 9780128104699. [Google Scholar]
- Boucher, J.; Friot, D. Primary Microplastics in the Oceans: A Global Evaluation of Sources; IUCN: Gland, Switzerland, 2017; p. 43. ISBN 978-2-8317-1827-9. [Google Scholar]
- De Falco, F.; Gullo, M.P.; Gentile, G.; Di Pace, E.; Cocca, M.; Gelabert, L.; Brouta-Agnésa, M.; Rovira, A.; Escudero, R.; Villalba, R.; et al. Evaluation of microplastic release caused by textile washing processes of synthetic fabrics. Environ. Pollut. 2018, 236, 916–925. [Google Scholar] [CrossRef] [PubMed]
- Sommer, F.; Dietze, V.; Baum, A.; Sauer, J.; Gilge, S.; Maschowski, C.; Gieré, R. Tire Abrasion as a Major Source of Microplastics in the Environment. Aerosol Air Qual. Res. 2018, 18, 2014–2028. [Google Scholar] [CrossRef]
- SAPEA. Science Advice for Policy by European Academies. In A Scientific Perspective on Microplastics in Nature and Society; SAPEA: Berlin, Germany, 2019; ISBN 978-3-9820301-0-4. [Google Scholar]
- Lambert, S.; Wagner, M. Microplastics Are Contaminants of Emerging Concern in Freshwater Environments: An Overview. In Freshwater Microplastics; Wagner, M., Lambert, S., Eds.; Springer: Cham, Switzerland, 2018; pp. 1–23. ISBN 978-3-319-61615-5. [Google Scholar]
- Gago, J.; Filgueiras, A.; Pedrotti, M.L.; Caetano, M.; Frias, J. Standardised Protocol for Monitoring Microplastics in Seawater; JPI-Oceans: Brussels, Belgium, 2018. [Google Scholar] [CrossRef]
- Wesch, C.; Bredimus, K.; Paulus, M.; Klein, R. Towards the suitable monitoring of ingestion of microplastics by marine biota: A review. Environ. Pollut. 2016, 218, 1200–1208. [Google Scholar] [CrossRef]
- Hermsen, E.; Mintenig, S.M.; Besseling, E.; Koelmans, A.A. Quality Criteria for the Analysis of Microplastic in Biota Samples: A Critical Review. Environ. Sci. Technol. 2018, 52, 10230–10240. [Google Scholar] [CrossRef]
- Dris, R.; Gasperi, J.; Mirande, C.; Mandin, C.; Guerrouache, M.; Langlois, V.; Tassin, B. A first overview of textile fibers, including microplastics, in indoor and outdoor environments. Environ. Pollut. 2017, 221, 453–458. [Google Scholar] [CrossRef] [PubMed] [Green Version]
- Hidalgo-Ruz, V.; Gutow, L.; Thompson, R.C.; Thiel, M. Microplastics in the Marine Environment: A Review of the Methods Used for Identification and Quantification. Environ. Sci. Technol. 2012, 46, 3060–3075. [Google Scholar] [CrossRef]
- Mu, J.; Zhang, S.; Qu, L.; Jin, F.; Fang, C.; Ma, X.; Zhang, W.; Wang, J. Microplastics abundance and characteristics in surface waters from the Northwest Pacific, the Bering Sea, and the Chukchi Sea. Mar. Pollut. Bull. 2019, 143, 58–65. [Google Scholar] [CrossRef]
- Courtene-Jones, W.; Quinn, B.; Gary, S.F.; Mogg, A.O.M.; Narayanaswamy, B.E. Microplastic pollution identified in deep-sea water and ingested by benthic invertebrates in the Rockall Trough, North Atlantic Ocean. Environ. Pollut. 2017, 231, 271–280. [Google Scholar] [CrossRef] [Green Version]
- Covernton, G.A.; Pearce, C.M.; Gurney-Smith, H.J.; Chastain, S.G.; Ross, P.S.; Dower, J.F.; Dudas, S.E. Size and shape matter: A preliminary analysis of microplastic sampling technique in seawater studies with implications for ecological risk assessment. Sci. Total Environ. 2019, 667, 124–132. [Google Scholar] [CrossRef]
- Hengstmann, E.; Tamminga, M.; vom Bruch, C.; Fischer, E.K. Microplastic in beach sediments of the Isle of Rügen (Baltic Sea)—Implementing a novel glass elutriation column. Mar. Pollut. Bull. 2018, 126, 263–274. [Google Scholar] [CrossRef]
- Huang, Y.; Yan, M.; Xu, K.; Nie, H.; Gong, H.; Wang, J. Distribution characteristics of microplastics in Zhubi Reef from South China Sea. Environ. Pollut. 2019, 255. [Google Scholar] [CrossRef]
- Mintenig, S.M.; Löder, M.G.J.; Primpke, S.; Gerdts, G. Low numbers of microplastics detected in drinking water from ground water sources. Sci. Total Environ. 2019, 648, 631–635. [Google Scholar] [CrossRef]
- Simon-Sánchez, L.; Grelaud, M.; Garcia-Orellana, J.; Ziveri, P. River Deltas as hotspots of microplastic accumulation: The case study of the Ebro River (NW Mediterranean). Sci. Total Environ. 2019, 687, 1186–1196. [Google Scholar] [CrossRef] [PubMed]
- Tamminga, M.; Hengstmann, E.; Fischer, E.K. Microplastic analysis in the South Funen Archipelago, Baltic Sea, implementing manta trawling and bulk sampling. Mar. Pollut. Bull. 2018, 128, 601–608. [Google Scholar] [CrossRef]
- Vaughan, R.; Turner, S.D.; Rose, N.L. Microplastics in the sediments of a UK urban lake. Environ. Pollut. 2017, 229, 10–18. [Google Scholar] [CrossRef]
- Wang, W.; Ndungu, A.W.; Li, Z.; Wang, J. Microplastics pollution in inland freshwaters of China: A case study in urban surface waters of Wuhan, China. Sci. Total Environ. 2017, 575, 1369–1374. [Google Scholar] [CrossRef]
- Xiong, X.; Zhang, K.; Chen, X.; Shi, H.; Luo, Z.; Wu, C. Sources and distribution of microplastics in China’s largest inland lake—Qinghai Lake. Environ. Pollut. 2018, 235, 899–906. [Google Scholar] [CrossRef] [PubMed]
- Zhao, S.; Zhu, L.; Li, D. Microplastic in three urban estuaries, China. Environ. Pollut. 2015, 206, 597–604. [Google Scholar] [CrossRef] [PubMed]
- Baalkhuyur, F.M.; Bin Dohaish, E.-J.A.; Elhalwagy, M.E.A.; Alikunhi, N.M.; AlSuwailem, A.M.; Røstad, A.; Coker, D.J.; Berumen, M.L.; Duarte, C.M. Microplastic in the gastrointestinal tract of fishes along the Saudi Arabian Red Sea coast. Mar. Pollut. Bull. 2018, 131, 407–415. [Google Scholar] [CrossRef] [PubMed]
- Enders, K.; Lenz, R.; Stedmon, C.A.; Nielsen, T.G. Abundance, size and polymer composition of marine microplastics ≥10μm in the Atlantic Ocean and their modelled vertical distribution. Mar. Pollut. Bull. 2015, 100, 70–81. [Google Scholar] [CrossRef]
- Rose, D.; Webber, M. Characterization of microplastics in the surface waters of Kingston Harbour. Sci. Total Environ. 2019, 664, 753–760. [Google Scholar] [CrossRef]
- Abbasi, S.; Keshavarzi, B.; Moore, F.; Turner, A.; Kelly, F.J.; Dominguez, A.O.; Jaafarzadeh, N. Distribution and potential health impacts of microplastics and microrubbers in air and street dusts from Asaluyeh County, Iran. Environ. Pollut. 2019, 244, 153–164. [Google Scholar] [CrossRef] [Green Version]
- Cincinelli, A.; Scopetani, C.; Chelazzi, D.; Lombardini, E.; Martellini, T.; Katsoyiannis, A.; Fossi, M.C.; Corsolini, S. Microplastic in the surface waters of the Ross Sea (Antarctica): Occurrence, distribution and characterization by FTIR. Chemosphere 2017, 175, 391–400. [Google Scholar] [CrossRef] [PubMed]
- Frias, J.; Pagter, E.; Nash, R.; O’Connor, I.; Carretero, O.; Filgueiras, A.; Viñas, L.; Gago, J.; Antunes, J.; Bessa, F.; et al. Standardised Protocol for Monitoring Microplastics in Sediments; JPI-Oceans: Brussels, Belgium, 2018. [Google Scholar] [CrossRef]
- Bagaev, A.; Mizyuk, A.; Khatmullina, L.; Isachenko, I.; Chubarenko, I. Anthropogenic fibres in the Baltic Sea water column: Field data, laboratory and numerical testing of their motion. Sci. Total Environ. 2017, 599–600, 560–571. [Google Scholar] [CrossRef] [PubMed]
- Lusher, A.L.; Burke, A.; O’Connor, I.; Officer, R. Microplastic pollution in the Northeast Atlantic Ocean: Validated and opportunistic sampling. Mar. Pollut. Bull. 2014, 88, 325–333. [Google Scholar] [CrossRef] [PubMed]
- Piehl, S.; Mitterwallner, V.; Atwood, E.C.; Bochow, M.; Laforsch, C. Abundance and distribution of large microplastics (1–5 mm) within beach sediments at the Po River Delta, northeast Italy. Mar. Pollut. Bull. 2019, 149. [Google Scholar] [CrossRef]
- Rodrigues, M.O.; Abrantes, N.; Gonçalves, F.J.M.; Nogueira, H.; Marques, J.C.; Gonçalves, A.M.M. Spatial and temporal distribution of microplastics in water and sediments of a freshwater system (Antuã River, Portugal). Sci. Total Environ. 2018, 633, 1549–1559. [Google Scholar] [CrossRef] [PubMed]
- Cordova, M.R.; Purwiyanto, A.I.S.; Suteja, Y. Abundance and characteristics of microplastics in the northern coastal waters of Surabaya, Indonesia. Mar. Pollut. Bull. 2019, 142, 183–188. [Google Scholar] [CrossRef] [PubMed]
- Kapp, K.J.; Yeatman, E. Microplastic hotspots in the Snake and Lower Columbia rivers: A journey from the Greater Yellowstone Ecosystem to the Pacific Ocean. Environ. Pollut. 2018, 241, 1082–1090. [Google Scholar] [CrossRef]
- Kanhai, L.D.K.; Officer, R.; Lyashevska, O.; Thompson, R.C.; O’Connor, I. Microplastic abundance, distribution and composition along a latitudinal gradient in the Atlantic Ocean. Mar. Pollut. Bull. 2017, 115, 307–314. [Google Scholar] [CrossRef]
- Torre, M.; Digka, N.; Anastasopoulou, A.; Tsangaris, V.; Mytilineou, C. Anthropogenic microfibres pollution in marine biota. A new and simple methodology to minimize airborne contamination. Mar. Pollut. Bull. 2016, 113, 55–61. [Google Scholar] [CrossRef] [PubMed]
- Gündoğdu, S.; Çevik, C.; Ayat, B.; Aydoğan, B.; Karaca, S. How microplastics quantities increase with flood events? An example from Mersin Bay NE Levantine coast of Turkey. Environ. Pollut. 2018, 239, 342–350. [Google Scholar] [CrossRef]
- Baini, M.; Fossi, M.C.; Galli, M.; Caliani, I.; Campani, T.; Finoia, M.G.; Panti, C. Abundance and characterization of microplastics in the coastal waters of Tuscany (Italy): The application of the MSFD monitoring protocol in the Mediterranean Sea. Mar. Pollut. Bull. 2018, 133, 543–552. [Google Scholar] [CrossRef]
- Beer, S.; Garm, A.; Huwer, B.; Dierking, J.; Nielsen, T.G. No increase in marine microplastic concentration over the last three decades—A case study from the Baltic Sea. Sci. Total Environ. 2018, 621, 1272–1279. [Google Scholar] [CrossRef] [PubMed]
- Fan, Y.; Zheng, K.; Zhu, Z.; Chen, G.; Peng, X. Distribution, sedimentary record, and persistence of microplastics in the Pearl River catchment, China. Environ. Pollut. 2019, 251, 862–870. [Google Scholar] [CrossRef]
- Wesch, C.; Elert, A.M.; Wörner, M.; Braun, U.; Klein, R.; Paulus, M. Assuring quality in microplastic monitoring: About the value of clean-air devices as essentials for verified data. Sci. Rep. 2017, 7. [Google Scholar] [CrossRef]
- Savoca, S.; Capillo, G.; Mancuso, M.; Faggio, C.; Panarello, G.; Crupi, R.; Bonsignore, M.; D’Urso, L.; Compagnini, G.; Neri, F.; et al. Detection of artificial cellulose microfibers in Boops boops from the northern coasts of Sicily (Central Mediterranean). Sci. Total Environ. 2019, 691, 455–465. [Google Scholar] [CrossRef]
- Frère, L.; Paul-Pont, I.; Rinnert, E.; Petton, S.; Jaffré, J.; Bihannic, I.; Soudant, P.; Lambert, C.; Huvet, A. Influence of environmental and anthropogenic factors on the composition, concentration and spatial distribution of microplastics: A case study of the Bay of Brest (Brittany, France). Environ. Pollut. 2017, 225, 211–222. [Google Scholar] [CrossRef] [Green Version]
- Schmidt, L.K.; Bochow, M.; Imhof, H.K.; Oswald, S.E. Multi-temporal surveys for microplastic particles enabled by a novel and fast application of SWIR imaging spectroscopy—Study of an urban watercourse traversing the city of Berlin, Germany. Environ. Pollut. 2018, 239, 579–589. [Google Scholar] [CrossRef] [Green Version]
- Klein, M.; Fischer, E.K. Microplastic abundance in atmospheric deposition within the Metropolitan area of Hamburg, Germany. Sci. Total Environ. 2019, 685, 96–103. [Google Scholar] [CrossRef] [PubMed]
- Dai, Z.; Zhang, H.; Zhou, Q.; Tian, Y.; Chen, T.; Tu, C.; Fu, C.; Luo, Y. Occurrence of microplastics in the water column and sediment in an inland sea affected by intensive anthropogenic activities. Environ. Pollut. 2018, 242, 1557–1565. [Google Scholar] [CrossRef]
- Hendrickson, E.; Minor, E.C.; Schreiner, K. Microplastic Abundance and Composition in Western Lake Superior As Determined via Microscopy, Pyr-GC/MS, and FTIR. Environ. Sci. Technol. 2018, 52, 1787–1796. [Google Scholar] [CrossRef] [PubMed]
- Zhao, S.; Wang, T.; Zhu, L.; Xu, P.; Wang, X.; Gao, L.; Li, D. Analysis of suspended microplastics in the Changjiang Estuary: Implications for riverine plastic load to the ocean. Water Res. 2019, 161, 560–569. [Google Scholar] [CrossRef] [PubMed]
- Miller, R.Z.; Watts, A.J.R.; Winslow, B.O.; Galloway, T.S.; Barrows, A.P.W. Mountains to the sea: River study of plastic and non-plastic microfiber pollution in the northeast USA. Mar. Pollut. Bull. 2017, 124, 245–251. [Google Scholar] [CrossRef] [PubMed]
- Wang, W.; Wang, J. Investigation of microplastics in aquatic environments: An overview of the methods used, from field sampling to laboratory analysis. Trends Anal. Chem 2018, 108, 195–202. [Google Scholar] [CrossRef]
- Cantwell, H. (Ed.) Blanks in Method Validation—Supplement to Eurachem Guide the Fitness for Purpose of Analytical Methods, 1st ed.; Eurachem, 2019; Available online: https://www.eurachem.org/index.php/publications/guides/blanks-in-method-validation (accessed on 10 May 2010).
- Kataoka, T.; Nihei, Y.; Kudou, K.; Hinata, H. Assessment of the sources and inflow processes of microplastics in the river environments of Japan. Environ. Pollut. 2019, 244, 958–965. [Google Scholar] [CrossRef] [PubMed]
- Lefebvre, C.; Saraux, C.; Heitz, O.; Nowaczyk, A.; Bonnet, D. Microplastics FTIR characterisation and distribution in the water column and digestive tracts of small pelagic fish in the Gulf of Lions. Mar. Pollut. Bull. 2019, 142, 510–519. [Google Scholar] [CrossRef] [PubMed]
- Koelmans, A.A.; Mohamed Nor, N.H.; Hermsen, E.; Kooi, M.; Mintenig, S.M.; De France, J. Microplastics in freshwaters and drinking water: Critical review and assessment of data quality. Water Res. 2019, 155, 410–422. [Google Scholar] [CrossRef]
- De Haan, W.P.; Sanchez-Vidal, A.; Canals, M. Floating microplastics and aggregate formation in the Western Mediterranean Sea. Mar. Pollut. Bull. 2019, 140, 523–535. [Google Scholar] [CrossRef] [PubMed]

Publisher’s Note: MDPI stays neutral with regard to jurisdictional claims in published maps and institutional affiliations. |
© 2021 by the authors. Licensee MDPI, Basel, Switzerland. This article is an open access article distributed under the terms and conditions of the Creative Commons Attribution (CC BY) license (https://creativecommons.org/licenses/by/4.0/).
Share and Cite
Bogdanowicz, A.; Zubrowska-Sudol, M.; Krasinski, A.; Sudol, M. Cross-Contamination as a Problem in Collection and Analysis of Environmental Samples Containing Microplastics—A Review. Sustainability 2021, 13, 12123. https://doi.org/10.3390/su132112123
Bogdanowicz A, Zubrowska-Sudol M, Krasinski A, Sudol M. Cross-Contamination as a Problem in Collection and Analysis of Environmental Samples Containing Microplastics—A Review. Sustainability. 2021; 13(21):12123. https://doi.org/10.3390/su132112123
Chicago/Turabian StyleBogdanowicz, Aleksandra, Monika Zubrowska-Sudol, Andrzej Krasinski, and Miroslaw Sudol. 2021. "Cross-Contamination as a Problem in Collection and Analysis of Environmental Samples Containing Microplastics—A Review" Sustainability 13, no. 21: 12123. https://doi.org/10.3390/su132112123
APA StyleBogdanowicz, A., Zubrowska-Sudol, M., Krasinski, A., & Sudol, M. (2021). Cross-Contamination as a Problem in Collection and Analysis of Environmental Samples Containing Microplastics—A Review. Sustainability, 13(21), 12123. https://doi.org/10.3390/su132112123