Article

Contributions of Seasonal Rainfall to Recent Trends in Cameroon’s Cotton Yields

by
Ibrahim Njouenwet
1,2,*,
Derbetini Appolinaire Vondou
1,2,
Stephanie Vanessa Ngono Ashu
1 and
Robert Nouayou
3
1
Laboratory of Environmental Modeling and Atmospheric Physics, Department of Physics, University of Yaounde 1, P.O. Box 812, Yaoundé, Cameroon
2
Laboratoire Mixte International “Dynamique des Écosystèmes Continentaux d’Afrique Centrale en Contexte de Changements Globaux” (LMI DYCOFAC), “Institut de Recherche pour le Développement” (IRD, University of Yaoundé 1, IRGM), P.O. Box 1857, Yaoundé, Cameroon
3
Laboratory of Geophysics and Geoexploration, Department of Physics, University of Yaoundé 1, P.O. Box 812, Yaoundé, Cameroon
*
Author to whom correspondence should be addressed.
Sustainability 2021, 13(21), 12086; https://doi.org/10.3390/su132112086
Submission received: 26 September 2021 / Revised: 26 October 2021 / Accepted: 27 October 2021 / Published: 2 November 2021
(This article belongs to the Special Issue Effects of Climate Change on Soil Properties)

Abstract

:
Cotton yields in the Sudano-Sahelian region contribute to food security through their role in agricultural productivity. Daily precipitation data and cotton yield data were synthesized from nine agricultural regions obtained from the “Société de Développement du Coton (SODECOTON)”. The following seasonal rainfall indices—from Cameroon’s cotton zone—were mapped with geographic information systems for spatial analysis: wet season onset and retreat date, rainfall amount, number of rainy days, rainfall intensity (SDII), heavy-rainfall events (R95p), consecutive dry days (CDD), annual highest daily precipitation (Rx1day) and number of very heavy precipitation days (R20mm). Linear regressions were used as statistical tools for analysis. The strongest relationships were observed between cotton yields and the heavy-rainfall events, closely followed by seasonal rainfall amount. An increase in consecutive dry days (CDD) and heavy events, and a decreased seasonal rainfall amount, have a negative impact on cotton yield trends. Overall, the critical breakpoint analysis between cotton yields and all rainfall indices showed that the cotton yield was particularly negatively impacted before a 251 retreat date, 591 mm seasonal rainfall amount and 33 rainy days. By contrast, an onset date, rainfall intensity, heavy rainfall, CDD, Rx1day and R20mm of 127, 12.5 mm·day−1, 405 mm, 27 days, 67 mm and 22 days, respectively, were identified for an optimum cotton yield. These results can be used as information for agricultural activity and management, civil planning of economic activities and can also contribute to furthering our understanding of the management impacts on future food security.

1. Introduction

Cotton production is a vital source of food and income for millions of people in developing countries, including West Africa. It is also commonly presented as a positive economic indicator in West Africa [1]. Globally, cotton yields have been increasing continually since the 1960s, while in West Africa, they stagnated since the 1980s, with a decline in some countries such as Cameroon (Statistics of the Food and Agriculture Organization of the United Nations (FAO): http://faostat.fao.org, accessed on 20 October 2021). Thus, the aim of this study is to contribute to furthering our understanding of this decline by examining the effects of climate, focusing mainly on how the seasonal distribution of rainfall on cotton productivity could increase farmers’ yields.
Cameroon is the fifth largest cotton producer in sub-Saharan Africa with 10–11% of production [2]. Cotton is the major cash crop of Cameroon and represents the major source of income, especially monetary income, for farmers in particular [3]. One of the repercussions is that farmers have abandoned cotton production after a dramatic reduction in their margins due mainly to high fertilizer prices. In this country, cotton production is supervised by the “Société de Développement du Coton (SODECOTON)”, whose activities ranges from technical support to farmers (supply of seeds and fertilizers and guidance on cropping calendars) through to the international cotton trade. Note that the cotton zone of Cameroon is organized into nine cotton regions defined by SODECOTON. In the following, average national yields from 2000 to 2015 show a trend of the highest yields increasing in cotton regions (Maroua sud, Maroua nord, Kaélé, Tchatibali, Guider and Garoua) (Figure 1). Of interest here are the reasons behind the yields’ increase in all regions. Potential contributing factors include climate change, plant cultivar improvement, crop management practices and various major policy reforms.
Since the 1950s, North Cameroon, with its Sudano-Sahelian climate, has been explicitly chosen to create an optimal representation of cotton cultivation after many experiments. [4] have shown that the 1980s and the early 2010s were characterized by severe drought. During the same years, a serious threat to food security was reported in more than half of the administrative units, with more than 14,000 hectares of crops destroyed, including 12,000 hectares of cotton (6% of cotton crop cultivated) and 12,375 fruit plants destroyed due to heavy rainfall [5]. Improved knowledge on how cotton responds to the seasonal variability of rainfall is thus crucial to better interpret the consequences of climate change.
Several studies have demonstrated the influence of rainfall seasonal parameters, such as the rainy season length, the number of dry spells, the flooding periods, temperature and solar radiation. These studies are based on observed data analyses and models’ estimates in experimental stations and on-farm situations about cotton productivity [6,7,8,9,10] and the vegetative yield in the Sahel [11] and North Cameroon [12] at regional and local scales, respectively. However, the impact of seasonal rainfall trend parameters on Sudano-Sahelian cotton productivity in the farmers’ yields in cotton zones has rarely been studied.
Numerous studies conducted in several regions to assess the effects of climate trends have shown that trend analysis of yields can be confusing, because climate change is often mistaken for the effects of changes in management, technology and policy [13,14]. However, there are various approaches to addressing climate change, including time series analysis [13,15] and spatial analysis of yield trends [16]. Therefore, evaluating climate contributions to productivity trends remains an interesting topic. The goals of this study are to assess the impact of recent rainfall variability in Cameroonian cotton yield trends and to develop spatial distribution maps using the GIS geostatistical analysis tool in R analysis software in order to understand the effects of the seasonal distribution of rainfall on cotton yields in Cameroon. Statistical approaches have been used to assess the impacts of seasonal rainfall independently of the effects of changes in management, technology and policy. The next section describes the study area, data and method to study the cotton sector in Cameroon, while the third is dedicated to results and discussions. In the fourth section, we present the conclusion.

2. Study Area, Data and Method

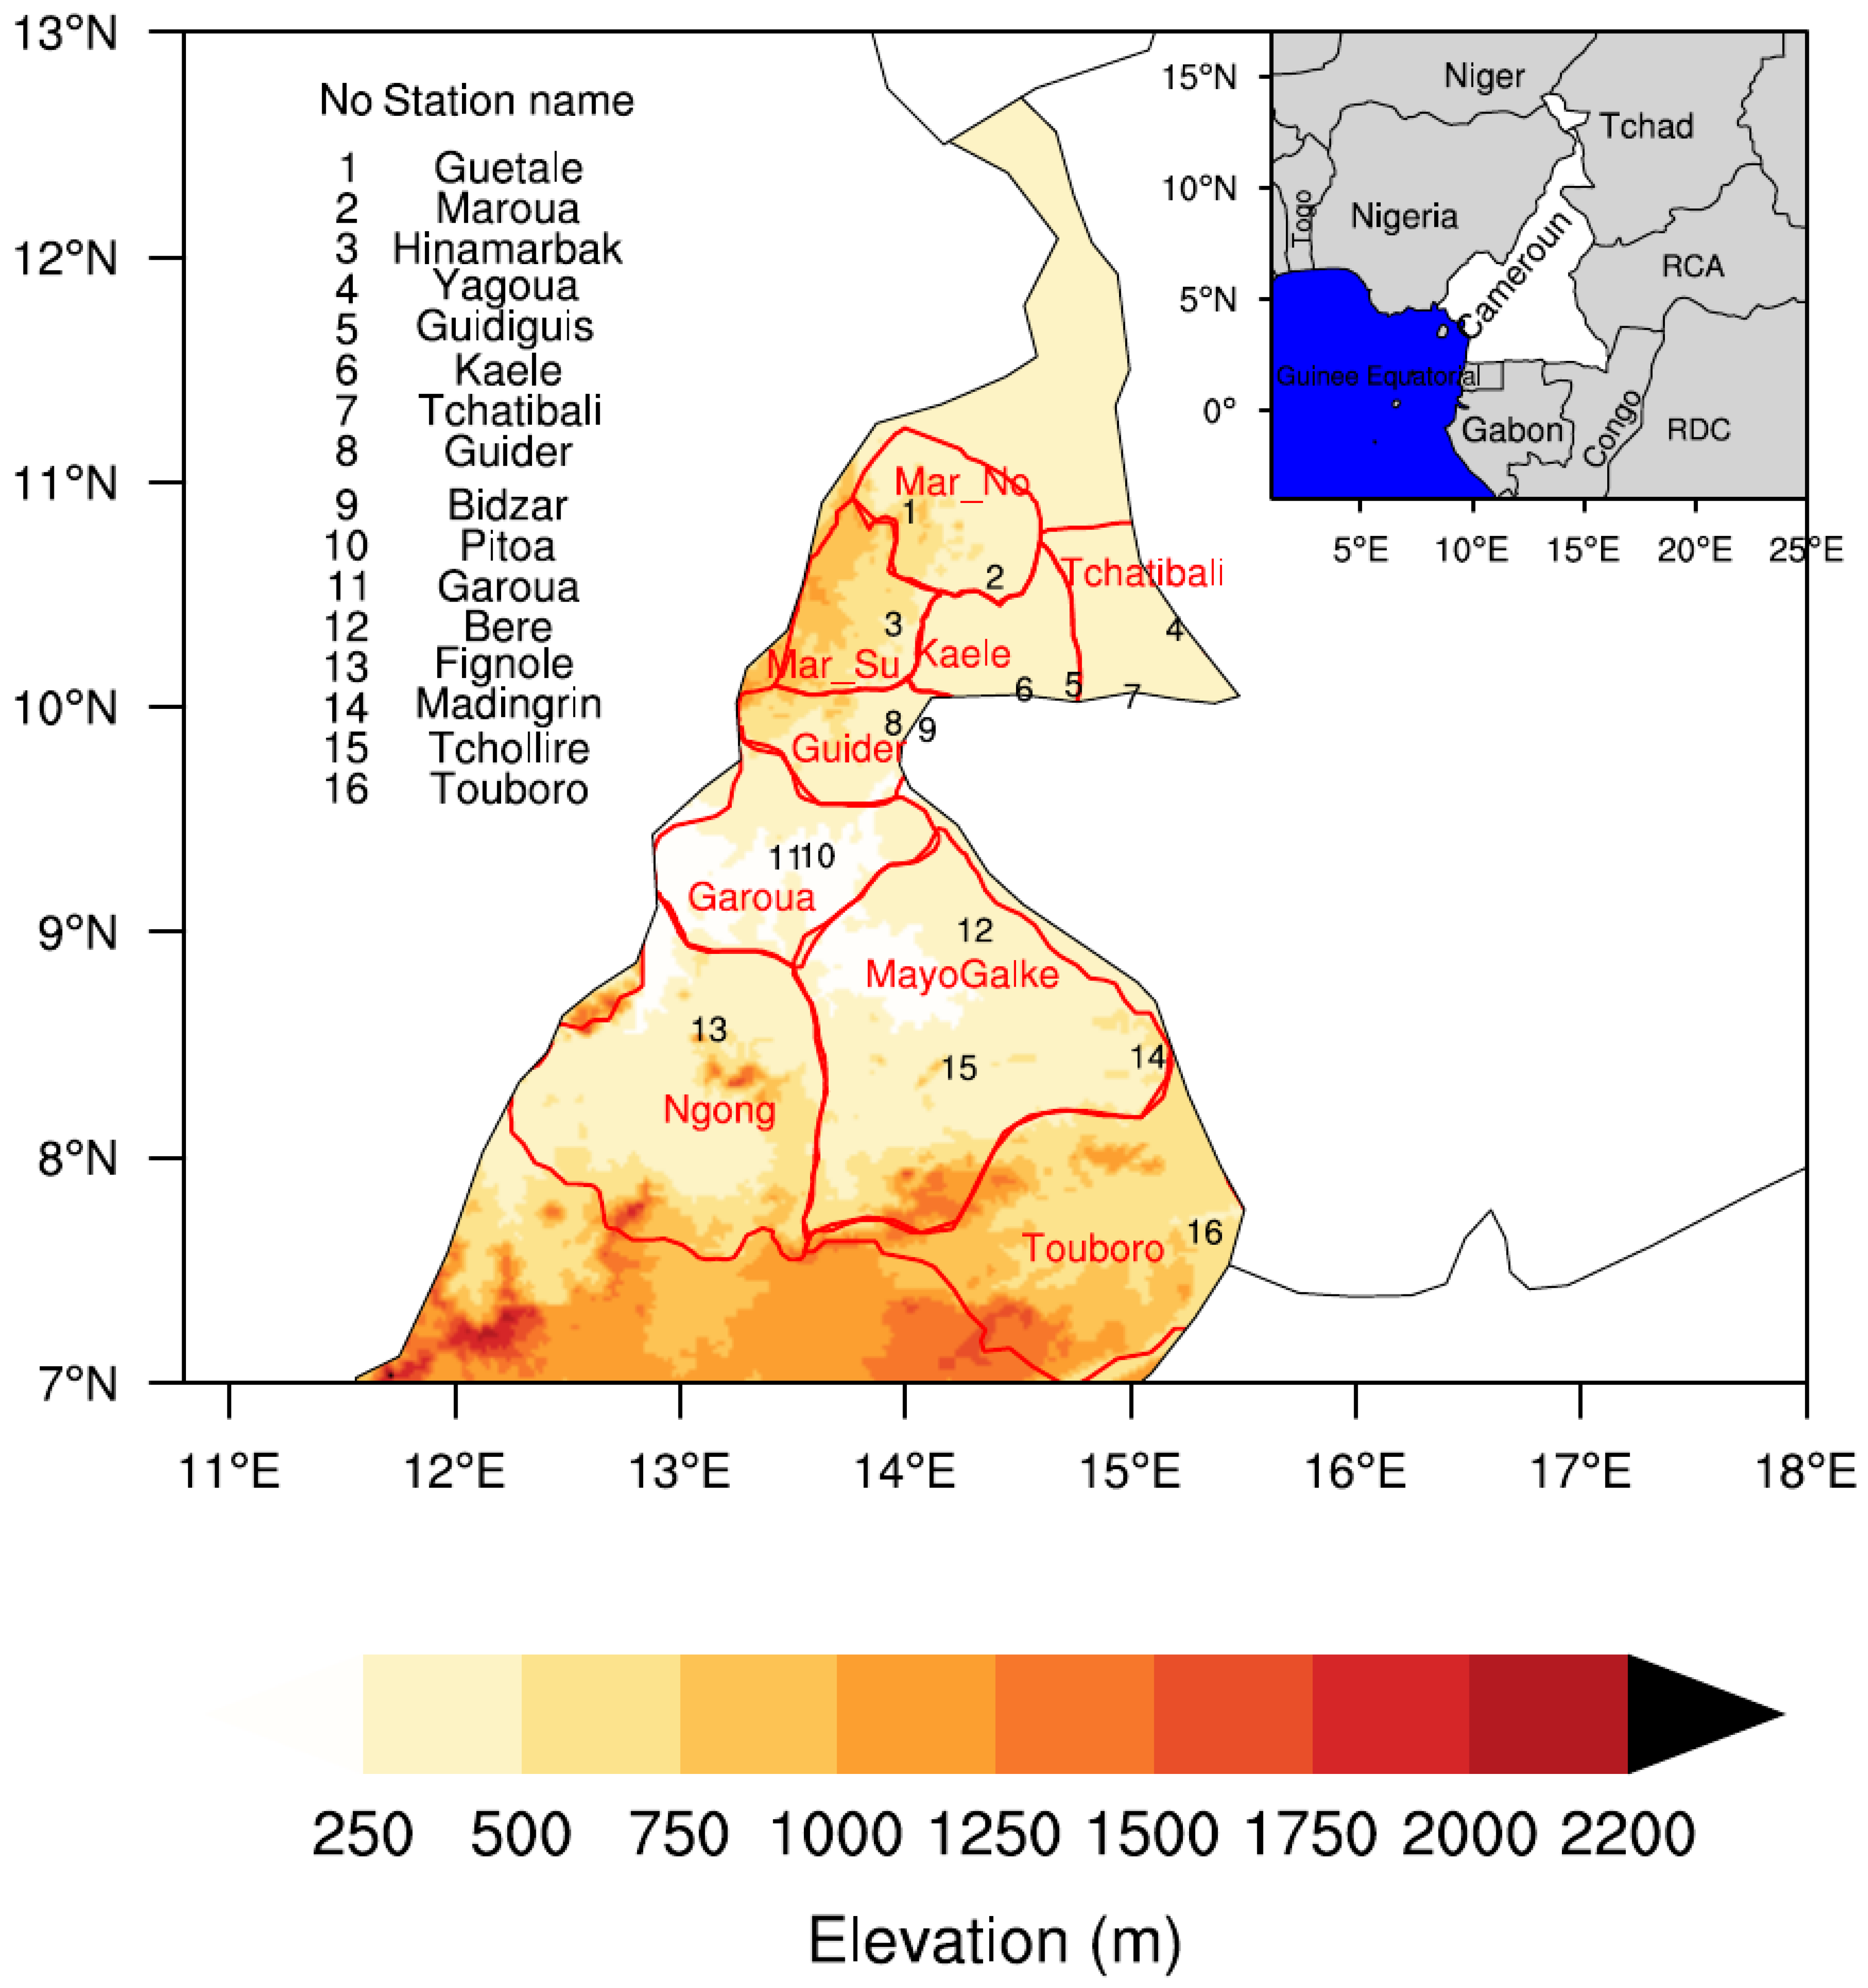
2.1. Study Area and Data

This study was conducted over 16 years (2000–2015) in the North and Far North regions in an area located from 7° N to 13° N of latitudes and 11.5° E and 16° E of longitudes, which are the administrative regions of Cameroon (Figure 2). Cameroon’s cotton zone covers an area of about 100,000 km2 with a population of about 5,530,643 inhabitants. It is characterized by a Sahelo-Sudanian climate with a single rainy season from mid-May to mid-October. The annual average rainfall in the country varies from >1200 mm in the south to <500 mm in the north. The averaged minimum and maximum temperatures during the growing season were 21.8 °C and 34.8 °C, respectively. The topography of the regions is generally flat, and they are mainly used for grazing and cultivating crops such as millet, sorghum, groundnut, rice, maize, cowpea and cotton, which are the main cash crops. However, these crops are rain fed and are greatly affected by extreme events.
Both cotton yields and rainfall data are available for the nine cotton regions (see Table 1) over the 2000–2015 period. Sixteen rainfall stations are available in North Cameroon. Furthermore, these stations are part of nine cotton production regions defined by SODECOTON where cotton yields and rainfall data were obtained.

2.2. Method

2.2.1. Precipitation Indices

The seasonal rainfall parameters examined are the onset and retreat dates of the wet season, the seasonal rainfall amount, the number of rainy days, rainfall intensity, heavy-rainfall events, number of consecutive dry days, maximum 1-day precipitation, and heavy precipitation days (Table 2). The GIS geostatistical analysis tool in R analysis software was used to change the station data into spatial data. The onset date determined by the daily cumulative rainfall anomaly (A) for a day of the year is described by [17] as follows:
A ( d a y ) = n = 1 d a y ( R n R ¯ ) ,
where Rn represents the daily precipitation sum for the day (n) and R is an average daily precipitation sum. The day corresponding to the minimum in A(day) corresponds to the onset date, and the maximum indicates the retreat date.
Daily rainfall above 1.0 mm represents a rainy day. The rainy season is the difference between the start and end date of each year.

2.2.2. Statistical Analyses

Nine regions presenting a distinct relationship between cotton yield and rainfall indices, recorded throughout the 2000–2015 period, were analyzed. An investigation was conducted to ascertain a probable link between inter-annual rainfall and cotton yield, but it did not indicate the relative importance of decadal-scale change in seasonal rainfall parameters over the 16-year period, where management can also change.
The Pearson correlation coefficient was used to quantify the strength of the impact of individual seasonal rainfall metrics on the growing season of cotton as a function of seasonal rainfall.
The cotton yield (Y) can be decomposed into two parts: the yield trend (Yt, mainly affected by cultivation technology, innovations and management) and yield fluctuation (Yf, mainly affected by weather). Weather can be divided into two parts: low-frequency climate changes and year-to-year weather fluctuation.
Y = Yt + Yf,
To discern the impacts of low-frequency climate changes on cotton yield, we use a linear trend to fit the yield and seasonal rainfall trend in each station so as to reject the impacts of inter-annual climate change, as a function of:
Yt = Δyield t + C,
where Yt is the cotton yield trend in a given year and Δyield = ΔYt/Δt is the yearly change of cotton yield trend. ΔRainfall = ΔRt/Δt is the yearly change of seasonal rainfall metric trends. We applied a simple linear regression model to fit these stations:
Δyield = m + ry ΔRainfall + ε,
where m is the average yield change due to other factors (management and increased CO2); ry is the yield response to low-frequency seasonal rainfall trends; and ε is the residual error.
As scatter plots between seasonal rainfall indices and mean cotton yield showed some signs of a bimodal distribution of the points (Figure 3), critical thresholds in the relationship between rainfall measurement and cotton yield were highlighted. A piecewise regression was used to determine breakpoints if there was a shift in mean, as well as the value of seasonal rainfall indices at which the shift occurred [18].

3. Results and Discussions

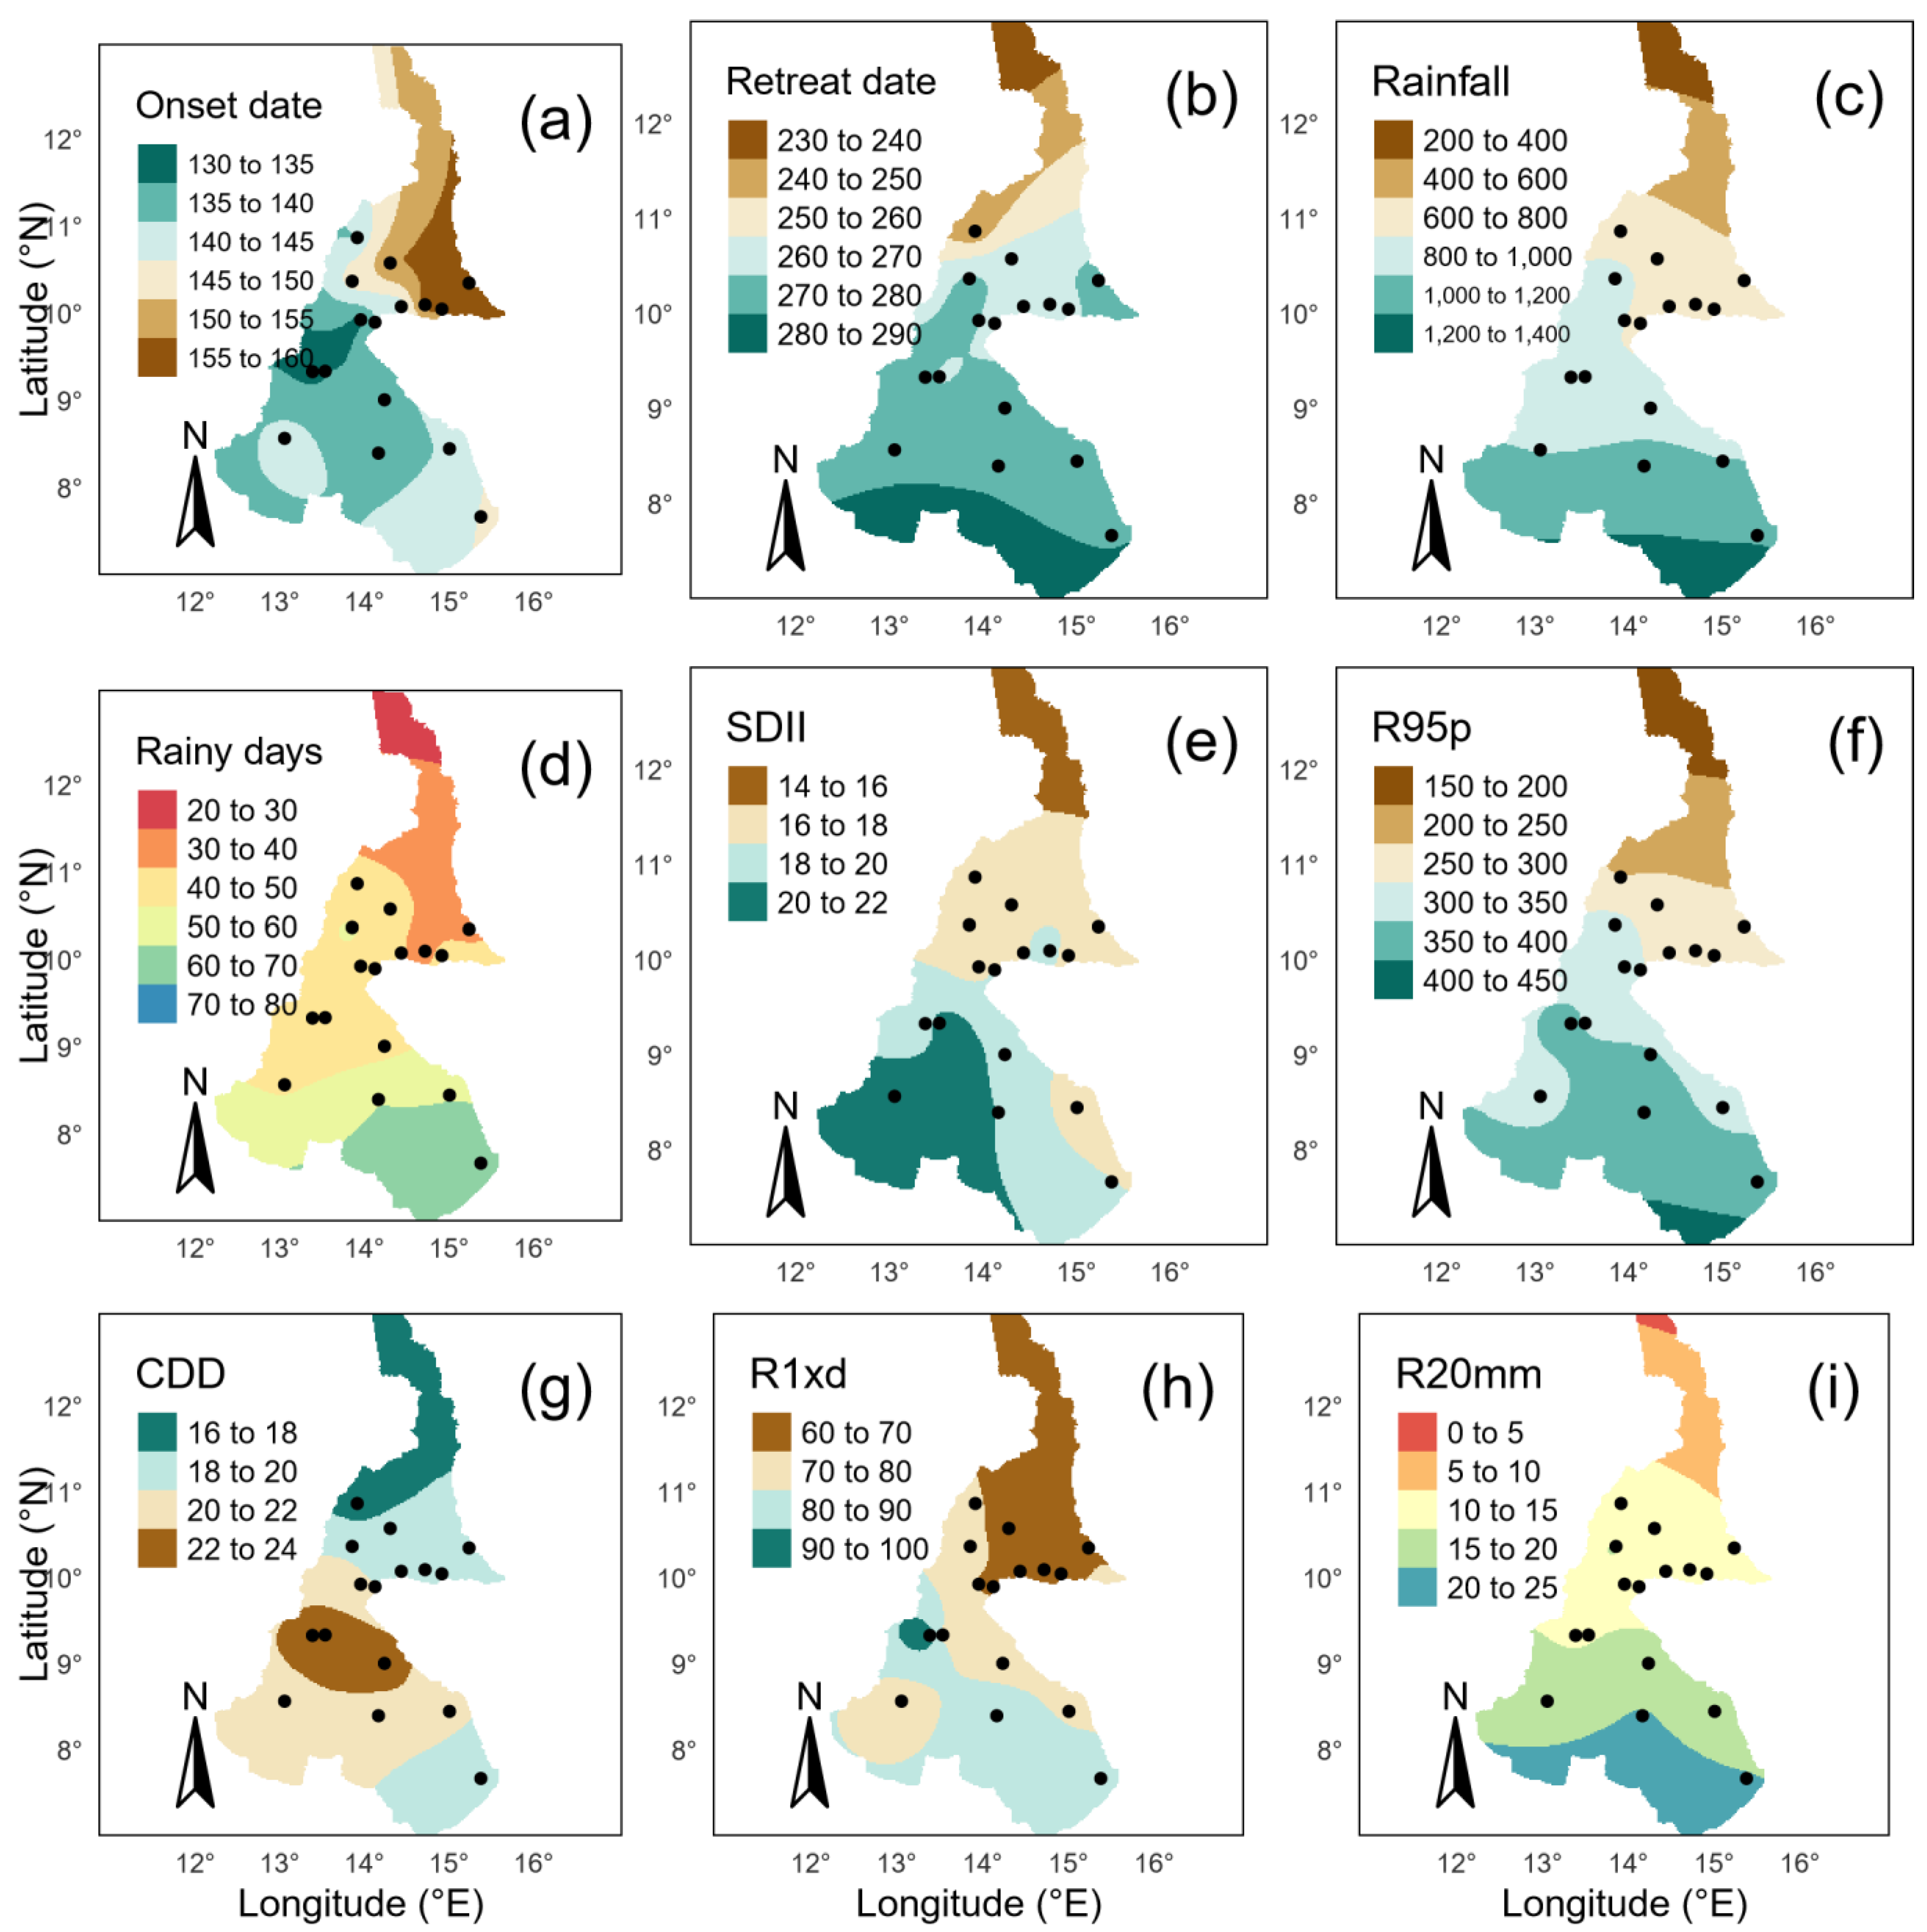
3.1. Spatial Pattern of Seasonal Rainfall Indices

Figure 3 shows the north–south gradient for average cotton yields, except for the regions of Maroua and Garoua, which are key regions in each climatic zone (benefiting from much more technical management than the other regions). However, from the results, it is clear that the temporal variations in cotton yield are higher in the southern region than in the northern part of the cotton zone. Figure 3 also shows a clear north–south gradient for the retreat date, seasonal rainfall, rainy days (RD), rainfall intensity (SDII), heavy-rainfall events (R95p and R20mm) and maximum 1-day precipitation (Rx1day) of the rainy season based on a 16-year (2000–2015) average value (Figure 3b–f,h,i). The onset date (Figure 3a) illustrated some longitudinal differences, with the lowest values found in the central parts of the study area, while the highest values were observed in the northern parts. A considerable difference between the northern and south-eastern, as well as between the central and southwestern (Figure 3g) parts, was observed in the consecutive dry days (CDD). This implies an earlier onset and a later retreat of the rainy season, a greater amount of rainfall and an increase in rainy days and heavy-rainfall events towards the south.
Thus, the average cotton yield follows all the gradients of average seasonal rainfall indices except CDD. Moreover, it is contrary to the onset date of the rainy season. Overall, our study illustrated the link between the seasonal rainfall indices and cotton yields, as was similarly observed in vegetation productivity at the regional scale in the Sahel [11] as well as Senegal [19].

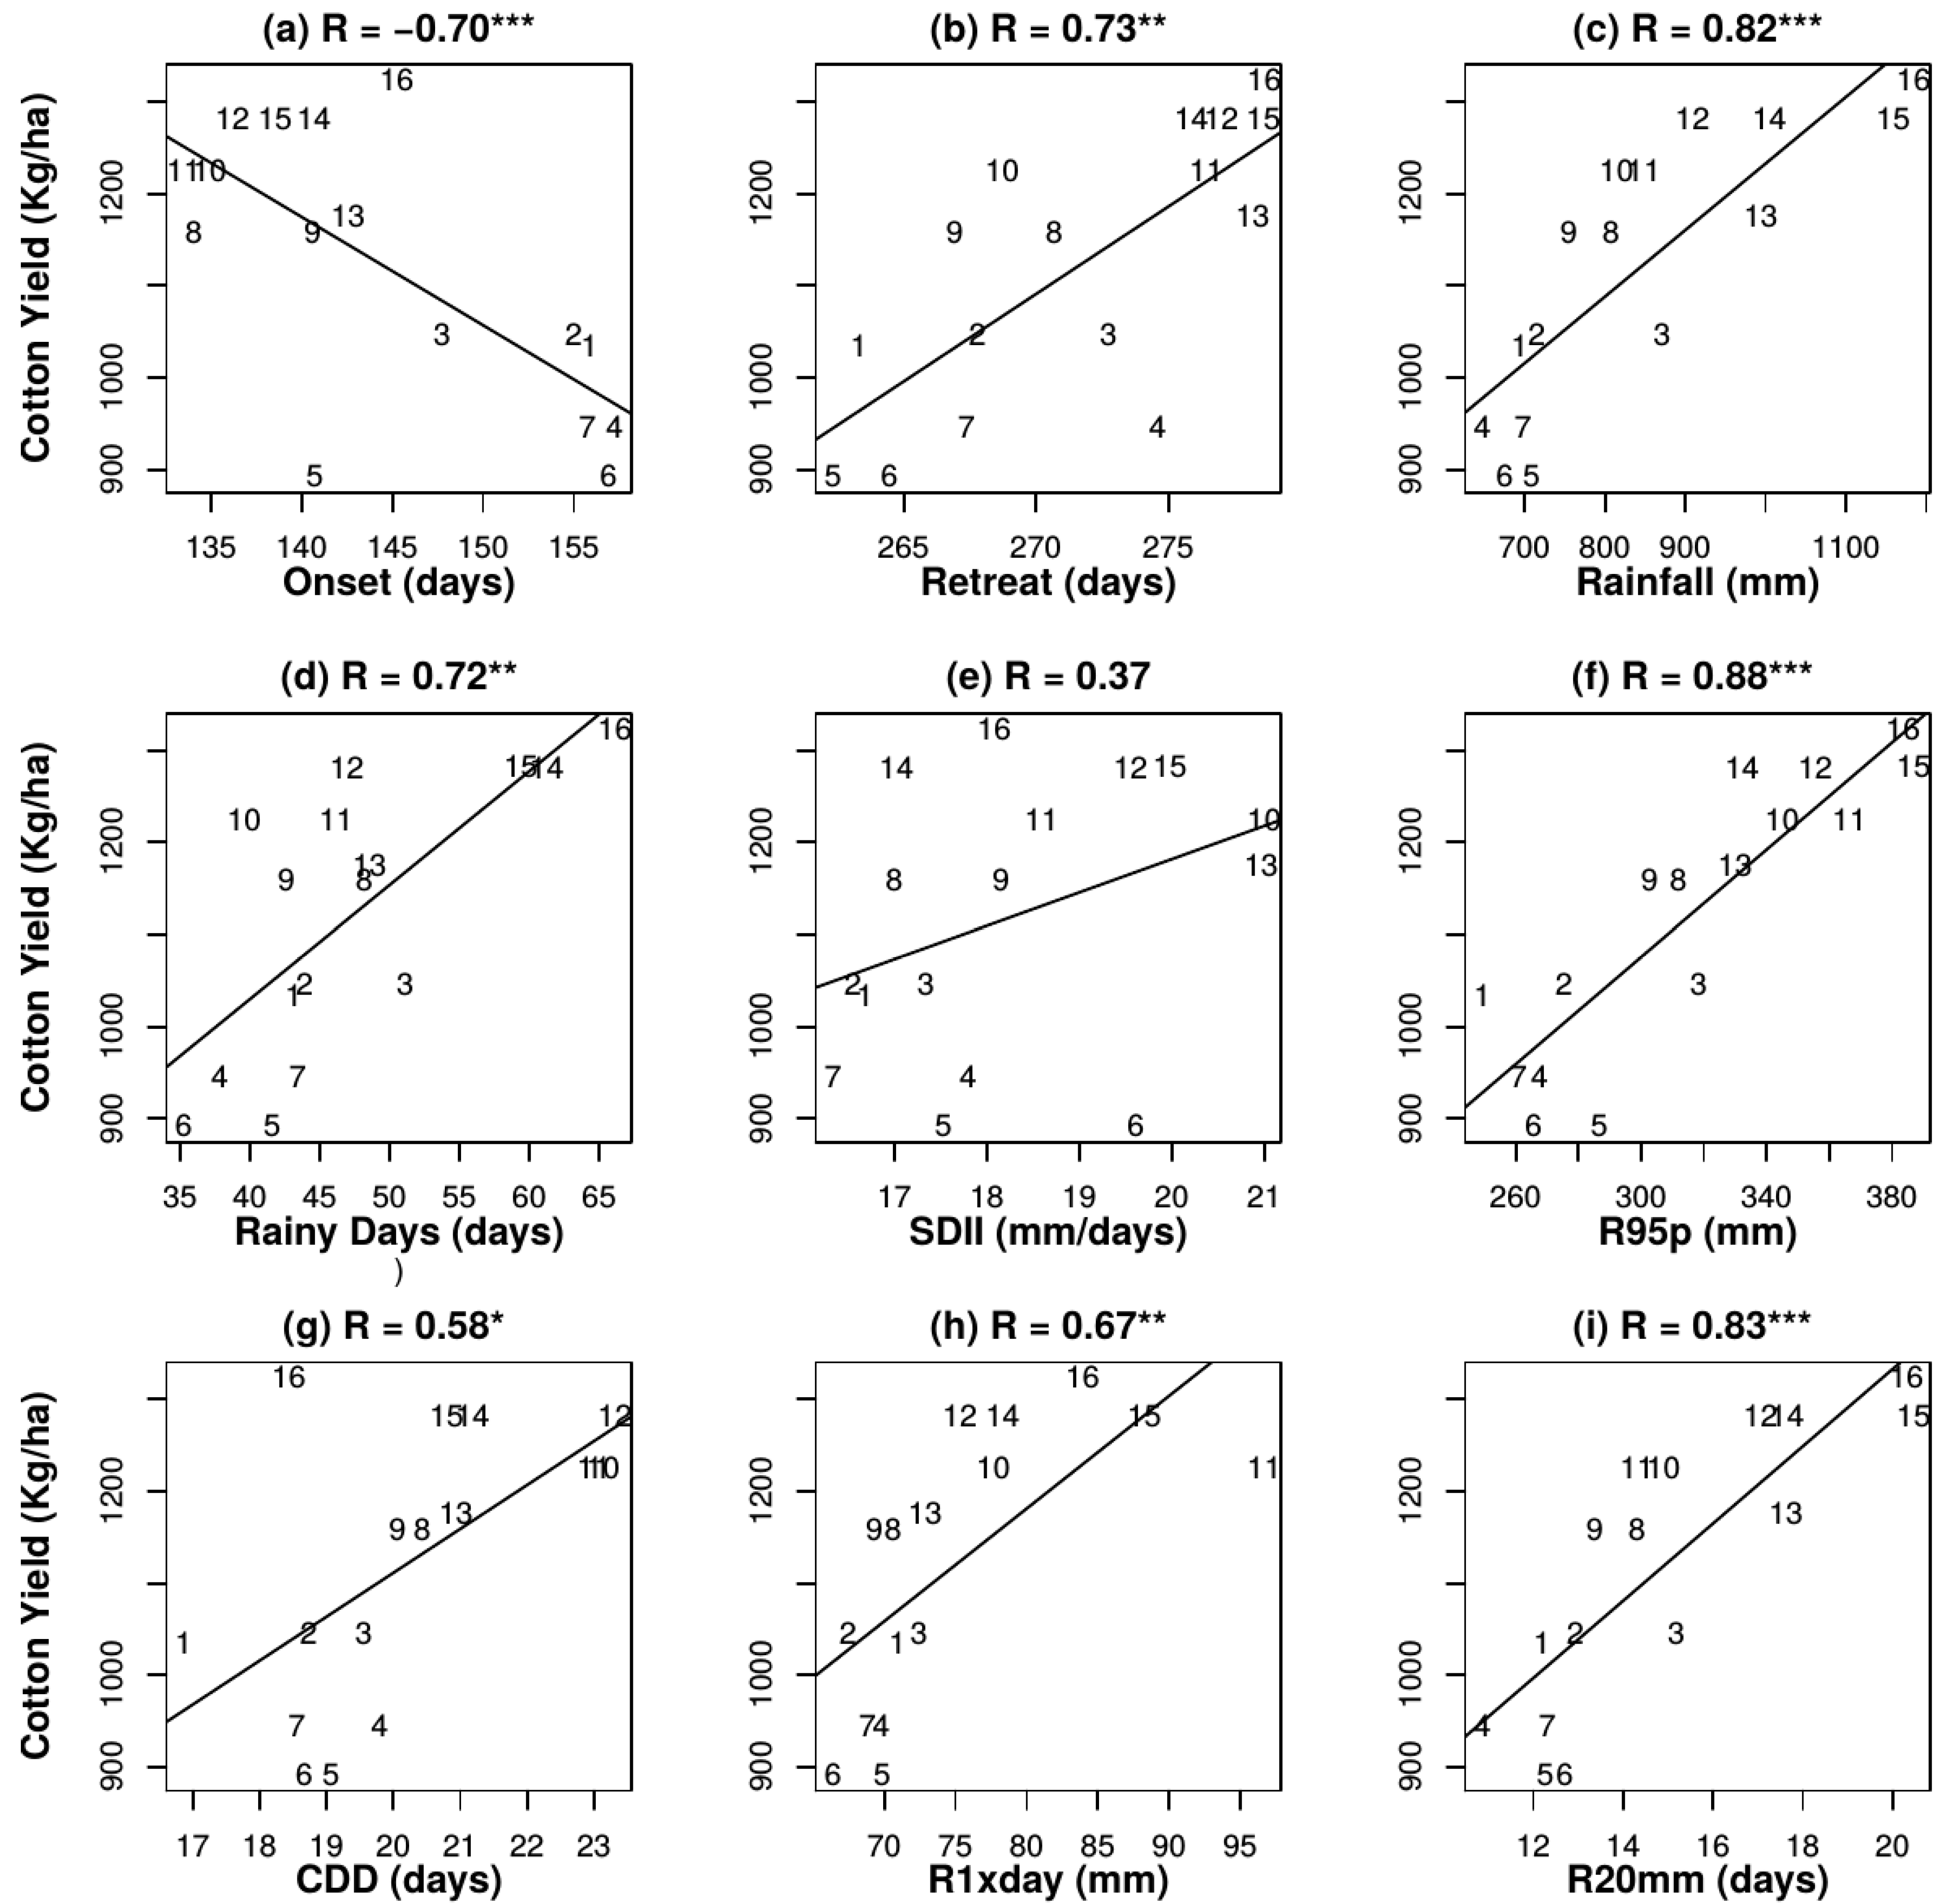
3.2. General Response of Cotton Yields to Seasonal Rainfall Indices

The role of seasonal rainfall in the spatial distribution of the mean cotton yield in North Cameroon was investigated by averaging yields and seasonal rainfall metrics over the 2000–2015 period for the 16 stations (Figure 4). For all seasonal rainfall indices except SDII, the scatter plots showed some signs of a bimodal distribution of the points, which was caused by the differences in the south–north patterns of the spatial distribution of seasonal rainfall indices in the study area, as reported in Figure 3. Thus, the productive regions with a late (early) onset and early (late) retreat date average have low (high) rainy days, and seasonal rainfall amounts tend to have lower (higher) cotton yields. The southern and central regions of North Cameroon (Touboro, Madingring, Tchollire, Bere, Garoua, Guider, Pitoa and Fignole) are the most productive areas and also those with the wettest conditions during the rainy season.
The spatial relationships between most of the seasonal rainfall indices and cotton yields were found to be significant (p < 0.01), and the Pearson correlation (|R|) varied between 0.37 and 0.88 (Figure 4). Generally, the parameter representing heavy-rainfall events (R95p) was identified as the most important metric impacting the cotton yield, |R| = 0.88 (Figure 4f), closely followed by R20mm, |R| = 0.83 (Figure 4i), seasonal rainfall, |R| = 0.82 (Figure 4c), retreat date, |R| = 0.73, rainy days, |R| = 0.72 (Figure 4d), and onset date, |R| = 0.70 of the rainy season. The impacts of CDD and R1xday on cotton yields were also noteworthy at |R| = 0.58 and |R| = 0.67, respectively (Figure 4g,h), while a rather weak relationship was observed between cotton yields and rainfall intensity (SDII), |R| = 0.37 (Figure 4e).
Few studies have been conducted on the contribution of the seasonal rainfall indices to crop yields in Cameroon, as, due to the scarcity of crops, yield data are limited, particularly for the cotton yield, and thereby difficulties in using observation data arise. Some studies confirmed the link between rainfall metrics in the rainy season and cotton yields, which aligns with the findings of this study. [6] used the daily climatic data to explicitly examine the role of cumulative precipitation, the length of the rainy season, the number of dry spells, the flooding periods, temperature and solar radiation in determining annual cotton production for an experimental plot located in Mali, and the results of their analysis confirm these variables’ importance. From a similar perspective, [7] studied two completely different sites—an experimental plot in Mali with a long-term historical yield survey and farmers’ yields in Cameroon—in their analysis of the climate–yield relationship and showed that the rainy season onset and length of rainy season are major drivers for the year-to-year variation and the spatial distribution of cotton yields. This study also agreed with the results of [11], who in similar studies, reported that the number of rainy days and the timing (onset and retreat) of the rainy season are seasonal rainfall indices that are decisive for favorable vegetation growth in the semi-arid Sahel.

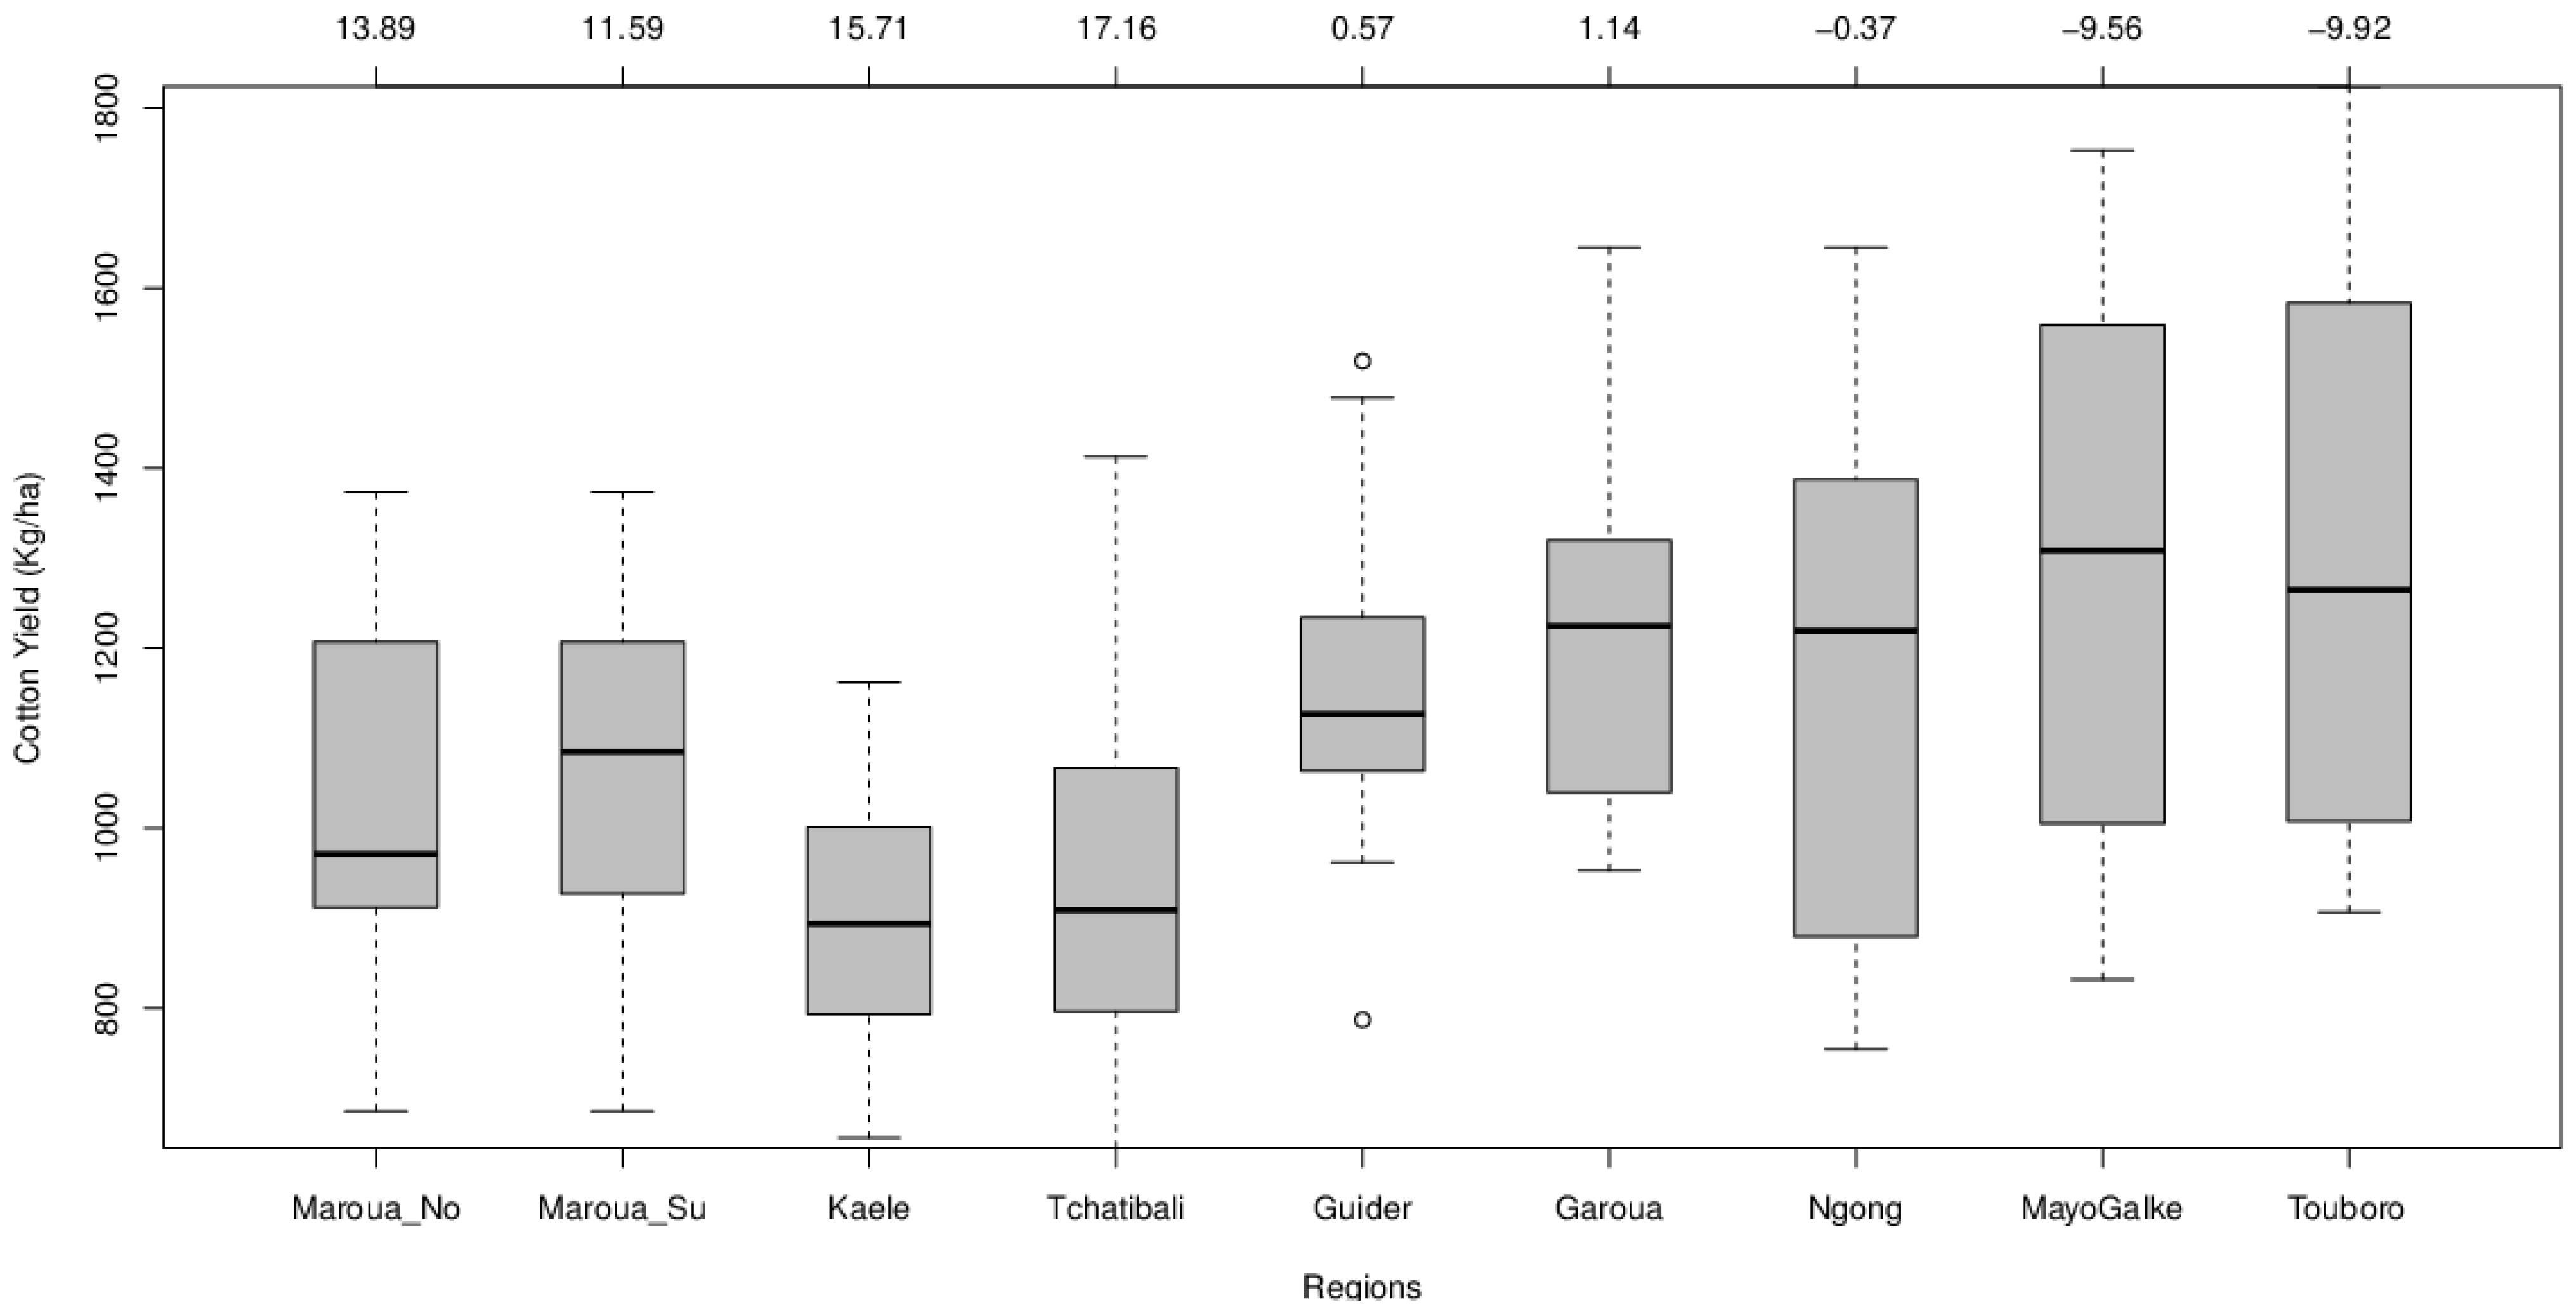
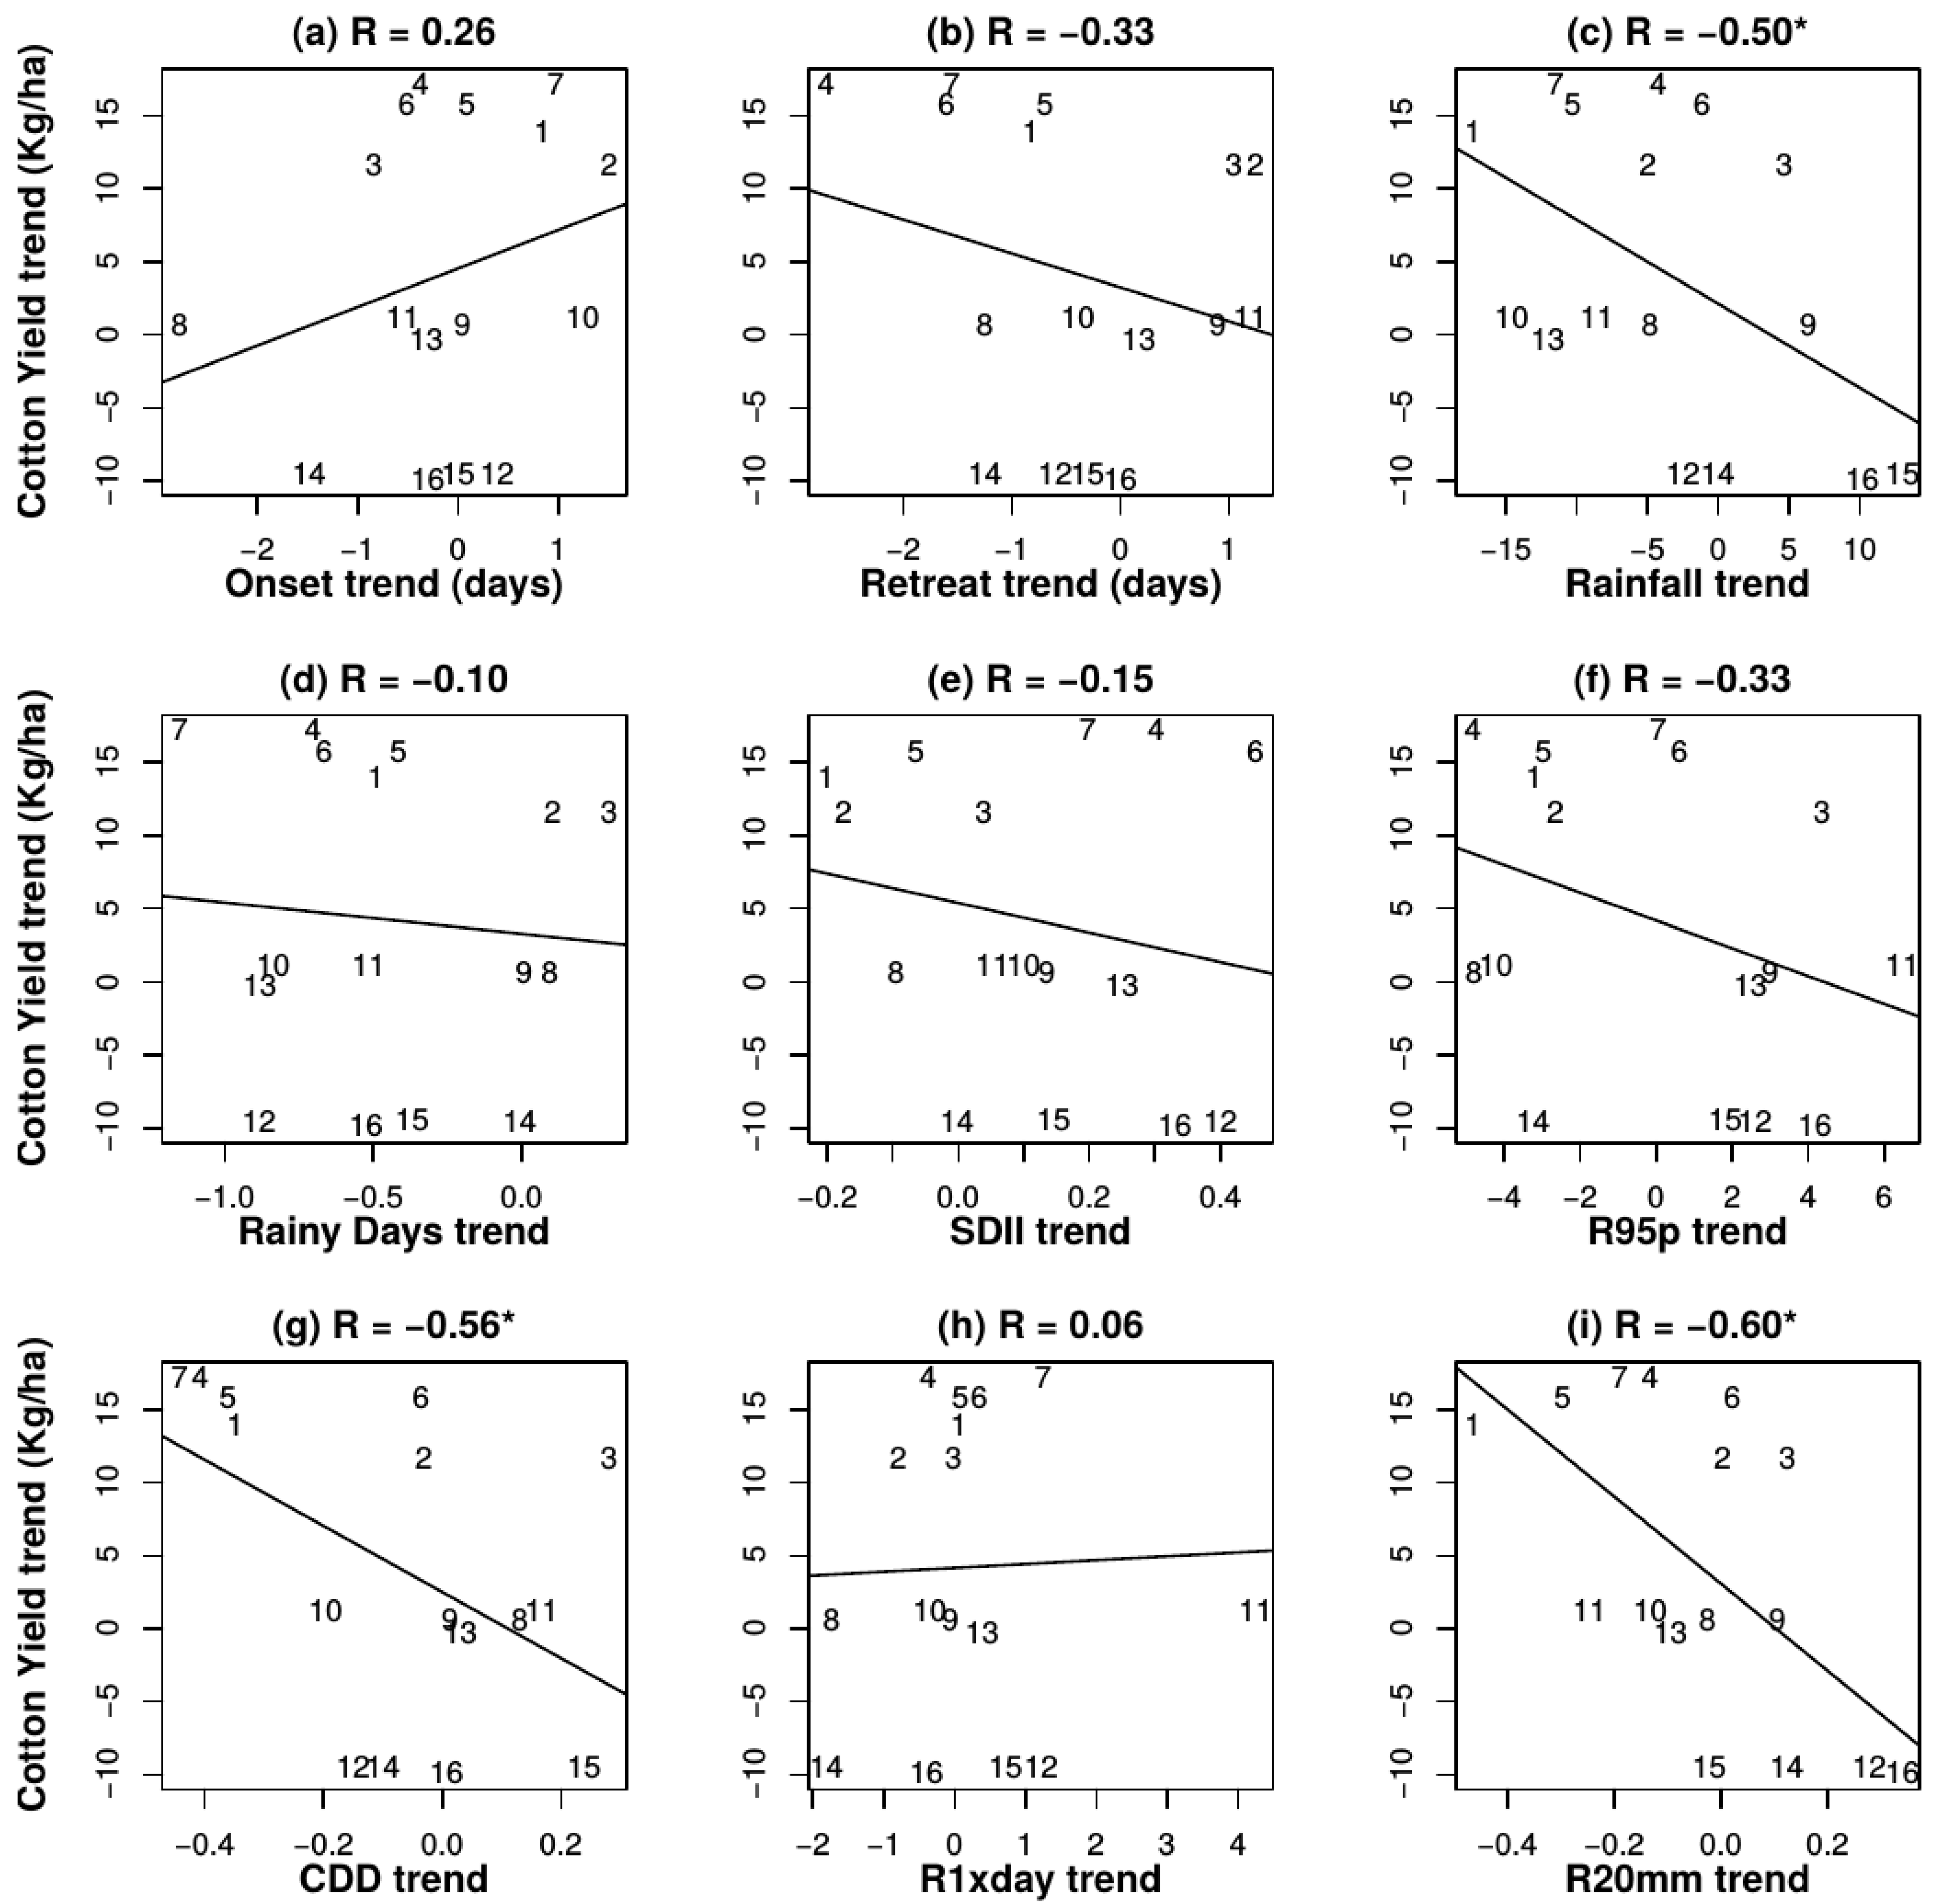
3.3. Analysis of Cotton Yield and Seasonal Rainfall Trends

Figure 5 shows the assessment result of the impact of low-frequency seasonal rainfall change on cotton yields in Equations (2)–(4). The relationship between seasonal rainfall indices and cotton yields on decadal-scale change is also investigated in this section by synthesizing data on seasonal rainfall indices and regional cotton yields in the study area from 2000 to 2015. The spatial and temporal variability of yields and precipitation merged into a singular analysis. Cotton yield trends were significantly correlated with the seasonal rainfall amount (R = −0.50 at p < 0.05), CDD (R = −0.56 at p < 0.05) and R20mm trends (R = −0.60 at p < 0.05) (Figure 5c,g,i). Overall, part of the decrease in cotton yield can be explained by a decrease in the seasonal rainfall amount and an increase in CDD (R = −0.56 at p < 0.05) and R20mm (R = −0.60 at p < 0.05). This could mean that the prevalence of drought and heavy rainfall risks can negatively impact cotton yields and cause food insecurity. In the study area, 56.25%, 56.25% and 81.25% of the stations area experienced negative trends during the growing season of CDD, R20mm and seasonal rainfall amounts over the study period, respectively (Table 3). These negative trends in CDD and R20mm mean a positive trend for cotton yield in most of Cameroon’s cotton regions, except for the trend in the seasonal rainfall amount where the trend in cotton yield is also negative. Our study agreed with [6] based on their multiple regression analysis of the main climatic determinants of rain-fed cotton yields for an experimental plot located in Mali. They reported that dry spells at critical phenological stages and flooding factors exhibit a negative relationship with yields.
The seasonal rainfall metrics-corrected average yield trend (2 < m < 5) increases for cotton production in the study area. The values of the trends in total national production (m) indicate the yield gains due to other factors (temperature, solar radiation, increased CO2 and management) in most regions of the study area.

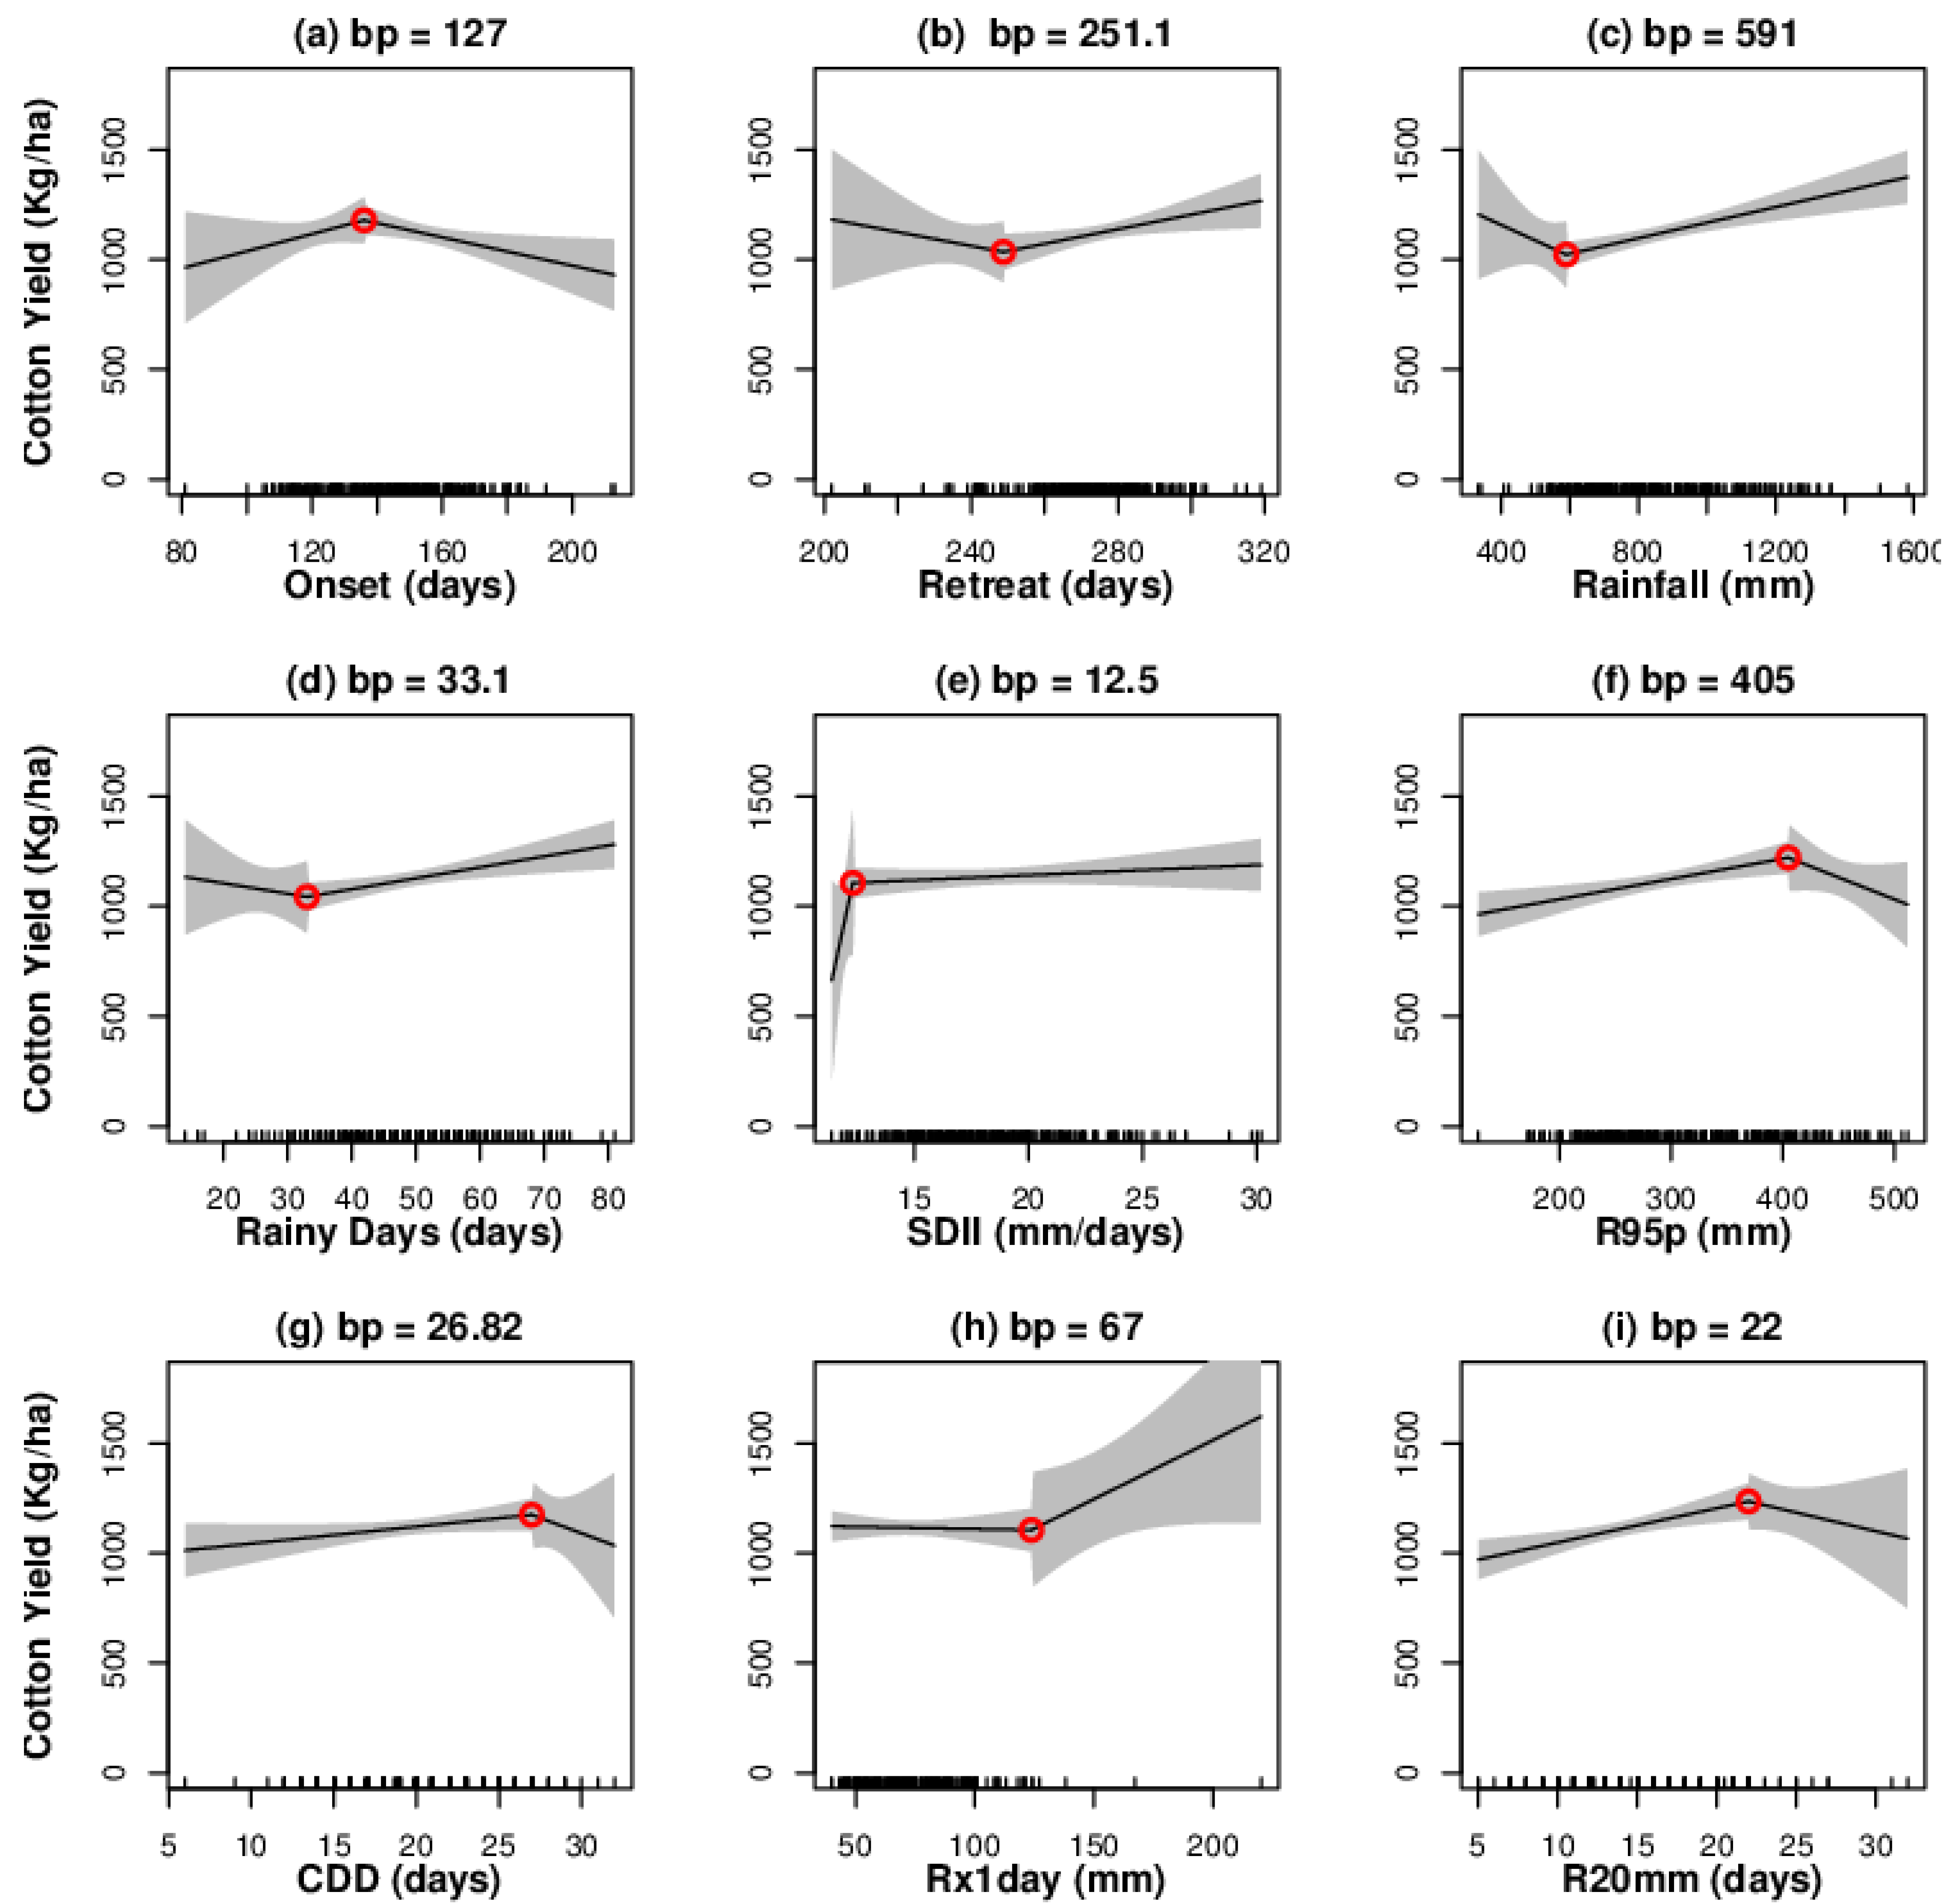
3.4. Critical Points for Cotton Yield

A piece-wise regression between cotton yields and seasonal rainfall indices was applied to identify if critical breakpoints in the relationship between cotton yields and seasonal rainfall indices exist (Figure 6). Note that there are cotton yield data and growing season seasonal rainfall indices in 16 stations in the cotton zone from 2000 to 2015. We then built a single vector from the 16 years and the 16 stations (256 points), with each station following one another. We found that the most evident thresholds related to seasonal rainfall indices’ influence on cotton yields depend on the onset and retreat of the rainy season, seasonal rainfall amount, rainy days, rainfall intensity (SDII), heavy-rainfall events (R95p) (Figure 6a–f) and Rx1day (Figure 6h). When the onset and retreat date of the rainy season was later than the 127th and 251st days of the year, there was a negative and positive correlation between onset and retreat dates and cotton production, respectively. Moreover, when the amount of rainfall was beyond the minimum value (near 591 mm in Figure 6c), there was a positive correlation between cumulated rainfall and cotton yield. In addition, when the amount of rainfall was beyond the minimum value (near 591 mm in Figure 6c), there was a positive correlation between cumulated rainfall and cotton yield. This contradicts [9], who, in a recent study, reported that there is a pronounced decrease in production above 700 mm using cottonseed yields simulated by the generic CROP GROwth model (CROPGRO). These differences may be due to the disparities in the simulation and time scales used. Similarly, rainy days (Figure 6d) were negatively related to cotton yields until a certain threshold (lower than 33) was reached. It was observed that cotton yield is influenced by low rainy days. However, SDII, R95p and Rx1day were almost linearly related to cotton yield. Cotton yields were particularly negatively impacted above a R95p value greater than 405 mm, and a rainfall intensity and Rx1day of ~12.5 mm·day−1 and 67 mm were detected for optimum cotton yields, respectively (Figure 6e,f,h). Additionally, when CDD and R20mm exceeded ∼27 and 22 days, respectively, a breakpoint in the curve was detected, as dry and very wet spells of this magnitude led to a strong reduction in cotton yield (Figure 6g,i). A recent study of vegetation productivity in the Sahel for 2001–2015 also was particularly negatively impacted above a 13 mm·day−1 rainfall intensity [11].

4. Conclusions

In this study, we analyzed the spatiotemporal impact of the following seasonal rainfall indices on the cotton yield in the Sudano-Sahelian zone of Cameroon: onset and retreat of the rainy season, number of rainy days, rainfall amount and rainfall intensity, number of Consecutive Dry Days (CDD), highest daily precipitation and frequency and heavy-rainfall events. We obtained a recognized pattern showing an average cotton yield that follows all the gradients of average seasonal rainfall indices, except for CDD, and opposite to the onset date of the rainy season. Our results demonstrated the strongest relationship between cotton yields and heavy-rainfall events closely followed by a relationship between cotton yields and seasonal rainfall amount. Gradual changes in CDD and heavy events have had an impact on cotton yield trends. Overall, the critical breakpoint analysis between cotton yield and all rainfall indices showed that the cotton yield was particularly negatively impacted underneath the 251th retreat date, 591 mm seasonal rainfall amount and 33 rainy days. However, the analysis also showed that an onset date, rainfall intensity, heavy rainfall, CDD, Rx1day and R20mm of 127, 12.5 mm·day−1, 405 mm, 27 days, 67 mm and 22 days, respectively, were depicted for optimum cotton yield. Recent modeling studies predict that increasing temperatures and the fertilizing effects of CO2 will shorten crop cycles with no negative effect and increase yields, respectively [9]. The area featuring high and very high agricultural drought hazards are distributed in most parts of the study domain [10]. In addition, the total wet-day rainfall amount above the 95th percentile is projected to consistently increase (by about 10–15%) during the first half of the century in the study area [20]. Based on this analysis, there is a clear and present need to aggregate cotton yield and climate data from different regions, perhaps with more detailed management information, to provide a much-needed observational constraint on projections of both climate change and management impacts on future food security.

Author Contributions

Conceptualization, I.N. and D.A.V.; methodology, I.N. and D.A.V.; formal analysis, I.N. and D.A.V.; writing—original draft preparation, I.N.; writing—review and editing, I.N, D.A.V., S.V.N.A. and R.N. All authors have read and agreed to the published version of the manuscript.

Funding

No funding was received for conducting this study.

Institutional Review Board Statement

Not applicable.

Informed Consent Statement

Not applicable.

Data Availability Statement

Not applicable.

Acknowledgments

The authors are grateful to SODECOTON’s support department for providing the data for this study. This work is conducted within the framework of the research of the International Joint Laboratory “Dynamics of Terrestrial Ecosystems in Central Africa: A context of Global Changes” (IJL DYCOCA/LMI DYCOFAC). The authors acknowledge the helpful inputs of Issa Djidji.

Conflicts of Interest

The authors declare that they have no conflict of interest.

References

  1. Folefack, D.P.; Klassou, C.E.L.E.S.T.I.N.; Enam, J.E.A.N. Price adjustments to cotton crisis in Cameroon: Factors and consequences of farmers’ adaptations. Life Sci. Int. J. Spec. Ed. Cotton Policies 2009, 1, 89–99. [Google Scholar]
  2. Bella-Medjo (Tsogo), M. Analyse Multi-Échelle de la Variabilité Pluviométrique au Cameroun et ses Conséquences sur le Rendement du Coton. Ph.D. Thesis, Université Pierre et Marie Curie, Paris, France, 2009. [Google Scholar]
  3. Folefack, D.P.; Bakwowi, J.N.; Kpade, P.C. La crise de la filière cotonnière et sécurité alimentaire au Nord Cameroun. J. Appl. Biosci. 2014, 75, 6221–6231. [Google Scholar] [CrossRef] [Green Version]
  4. Sanogo, S.; Fink, A.H.; Omotosho, J.A.; Ba, A.; Redl, R.; Ermert, V. Spatio-temporal characteristics of the recent rainfall recovery in West Africa. Int. J. Climatol. 2015, 35, 4589–4605. [Google Scholar] [CrossRef]
  5. MINADER. Ministry of Agriculture and Rural Development. 2012. Available online: https://www.mard.gov.vn/en/Pages/default.aspx (accessed on 20 October 2021).
  6. Blanc, E.; Quirion, P.; Strobl, E. The climatic determinants of cotton yields: Evidence from a plot in West Africa. Agric. For. Meteorol. 2008, 148, 1093–1100. [Google Scholar] [CrossRef] [Green Version]
  7. Sultan, B.; Bella-Medjo, M.; Berg, A.; Quirion, P.; Janicot, S. Multi-scales and multi-sites analyses of the role of rainfall in cotton yields in West Africa. Int. J. Climatol. A J. R. Meteorol. Soc. 2010, 30, 58–71. [Google Scholar] [CrossRef]
  8. Leblois, A.; Quirion, P.; Sultan, B. Price vs. weather shock hedging for cash crops: Ex ante evaluation for cotton producers in Cameroon. Ecol. Econ. 2014, 101, 67–80. [Google Scholar] [CrossRef] [Green Version]
  9. Gérardeaux, E.; Loison, R.; Palaï, O.; Sultan, B. Adaptation strategies to climate change using cotton (Gossypium hirsutum L.) ideotypes in rainfed tropical cropping systems in Sub-Saharan Africa. A modeling approach. Field Crop. Res. 2018, 226, 38–47. [Google Scholar] [CrossRef]
  10. Njouenwet, I.; Vondou, D.A.; Dassou, E.F.; Ayugi, B.O.; Nouayou, R. Assessment of agricultural drought during crop-growing season in the Sudano–Sahelian region of Cameroon. Nat. Hazards 2021, 106, 561–577. [Google Scholar] [CrossRef]
  11. Zhang, W.; Brandt, M.; Tong, X.; Tian, Q.; Fensholt, R. Impacts of the seasonal distribution of rainfall on vegetation productivity across the Sahel. Biogeosciences 2018, 15, 319–330. [Google Scholar] [CrossRef] [Green Version]
  12. Djoufack, V.; Fontaine, B.; Martiny, N.; Tsaléfac, M. Climatic and demographic determinants of vegetation cover in northern Cameroon. Int. J. Remote Sens. 2012, 33, 6904–6926. [Google Scholar] [CrossRef]
  13. Thompson, L.M. Weather variability, climatic change, and grain production. Science 1975, 188, 535–541. [Google Scholar] [CrossRef] [PubMed]
  14. Bell, M.A.; Fischer, R.A.; Byerlee, D.; Sayre, K. Genetic and agronomic contributions to yield gains: A case study for wheat. Field Crop. Res. 1995, 44, 55–65. [Google Scholar] [CrossRef]
  15. Nicholls, N. Increased Australian wheat yield due to recent climate trends. Nature 1997, 387, 484–485. [Google Scholar] [CrossRef]
  16. Lobell, D.B.; Asner, G.P. Climate and management contributions to recent trends in U. S. agricultural yields. Science 2003, 299, 1032. [Google Scholar] [CrossRef]
  17. Liebmann, B.; Camargo, S.J.; Seth, A.; Marengo, J.A.; Carvalho, L.M.; Allured, D.; Vera, C.S. Onset and End of the Rainy Season in South America in Observations and the ECHAM 4.5 Atmospheric General Circulation Model. J. Clim. 2007, 20, 2037–2050. [Google Scholar] [CrossRef] [Green Version]
  18. Muggeo, V.M. Estimating regression models with unknown break-points. Stat. Med. 2003, 22, 3055–3071. [Google Scholar] [CrossRef]
  19. Brandt, M.; Tappan, G.; Diouf, A.A.; Beye, G.; Mbow, C.; Fensholt, R. Woody vegetation die off and regeneration in response to rainfall variability in the West African Sahel. Remote Sens. 2017, 9, 39. [Google Scholar] [CrossRef] [Green Version]
  20. Mboka, J.J.M.; Kouna, S.B.; Chouto, S.; Djuidje, F.K.; Nguy, E.B.; Fotso-Kamga, G.; Yepdo, Z.D. Simulated impact of global warming on extreme rainfall events over Cameroon during the 21st century. Weather 2020, 76, 1–7. [Google Scholar] [CrossRef]
Figure 1. Boxplots of cotton and trend (upper axis) yields in different productivity zones displayed from north to south of the study area, defined by SODECOTON over the 2000–2015 period. Note: Two small circles in the fifth column indicate the highest or lowest “outlier”.
Sustainability 13 12086 g001
Figure 2. Map and cotton regions of the study area. There are 16 rainfall stations in the Sudano-Sahelian climate zone in Cameroon. The country boundary is in black, and the red line marks the cotton regions’ boundaries. The numbers indicate the geographical locations of the rainfall stations.
Sustainability 13 12086 g002
Figure 3. Spatial distribution of average seasonal rainfall indices: (a) onset of wet season (day of year); (b) retreat of wet season (day of year); (c) seasonal rainfall amount; (d) rainy days (days); (e) daily intensity (mm·day1); (f) heavy-rainfall events (mm); (g) consecutive dry days (days); (h) maximum 1 day precipitation (mm); (i) heavy precipitation days based on 16-year averages (2000–2015).
Sustainability 13 12086 g003
Figure 4. (ai) Spatial relationships between cotton yields and onset, retreat, seasonal rainfall amount, RD, SDII, R95p, CDD, CWD and R20mm based on 16-year average values (note: *, ** and *** represent significance at the 95%, 99% and 99.9% confidence levels, respectively). The numbers indicate the geographical locations of the rainfall stations as reported in Figure 2. The full line represents the regression line.
Sustainability 13 12086 g004
Figure 5. (ai) Regression statistics for cotton trend yield and onset, retreat, seasonal rainfall amount, RD, SDII, R95p, CDD, CWD and R20mm trend for all 16 stations during the 2000–2015 period (note: * significant at the 95% confidence level). The numbers indicate the geographical locations of the rainfall stations as reported in Figure 2. The full line represents the regression line.
Sustainability 13 12086 g005
Figure 6. (ai) Cotton yields plotted against rainfall indices. Solid red points indicate the breakpoint (bp) for rainfall individual indices between cotton yields. Shading represents the 95% confidence intervals of the fitting.
Sustainability 13 12086 g006
Table 1. Geographical descriptions of the cotton production regions and rainfall stations.
Cotton RegionsStations Latitude (°N)Longitude (°E)Altitude (m)
Maroua NordGuetale10.0713.91490
Maroua SudMaroua10.5814.30428
Hina-Marbak10.3713.85544
KaéléGuidiguis10.1014.71362
Kaélé10.0814.43388
TchatibaliTchatibali10.0514.91815
Yagoua10.3515.23325
GuiderBidzar9.914.12470
Guider9.0313.95356
GarouaPitoa9.3413.53274
Garoua8.5613.05213
NgongFignole8.5713.05 523
Mayo-GalkéBere9.0114.23238
Madingring8.4515.00430
Tchollire8.414.16392
TouboroTouboro7.6715.37500
Table 2. Rainfall indices based on daily precipitation.
Index nameDefinitionsUnits
Onset of wet season (onset)The minimum value in the accumulative anomaly of daily rainfallDay of year
Retreat of wet season (retreat)The maximum value of the accumulative anomaly of daily rainfallDay of year
Seasonal rainfall amount Rainfall amount during the wet seasonmm/y
Rainy days Number of days with rainfall >1 mm between the onset and the retreat of the wet seasonDays
Rainfall intensity (SDII)Ratio of annual total rainfall and number of rainy days
>1 mm
mm day−1
Heavy-rainfall events (R95p)Sum of annual rainfall events exceeding the (2000–2012) 95th percentilemm
Consecutive dry days (CDD)Maximum number of consecutive days with rainfall < 1 mm during wet seasonDays
Maximum 1 day precipitation (Rx1day)Annual highest daily precipitationmm
Heavy precipitation days (R20mm)Annual count of days with daily precipitation totals above 20 mmDays
Table 3. Average yield change due to other factors and percentage of stations’ indices with negative/positive trends for seasonal rainfall over the cotton zone during the 2000–2015 period. Trends are significant at the 95% confidence level.
Percentage of Stations with
Seasonal Indicesm ± ΔmPositive TrendSignificant Positive TrendNegative TrendSignificant Negative Trend
Onset date 4.5   ±   2.6 4414.2956.2511.11
Retreat date 3.1 ± 2.7 2507533.33
Rainfall amount 2.1   ±   2.6 18.75081.2523.08
Rainy days 3.3 ± 3.9 2507525
Rainfall intensity 5.1 ± 3.1 68.7527.2731.250
R95p 4.1 ± 2.6 56.2511.1143.7514.29
CDD 2.5 ± 2.3 43.75056.2511.11
Rx1day 4.1 ± 2.7 5012.505012.50
R20mm 2.9   ±   2.2 43.75056.2511.11
Publisher’s Note: MDPI stays neutral with regard to jurisdictional claims in published maps and institutional affiliations.

