Abstract
Earth Observation (EO) techniques could offer a more cost-effective and rapid approach for reliable monitoring, reporting, and verification (MRV) of soil organic carbon (SOC). Here, we analyse the available published literature to assess whether it may be possible to estimate SOC using data from sensors mounted on satellites and airborne systems. This is complemented with research using a series of semi-structured interviews with experts in soil health and policy areas to understand the level of accuracy that is acceptable for MRV approaches for SOC. We also perform a cost-accuracy analysis of the approaches, including the use of EO techniques, for SOC assessment in the context of the new UK Environmental Land Management scheme. We summarise the state-of-the-art EO techniques for SOC assessment and identify 3 themes and 25 key suggestions and concerns for the MRV of SOC from the expert interviews. Notably, over three-quarters of the respondents considered that a ‘validation accuracy’ of 90% or better would be required from EO-based techniques to be acceptable as an effective system for the monitoring and reporting of SOC stocks. The cost-accuracy analysis revealed that a combination of EO technology and in situ sampling has the potential to offer a reliable, cost-effective approach to estimating SOC at a local scale (4 ha), although several challenges remain. We conclude by proposing an MRV framework for SOC that collates and integrates seven criteria for multiple data sources at the appropriate scales.
1. Introduction
Soil organic carbon (SOC) is one of the components of soil organic matter (SOM), which also includes other elements such as hydrogen, oxygen, and nitrogen, as well as fresh (living) and decomposed plant/animal (dead) materials [1]. SOM consists of several components in varying proportions, including microorganisms (10–40%) and stable organic matter (40–60%) (also referred to as humus) [1]. Most productive agricultural soils have between 3% and 6% organic matter, with the organic matter contributing to soil productivity in many ways. Although the carbon content of SOM varies considerably, the soil remains one of the key components of the carbon cycle [2]. A mean value of 1500 gigatonnes for the first 1 m depth of soils has been estimated from many studies of global carbon stocks, with about half of this amount present in the top 30 cm of the soil [3,4]. SOC is critical for soil health and biological, chemical, and physical functions such as nutrient cycling, water retention, and maintaining soil structure and crop yield [5]. As a result, carbon storage (C-storage) in soils has gained increasing international attention as a means of mitigating climate change. Initiatives such as ‘4p1000′ [6], the FAO’s Global assessment of carbon sequestration by soils (e.g. the GSOCseq programme) [7], and the UN’s Sustainable Development Goals (SDGs) all recognise the importance of C-storage in soils [8]. As part of its action on soils, the UK has signed up for the ‘4p1000′ soil carbon initiative to increase the soil carbon levels by 0.4% per year [6]. Similarly, the UK 25 Year Environment Plan aims to enhance the natural capital of air, water, soil, and ecosystems that support all forms of life. This is viewed as being essential for economic growth and productivity over the long term. This includes developing a soil health index and restoring and protecting peatlands [9].
The UK Department for Environment, Food and Rural Affairs (DEFRA)’s Environmental Land Management (ELM) initiative is a national programme of intensive policy development, for implementation post-2025, to help farmers and other land managers to improve the environment with associated public money used to help deliver ‘public goods’ (e.g. clean air and water, healthy soils, climate change mitigation, wildlife protection, and the promotion of landscape beauty and heritage). As part of achieving this, cost-effective and innovative solutions will be needed to deliver a robust and flexible system for the monitoring, reporting, and verification (MRV) of soil status and change [9].
Certain agricultural management practices that result in land use change, such as agroforestry, tillage/residue, manure/biosolid management, grazing land management/pasture improvement, land restoration, and livestock management, can maintain or increase SOC stocks [10,11]. Using such practices, it has been suggested that carbon sequestration in soils could be a cost-effective, environmentally friendly strategy for greenhouse gas removal [12]. Increasing soil organic matter content and thereby improving soil quality can also enhance other soil-based ecosystem services, such as agricultural production, clean water supply, and biodiversity [13].
In terms of the current large-scale soil assessments (including SOC levels), regional and country scale systems have been developed by the FAO and the International Union of Soil Societies (IUSS) (Table 1). In the case of the UK, the National Soil Inventory (NSI) and Countryside Survey (CS) are the two major soil surveys (Table 1). Bellamy et al. [14] reported changes in SOC (up to 30 cm) during the 1980s and 1990s in England and Wales based on NSI and observed gains in OC in some areas but large losses in others and, overall, noted a net loss of about 4 million tonnes of C per year. More recent results reported by Carey et al. [15], Emmett et al. [16], and Norton et al. [17] based on the CS show only a negligible change in OC over the 1978–2007 period. The drivers of SOC variation are discussed in further detail in [18] and are considered to include environmental change and habitat-specific trends as influencing soil processes. However, Bellamy et al. [14] showed a linear relationship between the rate of change in soil carbon and the soil carbon content, indicating that the loss was greater in soils with large carbon contents while soils with small carbon contents gained carbon. Because the losses occurred across all land use types, they considered that climate change might play a role in this, in addition to the effects of changes in land use and agricultural management activities.

Table 1.
Existing and emerging large-scale soil assessment projects (global, Europe and UK scale).
The reasons for the differences in SOC between the NSI and CS results are not clearly understood. However, Kirk et al. [19] considered that they were not comparable because of differences in the sampling designs, with the CS using a hierarchical stratified sampling scheme and single samples from point locations, whereas the NSI used a fixed grid with bulked samples centred on the target point. Hence, the answer obtained about the SOC of a field can depend to some extent on the sampling methodology.
The increasing recognition of soil carbon as a key component in policy and action on climate change, as well as for ecosystem health, highlights the need for MRV systems that can track and update SOC status and change estimates at scales ranging from local to global. At present, the available large-scale soil surveys (c.f. Table 1) represent major resourcing efforts due to the complex and intensive sampling requirements to address the spatial variability of SOC, even within a single field. The FAO [1] has outlined recommendations for determining SOC stock and monitoring its dynamics and spatial variability. For instance, to determine SOC stocks between 0 and 30 cm depth at a particular site, the FAO specifies as a minimum requirement the need to quantify the following: (i) SOC concentration in the fine earth (<2 mm size) soil fraction, (ii) the fine earth (<2 mm) and coarse mineral fraction content (>2 mm size) of the soil, and (iii) the soil bulk density of fine earth mass. To capture the spatial variability of SOC within an agricultural field (land parcel), with an acceptable level of accuracy, it is required that the site be assessed using the following factors: soil and land use type, climate, grazing practices, field size, fertiliser use, historical management practices, and ploughing frequency [27,28]. In addition, a large number of soil samples is often required.
For instance, Garten and Wullschleger [29] recommended the collection of more than 100 soil samples (to detect 2–3% change in SOC stocks), whereas Vanguelova et al. [30] suggested between 4 and 25 soil samples for 0.25 ha with more or equal 5 m between sampling points to eliminate spatial autocorrelation. SOC measurement relies on appropriate study designs and sampling protocols to deal with high spatial variability [31]. SOC content is typically expressed as the (mass) percentage dry weight of soil, once stones, etc., have been removed.
Laboratory techniques for assessing SOC are commonly based on approaches such as dry combustion using an elemental analyser (prior acidification of sample will remove inorganic carbon), loss on ignition, the Walkley–Black method, soil respiration, and active carbon tests. The most accurate standard laboratory test for soil carbon is dry combustion using an elemental analyser. These instruments heat a small sample (usually a fraction of a gram) of dry pulverized soil to around 900 degrees C and measure the carbon dioxide gas that is a combustion product. In terms of loss of ignition, a change in weight after heating a soil sample (ignition test) is observed, although complications can arise if the sample has carbon in an inorganic form (e.g. calcium carbonate), which will also generate carbon dioxide at high temperatures. The latter can be accommodated by comparing the change in weight of a soil sample divided into two parts, with one part first treated with acid to remove the calcium carbonate while the other is subjected to combustion. Comparing changes in the two provide a measure of the SOC for the sample, although there is clearly room for error. Nonetheless, knowledge of the potential sources of error and uncertainty in SOC stock estimation, coupled with sampling strategies that integrate lateral and vertical variability of SOC stock, enable SOC and its change to be determined with an acceptable level of uncertainty to help guide management, albeit often requiring intensive sampling regimes [1].
Smith et al. [28] classified approaches to assess SOC measurements into “direct”—those that could be performed through intensive soil sampling—and “indirect methods”—measurements which infer SOC stock changes from flux measurements (based on the gross primary production) and/or from the comparison of spectral reflectance images of soil samples with consolidated spectral reflectance libraries derived from measurements on reference soil samples of known properties (determined by traditional laboratory methods). The reflectance-based measurements can be obtained at a high level of spatial detail from hyperspectral sensors mounted on unmanned aerial systems (UASs) or multispectral sensors onboard satellites and airborne platforms.
EO satellite imagery also can be used to estimate changes in SOC through proxies such as Net Primary Production (NPP) or Gross Primary Productions (GPP) [32], land use management [33], land cover change [34], and land degradation indices [35]. Conant et al. [36] described approaches such as statistical upscaling via in situ samplings (providing greater accuracy and lower errors but expensive at large scales) and geostatistical upscaling through combining initial sampling with covariates (obtaining spatial maps of SOC status at the whole field and large scale at low cost, but with low accuracy).
Many published studies [37,38,39,40,41,42,43,44,45] show that remote sensing imagery (both EO satellite and UAS) can be used to estimate SOC stock and its change, by building statistical relationships between the measured remotely sensed spectra and in situ soil samples, to make estimations of the SOC status. As the traditional methods based on soil sampling and laboratory analysis can be very expensive and time consuming, especially when estimating SOC over large areas, the potential of EO technologies to provide timely, repeatable, and potentially cost-effective estimates of SOC stocks and their spatial and temporal variability is of considerable interest [46,47]. However, of course, much depends on the relationship between estimates of SOC made using EO and those made by using more ‘traditional’ (i.e. well-established) approaches of taking soil samples that are assessed in the laboratory. While, as noted above, the ‘traditional’ approaches to SOC assessment have their own uncertainty in terms of the sampling regime and laboratory methods, they arguably provide the standard to which EO assessments have to be compared. Thus, the term ‘accuracy’ is typically used to describe how the EO-based assessment of SOC matches (within uncertainties) that derived from traditional methods. Inevitably there are trade-offs here for those concerned with using the estimates of SOC to manage the land. Given that EO-based approaches have the advantages noted above, including perhaps a lower cost, then they may provide an attractive option for those concerned with land management, but what level of agreement with the more traditional assessments of SOC would be acceptable to them? Would it be acceptable, for example, if the EO-based estimates of SOC gave values that matched those using traditional techniques for half the number of plots or does it need to be higher?
The research described in this paper was designed to assess the current state of the art on the use of EO for SOC stock measurement and its potential for the current and future MRV of SOC. The following objectives are addressed (i) to assess (from literature) the capabilities of EO techniques for assessing SOC stocks at local to national scales (throughout this paper the term EO is used to encompass remote sensing technologies such as satellite, aerial photography, Unmanned Aircraft Systems (UAS), etc.), (ii) to evaluate expert perspectives on the relevance/importance of SOC estimation by EO and the acceptable levels of accuracy required for application to UK (and other) policy implementation derived from such approaches, and (iii) to perform a cost-accuracy analysis using different data sources for estimating SOC.
2. Materials and Methods
2.1. EO for SOC—Literature Acquisition and Evaluation
A literature search was restricted to peer-reviewed papers published between 2000 and 2020 which assessed the use of EO to estimate SOC stocks. This literature was also used to refine questions and topics for exploration in the expert interviews. Three sequential steps were undertaken to select literature for analysis: (i) search for peer-reviewed articles containing one or more of the following keywords: “Earth Observation”, “Remote Sensing”, “Airborne”, “Lidar”, “Satellite”, “UAS”, along with either “Soil Organic Carbon” or “Soil Organic Matter”; (ii) selecting relevant work that included the keywords; and (iii) review and analysis. These steps identified 54 relevant peer-reviewed articles.
2.2. Expert Interviews
Primary data collection was conducted via a set of semi-structured interviews between March and August 2020 with 13 specialists in soil health (highly cited researchers) and environment/agricultural policymaking (top relevant institutions), most with more than 15 years of experience. An email invitation was sent with a brief explanation of the request and a detailed description of this study. In addition, the framework established from the analysis of the literature was provided to all participants and discussed during the interviews. Following the initial seven interviews, several suggestions for further potential respondents were made and followed up in a ‘snowballing’ approach. Each interview lasted for between 20 and 45 min. Twelve were carried out through online conversations with permitted recording, and one was undertaken in writing as the expert preferred that format.
The structure of the interviews was led by open-ended questions acting to promote and produce rich information which requires a high level of attention and interpretation. We consider that the sample size was large enough to allow understanding of the issue under study to unfold but small enough that rich qualitative data could be obtained.
The interviewees represented the following range of sectors and roles: academics and researchers (5), consultants (4), and policymakers (4) (Table 2). All of the respondents were based in the UK.
Table 2.
Participants in the semi-structured interviews by sector and institution.
In the opening section of the interview, a detailed introduction was given regarding the study’s objectives and the framework derived from the literature. The set of 12 questions in Section 2, Section 3 and Section 4 of Table 3 was then explored. Section 2 comprised six questions about the importance of SOC in the policy context and the current use and frequency of SOC/SOM assessment within agricultural policy. The five questions in Section 3 sought to explore the levels of accuracy that would be required from EO techniques in order to provide reliable data for monitoring and reporting SOC levels to benefit ELM. Finally, in Section 4, the respondents were given the opportunity to raise any further points or observations. This structure enabled consistent coverage of the topics whilst allowing for the respondents to provide their suggestions and comments based on their area of expertise.
Table 3.
Format and questions of the semi-structured interview.
The transcribed interviews were subjected to manual content analysis. A series of open and axial coding techniques were used to identify themes and build the theory. The first step was ‘open coding’, in which tentative labels were assigned to the interview transcription data. Secondly, in the axial coding, codes were selected to focus on the analysis of the core categories to identify relationships among the open codes. Thus, categories/themes were identified in the data using the underlying objectives and structure of the questions posed, together with insights emerging from the respondents.
2.3. Cost-Accuracy Analysis
In Andries et al. [48], a structured framework was described for evaluating the usefulness of various EO-based approaches to inform the UN Sustainable Development Goal (SDG) indicators. One premise that was considered as part of the framework (based on recommendations from expert interviews) was the “cost-effectiveness” of the EO solution when compared with more traditional techniques. It was noted that the existing literature rarely discussed the cost-effectiveness of a particular approach, and the inclusion of this information in studies was recommended. Therefore, in the present research, we have taken into consideration information on the cost of the data type, methods, prediction, and accuracy. This cost information is expected to be relevant for decision making in land management and the design of cost-effective MRV systems for SOC within schemes such as the UK ELM scheme.
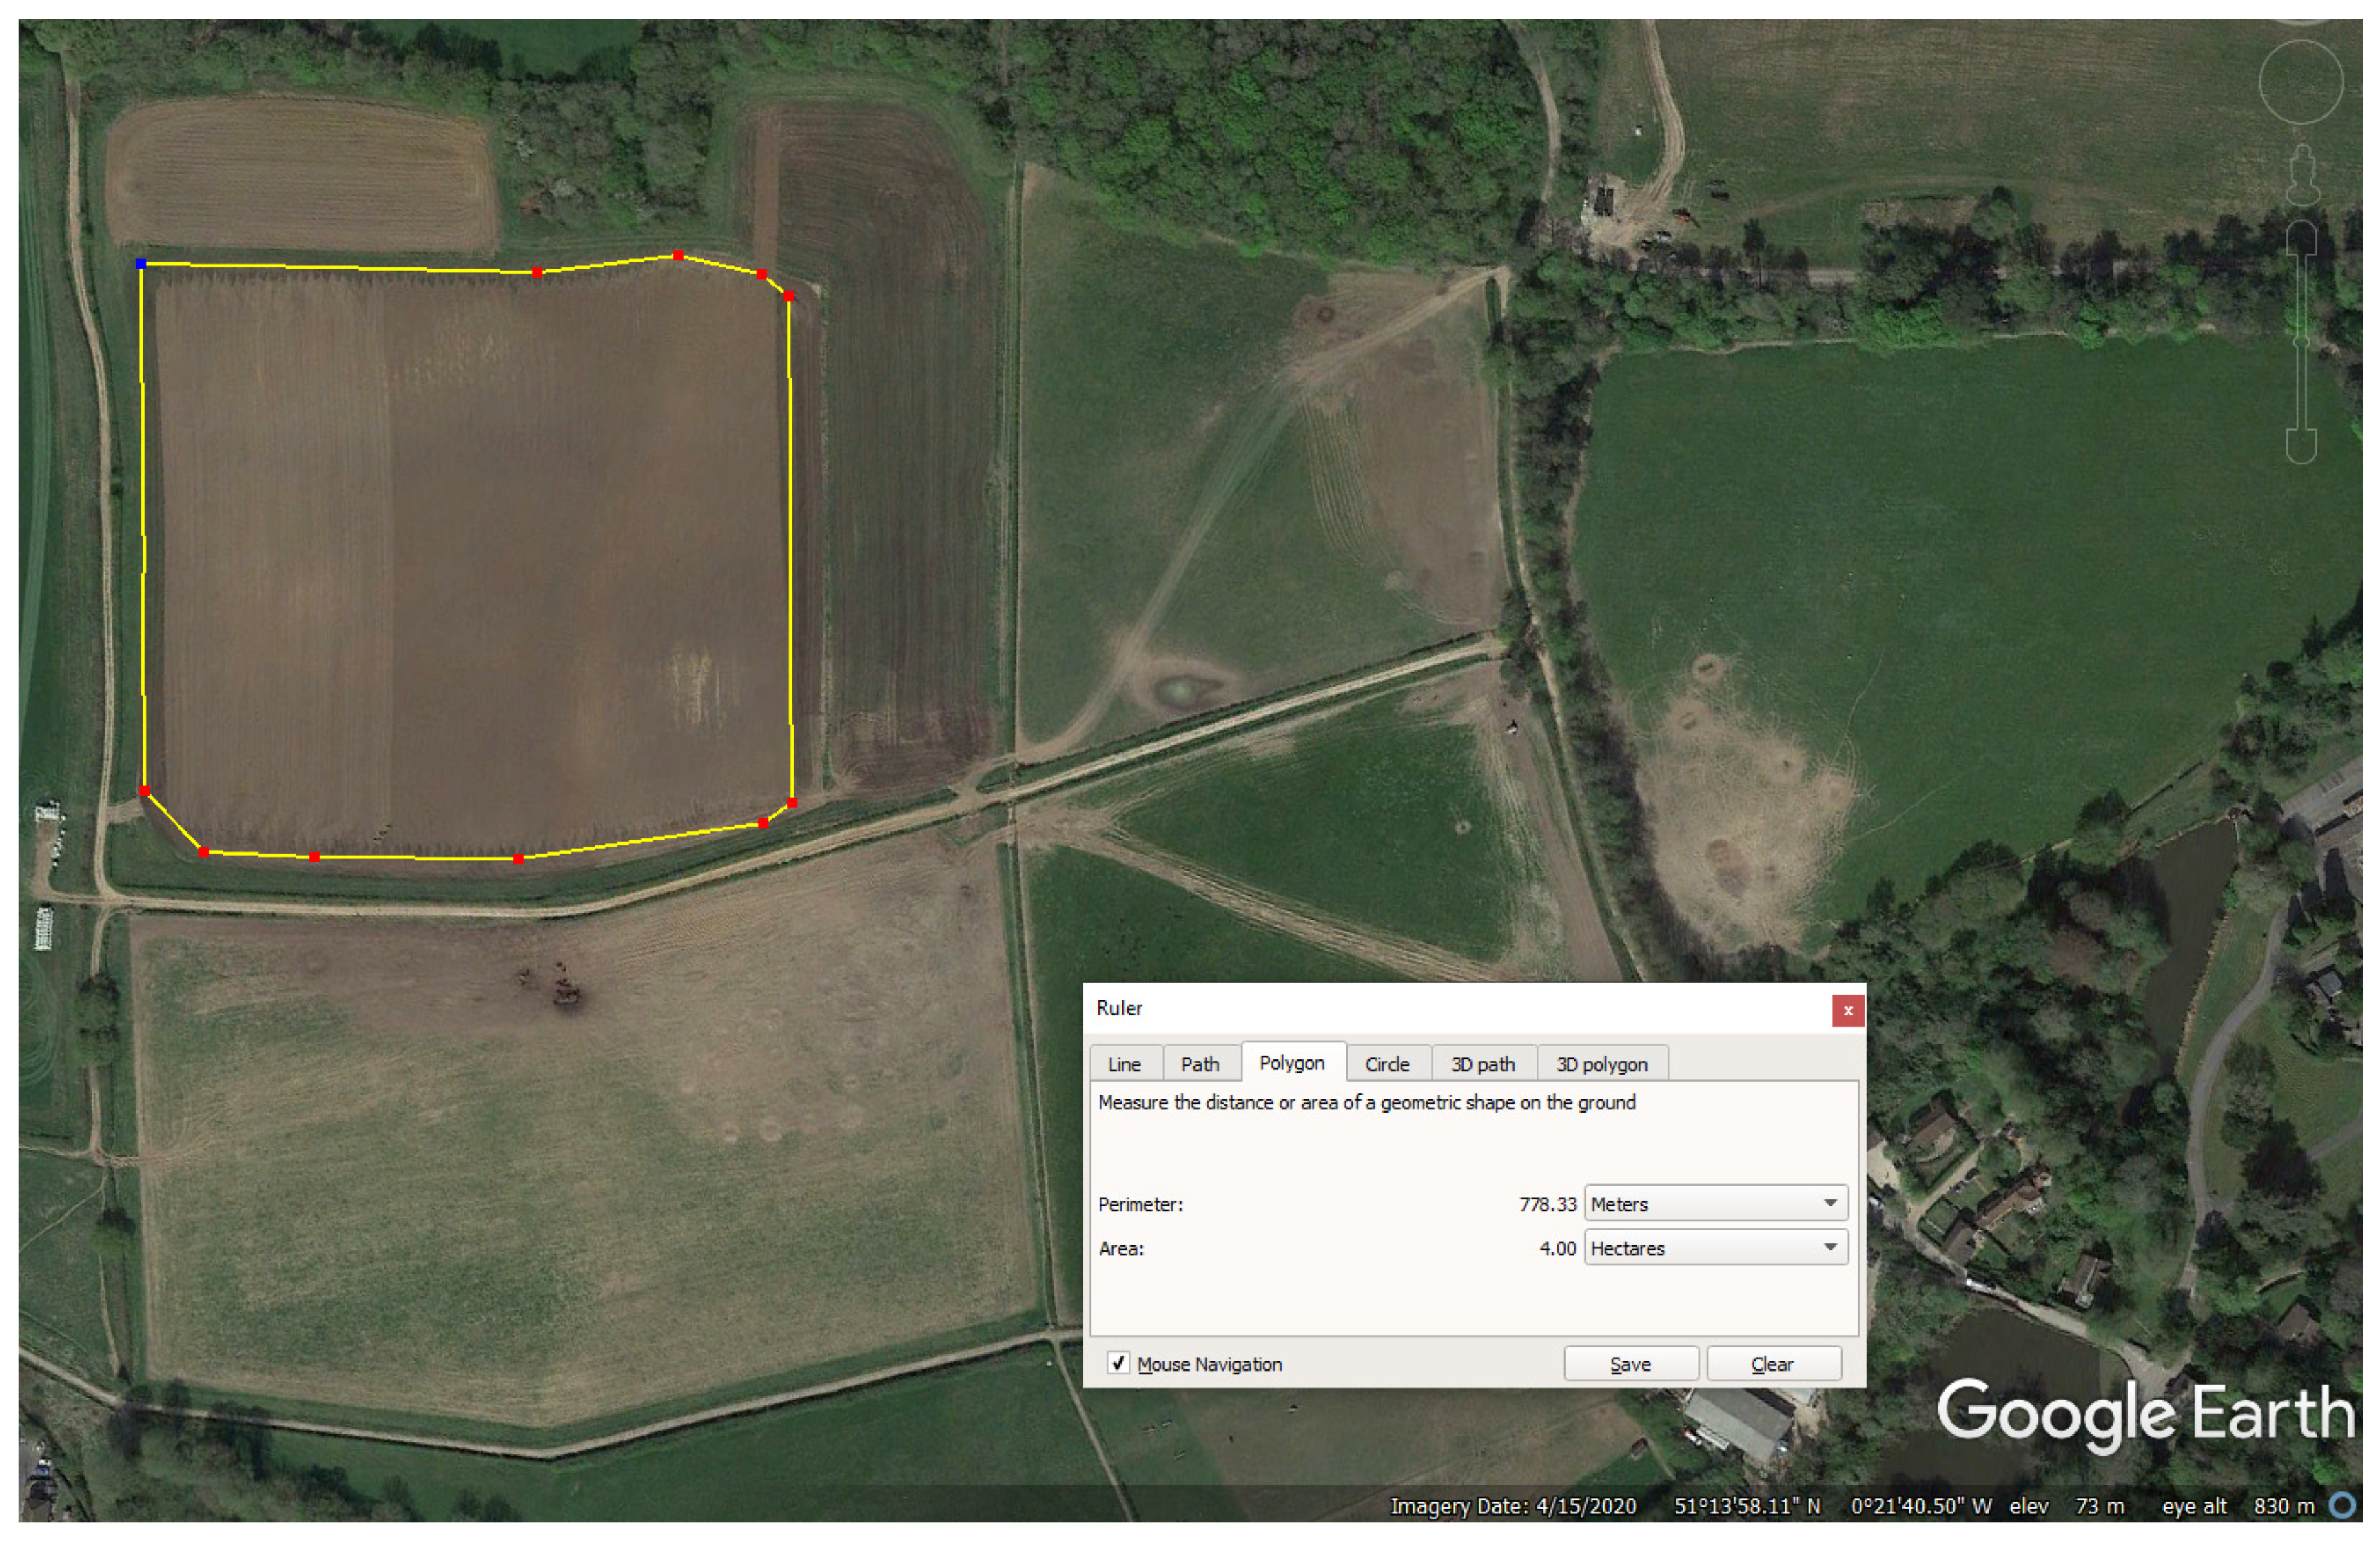
For the selected 4 ha reference site (Figure 1), we assumed that the land manager or ELM verification body would wish to obtain a map of SOC within the delimited field site. This would be obtained by propagating data from passive and active sensors on satellites or UAS platforms through a mathematical model that has been derived from in situ measurements, either from the field site or from existing libraries of in situ observations.
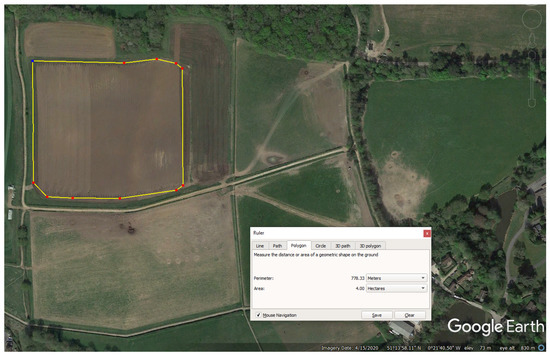
Figure 1.
Trial site for cost-accuracy analysis (source—Google Earth Pro).
We obtained the prices for satellite data supplied by Earth-i, a global space company that exploits commercial satellite imagery and cutting-edge artificial intelligence and machine learning techniques. In terms of Unmanned Aircraft Systems (UAS), we have used the cost analysis conducted by Aldana-Jague et al. [49] and the prices from ADAS, a commercial operator that provides services including digital data collection by UAS and aerial photography, use of software for data processing, and expertise for estimating SOC. For conventional laboratory tests for SOC analysis, we used pricing obtained from a leading UK soil analysis company (preferred to remain anonymous in this study).
3. Results
3.1. Literature Analysis of EO-Based Approaches for SOC Measurement
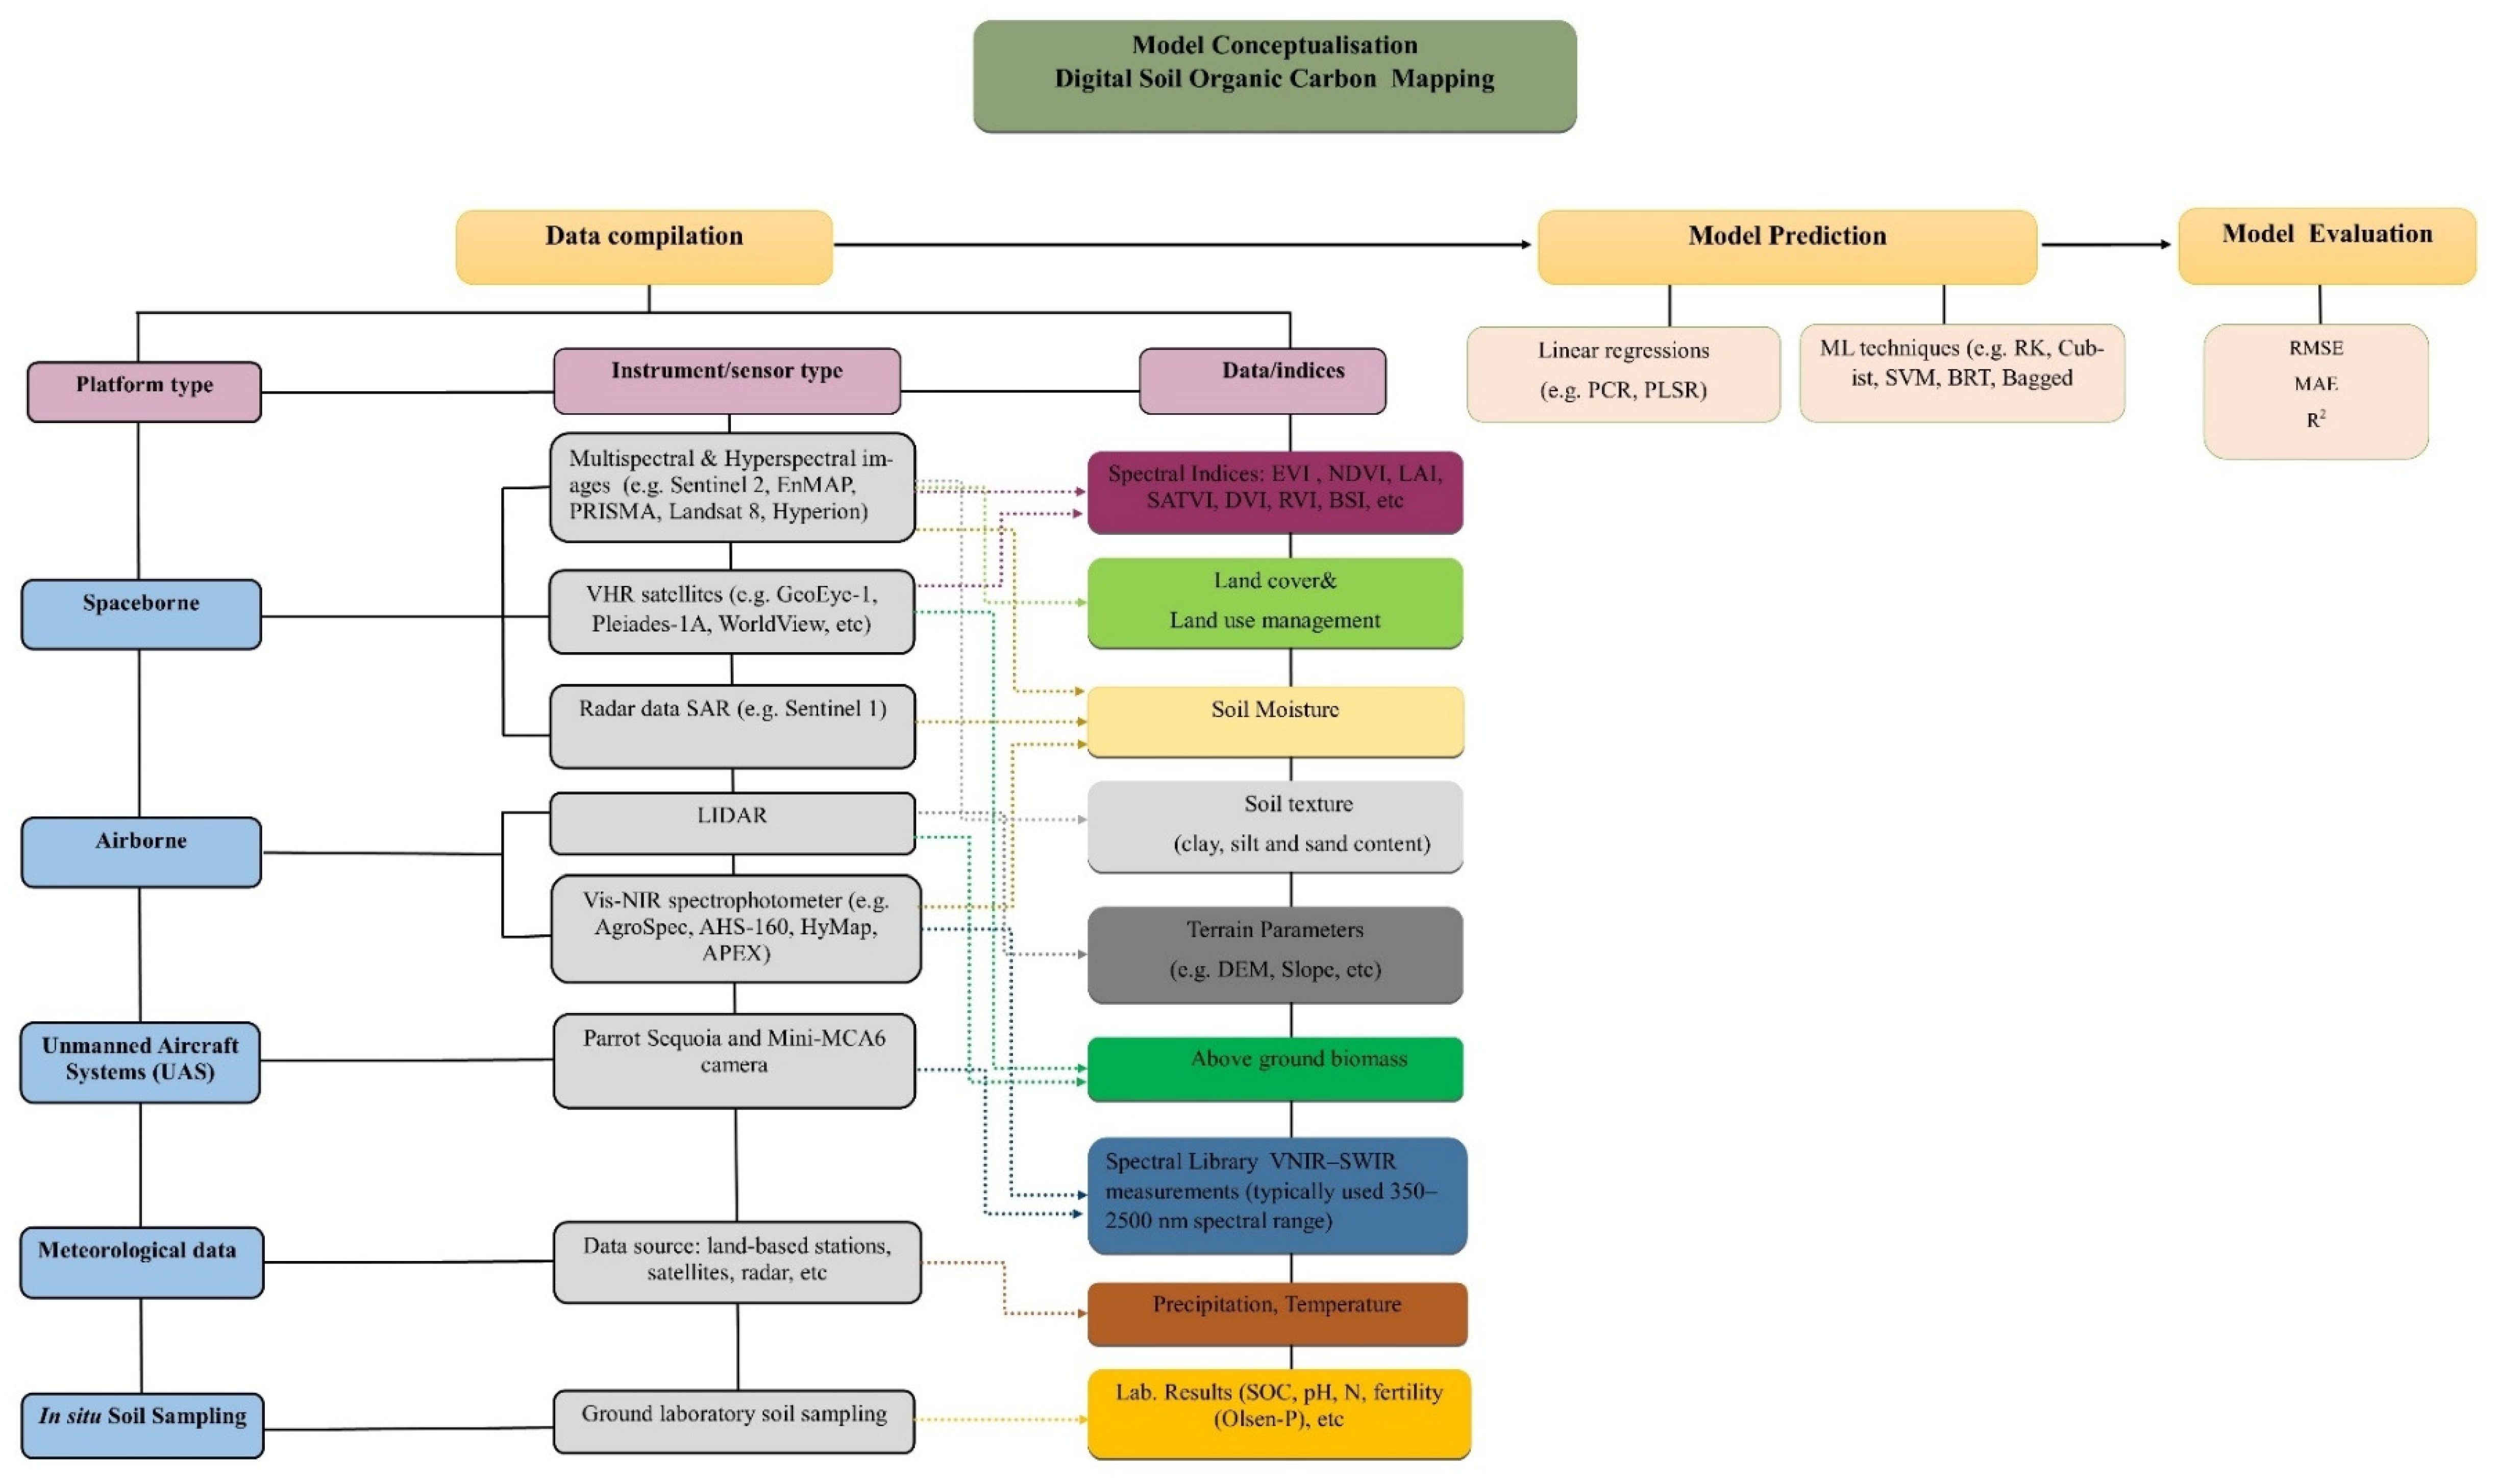
There are various studies in the literature which seek to assess how EO-based assessments of variables thought to be related to SOC (such as land cover and topography) relate to measures of SOC based on ground-level soil sampling. These variables (covariates) are used as inputs to a statistical model that is used to estimate SOC. It should be noted that the more traditional assessments using soil samples and laboratory analysis are deemed to be the best estimates of SOC. Figure 2 presents our synthesis of the main steps that appear in most literature reports and are needed for estimating SOC content from the field to the national scale.
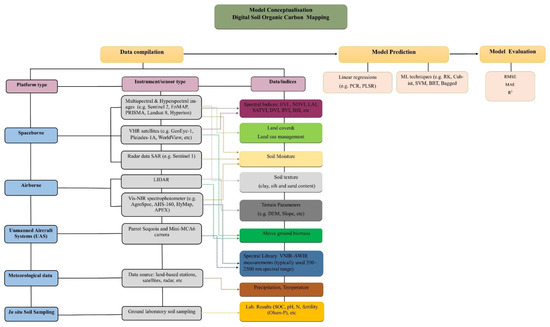
Figure 2.
A conceptual framework for digital mapping of SOC/SOM—based on literature review.
3.1.1. Selection of Environmental Variables (Covariates) and Data Compilation
Different methods use different covariates in developing SOC estimation models. Covariates used in methods described in the literature include land cover and land use maps (e.g. CEH Land cover 2015, CORINE), meteorological data (e.g. temperature, precipitation, evapotranspiration), vegetation index (e.g., spectral indices), terrain parameters (e.g., digital elevation model (DEM) and its derivates, slope degree (SD), aspect, depth of sinks (m) (DoS), compound topogrphic index (CTI), and profile curvature (PC)). As these different quantities are provided by data providers with different spatial resolutions and on different grids, data compilation requires the covariate dataset to be resampled to a common resolution.
The covariate data sets are collated from a wide variety of data sources. These data sources range from imagery obtained by passive or active sensors onboard remote sensing platforms (UASs, airborne and spaceborne), and meteorological data measured by land-based stations. Our literature review showed that the following are the most common EO data sources used in the development of SOC estimation models (note that some methods use a combination of data sources):
- Satellite multispectral (e.g., Sentinel 2, Landsat 8 OLI, Very High resolution (VHR) images) and hyperspectral (e.g., EnMAP, PRISMA, and HyspIRI) remote sensing reflectance images, and laboratory spectral measurements of soil samples [50,51];
- Spectral indices derived from multispectral images such as Normalized Difference Vegetation Index (NDVI) [52], Enhanced Vegetation Index (EVI) [50], Soil Adjusted Total Vegetation Index (SATVI) [53], Brightness Index (BI) and Greenness Index (GI) [52], Vegetation Temperature Condition Index (VTCI) [52,54,55], Ratio Vegetation Index (RVI) (also for aboveground biomass estimation) [56], soil moisture [57], and soil texture [58];
- Topographic data derived from active radar sensors such as SRTM, stereophotogrammetric images from ASTER [47], and LiDAR capable of providing a measure of elevation to derive topographic-based parameters such as slope, aspect, depth of sinks, etc. [59];
- VHR satellite data and LiDAR, which is used to estimate above-ground biomass by assessing tree composition and height, both of which are useful proxies in predicting SOC stock [60];
- Data derived from multispectral sensors mounted on UAS, for example, by combining hyperspectral and high-resolution images of bare soil to obtain libraries of soil spectral reflectance for training machine learning techniques [49,61,62]. The model development also relies on traditional laboratory SOC measurements taken from samples collected in the field.
3.1.2. SOC Model
The soil organic mapping approaches mentioned above adopt a wide variety of statistical techniques to relate SOC retrieved from soil samples (dependent variable) to the predictor variables (independent variables, e.g., spectral libraries/measurements, spectral indices, terrain parameters). A range of statistical and machine learning techniques have been applied to develop models to estimate SOC, and some had to accommodate the issue of co-linearity whereby a number of the independent variables could be related to each other. These techniques include principal component regression (PCR) and partial least square regression (PLSR) [37,38,43,44,51,63], regression-kriging (RK) [55], penalized-spline signal regression (PSR) [38], random forest (RF) [47,55,64,65], cubist (CB) [44,65,66], support vector machines (SVM) [38,42,47], boosted regression trees (BRT) and bagged CART [47], and convolutional neural networks (CNNs) [67].
This wide variety includes methods based on linear regression, where a linear relationship is assumed between soil properties and predictor variables, and more sophisticated machine learning (ML) techniques that can provide highly non-linear mapping and classification approaches. Since the relationship between soil properties and predictor variables is complex and nonlinear [68], these more sophisticated approaches can achieve higher accuracy in terms of matching the observed values of SOC and outperform more conventional methods [69].
3.1.3. Model Evaluation
The performances of the statistical models presented above are commonly tested under different calibration/training (model development) and validation (model evaluation) steps. In general, soil samples are divided into two sets that are randomly selected, one for calibration/training (70% to 80% of the available data) and the other for validation (20% to 30%) [44,52,55,60,65,68,70,71]. The calibration dataset is used to develop the model, including selecting the relevant covariates and deriving the model parameters. The evaluation dataset is used independently to assess the model performance [40]. To provide an additional degree of robustness to the validation, an n-fold cross-validation approach can be adopted. This approach builds on repeated train/test splits into the observed data, ensuring that each data point occurs at least once in the test set [72,73]. In addition, to repeat, training and testing subsets can also be subject to resampling techniques such as bootstrapping. This has been shown to be efficient in assessing accuracy (i.e., the ability to correctly predict observed values of SOC based on field measurements) when a small data set is available [60].
The error metrics often used to compare these models to the validation datasets are the root mean square error (RMSE), the mean absolute error (MAE), and the mean error (ME). These metrics all represent different information associated with the differences between the model predicted values and the observed values from the reference (usually in situ) data set. These are all given in the same units as the measurement, here as g/kg−1 org/kg. The ME is the simple mean of all such differences and can be positive or negative. For unbiased results, it will take the value 0; some of the more sophisticated results can give a ME that is different from 0. The MAE is the mean of the unsigned differences, and the RMSE gives the standard deviation. All of these metrics must be interpreted with respect to the amount of SOC measured. The coefficient of determination, R2, is, in contrast, a relative, normalised quantity and the proportion or percentage of variation explained by each model. The R2 is commonly reported in regression studies and provides a measure of the ability of the model to predict the dependent variable but fails to provide information on the model error and bias. An R2 close to 1 alongside lower values of RMSE, MAE, and, where relevant, ME, together provide more information on model quality. Much depends, of course, on the quality of the data used in the statistical analysis. All of these methods rely on being able to calculate an error based on a reliable in situ data set that is representative of the region observed by remote sensing methods and do not account for uncertainties associated with those measurements or site variability and other representation uncertainties. None, particularly quoted without context, can be considered a pure “accuracy”.
3.1.4. Summary of Methods
Several of the above studies and their claimed ‘accuracy metrics’ are summarized in Table 4. It should be noted here that ‘accuracy’ in this context is defined in terms of how well the statistical model is able to predict the observed measures of SOC based on field samples (dependent variable). The table includes values of the ‘accuracy metrics’ for the model development and model evaluation phases of the analysis. The accuracy metrics quoted may not represent the full model accuracy for the reasons given above and do not necessarily apply when the method is extrapolated to new areas. The study that obtained the best set of accuracy metrics in predicting SOC was performed at a single-field scale and used very high spatial resolution (12 cm) and multispectral (6 bands) reflectance data from a UAS that was processed with a non-linear machine learning regression trained with samples from the same site. This method achieved an R2 value of 0.98 in calibration (spread of calibration points) and R2 = 0.95 in validation [49]. The studies with a poorer set of ‘accuracy metrics’ used free satellite data (e.g., Sentinel 1 & 2, Landsat, etc.) and covered much broader areas, with less detailed in situ data and more natural variability. High-resolution studies are generally limited to small areas due to UAS flight duration for covering large areas and legal barriers to initiate flights, and it is significantly more expensive to do such detailed campaigns. Free satellite data can be used to cover a much broader area and provide information for national and transnational studies.
Table 4.
Example studies for digital soil mapping (SOC estimation) that used remote sensing techniques.
3.2. Expert Interviews
This section presents the three main themes that emerged from the analysis of the interviews. The key concerns and suggestions (KCS) associated with these themes are presented in Table 5, Table 6 and Table 7, together with the most relevant quotes from the respondents (with the respondent number indicated as Rx).
Table 5.
Theme 1: SOC/SOM within agricultural policy.
Table 6.
Theme 2: EO for SOC and its level of accuracy.
Table 7.
Theme 3: Designing a MRV SOC framework.
3.2.1. Theme 1: SOC/SOM within Agricultural Policy
SOC was discussed by most respondents as being a critical component in soil science and soil quality, alongside other soil properties (Table 5: KCS 1.1 recognised by 77% of respondents). In addition, many participants considered that soil health has been moved up the political agenda after initiatives such as ‘4 per 1000’ and the UN SDGs increased awareness at the global scale (Table 5: KCS 1.2, 55% of respondents). In 2018, the UK Environment Secretary and Farming Minister both promised to put soil health at the heart of the 25 Year Environment Plan, emphasising the UK Government’s ambition to improve the approach to soil management and restating the commitment to all of the UK’s soils being managed sustainably by 2030 (Table 5: KCS 1.3, 46% of respondents).
Likewise, some respondents (Table 5: KCS 1.4, 23% of respondents) also raised the crucial role of tackling pressures (e.g., climate change, different agricultural practices, drainage schemes, intensive sheep grazing, etc.) on the land in the long term as important additional factors affecting SOC.
Interestingly, some respondents noted (Table 5: KCS 1.5–1.7, 38%, 31%, and 25%, respectively) that SOC has been neglected so far in the UK policy framework, with this coming from two different perspectives. The one coming from soil scientists was that, due to a lack of interest and knowledge, policymakers have postponed addressing soil health for far too long because priority was given to maximising the production of cheap food. For policymakers, the explanation for a lack of focus on SOC, as well as soil health, was perceived to be due to a lack of resources, rather than from any intentional avoidance of integrating SOC into policy.
3.2.2. Theme 2: EO for SOC and Its Level of Accuracy
In this theme, the main concerns and suggestions that refer to the potential that EO technology could have to monitor SOC and the level of accuracy that would be needed are presented in Table 6. It needs to be noted here that ‘accuracy’ in the context of the interviews was interpreted in terms of how often the results from an EO-based assessment match those obtained via the ‘traditional’ methodology of taking field samples and using laboratory analysis. The highest level of consensus from respondents (77% of respondents) was KCS 2.1 and 2.2—providing strong support for EO being relevant and valuable for recognising different land use, agricultural practices, etc., and the linkage of these characteristics with SOC. An advantage for EO approaches was acknowledged to be their ability to estimate SOC stock over large spatial scales using proxies such as vegetation indices, slope degree, precipitation, temperature, etc. About half of the respondents (54%) noted that a direct determination of SOC from EO requires bare soil and that the spectral signatures derived from EO imagery can be constrained by cloud coverage (KCS 2.3). In addition, there was a strong consensus that EO could be useful for estimating the overall stock of SOC but did not have the consistency and accuracy required to detect its detailed change over time (KCS 2.4).
Interestingly, more than half of the respondents noted that EO could provide a cost-effective alternative to the use of field measurements (KCS 2.5). It should be remembered, however, that most respondents indicated that they did not consider that EO-based imagery could provide a sufficiently accurate estimation of SOC directly, and, by inference, this cost-effectiveness refers to the value of EO in providing complementary data supporting SOC determinations. Concerning the accuracy requirement for SOC estimations by EO, it was clear that an accuracy of >90% was seen as a requirement by nearly 70% of respondents. This means, for example, that out of 100 fields, the EO-based measurement would need to match (within uncertainties) the assessments of SOC obtained via traditional methods for at least 90 fields. Similarly, only 15% of respondents (2 out of 13) thought that an accuracy between 70% and 90% was ‘acceptable’, confirming a strong concern over the impacts of using potentially inaccurate assessments (KCS 2.6).
Most of the respondents recognised that methods solely utilising the current remote sensing technologies would not be capable of substituting direct field sampling methods. About one-third of respondents considered that multiple combinations of data types, e.g., remotely sensed, ground-truthing measurements, multispectral imaging (derived from UAS), LiDAR, citizen science, etc., all assimilated by machine learning, could significantly increase the accuracy (KCS 2.7). Furthermore, it was also noted that for mapping the state of SOC using remote sensing data, it would be possible to devise efficient sampling schemes to achieve a specified accuracy based on the analysis of a number of ground-based samples with associated analyses (e.g., machine learning, regressions), thus reducing current physical survey costs.
3.2.3. Theme 3: Criteria for the Design of an MRV Framework for SOC
The third theme of measurement/monitoring, reporting, and verification (MRV) emerged from the analysis of the interviews. This extended beyond the previous two themes, which the semi-structured interviews were designed to explore with the respondents. The basis for the emergence of this MRV theme potentially relates to the goal ofLand Management (ELM) schemes to incentivise good soil management practices through the application of current technologies, enhancing the ability to deliver environmental benefits via improving or maintaining soil quality. Currently, most agri-environment schemes have to rely on limited national monitoring capabilities and a wider understanding of soil health and improved capability for its monitoring would be advantageous. Therefore, Table 7 provides seven criteria and associated quotes that resulted from the interviews.
A directness criterion (KCS 3.1) was mentioned by 85% of participants and refers to the ways that the SOC MRV system is comprised of direct measurements of SOC (field sampling) and indirect/proxy measures based on a spectral library and indices, topographic parameters, etc. (see Figure 2). A few respondents (38%) recognised that direct measurements should be first constructed on a universal protocol that should be consistent over all fields. Thus, respondents raised the importance of defining SOC metric standards as a criterion for a robust structured survey of soil sampling (KCS 3.2). About 77% of respondents considered scalability an important criterion to consider in designing a soil monitoring system. Scale plays a role as a driver for determining the accuracy of the methods. All participants admitted that the level of accuracy is a vital criterion to understand, and it would differ for different scales and data used. In terms of the variability in the SOC stock, many respondents (69%) recognised this as a challenge, mostly because SOC levels vary considerably across the same field and with soil depth (KCS 3.5). A consistency criterion was raised by 62% of the respondents through two different perspectives, one in terms of the standardization of the in situ soil sampling and the other in the methods used that are closely linked to scalability (KCS 3.6). Finally, more than half of the respondents (54%) consider that satellite and other technologies could enhance the cost-effectiveness as a criterion for a national monitoring system of SOC (KCS 3.7).
3.3. Cost-Accuracy Analysis
To evaluate the cost-accuracy of using different approaches to estimate SOC across our 4 ha (0.04 km2) site, we combined information about the cost of obtaining and analysing different data sources (Table 8) for different methods (Table 9).
Table 8.
Methods of measuring SOC—reference costs for different data sources.
Table 9.
Calculation based on the prices provided in Table 8 for 4 ha.
In Table 8, different types of data are presented that could be used to estimate SOC, including multispectral VHR satellite data, high- and medium-resolution satellite imagery, UAS-based imagery, and the laboratory analysis of soil samples collected from each site.
Table 9 provides the approaches selected from the literature that can be applied to the defined 4 ha study field to estimate SOC from some combination of the data sources given in Table 8. For each approach, the cost and accuracy are considered.
Žížala et al. [65] used free (medium resolution) and commercial (VHR) satellite data, along with UAS and in situ sampling to develop a bespoke model for the trial site. For this approach, the total cost for measuring SOC for our trial site would be between EUR 750 and EUR 1000 (number of samples scaled from their larger site to our smaller site) with an R2 = 0.81. Zhou et al. [47] used only free satellite data trained to a general European model (from the free LUCAS dataset), and here, the cost is extremely low at EUR 0.35 for 4 ha (price only for the processing and interpreting the dataset), obtaining an R2 = 0.44 for their model fit. Aldana-Jague et al. [49] used UAS reflectance spectroscopy and a model trained on 30 reference samples from the field site. Including sample collection and processing, image acquisition, processing, and analysis costs, they estimated the total cost to be between EUR 160 and EUR 400 per ha, hence, for a 4-ha field, the cost would be between EUR 600 and EUR 1600, with an R2 = 0.98. Their price considers the initial investment costs for purchasing a UAS, a multispectral camera, and software (estimated at circa EUR 25,000). Commercial operators charge approximately EUR 600–EUR 950 for services based on UAS imagery, where includes UAS and aerial photography for digital data collection, processing, and manipulation.
For comparison, the Gehl and Rice [27] approach is given for sample collection and laboratory analysis only. The range of prices depends on the types of laboratory tests performed to quantify SOC, the different methods include the Walkley–Black (WB) method, mass loss on ignition (LOI), automated dry combustion (ADC), and humic matter (HM). The most accurate standard laboratory test for soil carbon is ADC and is often cheaper than other tests [75]. Consequently, the laboratory price list for ADC is presented in Table 8, and the price has been applied on the 4-ha field (Table 9). According to Vanguelova et al. [30], the ideal number of samples is between 4 and a maximum of 25 samples per 0.25-ha plot, thus, for our trial site, the total cost could be between EUR 90 and EUR 600, for a sampling range between 6 and 42.
These hypothetical estimations are made recognising several limitations. The only accuracy metric given is the R2, which is only one of the metrics of model fit, which may underestimate the uncertainty, and the costs are based on limited information. Likewise, for using UASs, there are two options available, to hire or to purchase, both of which have benefits and drawbacks.
4. Discussion
This paper has evaluated the potential contribution that EO technology could provide for SOC estimation. We have collated input from experts in soil science and agri-environment policymaking to identify key concerns and opportunities in this domain. In particular, the inclusion of expert opinion delivers a unique degree of insight on the acceptable level of accuracy that an EO-based soil MRV system would need to achieve to be appropriate for policy implementation. It is noteworthy that all respondents mentioned the benefit of such a study as an important input to the current DEFRA ELM scheme for developing a UK national soil MRV system.
According to the literature, EO imagery combined with ML techniques trained on soil samples representative of the location of interest can provide valuable information on the state of soils and SOC estimations in a given location. Such analysis involves the selection of variables (covariates), data compilation, model development, model evaluation, and model application. Similarly, interviewees discussed the potential of EO technology to estimate SOC, which they recognised relied on indirect measurements (proxies/covariates) and a derived model based on simple or more complex machine learning. The respondents were concerned about the use of EO technology and emphasised that it would have to be highly accurate (>90%) to allow fair payments if this was the basis of an MRV system. The meaning of ‘accuracy’ in this context was expressed mostly in terms of how well the EO-based assessments match (as far as practical) those assessments of SOC based on more traditional methods, although the meaning of this ‘accuracy’ is not universally defined.
The main advantages of using EO technologies have been highlighted in many studies. Our respondents described the advantages in the gathering of information on SOC over large and/or inaccessible areas, provision of information at different spatial and temporal resolutions, use of low-cost or free data, and cost-effective assessments. However, they also considered it of equal importance that the higher accuracy EO-based methods generally came at a higher cost.
Several substantial unanswered questions remain over how feasible current remote sensing methods are for estimating SOC and the levels of accuracy (i.e., how well the models predict observed values of SOC obtained via field measurement) that can be achieved, the amount of cross-validation or sampling that might be needed to assure such accuracy and, ultimately, what level of accuracy is required for SOC determinations for policy and decision making in support of sustainable SOC management. Our analysis has also discussed that there is a need to find a consistent definition of ‘accuracy’ that goes beyond simple metrics such as , which can only ever describe how well models fit data, and not model biases or reference (in situ) data uncertainties. Other drawbacks noted in the use of EO-based data are that such methods are limited by cloud cover (for optical satellite sensors) and can only estimate SOC for the thin top layer of bare soil, while some agricultural practices that can increase SOC (cover of perennial rotation cropping, no-till planting in rotation) increase soil cover and thus compromise the window of bare soil. In addition, UAS have limited flight duration and hence spatial coverage.
It appears to be quite widely assumed that EO technology can be a cost-efficient tool in monitoring SOC. However, few studies have performed a cost-effectiveness analysis to test this assumption. Therefore, to address Andries et al.’s [48] recommendation that cost-effectiveness is an important component when assessing the maturity of EO technologies for providing data for the indicators of sustainable development, we performed a hypothetical cost-accuracy analysis on different literature approaches for SOC estimation on a 4-ha field using a combination of EO methods. We observed that the integration of data from satellite and airborne sensors with data from ground-based measurements represented a reasonable, current approach for prediction for SOC stocks at the field scale with an R2 = 0.81 at a cost range of EUR 750 to EUR 1000. Relying on free satellite data (e.g., Sentinel-2) as a proxy for estimating SOC at the national and regional scale is much lower cost (equivalent to ~EUR 0.35 for the same area) but produces lower repeatability, with R2 = 0.32–0.44. (Again, we note that provides only part of the information necessary to understand ‘accuracy’.)
The importance of EO technologies as a reliable source of data for monitoring and reporting carbon stocks at a global scale within the context of the UN SDGs have been explored by the Global Soil Partnership (GSP) and its Intergovernmental Technical Panel on Soils (ITPS), which launched the Global Soil Organic Carbon GSOCMap [7]. The GSOCMap helps monitor and report on the carbon stock aspect of SDG indicator 15.3.1 (“Proportion of land that is degraded over the total land area, with three sub-indicators capturing trends in land cover, land productivity, and carbon stocks”).
At national scales, several countries are attempting to make efforts to respond with initiatives such as ‘4 per 1000′. In the UK, the 25 Year Environment Plan aims for all of the UK’s soils to be managed sustainably by 2030. To achieve this, the ELM scheme aims to update guidance for farmers, invest in developing a monitoring system and metrics for soil health, and deliver research to better understand how soil health supports wider environmental goals [76].
The suggestions of many of the respondents in this research informed the design we propose in Figure 3 for an MRV framework for SOC which could underpin policies supporting sustainable soils management. As is clear from our respondents, an MRV system should be robust, consistent, transparent, and accurate. It needs to rely on appropriate data, quality assurance and robust evaluation of the accuracy of the data, and collaboration with farmer communities and trained staff. With respect to linking MRV to fair payments, there are also requirements for defining clear SOC metrics and consistency in the SOC measurement approaches. Hence, Figure 3 presents the main three aspects of the framework as follows:
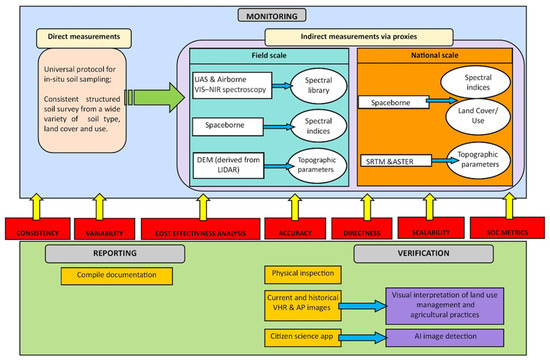
Figure 3.
A framework for the measurement/monitoring, reporting, and verification (MRV) of SOC.
- Monitoring—Direct measurements through in situ soil sampling using a universal protocol and indirect measurements via proxies (e.g., UAS, airborne and satellite data). The measurements and estimation should determine the state and change of the SOC level. Key criteria to be considered should be consistency in soil sampling, high variability of the SOC, cost accuracy analysis, clear SOC metrics (that would be nationally/internationally recognised), and the scalability of the approach.
- Reporting—Documents to inform all relevant stakeholders, including information on the methodologies, assumptions, and data.
- Verification—A series of procedures for checking and verifying the quality of monitoring and reporting. Verification could be achieved through physical field inspections, independent remote sensing analysis, and/or smartphone apps (similar to BGS MySoil app [77] or Soilmentor [78]). Evidence suggests that there is a large potential for increasing carbon storage in agricultural soils through changes in land use management and agricultural practices. The importance of this SOC storage and the potential for land managers to receive incentives for its enhancement suggests that VHR satellite data could well provide an economically viable, cost-effective tool for the verification stage. According to the UK National Audit Office (2019), the Rural Payments Agency (RPA), which pays subsidies to farmers (part of the Common Agricultural Policy-Basic Payments scheme), has increased remote inspections by 75% using satellite data with an operational cost saving of up to GBP 2.1 million per year [79]. Similar evidence has been shown in Ireland, which suggests that the average cost of a physical inspection in 2010 was EUR 1800 compared with EUR 60–EUR 70 for a remote sensing check [80].
Overall, our research suggests that R&D to date has developed models at the field scale that, with appropriate in situ training data, can come close to the ‘accuracy’ expectations for policy when these are compared to results those obtained via traditional field assessment which employs sampling and laboratory analysis.
In effect, ‘accuracy’ within a land management context is about ‘getting it right’, with ‘right’ being what is gleaned from field measurement that can itself generate variable results based on methods of sampling and laboratory analysis that were employed. A desired ‘accuracy’ of 80% expressed by the respondents for EO methods appears well within reach at present, albeit for more expensive analyses. These are encouraging findings and suggest that only a small gap remains to be bridged between utility for policy and the accuracy/reliability available from EO-based SOC assessments at field scale. At regional and national scales, the accuracy of SOC assessments will likely remain limited for some time due to SOC determinations at these scales by EO-based methods being constrained by reliance upon free and lower spectral and spatial resolution EO imagery.
5. Conclusions
This research has led to the following conclusions:
- Satellite- and UAS-derived data provide unique capabilities for addressing current challenges in the MRV of SOC, at all scales;
- Well-established training datasets along with advances in machine learning are likely to increase the overall accuracy of SOC prediction models, especially when complemented by soil spectral libraries based on soil sampling;
- A more robust analysis of uncertainties associated with both EO derived data and in-situ measurements are required;
- Integration of UASs should be considered at farm scale as being the most cost-accurate approach, whereas free satellite data would be more appropriate to be used at the national scale but with lower accuracy;
- We propose a framework for the MRV of SOC, which includes direct measurements via a combination of in situ soil sampling and indirect measurements through EO.
Author Contributions
Conceptualization, A.A., S.M., R.J.M. and J.L.; methodology, A.A., S.M., R.J.M., E.R.W. and J.L.; software, A.A.; validation, A.A., S.M., R.J.M., E.R.W., B.M. and J.L.; formal analysis, A.A.; investigation, A.A.; resources, A.A., S.M., R.J.M., B.M. and J.L.; data curation, A.A. and B.M.; writing—original draft preparation, A.A.; writing—review and editing, A.A., S.M., R.J.M., E.R.W., B.M. and J.L., visualization, A.A.; supervision, S.M., R.J.M., E.R.W. and J.L.; project administration, R.J.M.; funding acquisition, S.M., R.J.M. and E.R.W. All authors have read and agreed to the published version of the manuscript.
Funding
This research was funded by the Natural Environment Research Council (NERC) SCENARIO Doctoral Training Partnership, Grant/Award NE/L002566/1, CASE award partner the National Physical Laboratory (NPL) and by UKRI/Research England SPF funding via the University of Surrey. The APC was funded by the University of Surrey.
Institutional Review Board Statement
Not applicable.
Informed Consent Statement
Not applicable.
Data Availability Statement
Not applicable.
Acknowledgments
This research was supported by the SCENARIO Doctoral Training Partnership of the UK Natural Environment Research Council (NERC), with PhD funding for the first author. We thank the National Physical Laboratory (NPL) for their contribution and co-funding as the CASE award partner. We also would like to thank the University of Surrey SPF UKRI/Research England support for AA for her secondment “Earth Observation for Advanced Monitoring, Reporting and Verification for Environmental Land Management (ELM) policy in the Surrey Hills Area of Outstanding Natural Beauty (SH-AONB)” to conduct this research with the SH-AONB Defra Test and Trial. The contribution of all expert interview respondents to the research is gratefully acknowledged.
Conflicts of Interest
The authors declare no conflict of interest.
References
- FAO. Measuring and Modelling Soil Carbon Stocks and Stock Changes in Livestock Production Systems—Guidelines for Assessment. Version 1—Advanced Copy; FAO: Rome, Italy, 2019; p. 152. [Google Scholar]
- Jobbagy, E.G.; Jackson, R.B. The Vertical Distribution of Soil Organic Carbon and Its Relation to Climate and Vegetation. Ecol. Appl. 2000, 10, 423–436. [Google Scholar] [CrossRef]
- Batjes, N.H. Total carbon and nitrogen in the soils of the world. Eur. J. Soil Sci. 1996, 47, 151–163. [Google Scholar] [CrossRef]
- Lal, R. Soil Carbon Sequestration Impacts on Global Climate Change and Food Security. Science 2004, 304, 1623–1627. [Google Scholar] [CrossRef] [PubMed] [Green Version]
- ITPS. Status of the World’s Soil Resources (SWSR)—Main Report; Food and Agriculture Organization of the United Nations and Intergovernmental Technical Panel on Soils: Rome, Italy, 2015. [Google Scholar]
- House of Commons Environmental Audit Committee. Soil Health: Government Response to the Committee’s First Report of Session 2016–2017. Available online: http://www.publications.parliament.uk/pa/cm201617/cmselect/cmenvaud/650/650.pdf (accessed on 12 August 2021).
- GSOCMap. Available online: http://54.229.242.119/GSOCmap/ (accessed on 13 August 2021).
- Lal, R.; Bouma, J.; Brevik, E.; Dawson, L.; Field, D.J.; Glaser, B.; Hatano, R.; Hartemink, A.E.; Kosaki, T.; Lascelles, B.; et al. Soils and sustainable development goals of the United Nations: An International Union of Soil Sciences perspective. Geoderma Reg. 2021, 25, e00398. [Google Scholar] [CrossRef]
- Government, H. A Green Future: Our 25 Year Plan to Improve the Environment. Available online: https://assets.publishing.service.gov.uk/government/uploads/system/uploads/attachment_data/file/693158/25-year-environment-plan.pdf (accessed on 12 August 2021).
- Smith, P.; Chapman, S.J.; Scott, W.A.; Black, H.I.J.; Wattenbach, M.; Milne, R.; Campbell, C.D.; Lilly, A.; Ostle, N.; Levy, P.E.; et al. Climate change cannot be entirely responsible for soil carbon loss observed in England and Wales, 1978–2003. Glob. Chang. Biol. 2007, 13, 2605–2609. [Google Scholar] [CrossRef]
- Lal, R. Digging deeper: A holistic perspective of factors affecting soil organic carbon sequestration in agroecosystems. Glob. Chang. Biol. 2018, 24, 3285–3301. [Google Scholar] [CrossRef] [PubMed]
- Sykes, A.J.; Macleod, M.; Eory, V.; Rees, R.M.; Payen, F.; Myrgiotis, V.; Williams, M.; Sohi, S.; Hillier, J.; Moran, D.; et al. Characterising the biophysical, economic and social impacts of soil carbon sequestration as a greenhouse gas removal technology. Glob. Chang. Biol. 2020, 26, 1085–1108. [Google Scholar] [CrossRef] [PubMed] [Green Version]
- Zomer, R.J.; Bossio, D.A.; Sommer, R.; Verchot, L.V. Global Sequestration Potential of Increased Organic Carbon in Cropland Soils. Sci. Rep. 2017, 7, 15554. [Google Scholar] [CrossRef] [PubMed] [Green Version]
- Bellamy, P.; Loveland, P.J.; Bradley, R.I.; Lark, R.; Kirk, G. Carbon losses from all soils across England and Wales 1978–2003. Nat. Cell Biol. 2005, 437, 245–248. [Google Scholar] [CrossRef] [PubMed] [Green Version]
- Carey, P.D.; Wallis, S.; Emmett, B.A.; Maskell, L.C.; Murphy, J.; Norton, L.R.; Simpson, I.C.; Smart, S.M. Countryside Survey: UK Headline Messages from 2007; NERC/Centre for Ecology & Hydrology CEH Project Number: C03259; NERC: Wallingford, UK, 2008; p. 30. [Google Scholar]
- Emmett, B.A.; Reynolds, B.; Chamberlain, P.M.; Rowe, E.; Spurgeon, D.; Brittain, S.A.; Frogbrook, Z.; Hughes, S.; Lawlor, A.J.; Poskitt, J.; et al. Countryside Survey: Soils Report from 2007; Technical Report No. 9/07 NERC/Centre for Ecology & Hydrology CEH Project Number: C03259; NERC: Wallingford, UK, 2010; p. 192. [Google Scholar]
- Norton, L.; Maskell, L.; Smart, S.; Dunbar, M.; Emmett, B.; Carey, P.; Williams, P.; Crowe, A.; Chandler, K.; Scott, W.; et al. Measuring stock and change in the GB countryside for policy—Key findings and developments from the Countryside Survey 2007 field survey. J. Environ. Manag. 2012, 113, 117–127. [Google Scholar] [CrossRef] [Green Version]
- Reynolds, B.; Chamberlain, P.; Poskitt, J.; Woods, C.; Scott, W.; Rowe, E.; Robinson, D.; Frogbrook, Z.; Keith, A.; Henrys, P.; et al. Countryside Survey: National “Soil Change” 1978–2007 for Topsoils in Great Britain-Acidity, Carbon, and Total Nitrogen Status. Vadose Zone J. 2013, 12, 1–15. [Google Scholar] [CrossRef] [Green Version]
- Kirk, G.J.D.; Bellamy, P.H. Analysis of changes in organic carbon in mineral soils across England and Wales using a simple single-pool model. Eur. J. Soil Sci. 2010, 61, 406–411. [Google Scholar] [CrossRef]
- FAO. Available online: http://www.fao.org/geonetwork/srv/en/metadata.show?id=14116 (accessed on 13 August 2021).
- IUSS. Available online: https://www.iuss.org/soils-4-u/soil-data-and-information/ (accessed on 12 August 2021).
- ESDB. Available online: https://esdac.jrc.ec.europa.eu/resource-type/european-soil-database-soil-properties (accessed on 13 August 2021).
- LUCAS. Available online: http://eusoils.jrc.ec.europa.eu/library/esdac/index.html (accessed on 13 August 2021).
- NSI. Available online: http://www.landis.org.uk/data/nsi.cfm (accessed on 13 August 2021).
- CS. Available online: http://mapapps2.bgs.ac.uk/ukso/home.html (accessed on 13 August 2021).
- UKSoil_Observatory. Available online: http://www.ukso.org/static-maps/community-soil-property-observations.html (accessed on 13 August 2021).
- Gehl, R.J.; Rice, C.W. Emerging technologies for in situ measurement of soil carbon. Clim. Chang. 2006, 80, 43–54. [Google Scholar] [CrossRef]
- Smith, P.; Soussana, J.; Angers, D.; Schipper, L.; Chenu, C.; Rasse, D.P.; Batjes, N.H.; van Egmond, F.; McNeill, S.; Kuhnert, M.; et al. How to measure, report and verify soil carbon change to realize the potential of soil carbon sequestration for atmospheric greenhouse gas removal. Glob. Chang. Biol. 2020, 26, 219–241. [Google Scholar] [CrossRef] [Green Version]
- Garten, C.T., Jr.; Wullschleger, S.D. Soil Carbon Inventories under a Bioenergy Crop (Switchgrass): Measurement Limitations; Wiley Online Library: New York, NY, USA, 1999; pp. 47–2425. [Google Scholar]
- Vanguelova, E.; Bonifacio, E.; De Vos, B.; Hoosbeek, M.; Berger, T.; Vesterdal, L.; Armolaitis, K.; Celi, L.; Dinca, L.; Kjønaas, O. Sources of errors and uncertainties in the assessment of forest soil carbon stocks at different scales—Review and recommendations. Environ. Monit. Assess. 2016, 188, 1–24. [Google Scholar] [CrossRef] [PubMed]
- Minasny, B.; Malone, B.P.; McBratney, A.; Angers, D.A.; Arrouays, D.; Chambers, A.; Chaplot, V.; Chen, Z.-S.; Cheng, K.; Das, B.S.; et al. Soil carbon 4 per mille. Geoderma 2017, 292, 59–86. [Google Scholar] [CrossRef]
- Neumann, M.; Smith, P. Carbon uptake by European agricultural land is variable, and in many regions could be increased: Evidence from remote sensing, yield statistics and models of potential productivity. Sci. Total. Environ. 2018, 643, 902–911. [Google Scholar] [CrossRef] [PubMed] [Green Version]
- Chen, C.; Park, T.; Wang, X.; Piao, S.; Xu, B.; Chaturvedi, R.K.; Fuchs, R.; Brovkin, V.; Ciais, P.; Fensholt, R.; et al. China and India lead in greening of the world through land-use management. Nat. Sustain. 2019, 2, 122–129. [Google Scholar] [CrossRef]
- Smith, P. Land use change and soil organic carbon dynamics. Nutr. Cycl. Agroecosystems 2008, 81, 169–178. [Google Scholar] [CrossRef]
- Sims, N.C.; England, J.; Newnham, G.; Alexander, S.; Green, C.; Minelli, S.; Held, A. Developing good practice guidance for estimating land degradation in the context of the United Nations Sustainable Development Goals. Environ. Sci. Policy 2019, 92, 349–355. [Google Scholar] [CrossRef]
- Conant, R.T.; Ogle, S.; Paul, E.A.; Paustian, K. Measuring and monitoring soil organic carbon stocks in agricultural lands for climate mitigation. Front. Ecol. Environ. 2010, 9, 169–173. [Google Scholar] [CrossRef]
- Chen, F.; Kissel, D.E.; West, L.T.; Adkins, W. Field-Scale Mapping of Surface Soil Organic Carbon Using Remotely Sensed Imagery. Soil Sci. Soc. Am. J. 2000, 64, 746–753. [Google Scholar] [CrossRef] [Green Version]
- Stevens, A.; Udelhoven, T.; Denis, A.; Tychon, B.; Lioy, R.; Hoffmann, L.; van Wesemael, B. Measuring soil organic carbon in croplands at regional scale using airborne imaging spectroscopy. Geoderma 2010, 158, 32–45. [Google Scholar] [CrossRef]
- Nocita, M.; Stevens, A.; Noon, C.; van Wesemael, B. Prediction of soil organic carbon for different levels of soil moisture using Vis-NIR spectroscopy. Geoderma 2013, 199, 37–42. [Google Scholar] [CrossRef]
- Gholizadeh, A.; Borůvka, L.; Saberioon, M.; Vašát, R. Visible, Near-Infrared, and Mid-Infrared Spectroscopy Applications for Soil Assessment with Emphasis on Soil Organic Matter Content and Quality: State-of-the-Art and Key Issues. Appl. Spectrosc. 2013, 67, 1349–1362. [Google Scholar] [CrossRef] [PubMed]
- Peng, X.; Shi, T.; Song, A.; Chen, Y.; Gao, W. Estimating Soil Organic Carbon Using VIS/NIR Spectroscopy with SVMR and SPA Methods. Remote Sens. 2014, 6, 2699–2717. [Google Scholar] [CrossRef] [Green Version]
- Kuang, B.; Tekin, Y.; Mouazen, A.M. Comparison between artificial neural network and partial least squares for on-line visible and near infrared spectroscopy measurement of soil organic carbon, pH and clay content. Soil Tillage Res. 2015, 146, 243–252. [Google Scholar] [CrossRef]
- Vaudour, E.; Gilliot, J.M.; Bel, L.; Lefevre, J.; Chehdi, K. Regional prediction of soil organic carbon content over temperate croplands using visible near-infrared airborne hyperspectral imagery and synchronous field spectra. Int. J. Appl. Earth Obs. Geoinf. 2016, 49, 24–38. [Google Scholar] [CrossRef]
- Morellos, A.; Pantazi, X.-E.; Moshou, D.; Alexandridis, T.; Whetton, R.; Tziotzios, G.; Wiebensohn, J.; Bill, R.; Mouazen, A.M. Machine learning based prediction of soil total nitrogen, organic carbon and moisture content by using VIS-NIR spectroscopy. Biosyst. Eng. 2016, 152, 104–116. [Google Scholar] [CrossRef] [Green Version]
- Liu, Y.; Shi, Z.; Zhang, G.; Chen, Y.; Li, S.; Hong, Y.; Shi, T.; Wang, J.; Liu, Y. Application of Spectrally Derived Soil Type as Ancillary Data to Improve the Estimation of Soil Organic Carbon by Using the Chinese Soil Vis-NIR Spectral Library. Remote Sens. 2018, 10, 1747. [Google Scholar] [CrossRef] [Green Version]
- Mosleh, Z.; Salehi, M.H.; Jafari, A.; Borujeni, I.E.; Mehnatkesh, A. The effectiveness of digital soil mapping to predict soil properties over low-relief areas. Environ. Monit. Assess. 2016, 188, 195. [Google Scholar] [CrossRef] [PubMed]
- Zhou, T.; Geng, Y.; Chen, J.; Pan, J.; Haase, D.; Lausch, A. High-resolution digital mapping of soil organic carbon and soil total nitrogen using DEM derivatives, Sentinel-1 and Sentinel-2 data based on machine learning algorithms. Sci. Total. Environ. 2020, 729, 138244. [Google Scholar] [CrossRef] [PubMed]
- Andries, A.; Morse, S.; Murphy, R.J.; Lynch, J.; Woolliams, E.R. Seeing Sustainability from Space: Using Earth Observation Data to Populate the UN Sustainable Development Goal Indicators. Sustainability 2019, 11, 5062. [Google Scholar] [CrossRef] [Green Version]
- Aldana-Jague, E.; Heckrath, G.; Macdonald, A.; van Wesemael, B.; Van Oost, K. UAS-based soil carbon mapping using VIS-NIR (480–1000 nm) multi-spectral imaging: Potential and limitations. Geoderma 2016, 275, 55–66. [Google Scholar] [CrossRef]
- Peng, Y.; Xiong, X.; Adhikari, K.; Knadel, M.; Grunwald, S.; Greve, M.H. Modeling Soil Organic Carbon at Regional Scale by Combining Multi-Spectral Images with Laboratory Spectra. PLoS ONE 2015, 10, e0142295. [Google Scholar] [CrossRef] [Green Version]
- Castaldi, F.; Palombo, A.; Santini, F.; Pascucci, S.; Pignatti, S.; Casa, R. Evaluation of the potential of the current and forthcoming multispectral and hyperspectral imagers to estimate soil texture and organic carbon. Remote Sens. Environ. 2016, 179, 54–65. [Google Scholar] [CrossRef]
- Mondal, A.; Khare, D.; Kundu, S.; Mondal, S.; Mukherjee, S.; Mukhopadhyay, A. Spatial soil organic carbon (SOC) prediction by regression kriging using remote sensing data. Egypt. J. Remote Sens. Space Sci. 2017, 20, 61–70. [Google Scholar] [CrossRef] [Green Version]
- Gholizadeh, A.; Žižala, D.; Saberioon, M.; Borůvka, L. Soil organic carbon and texture retrieving and mapping using proximal, airborne and Sentinel-2 spectral imaging. Remote Sens. Environ. 2018, 218, 89–103. [Google Scholar] [CrossRef]
- Schillaci, C.; Lombardo, L.; Saia, S.; Fantappiè, M.; Maerker, M.; Acutis, M. Modelling the topsoil carbon stock of agricultural lands with the Stochastic Gradient Treeboost in a semi-arid Mediterranean region. Geoderma 2017, 286, 35–45. [Google Scholar] [CrossRef]
- Pouladi, N.; Møller, A.B.; Tabatabai, S.; Greve, M.H. Mapping soil organic matter contents at field level with Cubist, Random Forest and kriging. Geoderma 2019, 342, 85–92. [Google Scholar] [CrossRef]
- Clerici, N.; Rubiano, K.; Abd-Elrahman, A.; Hoestettler, J.M.P.; Escobedo, F.J. Estimating Aboveground Biomass and Carbon Stocks in Periurban Andean Secondary Forests Using Very High Resolution Imagery. Forests 2016, 7, 138. [Google Scholar] [CrossRef] [Green Version]
- Manns, H.R.; Berg, A.A.; Colliander, A. Soil organic carbon as a factor in passive microwave retrievals of soil water content over agricultural croplands. J. Hydrol. 2015, 528, 643–651. [Google Scholar] [CrossRef]
- Bousbih, S.; Zribi, M.; Pelletier, C.; Gorrab, A.; Lili-Chabaane, Z.; Baghdadi, N.; Ben Aissa, N.; Mougenot, B. Soil Texture Estimation Using Radar and Optical Data from Sentinel-1 and Sentinel-2. Remote Sens. 2019, 11, 1520. [Google Scholar] [CrossRef] [Green Version]
- Li, X.; Mccarty, G.W.; Du, L.; Lee, S. Use of Topographic Models for Mapping Soil Properties and Processes. Soil Syst. 2020, 4, 32. [Google Scholar] [CrossRef]
- Rasel, S.; Groen, T.; Hussin, Y.; Diti, I.J. Proxies for soil organic carbon derived from remote sensing. Int. J. Appl. Earth Obs. Geoinf. 2017, 59, 157–166. [Google Scholar] [CrossRef]
- Gomez, C.; Rossel, R.V.; McBratney, A. Soil organic carbon prediction by hyperspectral remote sensing and field vis-NIR spectroscopy: An Australian case study. Geoderma 2008, 146, 403–411. [Google Scholar] [CrossRef]
- Crucil, G.; Castaldi, F.; Aldana-Jague, E.; Van Wesemael, B.; Macdonald, A.; Van Oost, K. Assessing the Performance of UAS-Compatible Multispectral and Hyperspectral Sensors for Soil Organic Carbon Prediction. Sustainability 2019, 11, 1889. [Google Scholar] [CrossRef] [Green Version]
- Castaldi, F.; Chabrillat, S.; Van Wesemael, B. Sampling Strategies for Soil Property Mapping Using Multispectral Sentinel-2 and Hyperspectral EnMAP Satellite Data. Remote Sens. 2019, 11, 309. [Google Scholar] [CrossRef] [Green Version]
- Castaldi, F.; Hueni, A.; Chabrillat, S.; Ward, K.; Buttafuoco, G.; Bomans, B.; Vreys, K.; Brell, M.; van Wesemael, B. Evaluating the capability of the Sentinel 2 data for soil organic carbon prediction in croplands. ISPRS J. Photogramm. Remote Sens. 2019, 147, 267–282. [Google Scholar] [CrossRef]
- Žížala, D.; Minařík, R.; Zádorová, T. Soil Organic Carbon Mapping Using Multispectral Remote Sensing Data: Prediction Ability of Data with Different Spatial and Spectral Resolutions. Remote Sens. 2019, 11, 2947. [Google Scholar] [CrossRef]
- Lacoste, M.; Minasny, B.; McBratney, A.; Michot, D.; Viaud, V.; Walter, C. High resolution 3D mapping of soil organic carbon in a heterogeneous agricultural landscape. Geoderma 2014, 213, 296–311. [Google Scholar] [CrossRef]
- Padarian, J.; Minasny, B.; McBratney, A. Using deep learning to predict soil properties from regional spectral data. Geoderma Reg. 2019, 16, e00198. [Google Scholar] [CrossRef]
- Wang, B.; Waters, C.; Orgill, S.; Cowie, A.; Clark, A.; Liu, D.L.; Simpson, M.; McGowen, I.; Sides, T. Estimating soil organic carbon stocks using different modelling techniques in the semi-arid rangelands of eastern Australia. Ecol. Indic. 2018, 88, 425–438. [Google Scholar] [CrossRef]
- Angelopoulou, T.; Tziolas, N.; Balafoutis, A.; Zalidis, G.; Bochtis, D. Remote Sensing Techniques for Soil Organic Carbon Estimation: A Review. Remote Sens. 2019, 11, 676. [Google Scholar] [CrossRef] [Green Version]
- Xiong, X.; Grunwald, S.; Myers, D.B.; Kim, J.; Harris, W.G.; Comerford, N.B. Holistic environmental soil-landscape modeling of soil organic carbon. Environ. Model. Softw. 2014, 57, 202–215. [Google Scholar] [CrossRef]
- Xu, Y.; Smith, S.E.; Grunwald, S.; Abd-Elrahman, A.; Wani, S.P. Incorporation of satellite remote sensing pan-sharpened imagery into digital soil prediction and mapping models to characterize soil property variability in small agricultural fields. ISPRS J. Photogramm. Remote Sens. 2017, 123, 1–19. [Google Scholar] [CrossRef] [Green Version]
- Brus, D.; Kempen, B.; Heuvelink, G. Sampling for validation of digital soil maps. Eur. J. Soil Sci. 2011, 62, 394–407. [Google Scholar] [CrossRef]
- Vaudour, E.; Gomez, C.; Fouad, Y.; Lagacherie, P. Sentinel-2 image capacities to predict common topsoil properties of temperate and Mediterranean agroecosystems. Remote Sens. Environ. 2019, 223, 21–33. [Google Scholar] [CrossRef]
- Dvorakova, K.; Shi, P.; Limbourg, Q.; Van Wesemael, B. Soil Organic Carbon Mapping from Remote Sensing: The Effect of Crop Residues. Remote Sens. 2020, 12, 1913. [Google Scholar] [CrossRef]
- Roper, W.R.; Robarge, W.P.; Osmond, D.L.; Heitman, J.L. Comparing Four Methods of Measuring Soil Organic Matter in North Carolina Soils. Soil Sci. Soc. Am. J. 2019, 83, 466–474. [Google Scholar] [CrossRef]
- DEFRA. Environmental Land Management—Policy Discussion Document, Analysis of Responses; Blue Marble Research: Radstock, UK, 2021; p. 135. [Google Scholar]
- BGS MySoil App. Available online: https://www.bgs.ac.uk/technologies/apps/mysoil-app (accessed on 17 August 2021).
- Soilmentor. Available online: https://soils.vidacycle.com (accessed on 17 August 2021).
- Sadlier, G.; Flytkjær, R.; Sabri, S.; Robin, N. Value of Satellite-Derived Earth Observation Capabilities to the UK Government Today and by 2020; London Economics: London, UK, 2018. [Google Scholar]
- Allen, M. Contextual Overview of the Use of Remote Sensing Data within CAP Eligibility Inspection and Control. Available online: http://www.niassembly.gov.uk/globalassets/documents/raise/publications/2015/dard/3115.pdf (accessed on 17 August 2021).

Publisher’s Note: MDPI stays neutral with regard to jurisdictional claims in published maps and institutional affiliations. |
© 2021 by the authors. Licensee MDPI, Basel, Switzerland. This article is an open access article distributed under the terms and conditions of the Creative Commons Attribution (CC BY) license (https://creativecommons.org/licenses/by/4.0/).