Article

Eco-Province Construction Performance and Its Influencing Factors of Shandong Province in China: From Regional Eco-Efficiency Perspective

1
School of Management, Qufu Normal University, Rizhao 276826, China
2
School of Geography and Tourism, Qufu Normal University, Rizhao 276826, China
*
Author to whom correspondence should be addressed.
Sustainability 2021, 13(21), 12068; https://doi.org/10.3390/su132112068
Submission received: 22 September 2021 / Revised: 26 October 2021 / Accepted: 26 October 2021 / Published: 1 November 2021

Abstract

:
Eco-province construction (EPC) innovated by China is an important approach for regional sustainable development. The core of this paper relates to how to quantitatively evaluate EPC performance and explore its influencing factors. We propose regional total-factor eco-efficiency as a proxy of EPC performance and apply the methods of the SBM directional distance function, the Theil index, hot-spot analysis, and the Tobit model to investigate spatial-temporal evolutionary characteristics and influencing factors of Shandong’s EPC performance from 2003 to 2017. The results showed that: (1) The EPC performance of Shandong presented a fluctuating rising trend as a whole and was unbalanced among regions with gradient-descending characteristics from the eastern, central to western regions. (2) The gravity center of Shandong’s EPC performance shifted northwards, eastwards, southwards, and westwards successively; the spatial pattern of regional EPC performance evolved from characteristics of high- and low-dispersion distribution in the initial stage to a significant H-shaped spatial conglomeration with hot spots distributed in Binzhou and Yantai and cold spots in the southern region. (3) A U-shaped environmental Kuznets curve existed between economic development level and Shandong’s EPC performance. Shandong’s EPC performance was positively related to R&D intensity while negatively related to urbanization. The impact of industrial structure, openness, and environmental regulation on Shandong’s EPC performance presented spatial heterogeneity. Shandong should establish a cross-regional collaborative governance mechanism of ecological construction and implement an ecological-innovation-driven development strategy to promote EPC performance.

1. Introduction

China has experienced rapid economic growth over the past 40 years since China’s reform and opening up policy in 1978. However, such achievement relies heavily on large amounts of natural resources and environmental consumption. The traditional extensive development mode has posed a profound challenge to China’s regional sustainable development. How to transform regional economic growth from traditional development mode with high consumption and low efficiency to sustainable development with low consumption and high efficiency has always been the important issue for policymakers both in provincial and national governments of China.
Since the concept of sustainable development was put forward in the Brundtland Report [1], eco-city construction has become a popular measure for countries and regions to put the abstract concept of sustainable development into operational practice. The eco-city was first proposed in the “Man and Biosphere” program launched by the United Nations Educational, Scientific and Cultural Organization in 1971 [2] and gained significant attention after Richard Register’s book, Eco-city Berkeley [3]. In recent decades, eco-city construction has been planned and implemented widely around the word. There have emerged many eco-city models, such as Hammarby in Sweden, Songdo in South Korea, Kitakyushu in Japan, Suzhou and Tianjin in China, and Masdar in Abu Dhabi, just to name a few [4,5,6,7,8]. Compared to the popular eco-city construction worldwide, China has innovatively implemented eco-province construction (EPC), which is a relatively larger-scale ecological construction initiative for regional sustainable development [9,10,11]. The EPC initiative was started at the end of last century, and now has become not only an important approach for sustainable development at the regional level but also the carrier of ecological civilization construction [12,13,14]. China’s State Environmental Protection Administration (SEPA), now elevated to Ministry of Environmental Protection, has approved 16 provinces as EPC plots, such as Hainan, Jilin, Fujian, Shandong, Jiangsu, and so on. As larger-scale ecological construction, EPC has the advantages of its large scale, where ecosystem protection and social-economic development among different regions or cities can be more completely included and coordinated in a systematic overall planning [11,15]. EPC can also contain eco-village, eco-county, and eco-city construction as its components. “Guidelines on Building Eco-province, Eco-city and Eco-county (revised version)”, issued by China’s SEPA, sets five essential conditions for obtaining the title of eco-province, one of which is that 80% of provincial cities in the administrative area should meet eco-city requirements and be declared eco-cities [16]. Therefore, EPC needs systematic thinking and coordination of economic development and environmental protection between urban and rural areas and between different regions.
It should be pointed out that EPC is not a short-term thing but a long-term task. There is a need for study of EPC performance and its influencing factors based on the last decade of data, which can provide significant references for EPC in the future. Up to now, research on the evaluation of EPC performance has been carried out as follows. First, EPC performance was evaluated purely from the natural-resource and environmental aspects. Along these lines, ecological footprint [17,18,19] and natural-ecosystem-service value [20] were used to study the EPC performance of Jilin, Hainan, and Jiangsu provinces. Second, the evaluation index system of EPC performance was constructed by selecting an index based on economic development, social progress, resource utilization and environmental protection [21], and then EPC performance at the national or provincial levels were evaluated by comprehensive evaluation methods, such as AHP [22,23] and the fuzzy comprehensive evaluation method [24]. These studies can measure EPC performance comprehensively; however, they ignored the correlation and co-ordination between the input and output indicators in ecological construction, which may cause a low input-output efficiency problem and lead to biased evaluation of EPC performance. Therefore, it is important and necessary to take into account economic and environmental factors and their efficiency when measuring EPC performance. Eco-efficiency, which was first defined by the World Business Council for Sustainable Development (WBCSD) and expressed as the efficiency with which ecological resources are used to meet human needs [25], is one of widely-applied benchmarks of progress towards regional sustainable development [26,27,28,29,30,31]. As a combination of economic and ecological efficiency, regional eco-efficiency is also an appropriate measurement for EPC performance. It is worth noting that Ding et al. (2011) and Wang et al. (2015), respectively, evaluated EPC performance from the perspective of material-utilization efficiency, or eco-efficiency [11,32], which integrated the resource-input and economic-output indicators and considered their coordination. But the eco-efficiency they adopted in their studies belonged to single-factor eco-efficiency, ignoring the diversity of ecological inputs, non-ecological inputs, undesired outputs and their substitution relationship, so it is hard to use single-factor eco-efficiency to comprehensively measure EPC performance.
Unlike previous studies that used single-factor eco-efficiency as a proxy of EPC performance, in this paper, we attempted to propose a regional total-factor eco-efficiency measurement based on a total-factor productivity framework to measure Shandong’s EPC performance and then explored its spatial-temporal evolutionary characteristics and influencing factors. This study has two major contributions to the current literature. Firstly, although a number of studies have focused on regional eco-efficiency in Shandong province [33,34,35,36], no studies have distinguished between ecological inputs and non-ecological inputs when calculating eco-efficiency, and they have treated ecological-resource inputs and non-ecological-resource inputs simply the same. The total-factor eco-efficiency they calculated does not comply with the eco-efficiency connotation, which is defined as the ratio of “value of products and services produced” to “the sum of environmental pressures generated” [25,37]. Further, they did not investigate spatial-temporal-pattern evolution and driving forces of regional eco-efficiency since the Shandong EPC pilot was implemented in 2003. This study addresses this research gap by evaluating EPC performance and analyzing regional variations using spatial analysis technology, and thus, offers insight into its influencing factors. Secondly, in terms of methodology, we used total-factor eco-efficiency to measure Shandong’s EPC performance. The advantage of this approach is that total-factor eco-efficiency can incorporate ecological inputs, non-ecological inputs, desired outputs, and undesired outputs into the united measurement framework of EPC performance. We constructed a three-dimensional global SBM directional distance function specified as economic development, ecological-resource conservation, and environmental-pollution reduction to quantitatively measure Shandong’s EPC performance. The methods of the Theil index, the gravity center migration model, hot-spot analysis, and the Tobit model are introduced to analyze the spatial-temporal evolutionary characteristics and influencing factors of Shandong’s EPC performance. Thus, the purpose of this paper is not only to evaluate Shandong’s EPC performance from a temporal and spatial evolutionary perspective as it changes over time and differs in space but also to explore the possible driving forces and give some implication for policymaking.
The remainder of this paper is organized as follows. Section 2 introduces the methodology and data used in this study. Section 3 reports the empirical study results. Section 4 sets out a discussion of the results. Section 5 concludes this study and puts forward some useful policy implications.

2. Materials, Methodologies and Data Description

2.1. Study Area

Shandong Province is located on China’s eastern coast and at the lower reach of the Yellow River, bordered by Hebei, Henan, Anhui and, Jiangsu provinces from north to south. Shandong is one of the largest provinces by population and economy in China, with a population of more than 100 million and an economy ranking in the top three in China. During the study period, there were 17 provincial cities/sub-regions (now reduced to 16 cities after Laiwu incorporated into Jinan), which are usually divided into 3 regions, i.e., eastern (comprising Qingdao, Dongying, Yantai, Weifang, and Weihai, Rizhao), central (comprising Jinan, Zibo, Taian, Laiwu, and Linyi), and western (comprising Zaozhuang, Jining, Heze, Dezhou, Liaocheng, and Binzhou). The regionak distribution of Shandong Province is displayed in Figure 1. Shandong covers 157,900 square kilometers. Its terrain is mainly mountains and hills, with a peninsula in the eastern area, plains in the western and northern areas, and mountains and hills in south-central regions. As one of China’s most economically powerful provinces, Shandong has achieved remarkable progress in economic development, which has also brought many negative impacts, such as heavy industrial structure, excessive pollution emissions, insufficient natural environmental carrying capacity, and unbalanced regional development [38]. In order to reverse the trends of ecological-environmental deterioration and implement a sustainable development strategy, Shandong voluntarily applied for the EPC pilot and was officially approved by SEPA in 2003. Since then, Shandong has carried out all kinds of measures and actions, such as “Green Shandong”, “Ecological Shandong”, and “Beautiful Shandong”, and is committed to becoming an ecological-economic demonstration province by the end of 2020.

2.2. Methods

2.2.1. SBM Directional Distance Function

The directional distance function based on DEA, is a commonly used method to calculate regional total-factor eco-efficiency [39]. This paper distinguishes between ecological inputs, non-ecological inputs, desired outputs, and undesired outputs. Assuming that in period t (t = 1, 2, …, T), there are n sub-regions to be evaluated, each sub-region j(j = 1, 2, …, n) uses m1, kinds of non-ecological inputs xij (i = 1, 2, …, m1), and m2, kinds of ecological inputs, efj (f = 1, 2, …, m2), and produces s, kinds of desired outputs, yrj (r = 1, 2, …, s), and q, kinds of undesired outputs, bhj (h = 1, 2, …, q). The input and output variables used in this paper are displayed in Table 1 of Section 2.3. According to the SBM directional distance function model [40] and the eco-efficiency definition [25], we construct a three-dimensional global SBM directional distance function specified as economic development, ecological-resource conservation and environmental-pollution reduction to measure regional EPC performance, as shown in Formula (1).
S G e k t , y k t , b k t ; g = M a x 1 3 1 m 2 f = 1 m 2 d f k e t g f e + 1 s r = 1 s d r k y t g r y + 1 q h = 1 q d h k b t g h b s . t .     t = 1 T j = 1 n x i j t λ j t + d i k x t = x i k t ; t = 1 T j = 1 n e f j t λ j t + d f k e t = e f k t ; t = 1 T j = 1 n y r j t λ j t d r k y t = y r k t ; t = 1 T j = 1 n b h j t λ j t + d h k b t = b h k t ; t = 1 T j = 1 n λ j t = 1 ; λ j t 0   t = 1 , , T ; j = 1 , , n d i k x t 0   i = 1 , , m 1 , d f k e t 0   f = 1 , , m 2 , d r k y t 0   r = 1 , , s , d h k b t 0   h = 1 , , q
where k and t, respectively, represent sub-region and year, g represents the direction vector, d is the slack variable, and λ denotes the weight vector. If the optimal solution of Formula (1) is d f k e t , d r k y t , or d h k b t , the regional EPC performance is defined as Formula (2), which pursues the minimum of ecological input and environmental emissions and the maximum of economic development simultaneously, and regional ecological inefficiency contains the ecological input inefficiency, desired output inefficiency, and undesired output inefficiency [41], as shown in Formula (3).
θ k t = 1 S G e k t , y k t , b k t ; g  
S G e k t , y k t , b k t ; g = I E e t + I E y t + I E b t , I E e t = 1 3 m 2 f = 1 m 2 d f k e t g f e , I E y t = 1 3 s r = 1 s d r k y t g r y , I E b t = 1 3 q h = 1 q d h k b t g h b
where θ k t . denotes EPC performance of sub-region, k, in period, t; I E e t , I E y t and I E b t represent ecological input inefficiency, desired output inefficiency, and undesired output inefficiency, respectively.

2.2.2. Theil Index and Decomposition

The Theil index and decomposition are used to investigate the regional difference of EPC performance. Based on the Theil index and the decomposition principle [42], the total regional difference, T, of EPC performance is decomposed into intraregional difference, TBR, and inter-regional difference, TWR. Suppose that the study area is divided into G regions, and each region, l (l = 1, 2, …, G), has nl sub-regions. In period t, the EPC performance of sub-region j (j = 1, 2, …, nl) in region l, the mean EPC performance of region l, and the mean EPC performance of the whole study area are recorded, respectively, as θljt, θlt, and θt. Then, the total regional difference, intraregional difference, and inter-regional difference of EPC performance are defined as following Formula (4).
T t = T B R t + T w R t = 1 n l = 1 G j = 1 n l θ l j t θ t l n θ l j t θ t T w R t = l = 1 G n l n θ l t θ t 1 n l j = 1 n l θ l j t θ l t l n θ l j t θ l t T B R t = l = 1 G n l n θ l t θ t l n θ l t θ t n = l = 1 G n l , θ l t = 1 n l j = 1 n l θ i j t , θ t = 1 n l = 1 G j = 1 n l θ l j t
where n is the sub-region number of the whole study area. The Tt value should be between 0 and lnn. The smaller Tt is, the smaller the regional difference is.

2.2.3. Gravity-Center Migration Model

The gravity-center migration model is a frequently used method to analyze spatial variation characteristics of demographic and economic variables [43,44]. According to the gravity-center calculation method in physics, if the study area is composed of n sub-regions and the EPC-performance value of each sub-region, i (i = 1, 2…, n), is regarded as the regional quality, the gravity center (Ht, Vt) of the study area in period t can be calculated by Formula (5).
H t = i = 1 n θ i t h i i = 1 n θ i t , V t = i = 1 n θ i t v i i = 1 n θ i t
where θ i t is the EPC-performance value of sub-region, i, in period t and (hi, vi) is the plane coordinate of sub-region i. When the EPC performance in a certain sub-region is high and increasing fast, the gravity center of EPC performance will move towards that sub-region.

2.2.4. Hot-Spot Analysis (Getis-Ord Gi*)

Hot-spot analysis (Getis-Ord Gi*) is a widely used method for local spatial-correlation analysis of economic and environmental variables [45] and can identify the spatial distribution of hot spots and cold spots, which represent the statistically significant spatial clusters of high value and low value, respectively. The statistics of Getis-Ord Gi* and its standardized statistics of Z(Gi*) for EPC performance are defined as Formula (6).
G i d = j = 1 n W i j d θ i j = 1 n θ i , Z G i = G i E G i V A R G i
where θi stands for EPC-performance values of sub-region i, Wij is the spatial weight between sub-region i and j, and E(Gi*) and VAR(Gi*) represent the mathematical expectation and variance of Gi*, respectively. If Z(Gi*) is positively statistically significant, there exists a clustering of high-value EPC performance (hot spot), while if Z(Gi*) is significantly negative, there exists a clustering of low values (cold spot).

2.2.5. Tobit Model

EPC performance calculated by the SBM directional distance function ranges from 0~1, and there will be many regions with EPC performance equaling 1. Such a dependent variable is generally considered truncated or censored. If the ordinary OLS regression model is used for testing influence factors of EPC performance, the estimation parameters will be inconsistent, while the Tobit model, proposed by Tobin (1958), can address such problems [46,47,48]. Due to heterogeneity among regions, a panel Tobit model is used to analyze influencing factors of EPC performance, which is shown in Equation (6).
θ i t = θ i t ,   i f   θ i t 1 ,   θ i t = X i t β + u i + λ t + ε i t 1 ,   i f   θ i t > 1
where, i and t, respectively, represent sub-region and year, θ and θ* denote the observable and unobservable EPC-performance values, X represents the influencing-factors vector, β represents the coefficient vector to be estimated, ui and λt, respectively, represent the individual and time-fixed effect, and εit is the random disturbance term and assumed to be normal with zero mean and constant variance.

2.3. Variables and Data Description

2.3.1. Inputs and Outputs

In this study, inputs are divided into non-ecological inputs and ecological inputs, and outputs are divided into desired outputs and undesired outputs. (1) Non-ecological inputs: labor and capital stock. Labor input is measured by number of employed persons by three strata of industry; capital stock is estimated using the perpetual inventory method. For specific estimation methods, please refer to related research [49]. (2) Ecological inputs: land occupation, water consumption, and energy consumption. Land occupation, water consumption, and energy consumption are respectively measured by urban-construction land area, water-supply amount, and the electricity-consumption amount. (3) Desired output: regional gross domestic product (GDP). (4) Undesired outputs: three main wastes emissions, namely wastewater discharge, SO2 emissions, and industrial solid-waste discharge.

2.3.2. Influencing Factors

According to the outline of Shandong EPC planning and previous studies [50,51], we chose the following influencing factors. (1) Economic-development level factor. The natural logarithm of per-capita GDP (pgdp) and its square term (spgdp) were chosen to indicate regional economic development levels. (2) Economic structure factor. Industrial structure (indus), urbanization rate (urban), and openness degree (fdi) were chosen to represent economic structure. The industrial structure is measured by the ratio of tertiary industry to regional GDP; urbanization rate is measured by the proportion of urban population in total population; and the opening-up degree is measured by the ratio of foreign direct investment actually utilized to regional GDP. (3) Technological innovation factor. R&D intensity (r & d), measured by the ratio of industrial R&D expenditures to industrial added value, is selected to represent technological factor. (4) Environmental policy factor. Environmental regulation (regu), measured by the proportion of sewage treatment and sewage discharge, is selected to represent environmental policy factor.

2.3.3. Data Description

The data of inputs, outputs, and influencing factors come from Shandong Statistical Yearbook (2004–2018) and Sixty Years of Brilliant Shandong (1949–2009). All the monetary data are converted into 2003 constant price in order to eliminate the price impact. There are 255 observations in total, which contain the data set of 17 sub-regions (provincial cities) for the period of 2003–2017. The basic descriptive statistics of inputs and outputs and influencing factors are respectively presented in Table 1 and Table 2.

3. Results and Analysis

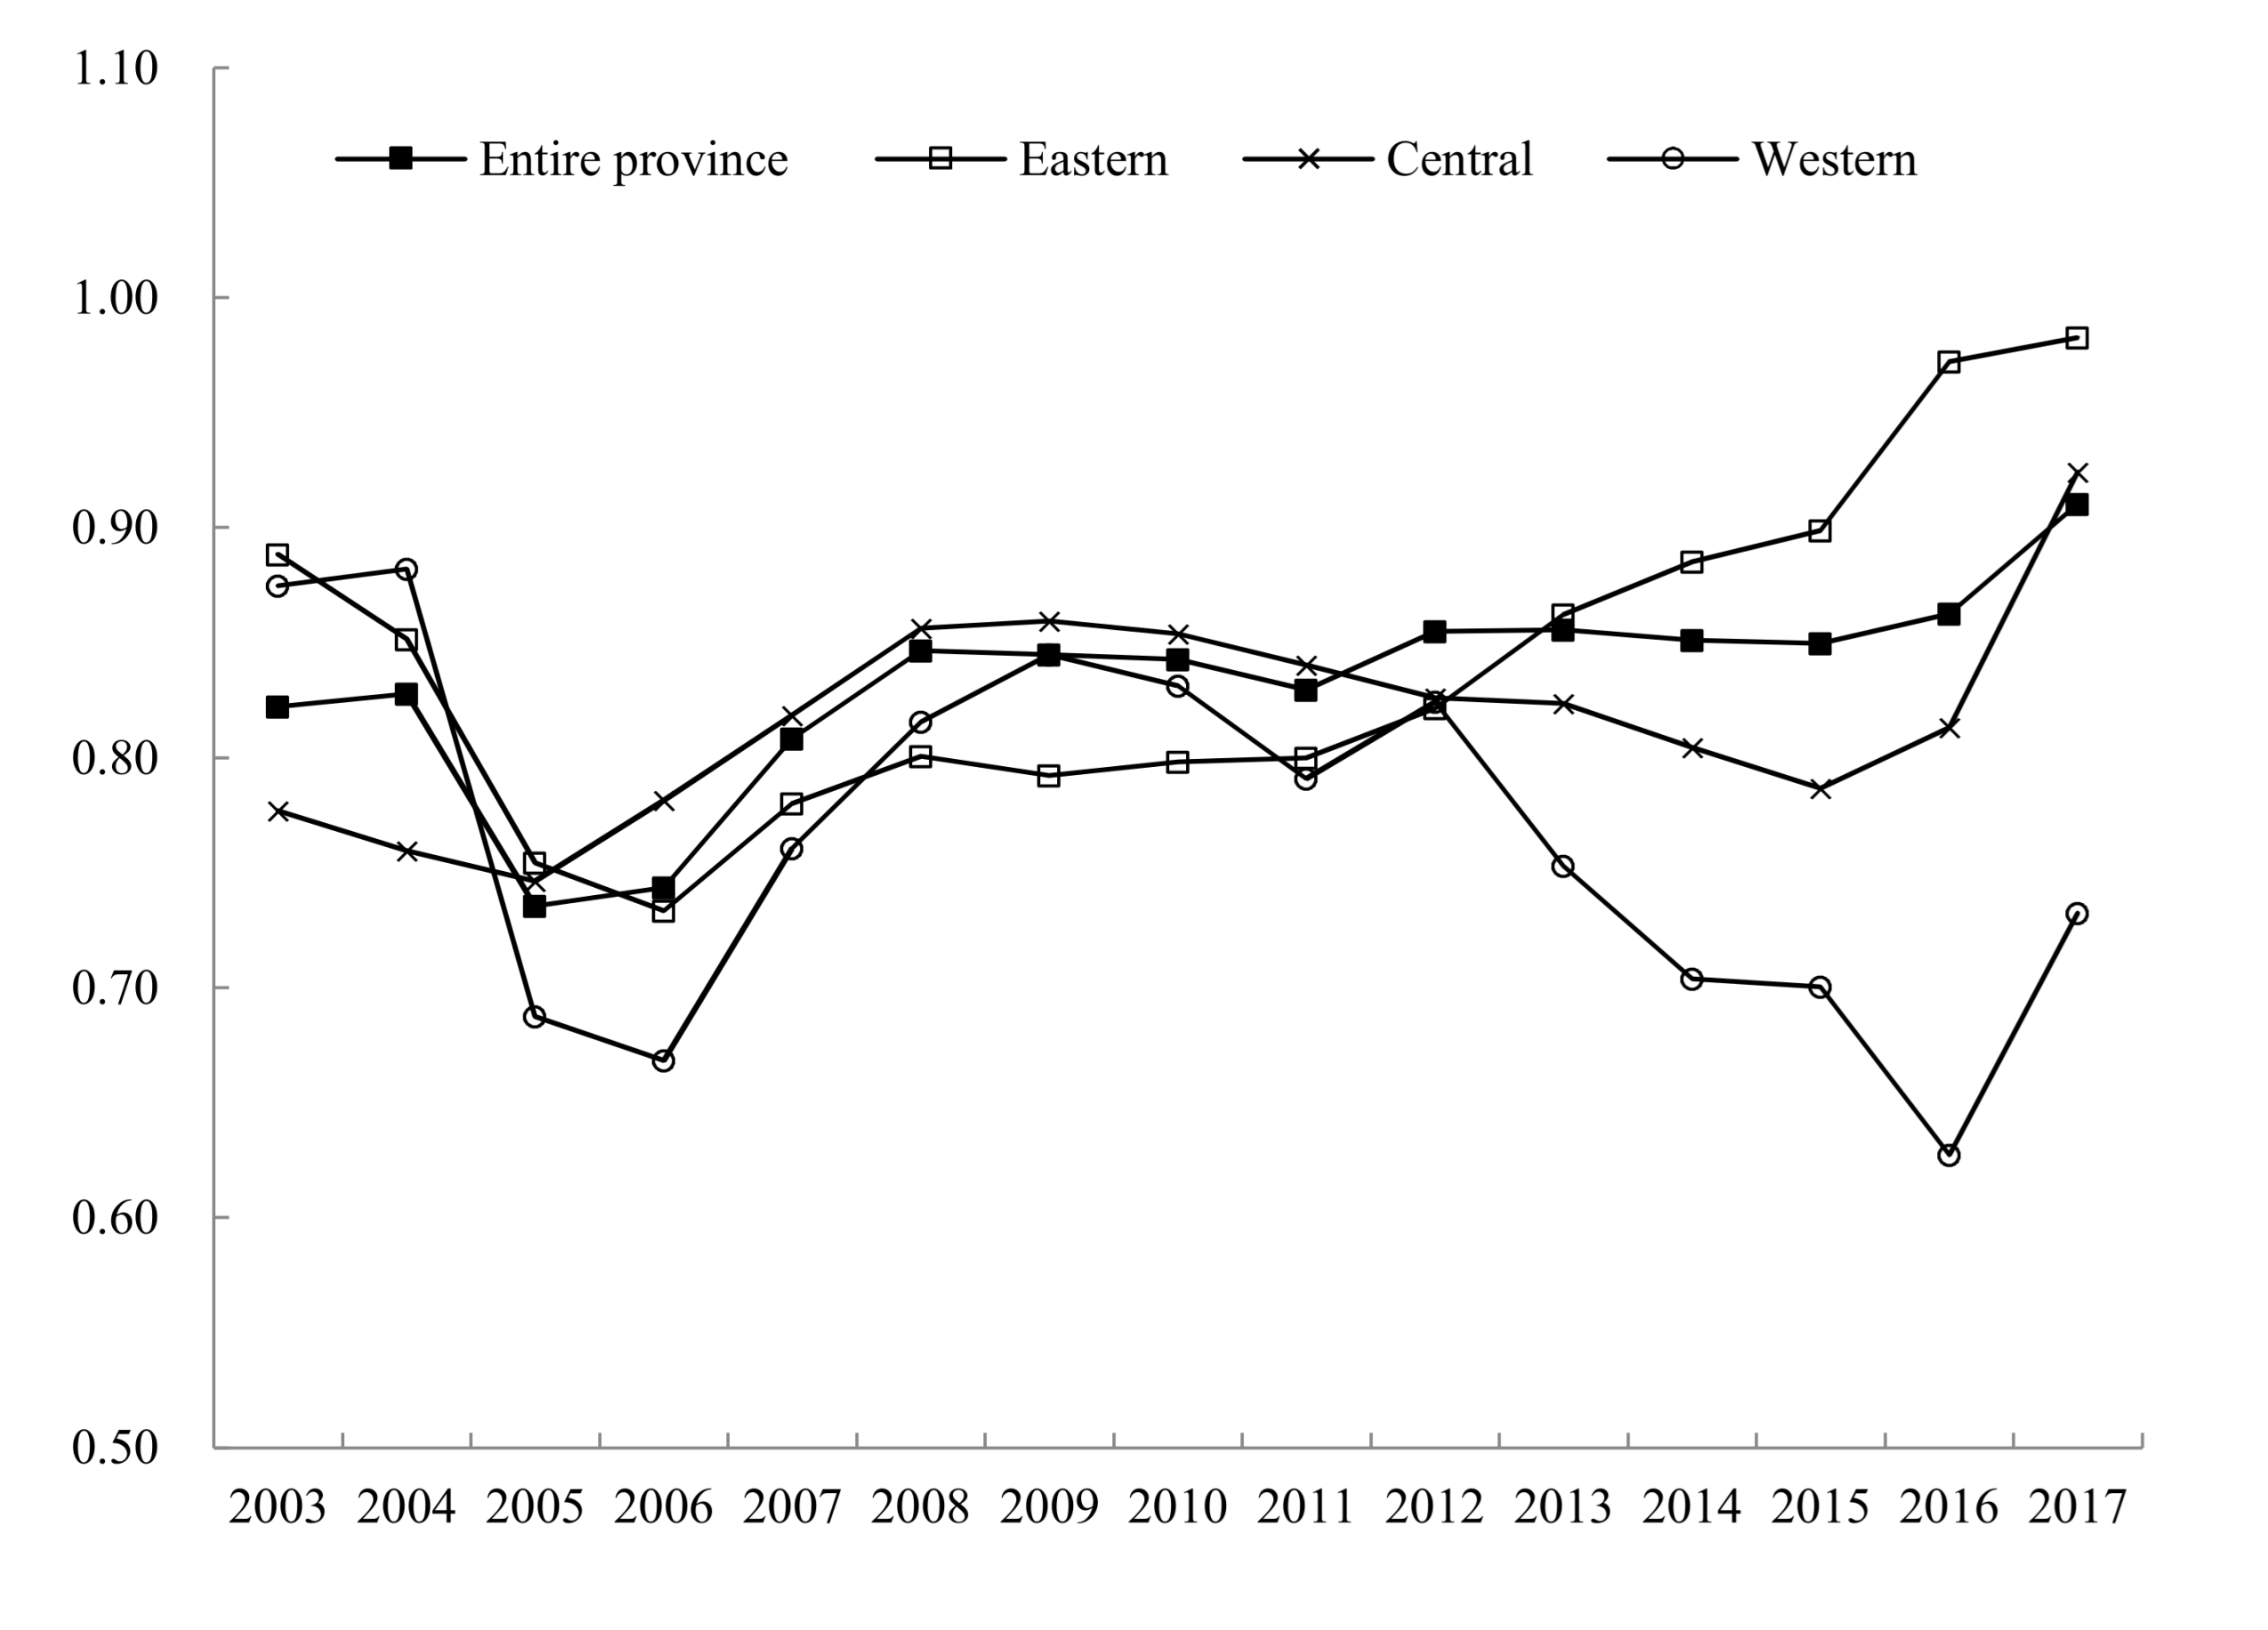
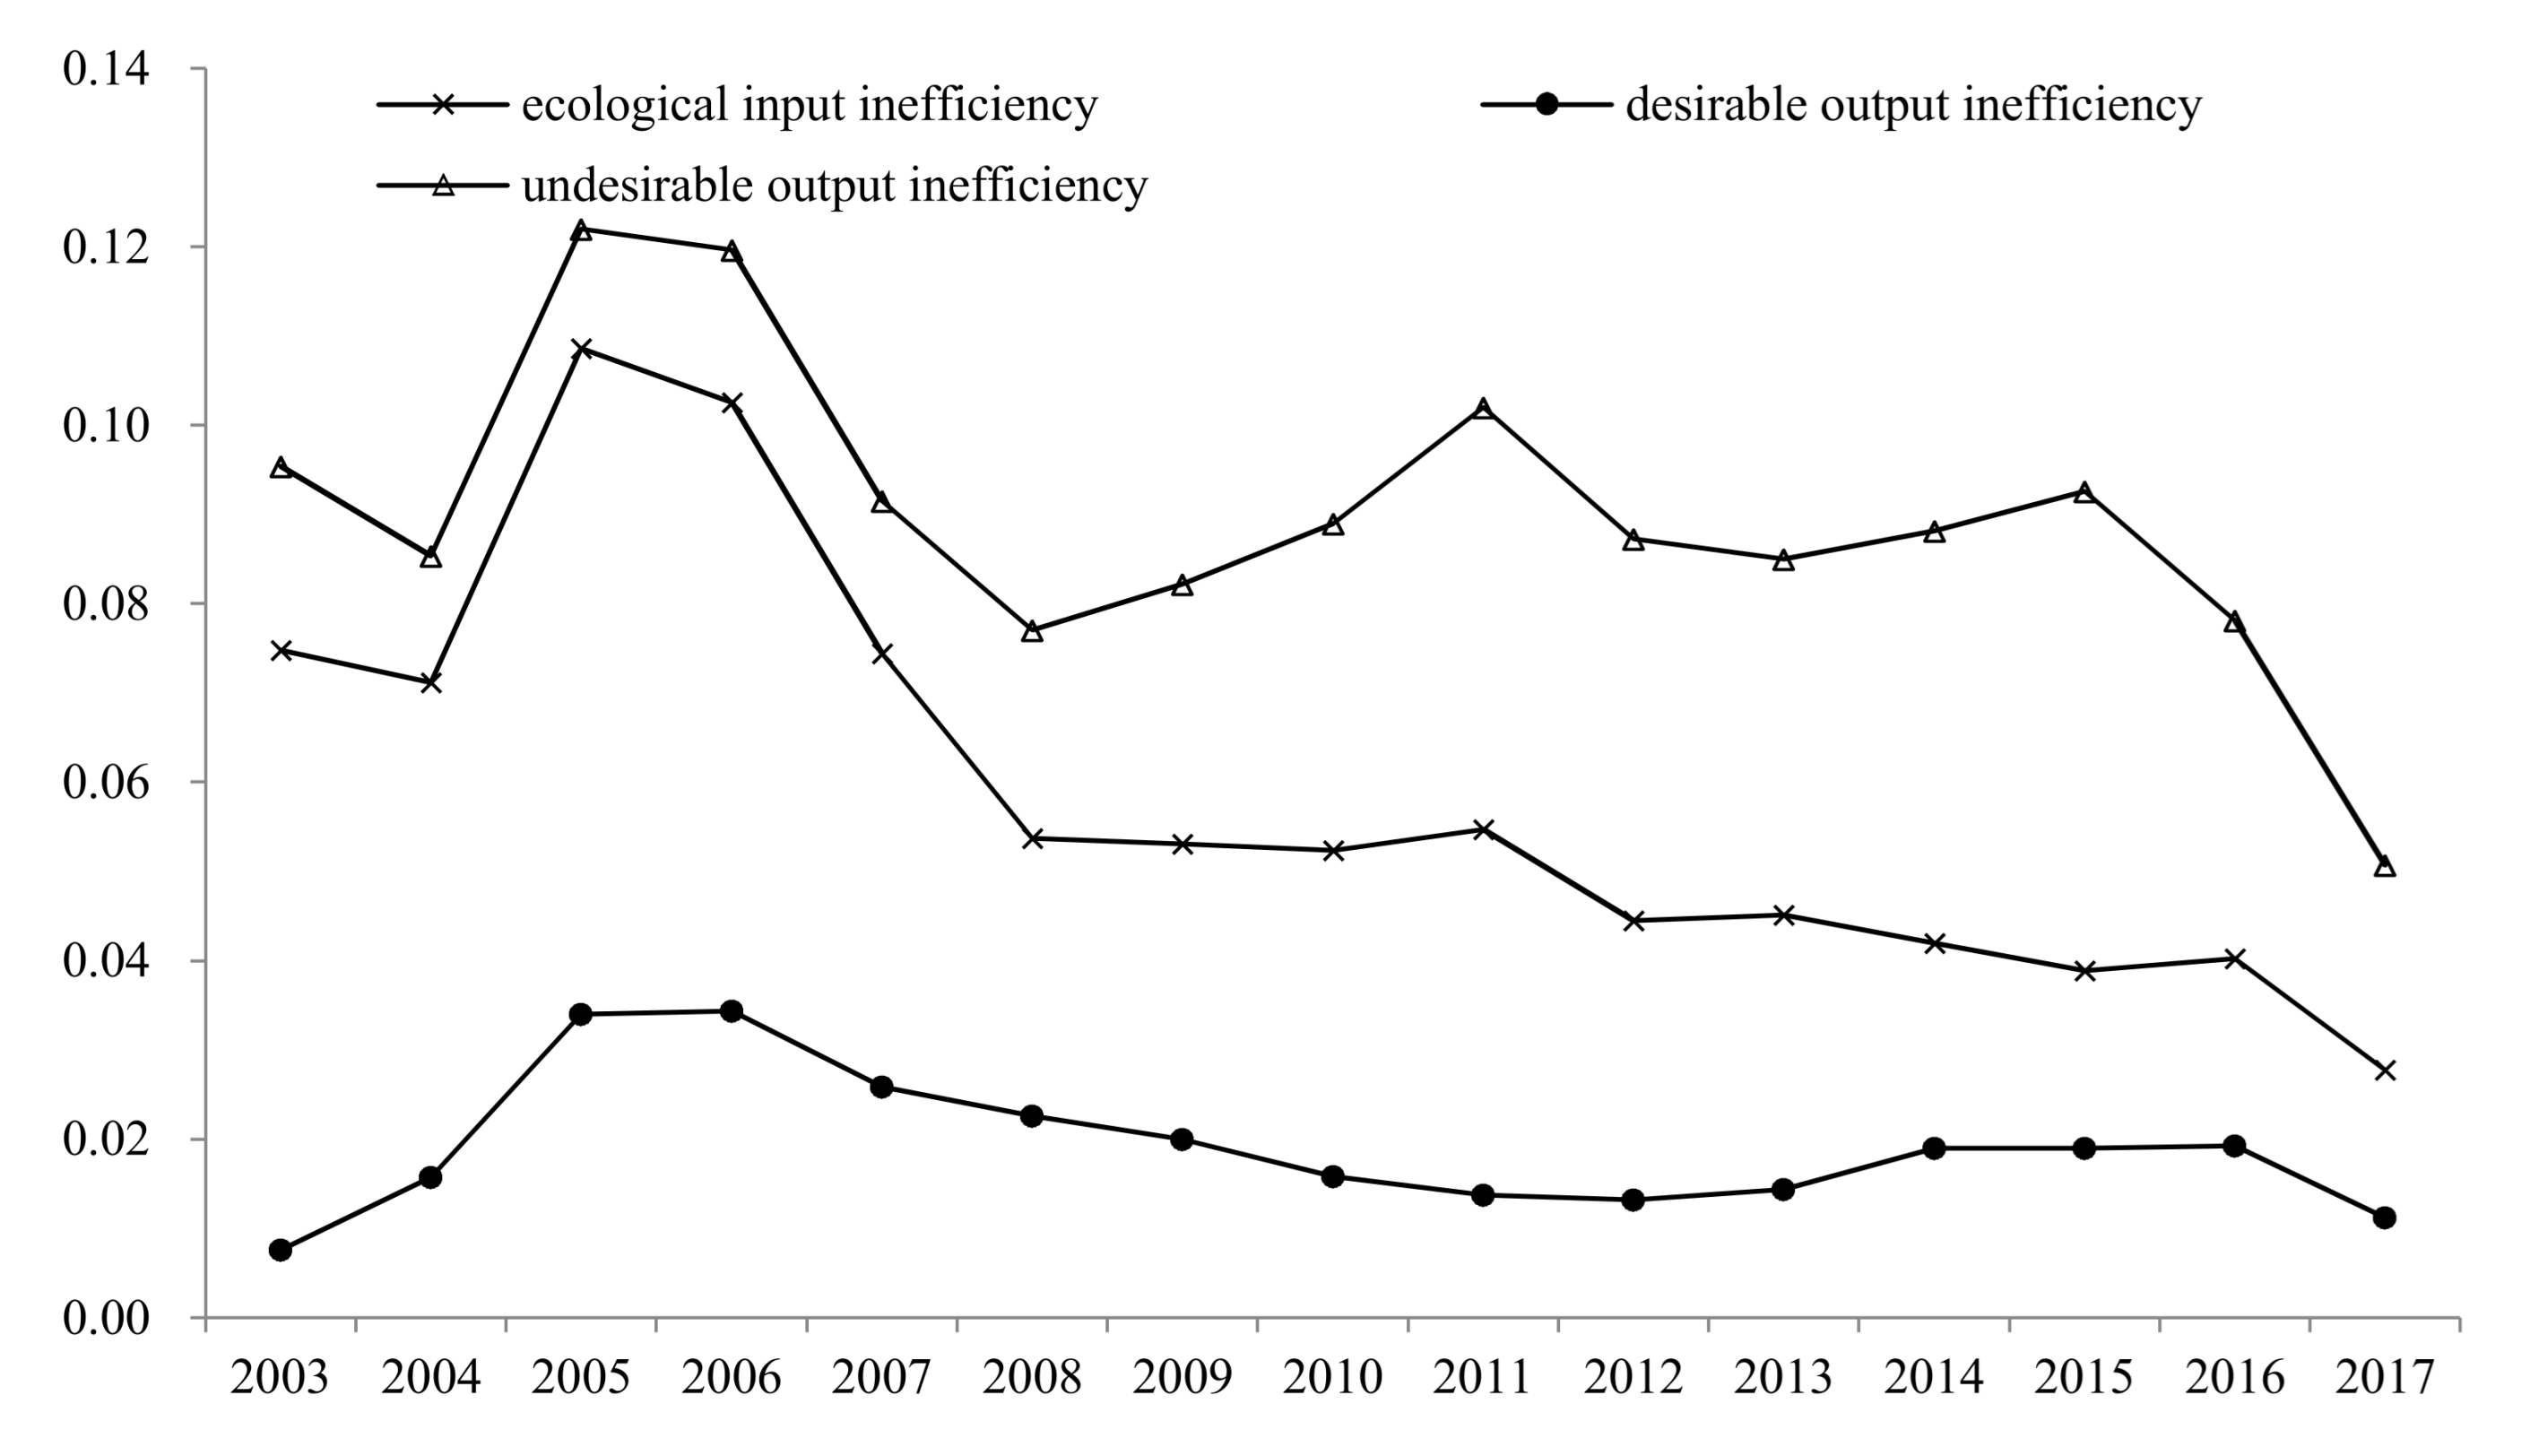
3.1. Temporal Evolutionary Characteristics of Shandong’s EPC Performance

Figure 2 reports the temporal change of Shandong’s EPC performance from 2003 to 2017. As revealed in Figure 2, EPC performance of Shandong as a whole generally presents a V-shaped fluctuating rising trend, and the lowest point appeared in 2005. Shandong’s EPC performance has increased from 0.795 at the startup stage to 0.817 at the improvement stage, and then to 0.859 at the development stage, indicating that the overall effect of the Shandong EPC is remarkable. The sources of ecological inefficiency are presented in Figure 3. Undesired-output inefficiency contributes the most to regional ecological inefficiency and is the main factor restricting the improvement of Shandong’s EPC performance. The contribution rate of ecological input to ecological inefficiency has been declining gradually since 2005, indicating that Shandong Province has achieved better results in resource-saving ecological construction. Although the contribution rate of desired-output inefficiency is relatively low, it has shown a fluctuating increasing trend, and the hindrance of desired output to Shandong’s EPC performance cannot be ignored.
It can also be seen from Figure 2 that EPC performance among three regions generally presents the characteristics of gradient-decreasing from the eastern, central, and western regions. Figure 4 shows the inefficiency sources of EPC performance in three regions. From 2003 to 2005, the western region was at an early stage of industrialization and urbanization, and its ecological-resource consumption and environmental-pollution emissions were relatively low, which resulted in a relatively high EPC performance. The eastern region, as an important window on Shandong international trade, with its superior geographical location, made more efforts toward resource conservation and environmental protection, and its EPC performance was also relatively high. In comparison, the EPC performance of the central region was low because of higher ecological input and undesired-output inefficiency. From 2006 to 2012, with the implementation of the scientific development concept and the construction of a two-oriented society, the EPC performance of the eastern, central, and western regions was increasing simultaneously. From 2013 to 2017, based on the development of a blue marine economy and high-tech industries, the EPC performance of the eastern region increased rapidly, and the region became a leader in ecological economy. The central region formed the provincial capital metropolitan circle, with Jinan as the main center and Taian, Zibo, and Laiwu as its subcenters, and showed sound momentum of ecological economy development. The EPC performance of the central region has risen in fluctuations with its ecological input inefficiency, desired-output inefficacy, and undesired-output inefficiency declining. However, although the western region achieved great success in economic growth, its EPC performance presented a declining trend due to the increase of ecological-resource input and undesired-output inefficiency. This also reflects that, with the rapid industrialization and urbanization, the extensive regional development mode has a substantial adverse impact on the resources and environment, and the bottleneck effect of resource and environmental constraints ton regional sustainable development has become more prominent.
The Theil index and decomposition were used to analyze EPC performance differences among three regions. The results are shown in Figure 5. In general, the total regional difference of Shandong’s EPC performance has not changed much from 2003 to 2017, but the source of regional differences has changed greatly. From 2003 to 2012, intraregional difference was the dominant source of total regional differences, and its contribution rate remained stable, at over 90%, while that of inter-regional differences remained below 10%. From 2013 to 2017, inter-regional difference became an important source of total regional difference, and its contribution increased gradually and even significantly exceeded intraregional difference in 2016. This shows that Shandong’s recent EPC performance presents a trend of club convergence within regions, with divergence and expansion among regions, which is consistent with gradient decreasing among regions.

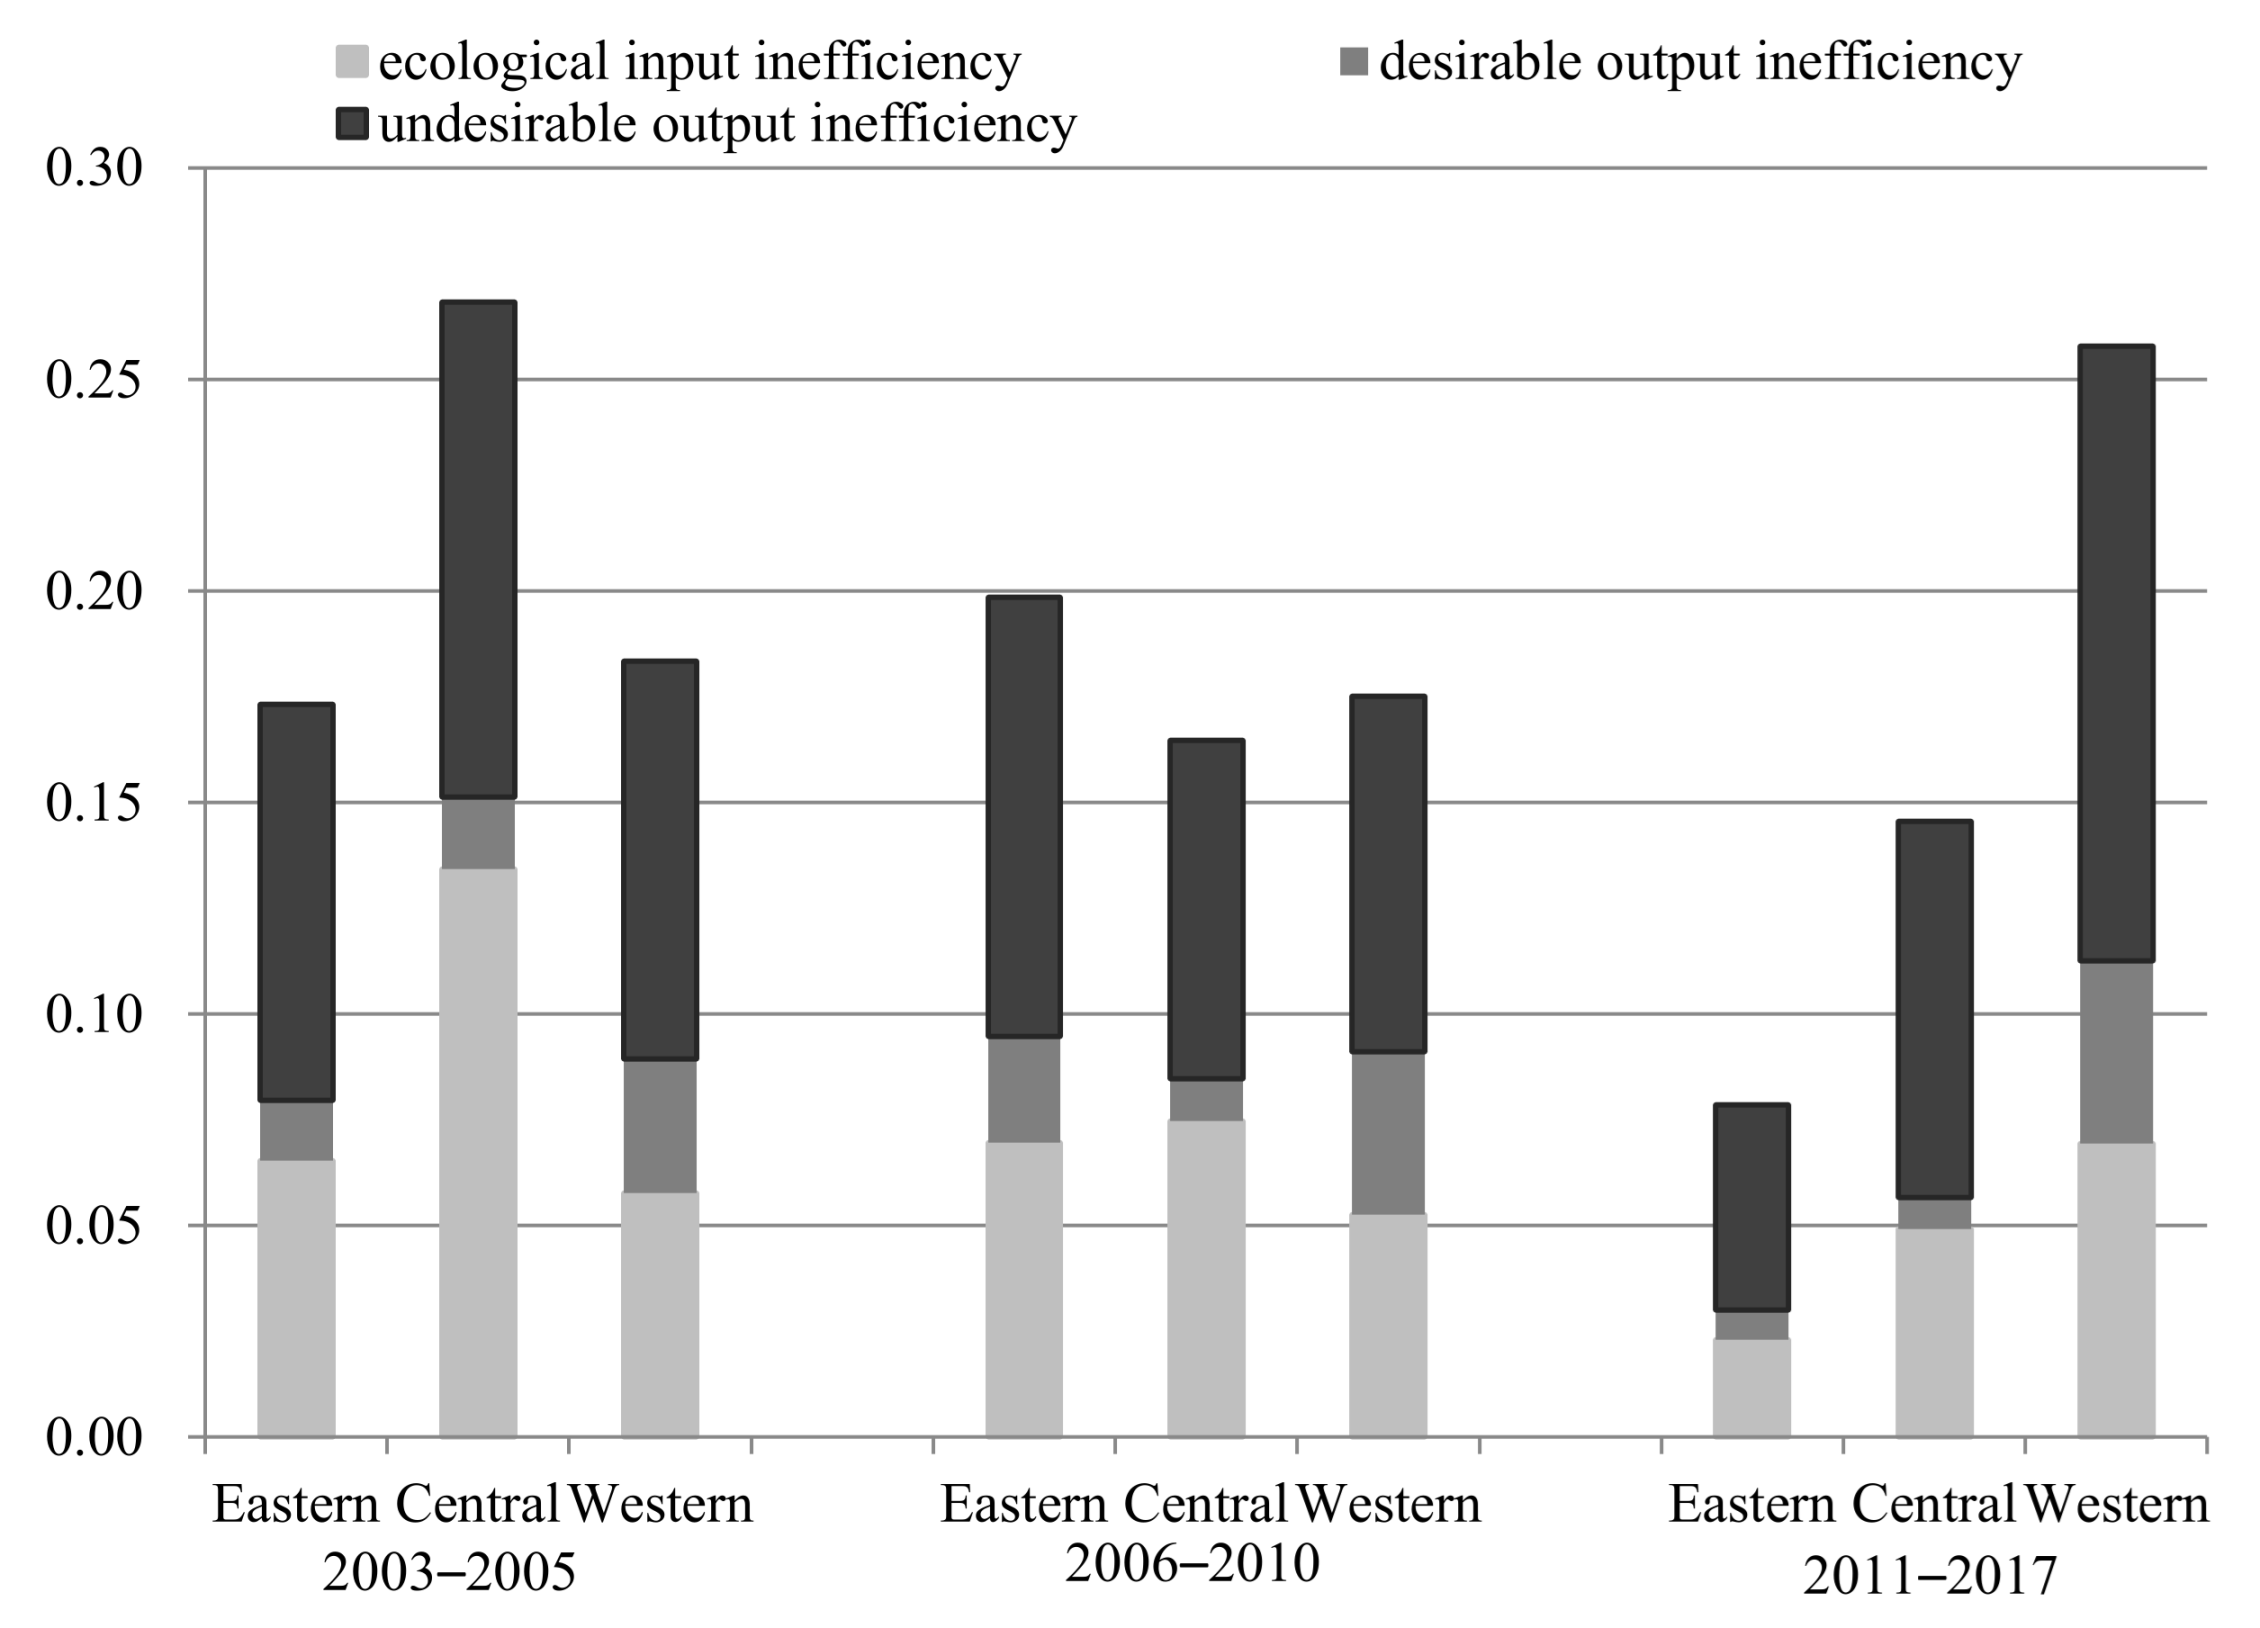
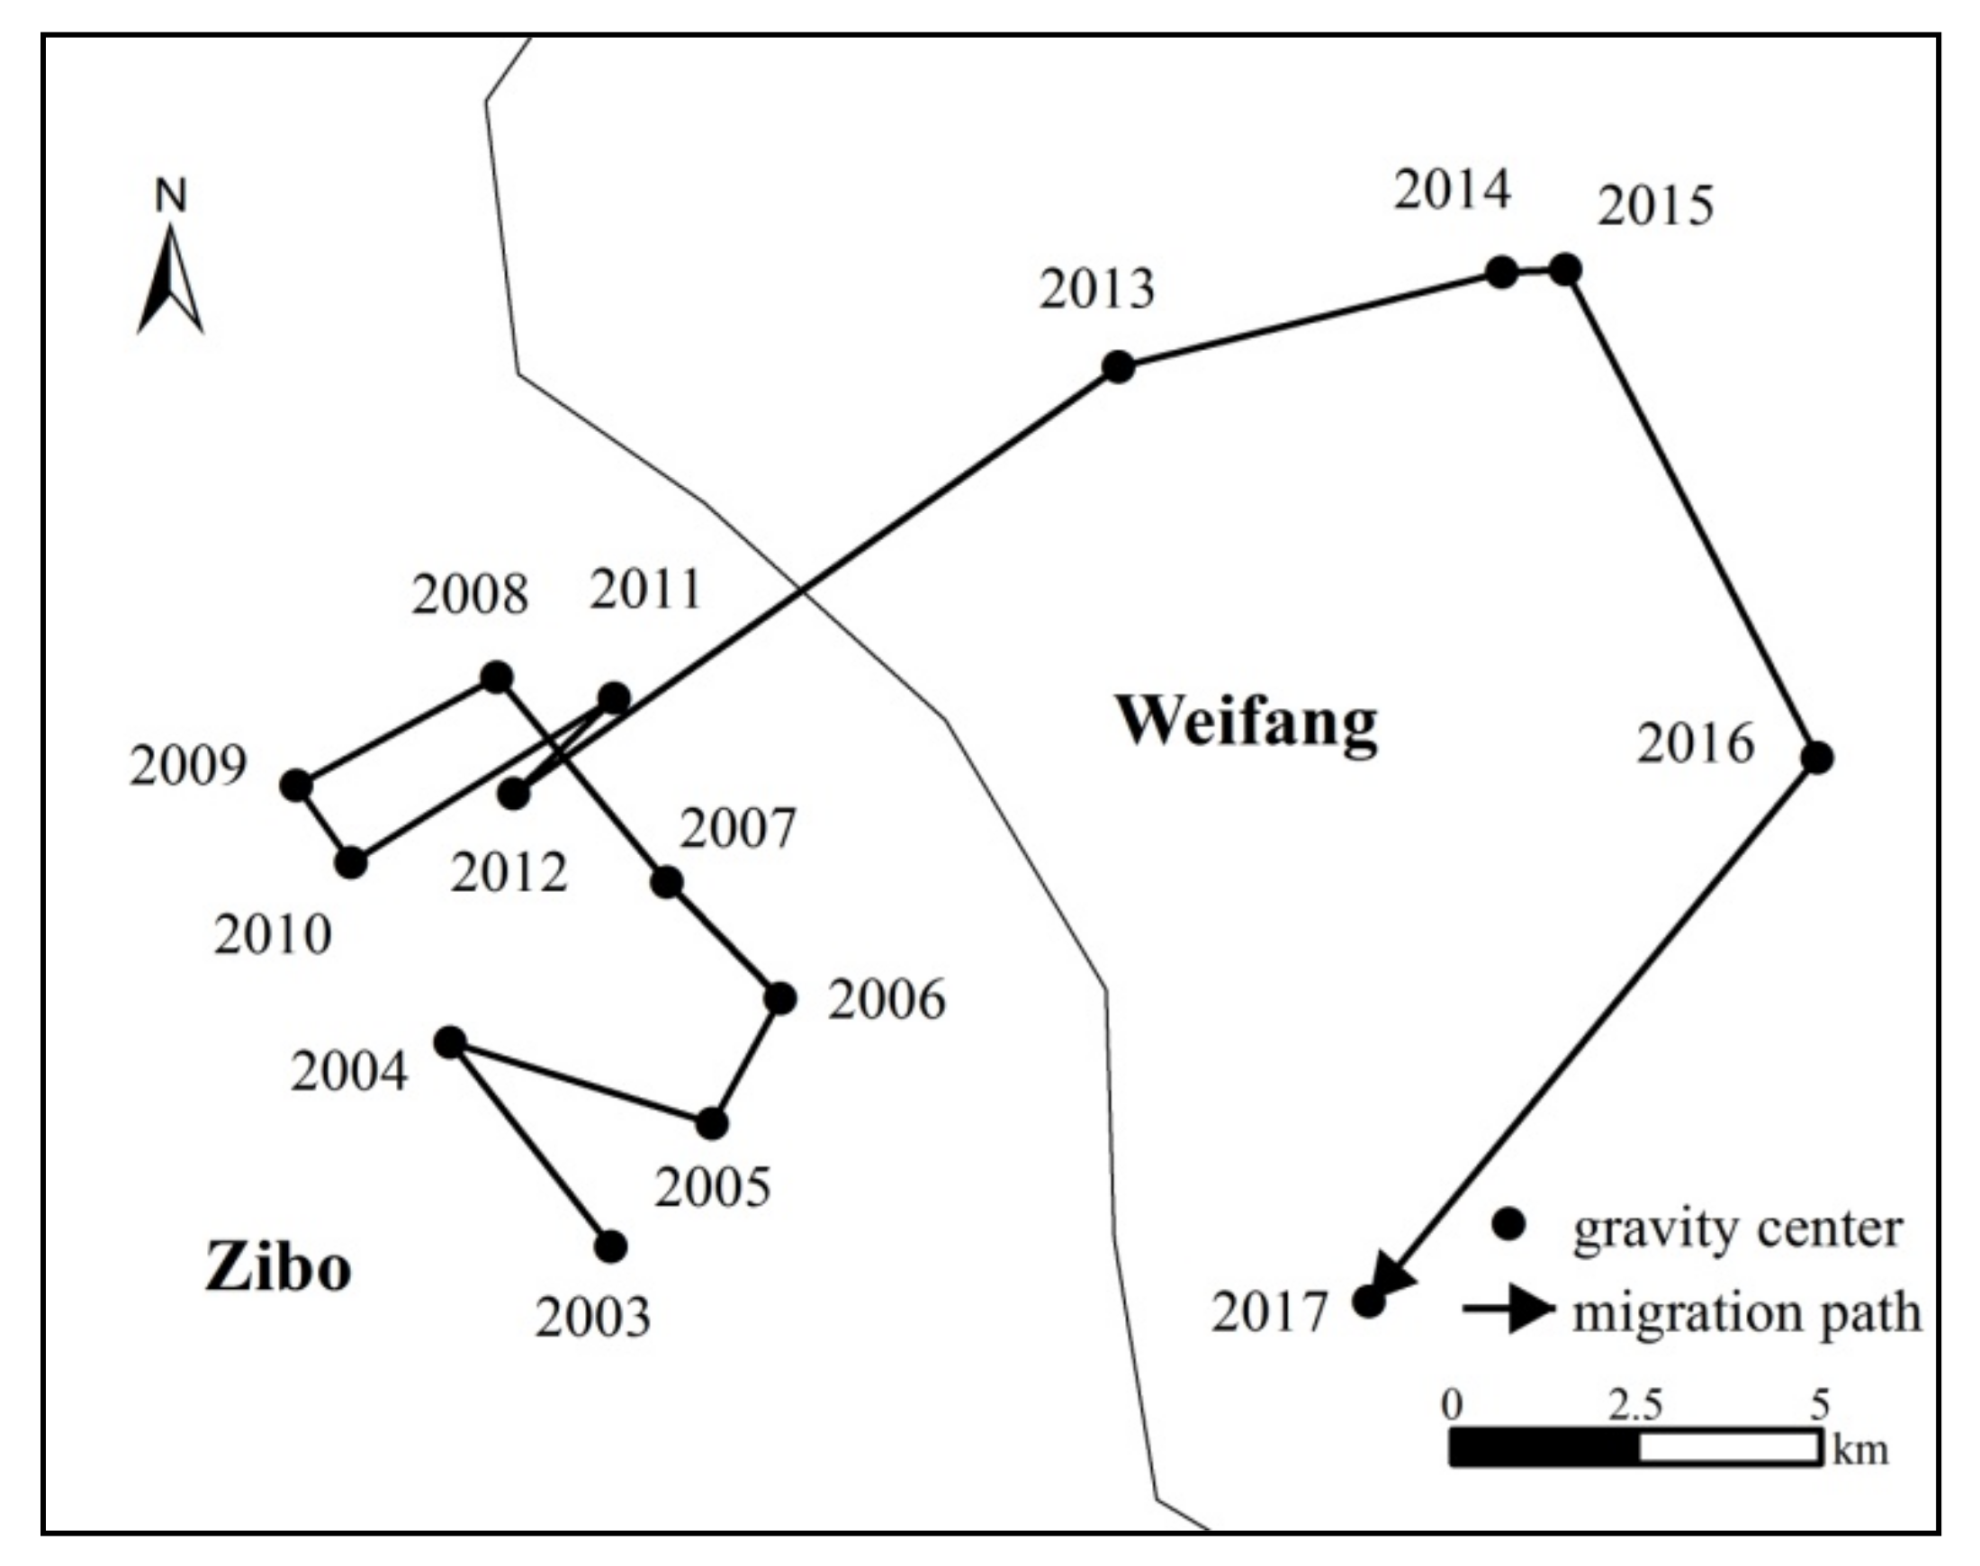
3.2. Spatial Evolutionary Characteristics of Shandong’s EPC Performance

Figure 6 displays the gravity center migration path of Shandong’s EPC performance from 2003 to 2017. It can be seen from Figure 6 that the gravity center of Shandong’s EPC performance has undergone slight spatial change from 2003 to 2017 but has obviously shown different phases. From 2003 to 2012, the gravity center of Shandong’s EPC performance was moving to the north in general, and the annual movement was relatively small. From 2012 to 2015, the gravity center of Shandong’s EPC performance was moving radically to the northeast, and the annual deviation increased largely. From 2016 to 2017, the gravity center shifted to the south by a large amount. The above analysis reflects that Shandong’s ecological construction has experienced the spatial optimization and improvement process successively in northern, eastern, southern and western regions.
Using ArcGIS, the regional EPC performance was divided into five grades, namely low (0–0.6500), relatively low (0.6501–0.7500), medium (0.7501–0.8500), relatively high (0.8501–0.9500), and high (0.9501–1.0000). The spatial pattern of regional EPC performance in 2003, 2010, and 2017 is presented in Figure 7. In 2003, the spatial pattern of regional EPC performance showed a concave characteristic as a whole. That isto say, EPC performance of sub-regions located on the western and eastern borders was relatively high, such as in Dezhou, Liaocheng, and Heze in the western region and Weihai, Qingdao, and Rizhao in the eastern region, while sub-regions of Jinan, Zibo, and Taian in the central region had lower values. EPC performance among different regions presents a high-low dispersion distribution characteristic without obvious spatial agglomeration. In 2010, with the implementation of the Shandong “One Body and Two Wings” regional development strategy and the "Yellow River Delta High-Efficiency Ecological Economic Zone Development Plan", the Yellow River Delta region, mainly covering Binzhou and Dongying, and the provincial capital metropolitan circle, centered on Jinan, became an important area of ecological construction. EPC performance of sub-regions such as Dongying, Binzhou, Jinan, Zibo, Taian, and Laiwu was significantly improved. In 2017, the sub-regions of high-value EPC performance extended and showed H-shaped-pattern characteristics on the whole. This may be promoted by the radiation effect of the Yellow River Delta region, the provincial capital metropolitan area, and the eastern coastal area. The EPC performance of sub-regions, such as Weifang, Yantai and Rizhao, were improved, and a spatial agglomeration zone of high-value EPC performance was forming on a larger scale. Additionally, the sub-region numbers of low, relatively low, medium, relatively high, and high-grade changed from 4, 3, 0, 0, and 10 in 2003 to 3, 1, 2, 1, and 10 in 2017. On the one hand, the sub-region numbers of low and relatively low-grade are continuously decreasing, reflecting the overall improvement of Shandong’s EPC performance; on the other hand, the sub-region numbers of low and relatively low-grade are still more than one-third, reflecting the relatively solidified characteristics of EPC performance. Therefore, Shandong still has far to go in building an ecological province.
Figure 8 displays the spatial distribution of hot and cold spots of Shandong’s EPC performance from 2003 to 2017. From 2003 to 2005, there were no significant spatial clusters of ecological construction, which proved the high-low dispersion spatial distribution characteristics of regional EPC performance. From 2006 to 2010, the spatial agglomeration of EPC performance became more apparent. The hot spots of ecological construction were distributed in Binzhou in the Yellow River Delta region, while the cold spots were distributed in the southern region. From 2011 to 2017, Yantai in the coastal area became another hot spot of EPC performance. However, with the increase of hot spots, the geographical scope of cold spots distributed in the southern region expanded and became more significant. Although the gravity center of Shandong’s EPC performance was moving to the south and west in general from 2016 to 2017, the southern and southwestern regions were still falling behind in Shandong’s ecological construction.

3.3. Influencing Factors of Shandong’s EPC Performance

The panel Tobit regression results of the entire province, as well as the eastern, central and western regions, are reported in Table 3. The results analysis is as follows.
The regression coefficient of pgdp is significantly negative, and that of spgdp is significantly positive in the entire province, as well as the central and western regions. This implies that there exists a significant U-shaped environmental Kuznets curve between regional EPC performance and economic development level, which means, when per capita GDP is small, EPC performance decreases with economic growth, while when per capita GDP reaches a certain level, EPC performance increases as economic growth. By calculating the inflection-point value, it is found that all the sub-regions have passed the inflection point and entered the rising stage of the U-curve. The regression coefficient of indus presents spatial heterogeneity. It is positive but insignificant in entire province and the western region and significantly positive, at 10%, in the eastern region, while it is significantly negative in the central region. As an ecological economic development leader of Shandong, the eastern region achieved higher EPC performance during industrial structure adjustment, while industrial-structure change reduced EPC performance of the western region. The regression coefficient of urban is negative and significant in the entire province and the western region. This implies that urbanization of the Shandong EPC is still in an extensive mode. The benefits of environmental governance from economies of scale brought by urbanization cannot offset the hugely aggravated resource consumption and environmental pollution caused by extensive urban construction. The impact of fdi on regional EPC performance is different among different regions. EPC performance is significantly and positively related to fdi in the central and western regions, which indicates that openness can bring advanced resource-saving and environment-friendly technologies and management experience to these regions and promote EPC performance through a demonstration effect and technology-spillover effect. However, in the eastern region, the regression coefficient of fdi is negative, at 10%. The regression coefficient of r & d is significantly positive, at 5%, in the entire province, as well as the eastern, central, and western regions, indicating that technical innovation is an important force to improve Shandong’s EPC performance globally. R & D investment can spur resource-saving and environmentally friendly products and technologies, which reduces ecological-resource consumption and environmental pollution and, thus, improves regional ecological efficiency. The regression coefficient of regu is significantly positive in the central region, which means that improving environmental-regulation intensity can increase regional EPC performance. However, the impact of regu on EPC performance is not significant in the entire province, nor the eastern and western regions.

4. Discussion

As the key measurement of progress towards regional sustainable development, regional eco-efficiency is an appropriate proxy of EPC performance. Based on total-factor eco-efficiency, we constructed a three-dimensional global SBM directional distance function to quantitatively measure Shandong’s EPC performance, which was followed by the empirical analysis of its spatial-temporal evolution characteristics and influencing factors using multiple methods.
During the study period, the EPC performance of Shandong as a whole generally presents a fluctuating rising trend, and the current pattern of regional EPC performance is imbalanced and presents a gradient-decreasing trend in the eastern, central, and western regions. Although the inefficiencies of ecological inputs and undesired outputs were gradually decreasing recently, the undesired-output inefficiency remains the largest obstacle for improving EPC performance, with ecological-resource input inefficiency following closely behind. This implies that Shandong Province still has a long way to go in environmentally friendly ecological construction. Comparatively speaking, the astern region has the lowest inefficiencies in ecological-resource inputs and undesired outputs, while the western region has the highest inefficiencies and has become the weakest area for Shandong in terms of ecological construction. The Theil index analysis also indicates that the main source of total regional differences has changed from intraregional differences from 2003 to 2012 to inter-regional differences from 2013 to 2017, which confirms the growing differences among the eastern, central and western regions. The evolutionary characteristics of club convergence within regions and the divergence among regions in terms of EPC performance is obvious. A spatial analysis of Shandong’s EPC performance reveals that, Shandong’s ecological construction has experienced the spatial optimization and improvement process successively in the northern, eastern, southern and western regions, and the spatial pattern of sub-regional EPC performance has evolved from characteristics of high- and low-dispersion distribution in the early stage into a significant H-type spatial agglomeration with high-value EPC performance mainly distributed in the Yellow River Delta area and the eastern coastal area. Binzhou in the Yellow River Delta area and Yantai in the astern coastal area have become the hot spots of Shandong’s EPC performance, while the southern region has become the cold spot. Recently, although Shandong pays more attention to the western and southern regions, carrying out the development program of the western economic rising belt and the southern economic circle, and with the gravity center of Shandong’s EPC performance moving to the south, the contradiction between ecological-environment protection and socioeconomic development remains prominent in the southern region. Shandong should make more effort in terms of ecological construction in the southern region, especially the southwestern region.
In our analysis of the influencing factors of Shandong’s EPC performance, Shandong’s EPC performance is positively related to technical innovation while negatively related to urbanization. However, the impact of industrial structure, openness, and environmental regulation on Shandong’s EPC performance presents spatial heterogeneity. This may be due to the positive and negative effects of industrial-structure change, attracting foreign direct investment, environmental regulation of environment, and economic growth of different regions, which have different environmental and socioeconomic conditions. Industrial-structure change induced by vigorously developing tertiary industry, on the one hand, can reduce resource consumption and environmental pollution, which can improve EPC performance; on the other hand, it may reduce labor productivity and resource-allocation efficiency, resulting in economic growth slowing down and thus restricting improvement of EPC performance [52]. One effect of attracting foreign direct investment is bringing advanced resource-saving and environment-friendly technologies and management experience to developing regions and increasing regional eco-efficiency, such as in the central and western regions. However, attracting foreign direct investment may have another effect in that it may reduce regional eco-efficiency by transferring high-pollution industry [53], such as in the eastern region. The impact of environmental regulation on EPC performance has the innovation-compensation effect and compliance-cost effect [51], which can increase or decrease EPC performance. In the central region, the innovation-compensation effect of environmental regulation is greater than the compliance-cost effect, so improving environmental regulation can increase regional EPC performance. However, in other regions, the effects of environmental regulation on EPC performance are not evident. As a result of that, due to the unbalanced regional development in Shandong province, the driving forces of EPC performance among different regions present obvious spatial heterogeneity. The improvements of R&D intensity and tertiary-industry proportion are important driving forces of the eastern region’s EPC performance. For the central region, the improvement of environmental regulation and R&D intensity can increase EPC performance, but the rising of the tertiary-industry proportion is unfavorable. For the western region, more foreign direct investment, which may bring resource-conserving and environment-friendly technology and improving R&D intensity, can promote EPC performance, but urbanization impedes it. Therefore, Shandong should adopt differentiated policies according to the different socioeconomic and environment conditions of the regions and realize delicacy management of regional ecological construction.
Finally, the concept of regional eco-efficiency places more emphasis on economic and environmental aspects, neglecting social aspects, which is also an element considered in the concept of sustainable development [27,54]. Furthermore, due to the difficulties in getting county-level resource and environment data, this paper uses the 17 administrative districts as evaluation units, which have large areas and irregular scales and are unfavorable for delicacy management. This also cannot meet the fine-scale requirements of the evaluation results [2]. Therefore, with the development of county-level quantitative data on resource consumption and environmental damage, especially the application of multisource remote sensing data, in future research, more effort should be with regards to scale selection, the evaluation model, and mechanism analysis, combing economic and social statistical data with multisource remote sensing data, in order to comprehensively reflect the process-pattern-mechanism features of the Shandong EPC.

5. Conclusions and Policy Implications

In this paper, we tried to investigate the spatial-temporal evolution characteristics and influencing factors of EPC performance since the Shandong EPC pilot was implemented in 2003. Based on the perspective of total-factor eco-efficiency and distinguishing between ecological inputs, non-ecological inputs, desired outputs and undesired outputs, the SBM directional distance function, specified as economic development, ecological resource conservation, and environmental-pollution reduction, was first proposed to measuring Shandong’s EPC performance. Then, the Theil index, the gravity center migration model, hot-spot analysis, and the panel Tobit model were introduced to explore the spatial-temporal evolution characteristics and influencing factors of EPC performance from 2003 to 2017. The main conclusions are as follows. The EPC performance of Shandong as a whole presents a fluctuating upward trend during the study period, and the current pattern of regional EPC performance is unbalanced and presents a gradient-decreasing trend in the eastern, central and western regions. The characteristics of club convergence within regions and divergence among regions in EPC performance is obvious, especially between the eastern and western regions. Spatial agglomerations of EPC performance increased gradually during the study period, with hot spots distributed in Binzhou and Yantai, and cold spots in the southern region. There exists a significant U-shaped environmental Kuznets curve between Shandong’s EPC performance and economic development level. Shandong’s EPC performance is positively related to R&D intensity while negatively related to urbanization. The impact of industrial structure, openness, and environmental regulation on Shandong’s EPC performance presents spatial heterogeneity.
Although Shandong’s EPC performance has been improved over the last 15 years since the pilot was implemented in 2003, further efforts are needed to address the challenges faced in Shandong’s ecological construction. Recently, the EPC performance of the eastern, central and western regions shows and obvious gradient-decreasing trend, and the western region has become a weak zone for the Shandong EPC. Different polices should be adopted for different regions according to their socioeconomic and environmental conditions. Besides that, Shandong should further rely on the cross-regional coordinated development strategy of "Two Districts, One Circle and One Belt" to promote joint governance of ecological construction through precise green technical and industrial support in the eastern, central and western regions. The eastern region should play a significant role in providing an impetus to surrounding regions. The central region should actively undertake industry transfer from the eastern region and exerts its transitional role in connecting the east and west. The western region should actively promote a regional-development model of transformation and reduce the disturbing effect of regional development on resources and the environment.
Decoupling economic development from natural-resource consumption and environmental emissions is the key to EPC, which relies on ecological innovation. China is now vigorously implementing an innovation-driven development strategy and has approved the establishment of the Shandong Comprehensive Experimental Zone of Conversion from Old to New Economic Driving Force, which is recognized as a national-level regional development strategy. Shandong should grasp the opportunity of constructing a national-level Experimental Zone of Conversion from Old to New Economic Driving Force and encourage enterprises to invest in resource-reserving and environmentally friendly technological research and development. Depending on regional eco-innovation, Shandong should make efforts to develop a high-quality eco-industry system and promote the fostering of green economic driving force, the transformation of extensive economic growth into green development driven by eco-innovation, and achievement a win-win situation between environmental protection and economic development.

Author Contributions

Conceptualization, Z.J. and F.G.; methodology, Z.J. and L.C.; resources, L.C.; writing—original draft preparation, Z.J.; writing—review and editing, F.G.; visualization, X.L. All authors have read and agreed to the published version of the manuscript.

Funding

This research was funded by the National Social Science Foundation of China (No. 20CGL037).

Institutional Review Board Statement

Not applicable.

Informed Consent Statement

Not applicable.

Data Availability Statement

Data was obtained from Shandong Provincial Bureau of Statistics.

Conflicts of Interest

The authors declare no conflict of interest.

References

  1. World Commission on Environment and Development (WCED). Our Common Future; Oxford University Press: New York, NY, USA, 1987; p. 8. [Google Scholar]
  2. Wang, Y.; Ding, Q.; Zhuang, D. An eco-city evaluation method based on spatial analysis technology: A case study of Jiangsu Province, China. Ecol. Indic. 2015, 58, 37–46. [Google Scholar] [CrossRef]
  3. Register, R. Eco-City Berkeley: Building Cities for a Healthy Future; North Atlantic Books: Berkeley, CA, USA, 1987; pp. 13–43. [Google Scholar]
  4. Shwayri, S.T. A Model Korean Ubiquitous Eco-City? The Politics of Making Songdo. J. Urban Technol. 2013, 20, 39–55. [Google Scholar] [CrossRef]
  5. Cugurullo, F. Urban eco-modernisation and the policy context of new eco-city projects: Where Masdar City fails and why. Urban Stud. 2016, 53, 2417–2433. [Google Scholar] [CrossRef]
  6. Li, Y.; Qiu, L. A comparative study on the quality of china’s eco-city: Suzhou vs Kitakyushu. Habitat. Int. 2015, 50, 57–64. [Google Scholar] [CrossRef]
  7. Yin, Y.; Olsson, A.; Hakansson, M. The role of local governance and environmental policy integration in swedish and chi-nese eco-city development. J. Clean. Prod. 2016, 134, 78–86. [Google Scholar] [CrossRef]
  8. Li, Y.; Commenges, H.; Bordignon, F.; Bonhomme, C.; Deroubaix, J.-F. The Tianjin Eco-City model in the academic literature on urban sustainability. J. Clean. Prod. 2019, 213, 59–74. [Google Scholar] [CrossRef] [Green Version]
  9. Xie, Z. Building Eco-Province with Scientific Development Sight. Environ. Prot. 2004, 2, 3–6. [Google Scholar]
  10. Zhu, G. Ecological province construction is a profitable probe and practice of regional sustainable development. Chin. J. Eco Agric. 2004, 12, 8–11. [Google Scholar]
  11. Wang, Y.; Sun, M.; Wang, R.; Lou, F. Promoting regional sustainability by eco-province construction in China: A critical assessment. Ecol. Indic. 2015, 51, 127–138. [Google Scholar] [CrossRef]
  12. Huang, Q.; Zeng, Y.; Jiang, Q. Progress and prospect of the study on “making great efforts to promote ecological civilization construction”. China Popul. Resour. Environ. 2015, 25, 111–120. [Google Scholar]
  13. Mi, Z.; Zeng, G.; Shang, Y.; Chen, S.; Zhu, F. The evaluation method and spatial pattern evolution of ecological civilization construction of chinese provinces. Econ. Geogr. 2016, 36, 15–21. [Google Scholar]
  14. Shen, M. Germination and sublimation of Xi Jinping’s ecological civilization thought. China Popul. Resour. Environ. 2018, 28, 1–7. [Google Scholar]
  15. Li, W. Sustainable development and eco-province construction. Impact Sci. Soc. 2004, 1, 14–21. [Google Scholar]
  16. SEPA. Guidelines on Building Eco-Province, Eco-City and Eco-County (Revised Version). Available online: www.mee.gov.cn (accessed on 18 October 2021).
  17. Wang, Y.; Shang, J. Application of ecological footprint analysis method to quantitative assessment of sustainable development—A case study of jilin in 2002. J. Arid Land Resour. Environ. 2006, 20, 146–150. [Google Scholar]
  18. Fu, G. Quantitative study of ecological sustainable development in Hainan ecological province: Application of ecological footprint method. Res. Agric. Mod. 2006, 27, 11–16. [Google Scholar]
  19. Tan, J.; Tang, M. The theory of ecological footprint and the eco-province construction of Jiangsu. J. Nanjing Norm. Univ. 2006, 29, 121–126. [Google Scholar]
  20. Sui, L.; Zhao, Z.; Jin, Y.; Guan, X.; Xiao, M. Dynamic evaluation of natural ecosystem service in Hainan Island. Resour. Sci. 2012, 34, 572–580. [Google Scholar]
  21. Li, G.; Yan, P.; Yuan, A. Study on the evaluation index system of ecological Shandong. Ecol. Econ. 2015, 31, 185–191. [Google Scholar]
  22. Yan, H.; Cao, Y.; Yu, Z. Quantitative analysis and evaluation of ecological construction of Heilongjiang province. J. Northeast For. Univ. 2008, 36, 76–77. [Google Scholar]
  23. Tian, S. Assessment on eco-province construction level in China. J. Arid Land Resour. Environ. 2017, 31, 14–20. [Google Scholar]
  24. Chu, Z.; Chen, W. Fuzzy synthesis evaluation of ecological construction in Heilongjiang province. J. Arid Land Resour. Environ. 2008, 22, 37–41. [Google Scholar]
  25. OECD. Eco-efficiency. Organization for Economic Co-operation and Development, Paris, 1998. Available online: https://www.oecd.org/officialdocuments/publicdisplaydocumentpdf/?cote=ENV/EPOC/PPC/T(98)5&docLanguage=En (accessed on 18 October 2021).
  26. Kuosmanen, T.; Kortelainen, M. Measuring Eco-efficiency of Production with Data Envelopment Analysis. J. Ind. Ecol. 2005, 9, 59–72. [Google Scholar] [CrossRef]
  27. Mickwitz, P.; Melanen, M.; Rosenström, U.; Seppälä, J. Regional eco-efficiency indicators—A participatory approach. J. Clean. Prod. 2006, 14, 1603–1611. [Google Scholar] [CrossRef]
  28. Yin, K.; Wang, R.; An, Q.; Yao, L.; Liang, J. Using eco-efficiency as an indicator for sustainable urban development: A case study of chinese provincial capital cities. Ecol. Indic. 2014, 36, 665–671. [Google Scholar] [CrossRef]
  29. Gusmao Caiado, R.G.; Dias, R.D.F.; Mattos, L.V.; Goncalves Quelhas, O.L.; Leal Filho, W. Towards sustainable development through the perspective of eco-efficiency-a systematic literature review. J. Clean. Prod. 2017, 165, 890–904. [Google Scholar] [CrossRef] [Green Version]
  30. Hu, Y.; Peng, J.; Liu, Y.; Wang, M.; Wang, Y. Review on regional eco-efficiency research. Sheng Tai Xue Bao 2018, 38, 8277–8284. [Google Scholar]
  31. Yang, L.; Ma, C.; Yang, Y.; Zhang, E.; Lv, H. Estimating the regional eco-efficiency in China based on bootstrapping by-production technologies. J. Clean. Prod. 2020, 243, 118550.1–118550.13. [Google Scholar] [CrossRef]
  32. Ding, P.; Tian, L.; Chen, B. Material Flow Characteristics and Evolution of Environmental-economic System in Hainan Province from 1990 to 2008. China Popul. Resour. Environ. 2011, 21, 66–71. [Google Scholar]
  33. Liu, B.; Li, L.; Xu, X. Research on regional eco-efficiency evaluation of Shandong province based on DEA cross-evaluation. East China Econo. Manag. 2010, 24, 38–41. [Google Scholar]
  34. Chen, X.; Sun, L. Differences of regional eco-efficiency based on super efficiency DEA model in Shandong province. J. Bohai Univ. 2015, 36, 90–96. [Google Scholar]
  35. Cai, J.; Xia, X.; Li, S. Regional eco-efficiency under the perspective of new urbanization according to panel data for 17 cities in Shandong. Resour. Sci. 2015, 37, 2271–2278. [Google Scholar]
  36. Zhou, Y.; Zong, K.; Hou, S. Regional eco-efficiency evaluation and spatial correlation analysis-a case study of Shandong. Acad. Forum 2016, 39, 78–81. [Google Scholar]
  37. WBCSD. Eco-Efficiency: Creating More Value with Less Impact. Available online: www.wbcsd.org (accessed on 18 October 2021).
  38. Guo, F.; Lv, X.; Yu, W.; Ren, J.; Chu, N. Performance evaluation and driving mechanism of green development in Shandong Province based on panel data of 17 cities. Sci. Geol. Sin. 2020, 40, 200–210. [Google Scholar]
  39. Andrés, J.; Mercedes, B.; José, A. Assessing eco-efficiency with directional distance functions. Eur. J. Oper. Res. 2012, 220, 798–809. [Google Scholar]
  40. Fukuyama, H.; Weber, W. A directional slacks-based measure of technical in efficiency. Socio Econ. Plan. Sci. 2009, 43, 274–287. [Google Scholar] [CrossRef]
  41. Wang, B.; Wu, Y.; Yan, P. Environmental Efficiency and Environmental Total Factor Productivity Growth in China’s Regional Economies. Eco. Res. J. 2010, 5, 95–109. [Google Scholar]
  42. Zhang, X.; Kanbur, R. What difference do polarisation measures make? An application to China. J. Dev. Stud. 2001, 37, 85–98. [Google Scholar]
  43. Mu, X.; Lei, L. A research on the economic center evolution and regional development equilibrium of northeast china. Econ. Geogr. 2011, 31, 366–370. [Google Scholar]
  44. Gao, J.; Xie, W.; Han, Y.; Zhang, Y.; Chen, J. The evolutionary trend and the coupling relation of gravity center moving of county-level population distribution, economical development and grain production during 1990–2013 in Henan province. Sci. Geol. Sin. 2018, 38, 919–926. [Google Scholar]
  45. Chen, W.; Li, J.; Zeng, J.; Ran, D.; Yang, B. Spatial heterogeneity and formation mechanism of eco-environmental effect of land use change in China. Geogr. Res. 2019, 38, 2173–2187. [Google Scholar]
  46. Song, M.; Song, Y.; An, Q.; Yu, H. Review of environmental efficiency and its influencing factors in China: 1998–2009. Renew. Sust. Energ. Rev. 2013, 20, 8–14. [Google Scholar] [CrossRef]
  47. Lv, W.; Hong, X.; Fang, K. Chinese regional energy efficiency change and its determinants analysis: Malmquist index and Tobit model. Ann. Oper. Res. 2015, 228, 9–22. [Google Scholar] [CrossRef]
  48. Feng, C.; Wang, M.; Liu, G.; Huang, J. Green development performance and its influencing factors: A global perspective. J. Clean. Prod. 2017, 144, 323–333. [Google Scholar] [CrossRef]
  49. Shan, H. Reestimating the Capital Stock of China: 1952–2006. J. Quant. Technol. Econ. 2008, 10, 17–31. [Google Scholar]
  50. Luo, N.; Li, J.; Luo, F. Empirical Analysis on the relationship between the China urbanization and regional eco-efficiency. China Popul. Resour. Environ. 2013, 23, 53–60. [Google Scholar]
  51. Li, S.; Chu, S.; Shen, C. Local government competition, environmental regulation and regional eco-efficiency. J. World Econ. 2014, 4, 88–110. [Google Scholar]
  52. Cai, F. Preventing the Inverse Kuznets effects of industry structure. Money China 2015, 4, 26–29. [Google Scholar]
  53. Wu, Y.; Feng, K.; Zeng, Z.; Xiang, G. Dynamic evolution, spatial spillover of FDI and regional eco-efficiency-a case study of Anhui province. East China Econo. Manag. 2017, 31, 16–24. [Google Scholar]
  54. Zhou, C.; Shi, C.; Wang, S.; Zhang, G. Estimation of eco-efficiency and its influencing factors in Guangdong province based on super-SBM and panel regression models. Ecol. Indic. 2018, 86, 67–80. [Google Scholar] [CrossRef]
Figure 1. Regional distribution of Shandong Province.
Sustainability 13 12068 g001
Figure 2. Shandong’s EPC performance in three regions from 2003 to 2017.
Sustainability 13 12068 g002
Figure 3. Inefficiency sources of Shandong’s EPC performance.
Sustainability 13 12068 g003
Figure 4. Inefficiency sources of EPC performance in three regions.
Sustainability 13 12068 g004
Figure 5. Theil index and decomposition of Shandong’s EPC performance from 2003 to 2017.
Sustainability 13 12068 g005
Figure 6. Gravity center migration path of Shandong’s EPC performance.
Sustainability 13 12068 g006
Figure 7. Spatial pattern of Shandong’s EPC performance in 2003, 2010, and 2017.
Sustainability 13 12068 g007
Figure 8. Spatial distribution of hot and cold spots of Shandong’s EPC performance from 2003 to 2017.
Sustainability 13 12068 g008
Table 1. Descriptive statistics of inputs and outputs.
CategoryVariableUnitObservationsMaxMinMeanStd.dev
Non-ecological inputslabor10,000 persons25572371339158
capital100 million yuan25526,97230150714469
Ecological inputsland1 square kilometers2555203414393
water1000 tons255112611193142
energy100 million KWH25547,394211512,88810,308
Desired outputsGDP100 million yuan255861217021251587
Undesired outputswastewater 1000 tons25556,732422023,91511,887
SO2 1 ton255233,78915,54194,94441,022
solid waste1000 tons255507864908688
Table 2. Descriptive statistics of influencing factors.
Influencing FactorsAbbreviationObservationsMaxMinMeanStd.dev
Economic development levelpgdp25512.01328.106910.40390.7365
Industrial structureindus25560.313.636.18068.1404
Urbanizationurban25572.5717.084344.535414.4954
Opennessfdi25517.77190.13281.98892.3252
Technological innovationr&d2556.43440.12952.87831.7363
Environmental regulationregu25598.942540.181.716420.1853
Table 3. Results of panel Tobit regression model.
Influencing FactorsEntire ProvinceEastern RegionCentral RegionWestern Region
pgdp−3.2057 ***−1.1244−4.6894 ***−1.4401 **
(−6.23)(−1.20)(−6.25)(−2.55)
spgdp0.1718 ***0.0750 *0.2415 ***0.0773 ***
(6.84)(1.76)(6.43)(2.82)
indus0.00130.0090 *−0.0108 ***0.0113
(0.28)(1.67)(−3.7)(1.14)
urban−0.0095 ***−0.0025−0.0005−0.0191 ***
(−3.23)(−0.74)(−0.07)(−4.16)
fdi0.0150−0.0165 *0.1011 *0.1386 ***
(1.55)(−1.91)(1.84)(6.08)
r&d0.0516 **0.0510 ***0.1049 **0.0663 **
(2.40)(2.81)(2.23)(2.03)
regu0.0020−0.00010.0064 **0.0017
(1.60)(−0.03)(2.14)(0.75)
cons15.8636 ***4.573723.1680 ***7.3355 **
(6.03)(0.89)(5.96)(2.62)
Note: symbols of ***, **, *, respectively, stand for 1%, 5%, and 10% significance levels, and the values in brackets are t statistical values.
Publisher’s Note: MDPI stays neutral with regard to jurisdictional claims in published maps and institutional affiliations.

