Abstract
Sustainable transport is gaining increasing importance in the political agenda. All modes of transport are obliged to reduce their emissions by both national and international governmental bodies, this requirement being even more necessary in the case of ports due to their traffic density and proximity to the city. The objective of this research is to estimate the atmospheric emissions generated during the operational phases, which are carried out close to Spanish ports. Due to its geographical position, Spain benefits from the routes of the Atlantic corridor and Mediterranean corridor belonging to the principal European transport network. The method uses detailed information about ship movements and ship categories (ship type, engine type, fuel type, etc.). From an environmental point of view, the results show that engines powered by Liquefied Natural Gas, compared to traditional fuels, save between 28% in the case of freight ships and 31% for passenger ships in the emission of CO2 into the atmosphere (52 tons per journey). On the other hand, the saving in NOx emissions is reduced by 87%. In addition, SOx emissions are completely eliminated and PM emissions are reduced to negligible values.
1. Introduction
The transport sector was responsible for approximately 59% of total end-use sector liquid fuel consumption in 2018 [1]. Specifically, the marine industry consumes over 11% of transport fuels [2,3,4]. There are various research projects proving that maritime transport generates a large amount of pollutants, which are released into the atmosphere [5,6,7,8]. Although maritime transport is not the main factor increasing climate change caused by Greenhouse Gas (GHG) emissions, the maritime transport sector should assess the options for achieving a reduction in anthropogenic GHG emissions so as to highlight it as an environmentally sound mode of transportation [9,10,11,12,13].
Many of the different emission types produced by ships are directly related to their fuel consumption. None more so than air emissions, which are generated during the combustion process [14]. Although the main engines (MEs) used for ship propulsion at sea create the most emissions, emissions from the smaller auxiliary engines (AEs), used for generating electricity on board, cannot be overlooked. Such emissions are produced when ships are stationary (with MEs shut down) and at berth in ports close to population centers. Once in port, the power requirement is generally lower but can still vary depending on the type of ship activity, for example, hoteling, loading operations. Since most marine emission studies have focused upon ME operation, there is currently a widespread lack of knowledge regarding AE operations and the associated emissions [15].
The main and auxiliary engines account for most of the emissions from vessels [16]. The evolution of global CO2 emissions from commercial shipping using traditional fuels has seen an increase from 360 million tons in 1990 (1.72% of the total) to 938 million tons in 2012 (2.61% of the total and 22.32% of transport emissions) [17]. Emission scenario calculations up to the year 2050 reveal that a significant increase is to be expected in the future if ship emissions remain unabated, with CO2 reduction appearing to be the most challenging [12,18]. CO2 emissions from international shipping are based on the bunker fuels sold. While it may be said that this is not the amount of CO2 being emitted in Spanish ports, no exact figures have been available until now. For SO2 and NOx emissions from marine fuels, the same is true: no specific data for Spain were available.
Ship emission externalities refer mainly to acidification and eutrophication, and their impact on global warming and human health. It is worth highlighting the health problems caused by the high concentration of CO2 in port workers, both in open and closed spaces, since the air conditioning systems take polluted air from the outside to be used as fresh air, reducing the predicted percentage of dissatisfied (PPD) [19,20].
In order to regulate the level of pollutants, international regulations are increasingly strict, limiting NOx and SOx emissions and particulates from ships [21,22]. International maritime regulation is carried out through conventions from the International Maritime Organization (IMO), through the IGF [23] and IGC [24] codes, ISPS [25] and IBC [26] conventions, as well as the standards of the International Organization for Standardization [27]. In line with the MARPOL international convention, Sulfur Emission Control Areas (SECAs) [28] have been created. The limit of 0.1% sulfur content in marine fuels is applicable from 1 January 2015 [14,29,30,31]. According to Annex VI of Marpol [32,33], the regulations will be applicable not only to new builds but also to existing ships [34].
There are three options to ensure that maritime transport complies with the SECA emission restrictions: the use of low-sulfur fuels, the installation of catalytic converters (SCR) or scrubbers to cleanse exhaust gases in existing engines, and the use of alternative fuels such as biofuels, natural gas, methanol, hydrogen and so forth [35,36]. Each technology has advantages and disadvantages [37,38,39,40,41]. The first option, using low-sulfur fuels, has the advantage of being viable for both new vessels and the adaptation of old ones, and it requires less engine maintenance. The second option, mainly for ships that are in use today, is the installation of scrubbers. This technology is also viable for both new vessels and for adapting old ones. However, the drawbacks, other than the price that it entails (it may amount to 3 million euros, depending on the type of vessel), are being forced to moor the ship in the shipyard for the time it takes to install it, the high demand for space, increased weight of the vessel and production of hazardous liquid waste [42,43,44,45,46]. Furthermore, the reduction of NOx is insignificant [47]. The third option is to use alternative fuels. Currently, mainly two types of fuel are used in shipping: HFO (Heavy Fuel Oil) and MDO (Marine Diesel Oil), the use of MGO (Marine Gas Oil) being limited to the engine start phase and port stays. In the open sea, in general, HFO is used, which causes more pollution than MDO, whilst local and coastal navigation generally uses MDO, which is more expensive than HFO. Liquefied Natural Gas (LNG) emerges as an alternative to HFO and MDO [48,49].
The European Union has clearly opted for LNG as a short and medium-term solution for maritime transport [22,50]. The price of LNG is closer to that of HFO but it produces less pollutant emissions than MDO. The ecological interest in LNG is evident in view of the comparison of the ecological footprint with that of MDO and, above all, with that of HFO [51]. LNG is becoming increasingly popular as a marine fuel as emission regulations become more stringent [52].
One factor that is delaying the development of LNG consumption by ships is the lack of supply infrastructure in all ports [47,53,54], in addition to other factors such as transportation of large quantities of LNG under IMDG Code. However, gas supply companies are already making significant investments in order to adapt the port terminals of the most developed countries [55]. Currently, Spain moves 45,000 LNG tankers per year and has 10,900 km of pipelines [56].
The current notion of the port tends to support the integration of the port and the city [57,58,59]. Due to the fact that many major ports are also major cities, the harbor and near-harbor emissions of seagoing ships that influence local air quality may directly affect a large population [60,61,62]. While the long-range transmission of air pollutants is important, pollution is generally more harmful—relative to the emitted amounts—when it is emitted near vulnerable receptors.
Some years ago, numerous results indicated that air pollution levels in port areas were comparable with those of land. However, the current situation is worse because emissions from ships have significantly increased due to the rise in international maritime trade in recent years [16,30,63,64,65,66,67]. Emissions from liquefied natural gas (LNG) vehicles play an increasingly important role in urban air quality, due to fuel transition from gasoline/diesel to alternative fuels [68].
Due to its geographical position, Spain will benefit from the scheduled Atlantic and Mediterranean Core Network Corridors (Figure 1) belonging to the future Trans European Transport Network [58,59,60,61,62,63,64,65,66,67,69]. Some Spanish ports are suffering serious air pollution [56]. The case of Spain is of particular interest mainly due to the fact that the dense ship traffic within Spanish ports and its associated exhaust emission pollutants have a direct impaction highly populated cities (the same as in many other countries). As such, quantifying the effect of exhaust emissions from ships will become extremely important.
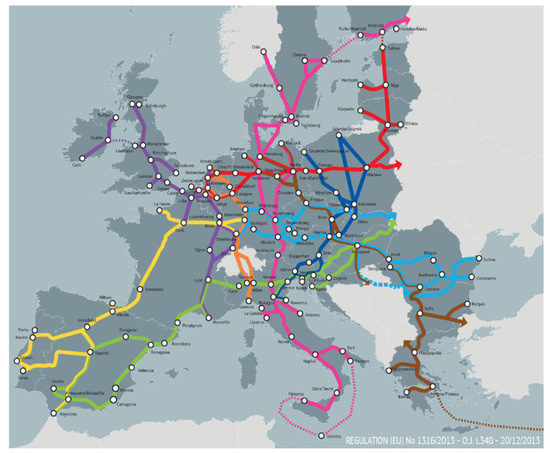
Figure 1.
Core Network Corridors.
Limited knowledge is available concerning the exhaust emissions from ship engines in Spanish ports and the effects of these emissions on air quality in nearby urban regions. This issue is of growing significance because of the increased regulation of land based emissions, the limited regulation of shipping emissions and planned increases in shipping activity [10].
The aim of this study is to produce a model capable of providing a comprehensive analysis of ship engine exhaust emissions in a region, which features numerous ports. The method uses detailed information concerning ship movements and ship categories (ship type, fuel type, etc.) together with the associated fuel consumption figures and emission factors. The present methodology will facilitate assessment of whether ship emissions have significant health or other environmental impacts and whether the introduction of ship emission control measures is justified. Knowledge of the proportion of emissions from the various operating modes and machinery types will also facilitate analysis. The study seeks to inform future policy making with regard to regional transportation systems, allow assessment of the effectiveness of emission mitigation measures, and enable accurate modelling of the contribution of ship emissions to the impact of climate change.
2. Materials and Methods
As mentioned above, this research focuses on the port environment. Consequently, the phases of navigation analyzed are the Approach (sailing on approach to port), Maneuver (sailing from the port to the loading bay) and Hoteling (performing loading/unloading and maintenance operations). For each of these phases, the intention is to obtain the specific consumption for both propulsion engines and auxiliary engines and the pollutant emissions released by each into the atmosphere, placing particular emphasis on CO2, due to its relationship with the greenhouse effect.
In order to achieve this, the average installed power of ship engines was obtained according to the vessel type.
In parallel to the above, the time required for the maneuvers in the port environment was calculated as well as the percentage of power used by ship engines in performing them.
Based on the previous results, the fuel consumption is calculated. Two cases of ship propulsion have been studied, in accordance with the engine fuel used:
- Case 1: Main engines are fueled by HFO and auxiliary engines by MDO.
For the case of the propulsion system of a ship powered by fuel, a set-up powered directly by a reciprocating engine was chosen.
- Case 2: Main and auxiliary motors are powered by LNG.
In the case of the propulsion system of a ship powered by LNG, a Dual-Fuel set-up was chosen since this is a modern technology, operating only in gas mode (injecting 1% of diesel).
Using the fuel consumption figures obtained in the two cases above, the pollutant emissions are obtained for each type of vessel.
2.1. Type of Vessels Analyzed
In carrying out this research, the classification of ships performed by TRENDS and EUROSTAT depending on the cargo they carry has been taken into account [70].
Mainly freight ships have been selected since about 90% of the volume of the world’s goods trade is transported by sea [71]. Among the freight ships, the following types have been chosen:
- Tanker (liquids and gases)
- Bulk Carrier (solids)
- General Cargo (representing a wide variety, from reefers to specialized vessels and special transport)
- Container Ship (containers)
- RO-RO (roll-on, roll-off of wheeled cargo).
Regarding the transport of people, the Passenger Ship has been chosen as the most representative vessel.
2.2. Installed Engine Capacity
The data used in this research concerning the power of the main and auxiliary engines, engine speed and the type of vessel, have been provided by the Spanish Port Authorities [72]. This is a public entity, under the authority of the Spanish Ministry of Public Works, with overall responsibility for the entire state-owned port system. It is in charge of implementing the Spanish Government’s port policy and coordinating and controlling the efficiency of the port system, made up of 28 Port Authorities [72], which administer the 46 ports of public interest. Consequently, the information that it possesses is sufficiently reliable given that it includes the port approach maneuvers performed by ships at the main Spanish ports. The average power installed on-board is shown in Table 1.

Table 1.
Average power of the main and auxiliary engines.
2.3. Time Spent in the Port Environment
The duration of the Approach, Maneuver and Hoteling phases is variable since it depends on the size of the ship and the port considered. From the data provided by the Spanish port authorities, we calculated a mean value of approximately two hours for the Approach phase and one hour for the Maneuver phase, regardless of the type of vessel.
The average time spent in the docks varies depending on the type of vessel. During this phase, the auxiliary engines must generate electricity for consumption in the vessel. The results shown in Table 2, were obtained from the mean values provided by the California Air Resources Board [73].
Table 2.
Average time spent during Hoteling.
2.4. Power Used by Engines Depending on the Operational Phase
The power required by the engine will vary depending on the phase that the vessel is in. The percentage of rated power required by the engine in each of the operational phases analyzed in this research is shown in Table 3. The values in the table were obtained from Enertrans [74].
Table 3.
Percentage of total power used in vessel operations.
2.5. Fuel Consumption of the Engines
Fuel consumption varies mainly depending on the type of engine, its speed and the operational phase that the boat is in. This value has been declining over time due to improved engine performance.
The average calorific value taken into account in this research is: 40,600 kJ/kg for Heavy Fuel Oil, 42,700 kJ/kg for Marine Diesel Oil and 49,200 kJ/kg for LNG [66,71].
2.5.1. Main Engine
The consumption values used in this research are shown in Table 4 [74]. The following are specific consumption values; obtained for propulsion engines by ship type and phase, on a Fuel Oil consumption basis.
Table 4.
Specific consumption, 2016.
These values are slightly lower than those obtained for propulsion engines by ship type and phase in previous years [32,73]. The reason is the improvement of energy efficiency in engines.
2.5.2. Auxiliary Engines
The estimated consumption for auxiliary engines has been obtained from engines manufactured by Wärtsilä [75] and MAN [76], in various models. The average consumption for auxiliary engines in 2014 could be estimated at 180 g/kWh (fuel oil), 170 g/kWh (diesel) and 126 g/kWh (LNG) [38,77].
When these values are compared with previous research, an improvement is also seen in the energy efficiency of the engines [32,74].
2.6. Pollutant Emissions of Engines
In order to calculate the emissions from ship engines we used the following expression, Equation (1) [33]:
E = P × LF × A × EF.
The emission factor is in terms of emissions per unit of energy from the engine. It is multiplied by the power needed to move the ship in a particular activity.
In a detailed inventory, emissions for each mode (approach, maneuver, and hoteling) during a call should be calculated using ship type, actual speed, engine power, load factor, time in that mode and emission factors for propulsion and auxiliary engines.
The pollutants analyzed in this research are: nitrogen oxides (NOx), sulfur oxides (SOx), carbon dioxide (CO2) and particulate matter (PM). The emission factors considered in this work depending on the type of fuel are shown in Table 5 [78].
Table 5.
Emission factors depending on the type of fuel.
3. Results and Discussion
3.1. Power Demand Depending on the Operating Phase
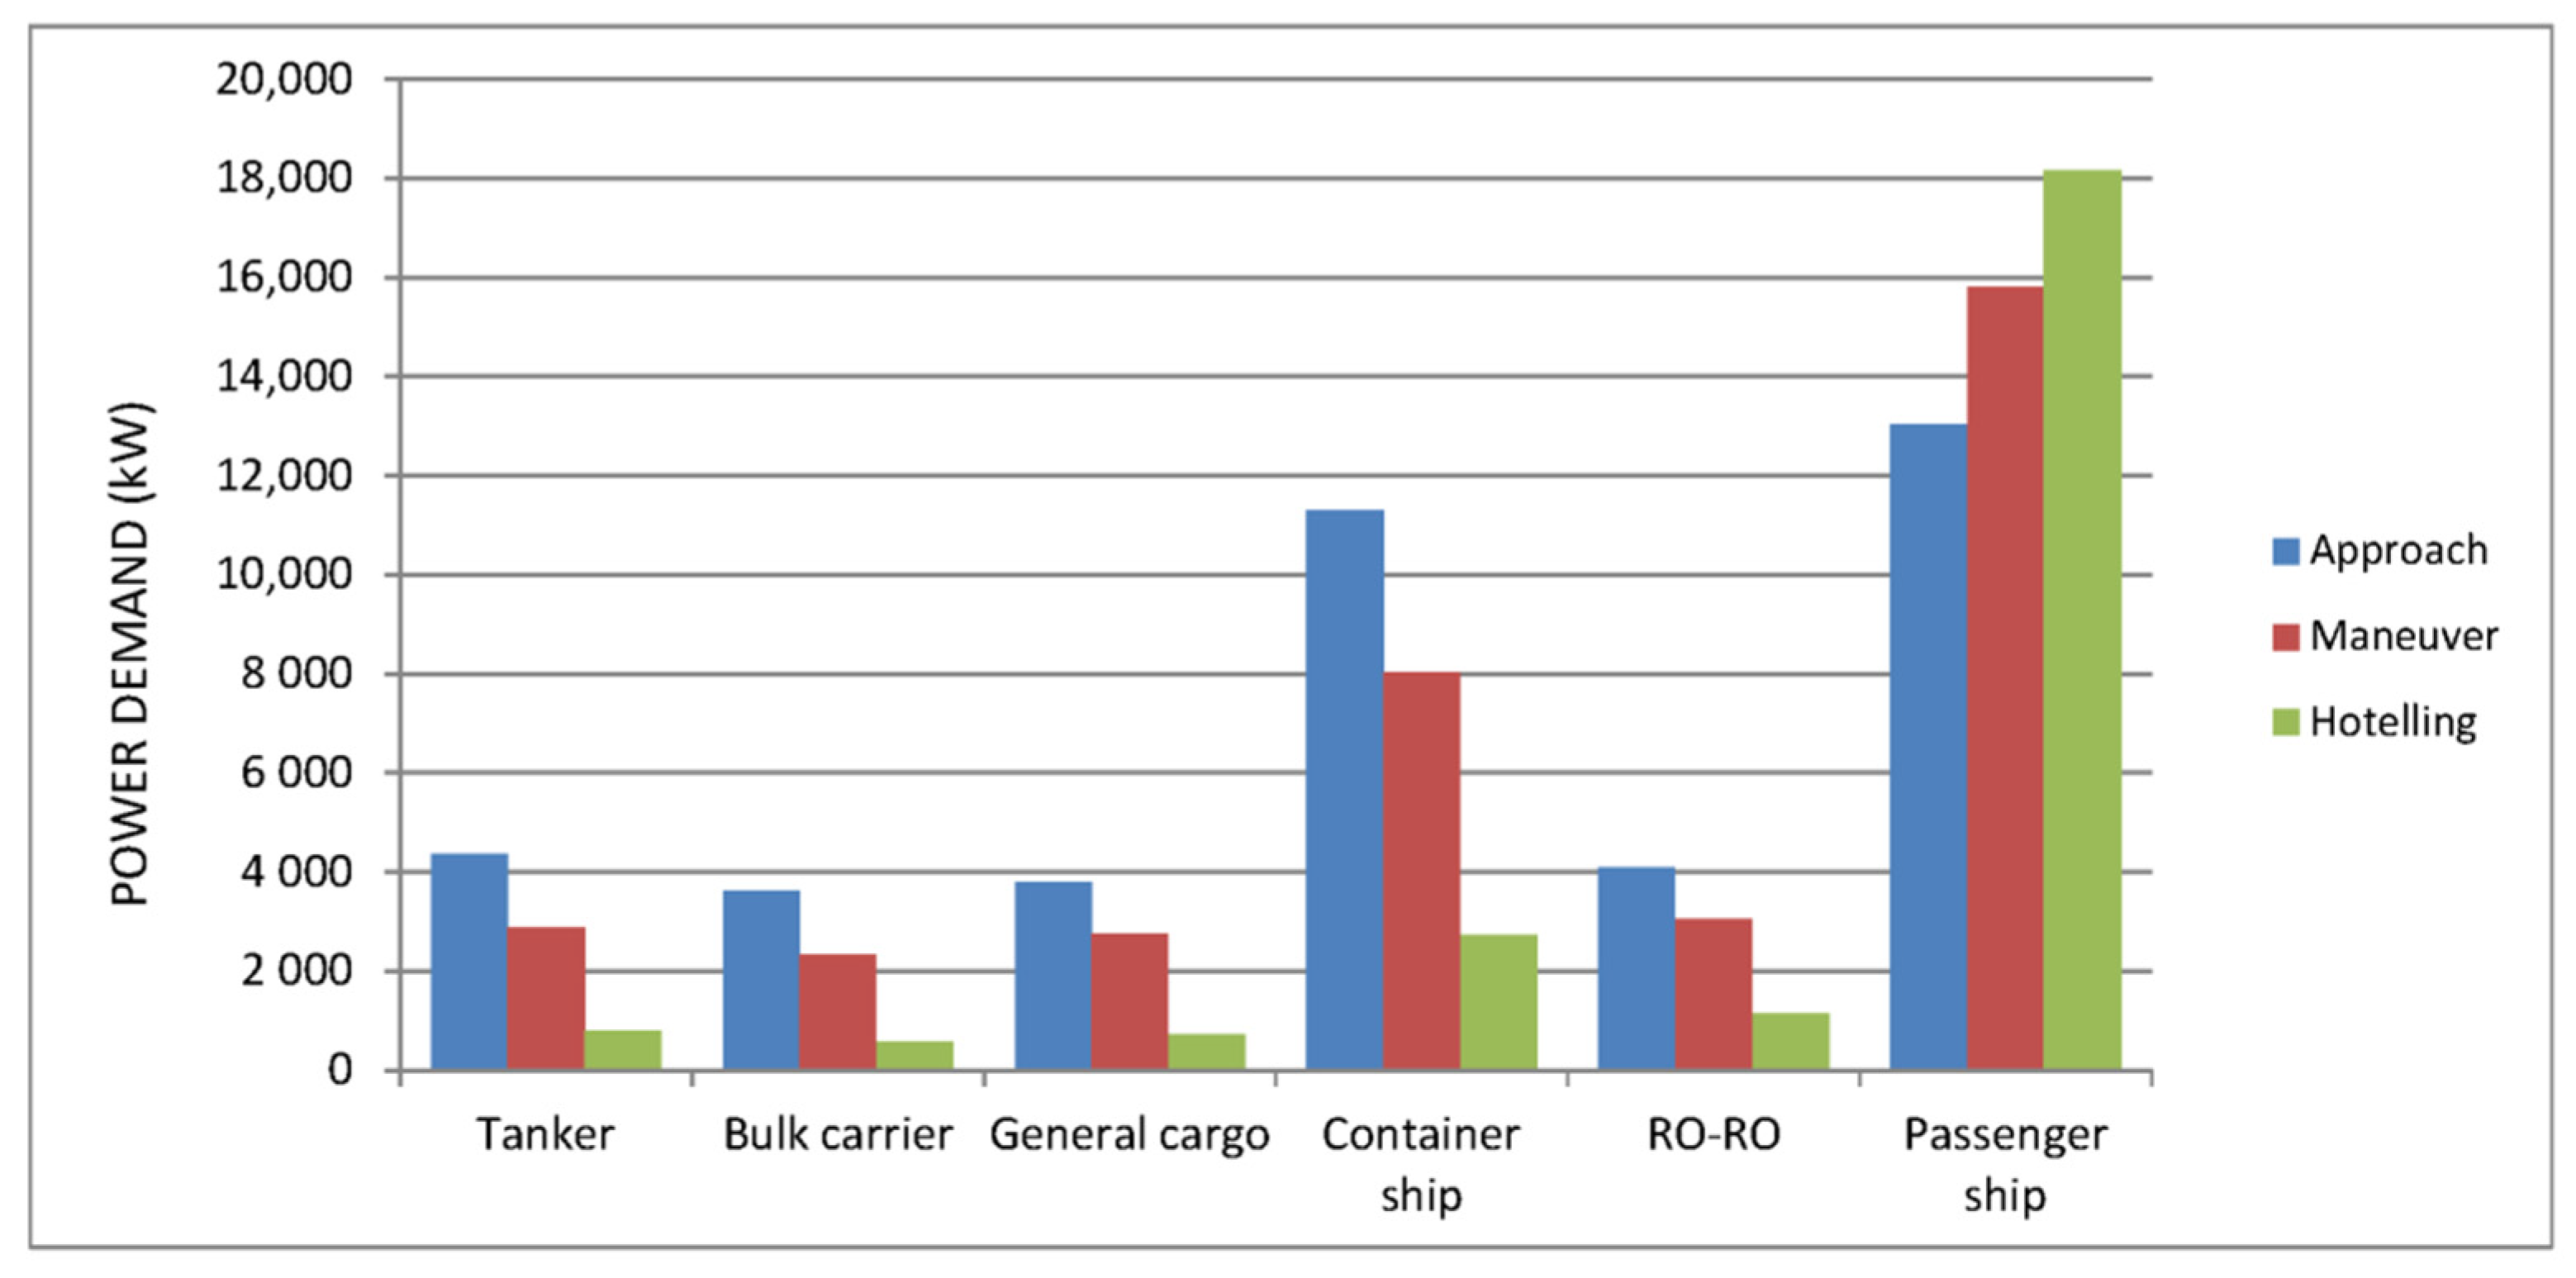
Applying the percentage to the engine power, the actual power it uses is obtained (Figure 2).
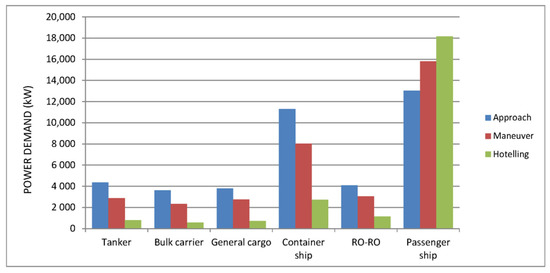
Figure 2.
Power demand by vessel type depending on the operating phase.
Jointly analyzing the three operational phases carried out in the port environment (Approach, Maneuver and Hoteling), the results show a higher power demand by the passenger ship compared with other vessels (53% higher). This is mainly due to the greater use of auxiliary engines in the port environment together with the associated increased power demand.
Another fact worth noting is the little power demanded in the hoteling phase for freight transport ships compared with passenger transport ships (85% increase). The fundamental reason is that the latter must be able to address the needs of passengers in port and, to a lesser extent, those of the crew. This demand is considerably reduced in a freight ship since only the crew’s needs must be met.
3.2. Fuel Consumption
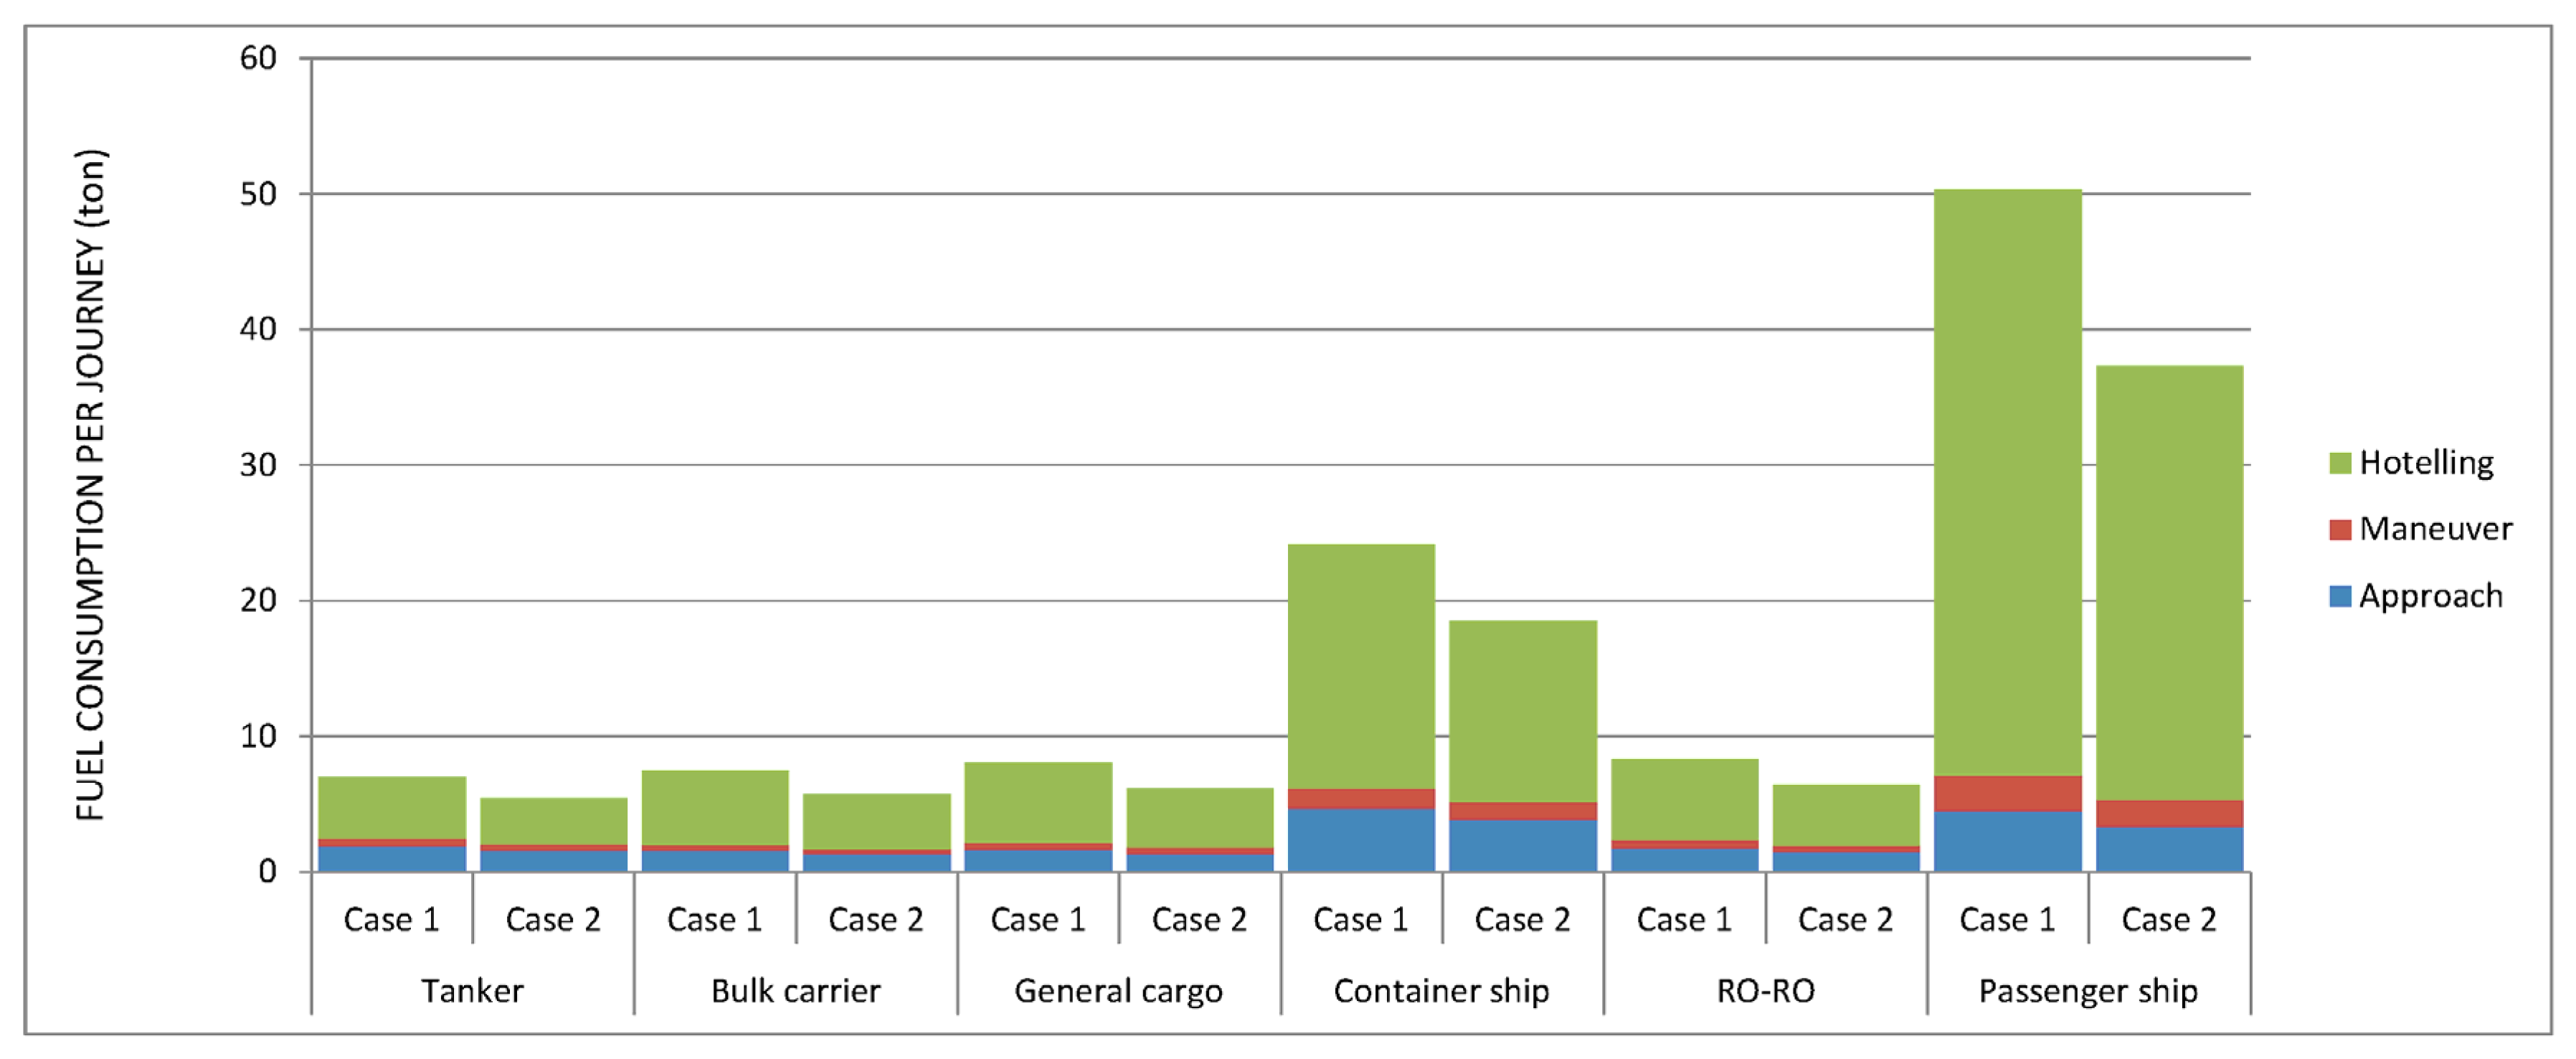
According to the previous data (percentage of power used and specific engine power consumption), the fuel consumption obtained is shown in Figure 3.

Figure 3.
Fuel consumption for the two cases analyzed.
In all of the vessel types analyzed, the highest consumption occurs in the hoteling phase (between 62% and 75% of the total). The higher values for passenger ships are due to the higher power demand of its engines along with the longer duration of the hoteling phase when compared to freight ships.
If the two cases analyzed are compared, savings in fuel consumption vary between 23% and 26%, depending on the type of vessel. In all vessels, the biggest saving is in the hoteling phase, in other words, where the auxiliary engines demand greater power.
3.3. Pollutant Emissions Depending on Fuel Type
Of the four elements analyzed (NOx, SOx, CO2 and PM), a decision was made to study CO2 emissions separately, since the quantities of this pollutant are far superior to the rest. Figure 4 shows the NOx, SOx and PM emissions for the two cases analyzed.
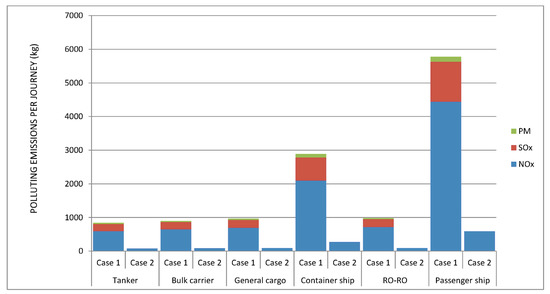
Figure 4.
Pollutant emissions of NOx, SOx and PM for the two cases analyzed.
Overall, in view of the results obtained, it can be stated that the reduction of emissions in case 2, compared to case 1, is significant.
Particularly noteworthy is the virtual disappearance of SOx and PM observed in case 2. This is due to the use of LNG as fuel compared to traditional ones (HFO and MDO). Such a drastic reduction in sulfur emissions makes it easier for vessels with LNG engines to operate within ECAs and SECAs.
With regard to NOx, in case 2 this is reduced by between 86.99% and 87.07%, depending on the type of vessel analyzed. This implies a considerable reduction of the tax levied by the governments of countries that penalize the emission of nitrogen oxides and the possibility to operate in ECAs.
Figure 5 shows the CO2 emissions for the two cases analyzed.
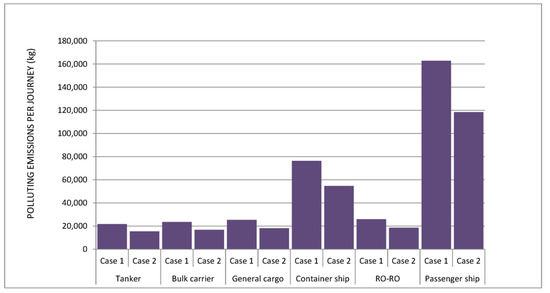
Figure 5.
Pollutant emissions of CO2 for the two cases analyzed.
The reduction of CO2 emissions in case 2 as compared to case 1, ranges between 28.38% and 28.85% for the case of freight ships and reaches 31.42% for passenger ships. Therefore, the use of alternative fuels, such as LNG as in this case, can break the current trend of a gradual increase in emissions of this pollutant in maritime transport (almost doubled in the last twenty years) [79,80].
This reduction in CO2 emissions improves the energy efficiency index (EEDI) of ships. This is important since the IMO and EU agreed to establish monitoring systems for CO2 emissions on ships of more than 5,000GT starting in 2018. Vessels with a low EEDI are now subject to strong penalties, through tax payments, in addition to not being able to navigate in certain areas.
It is important to stress the magnitude of the CO2 emission values obtained due to their direct impact on people’s health. These are CO2 emissions which are discharged directly into the harbor, in other words, very close to the city. A change of fuel from HFO and MDO to LNG in the propulsion engines of the passenger ship analyzed (case 2 compared to case 1) reduces CO2 emissions in the port environment by 52 tons per journey.
This amount of pollutant is similar to that emitted annually by nine houses with an area of 100 m2 each (assuming that the boiler for heating and hot water is powered by natural gas) [81,82] or that emitted annually by the ventilation of a car park with 3000 spaces (assuming a level of CO2 concentration in line with the current regulations lower than 50 parts per million-and a journey inside of 120 km per vehicle per year) [19].
By ship type, passenger ships are the main contributors: they represent more than 50% of the atmospheric emissions (52% for CO2; 52% for SO2, 56% for NOx and 51% for PM). It is also worth highlighting the emissions from container ships, which represent more than 26% of the total. On the other hand, tanker and bulk carrier vessels represent about 17% of all emissions [3].
4. Conclusions
Maritime transport generates a large amount of pollutant emissions worldwide. Of these, those emitted in the port environment, although not representing the largest amount, are those that have a greater impact on the health of the population. Furthermore, current port design tends to incorporate this facility in the city; making more comprehensive monitoring of these emissions necessary.
Due to its geographical position, Spain will benefit from the scheduled Atlantic and Mediterranean Core Network Corridors belonging to the future Trans European Transport Network. In this context, this paper presents the contribution of Spain to ship exhaust emissions. The case of Spain is of particular interest mainly because the dense ship traffic within the Spanish ports directly imposes the impact of its exhaust emission pollutants upon highly populated cities.
In this research, various types of vessels powered by traditional fuels (HFO and MDO) were analyzed alongside the use of liquefied natural gas (LNG) during the operational phases taking place near the port (Approach, Maneuver and Hoteling).
A model has been developed for the calculation of ship engine exhaust emissions in Spanish ports using data to describe ship movements and operating modes. The method utilizes detailed information on ship movements and ship categories (ship type, fuel type, etc.) in conjunction with corresponding fuel consumption figures and emission factors.
Jointly analyzing the three operational phases carried out in the port environment, the results show a higher power demand by the passenger ship compared to other vessels (53% higher). Another fact worth noting is the little power demanded in the hoteling phase for freight transport ships compared with passenger transport ships (85% increase).
In all of the vessel types analyzed, the highest consumption occurs in the hoteling phase (between 62% and 75% of the total). If the two cases analyzed are compared, savings in fuel consumption vary between 23% and 26%, depending on the type of vessel.
The savings achieved in the emission of CO2 into the atmosphere vary between 28% for the case of freight ships and 31% for passenger ships. Specifically, this represents 52 tons per journey. This amount of pollutant is similar to that emitted annually by nine houses with an area of 100 m2 each (assuming that the boiler for heating and hot water is powered by natural gas) or that emitted annually by the ventilation of a car park with 3000 spaces (assuming a level of CO2 concentration in line with the current regulations).
On the other hand, the saving in NOx emissions is reduced by 87%. In addition, SOx emissions are completely eliminated and PM emissions are reduced to negligible values.
By ship type, passenger ships are the main contributors: they represent more than 50% of the atmospheric emissions (52% for CO2; 52% for SO2, 56% for NOx and 51% for PM). It is also worth highlighting the emissions from container ships, which represent more than 26% of the total. On the other hand, tanker and bulk carrier vessels represent about 17% of all emissions.
This research has tried to serve as a basis for the future policy making with regard to regional transportation systems, to allow assessment of the effectiveness of emission mitigation measures, and to enable accurate modelling of the contribution of ship emissions to the impact of climate change.
Author Contributions
Conceptualization, T.G.-L.; Writing—original draft, T.G.-L. and A.V.-V.; Methodology, T.G.-L.; Investigation, T.G.-L. and A.V.-V.; Validation, T.G.-L.; Formal analysis, T.G.-L. and A.V.-V.; Data curation, T.G.-L. and A.V.-V.; Writing—review & editing, T.G.-L. and A.V.-V.; Supervision, T.G.-L. and A.V.-V. All authors have read and agreed to the published version of the manuscript.
Funding
This research received no external funding.
Institutional Review Board Statement
Not applicable.
Informed Consent Statement
Not applicable.
Data Availability Statement
Not applicable.
Acknowledgments
Thanks to the Spanish port authorities for providing us with the data to carry out this research. The data for the different vessel operations has been obtained after consulting the port authorities of the ports analyzed.
Conflicts of Interest
The authors declare no conflict of interest.
Abbreviations
| A | Activity (hours [h]) |
| AE | Auxiliary Engine(s) |
| E | Emissions (grams [g]) |
| ECA | Emission Control Area |
| EEDI | Energy Efficiency Design Index |
| EF | Emission Factor (grams per kilowatt-hour [g/kWh]) |
| CO2 | Carbon dioxide |
| GT | Gross tonnage |
| HFO | Heavy Fuel Oil |
| IGC | International code for the construction and equipment of ships carrying liquefied gases in bulk |
| IGF | International code for gas and low-flashpoint fuels |
| IMO | International Maritime Organization |
| LF | Load Factor (percentage of vessel’s total power [%]) |
| LNG | Liquefied Natural Gas |
| MDO | Marine Diesel Oil |
| ME | Main Engine(s) |
| MGO | Marine Gas Oil |
| NOx | Nitrogen Oxides |
| P | Maximum Continuous Rating Power (kilowatts [kW]) |
| PM | Particulate Matter |
| Ro-Ro | Roll on–Roll off ship |
| SCR | Selective Catalytic Reduction |
| SECA | Sulfur Emission Control Area |
| SOx | Sulfur Oxides |
References
- U.S. Energy Information Administration. International Energy Outlook 2019; Energy Information Administration: Washington, DC, USA, 2019.
- Lister, J.; Poulsen, R.T.; Ponte, S. Orchestrating transnational environmental governance in maritime shipping. Glob. Environ. Chang. 2015, 34, 185–195. [Google Scholar] [CrossRef] [Green Version]
- Hulskotte, J.H.J.; Denier van der Gon, H.A.C. Fuel consumption and associated emissions from seagoing ships at berth derived from an on-board survey. Atmos. Environ. 2010, 44, 1229–1236. [Google Scholar] [CrossRef]
- Chen, Y. Reconciling common but differentiated responsibilities principle and no more favourable treatment principle in regulating greenhouse gas emissions from international shipping. Mar. Policy 2021, 123, 104317. [Google Scholar] [CrossRef]
- Department for Transport. Clean Maritime Plan; Department for Transport: London, UK, 2019.
- Moreno-Gutiérrez, J.; Durán-Grados, V. Calculating ships real emissions of pollutants and greenhouse gases: Towards zero uncertainties. Sci. Total Environ. 2020, 750, 141471. [Google Scholar] [CrossRef]
- Xing, H.; Spence, S.; Chen, H. A comprehensive review on countermeasures for CO2 emissions from ships. Renew. Sustain. Energy Rev. 2020, 134, 110222. [Google Scholar] [CrossRef]
- Thomson, H.; Corbett, J.J.; Winebrake, J.J. Natural gas as a marine fuel. Energy Policy 2015, 87, 153–167. [Google Scholar] [CrossRef] [Green Version]
- Igl, J.; Kellner, F. Exploring greenhouse gas reduction opportunities for retailers in fast moving consumer goods distribution networks. Transp. Res. Part D 2017, 50, 55–69. [Google Scholar] [CrossRef]
- Goldsworthy, L.; Goldsworthy, B. Modelling of ship engine exhaust emissions in ports and extensive coastal waters based on terrestrial AIS data e An Australian case study. Environ. Model. Softw. 2015, 63, 45–60. [Google Scholar] [CrossRef]
- Eyring, V.; Isaksen, I.S.; Berntsen, T.; Collins, W.; Corbett, J.; Endresen, Ø.; Grainger, R.; Moldanova, J.; Schlager, H.; Stevenson, D. Transport impacts on atmosphere and climate: Shipping. Atmos. Environ. 2010, 44, 4735–4771. [Google Scholar] [CrossRef]
- Selin, H.; Zhang, Y.; Dunn, R.; Selin, N.E.; Lau, A.K.H. Mitigation of CO2 emissions from international shipping through national allocation. Environ. Res. Lett. 2021, 16, 045009. [Google Scholar] [CrossRef]
- Vaishnav, P.; Fischbeck, P.S.; Morgan, M.G.; Corbett, J. Shore Power for Vessels Calling at U.S. Ports: Benefits and Costs. Environ. Sci. Technol. 2016, 50, 1102–1110. [Google Scholar] [CrossRef]
- Brynolf, S.; Baldi, F.; Johnson, H. Energy Efficiency and Fuel Changes to Reduce Environmental Impacts. In Shipping and the Environment; Springer: Berlin/Heidelberg, Germany, 2016; pp. 295–339. [Google Scholar]
- Tokuşlu, A. Estimating exhaust gas emissions from ships on port of Zonguldak. Int. J. Environ. Pollut. Environ. Model. 2020, 3, 49–55. [Google Scholar]
- Chen, D.; Zhao, Y.; Nelson, P.; Li, Y.; Wang, X.; Zhou, Y.; Lang, J.; Guo, X. Estimating ship emissions based on AIS data for port of Tianjin, China. Atmos. Environ. 2016, 145, 10–18. [Google Scholar] [CrossRef]
- International Maritime Organization. Third IMO GHG Study; Micropress Printers: London, UK, 2014. [Google Scholar]
- Moura, M.C.P.; Branco, D.A.C.; Peters, G.P.; Szklo, A.S.; Schaeffer, R. How the choice of multigas equivalency metrics affects mitigation options: The case of CO2 capture in a Brazilian coalfired power plant. Energy Policy 2013, 61, 1357–1366. [Google Scholar] [CrossRef]
- Gil-Lopez, T.; Sanchez-Sanchez, A.; Gimenez-Molina, C. Energy, environmental and economic analysis of the ventilation system of enclosed parking garages: Discrepancies with the current regulations. Appl. Energy 2014, 113, 622–630. [Google Scholar] [CrossRef]
- Gil-Lopez, T.; Castejon-Navas, J.; Gálvez-Huerta, M.A.; Gomez-Garcia, V. Predicted percentage of dissatisfied and air age relationship in ventilation systems: Application to a laboratory. HVAC&R Res. 2013, 19, 741931. [Google Scholar] [CrossRef]
- Abadie, L.M.; Goicoechea, N.; Galarraga, I. Adapting the shipping sector to stricter emissions regulations: Fuel switching or installing a scrubber? Transp. Res. Part D Transp. Environ. 2017, 57, 237–250. [Google Scholar] [CrossRef]
- European Parliament. Directive 2014/94/EU of the European Parliament and of the Council of 22 October 2014 on the Deployment of Alternative Fuels Infrastructure; European Parliament: Brussels, Belgium, 2014.
- IMO. International Code of Safety for Ship Using Gases or Other Low-Flashpoint Fuels (IGF Code); International Maritime Organization: London, UK, 2016. [Google Scholar]
- IMO. International Code for the Construction and Equipment of Ships Carrying Liquefied Gases in Bulk (IGC Code); International Maritime Organization: London, UK, 2016. [Google Scholar]
- Abiodun, S. Integrated Port Security System: A Key Factor in Investment. Int. J. Res. Publ. Rev. 2021, 2, 1888–1894. [Google Scholar]
- IMO. International Code for the Construction and Equipment of Ships Carrying Dangerous Chemicals in Bulk; International Maritime Organization: London, UK, 2007. [Google Scholar]
- ISO. Petroleum and Natural Gas Industries. Installation and Equipment for Liquefied Natural Gas. Ship-to-Shore Interface and Port Operations. ISO 28460:2010; International Organization for Standardization: Geneva, Switzerland, 2010. [Google Scholar]
- IMO. International Convention for the Prevention of Pollution from Ships (MARPOL); Annex VI. International Maritime Organization: London, UK, 2016. [Google Scholar]
- Bergqvist, R.; Turesson, M.; Weddmark, A. Sulphur emission control areas and transport strategies—The case of Sweden and the forest industry. Eur. Transp. Res. Rev. 2015, 7, 1–15. [Google Scholar] [CrossRef] [Green Version]
- Lindstad, H.; Eskeland, G.S.; Psaraftis, H.; Sandaas, I.; Strømman, A.H. Maritime shipping and emissions: A three-layered, damage-based approach. Ocean Eng. 2015, 110, 94–101. [Google Scholar] [CrossRef] [Green Version]
- European Maritime Safety Agency. The 0.1% Sulphur in Fuel Requirement as from 1 January 2015 in SECAs. An Assessment of Available Impact Studies and Alternative Means of Compliance; European Maritime Safety Agency: Lisboa, Portugal, 2010.
- European Commission. Quantification of Emissions from Ships Associated with Ship Movements between Ports in the European Community; ENTEC: Newcastle, UK, 2002. [Google Scholar]
- U.S. Environmental Protection Agency. U.S. Current Methodologies in Preparing Mobile Source Port-Related Emission Inventories; Final Report; ICF International: Fairfax, VA, USA, 2009.
- IMO. MARPOL. Annex VI and NTC 2008 with Guidelines for Implementation; International Maritime Organization: London, UK, 2013. [Google Scholar]
- Schinas, O.; Stefanakos, C. Selecting technologies towards compliance with MARPOL Annex VI: The perspective of operators. Transp. Res. Part D Transp. Environ. 2014, 28, 28–40. [Google Scholar] [CrossRef]
- Tai, H.-H.; Lin, D.-Y. Comparing the unit emissions of daily frequency and slow steaming strategies on trunk route deployment in international container shipping. Transp. Res. Part D Transp. Environ. 2013, 21, 26–31. [Google Scholar] [CrossRef]
- Brynolf, S.; Magnusson, M.; Fridell, E.; Andersson, K. Compliance possibilities for the future ECA regulations through the use of abatement technologies or change of fuels. Transp. Res. Part D Transp. Environ. 2014, 28, 6–18. [Google Scholar] [CrossRef]
- Germanisher Lloyd. Costs and Benefits of LNG as Ship Fuel for Container Vessels; Germanischer Lloyd: Hamburg, Germany, 2013. [Google Scholar]
- McGill, R.; Remley, W.; Winther, K. Alternative Fuels for Marine Applications. A Report from the IEA Advanced Motor Fuels Implementing Agreement; IEA-AMF: Taastrup, Denmark, 2013. [Google Scholar]
- Teuchies, J.; Cox, T.J.S.; Van Itterbeeck, K.; Meysman, F.J.R.; Blust, R. The impact of scrubber discharge on the water quality in estuaries and ports. Environ. Sci. Eur. 2020, 32, 103. [Google Scholar] [CrossRef]
- Hu, Y.; Zhou, S.; Sanders, D.; Zhang, W.; Yang, L. Optimised Fusion Model for Meeting Sulphur Abatement Standards in Shipping Industry. In Proceedings of the 2021 IEEE 45th Annual Computers, Software, and Applications Conference (COMPSAC), Madrid, Spain, 9 September 2021; pp. 1165–1169. [Google Scholar] [CrossRef]
- Krivopolianskii, V.; Valberg, I.; Stenersen, D.; Ushakov, S.; Æsøy, V. Control of the combustion process and emission formation in marine gas engines. J. Mar. Sci. Technol. 2018, 24, 593–611. [Google Scholar] [CrossRef]
- Ahlgren, F.; Thern, M.; Genrup, M.; Mondejar, M.E. Energy Integration of Organic Rankine Cycle, Exhaust Gas Recirculation and Scrubber. In Trends and Challenges in Maritime Energy Management; WMU Studies in Maritime Affairs; Ölçer, A., Kitada, M., Dalaklis, D., Ballini, F., Eds.; Springer: Cham, Switzerland, 2018; Volume 6. [Google Scholar]
- Gu, Y.; Wallace, S.W. Scrubber: A potentially overestimated compliance method for the Emission Control Areas. Transp. Res. Part D Transp. Environ. 2017, 55, 51–66. [Google Scholar] [CrossRef]
- Caiazzo, G.; Di Nardo, A.; Langella, G.; Scala, F. Seawater scrubbing desulfurization: A model for SO2 absorption in falldown droplets. Environ. Prog. Sustain. Energy 2011, 31, 277–287. [Google Scholar] [CrossRef]
- Wang, Y.; Wright, L.; Zhang, P. Economic Feasibility of LNG Fuel for Oceangoing Ships: A Case Study of Container Vessels. Marit. Technol. Res. 2020, 3, 202–222. [Google Scholar] [CrossRef]
- Panasiuk, I.; Turkina, L. The evaluation of investments efficiency of SOx scrubber installation. Transp. Res. Part D Transp. Environ. 2015, 40, 87–96. [Google Scholar] [CrossRef]
- Ushakov, S.; Stenersen, D.; Einang, P.M. Methane slip from gas fuelled ships: A comprehensive summary based on measurement data. J. Mar. Sci. Technol. 2019, 24, 1308–1325. [Google Scholar] [CrossRef]
- Gibbs, D.; Rigot-Muller, P.; Mangan, J.; Lalwani, C. The role of sea ports in end-to-end maritime transport chain emissions. Energy Policy 2014, 64, 337–348. [Google Scholar] [CrossRef] [Green Version]
- European Committee for Standardization. CEN/TC 282 Installation and Equipment for LNG; Association Française de Normalisation: Paris, France, 2014. [Google Scholar]
- Fokkema, J.E.; Buijs, P.; Vis, I.F.A. An investment appraisal method to compare LNG-fueled and conventional vessels. Transp. Res. Part D 2017, 56, 229–240. [Google Scholar] [CrossRef]
- Corbin, J.C.; Czech, H.; Massabò, D.; Buatier de Mongeot, F.; Jakobi, G.; Liu, F.; Lobo, P.; Mennucci, C.; Mensah., A.A.; Orasche, S.; et al. Infrared-absorbing carbonaceous tar can dominate light absorption by marineengine exhaust. Npj Clim Atmos Sci. 2019, 2, 1–10. [Google Scholar] [CrossRef]
- Deniz, C.; Zincir, B. Environmental and economical assessment of alternative marine fuels. J. Clean. Prod. 2016, 113, 438–449. [Google Scholar] [CrossRef]
- Livanos, G.A.; Theotokatos, G.; Pagonis, D.-N. Techno-economic investigation of alternative propulsion plants for Ferries and RoRo ships. Energy Convers. Manag. 2014, 79, 640–651. [Google Scholar] [CrossRef] [Green Version]
- Yang, Z.; Chen, H.; Shao, M. The behavior of liquefied natural gas in storage tanks. Pet. Sci. Technol. 2017, 35, 206–210. [Google Scholar] [CrossRef]
- BOCG 333. Ponencia de Estudio de las Yertientes Técnica y Económica de la Utilización del Gas Natural Licuado (LNG) Como Combustible Marino, Constituida en el Seno de la Comisión de Medio Ambiente y Cambio Climático; Spanish Government: Madrid, Spain, 2014.
- Centro de Estudos e Debates Portuários e Logísticos. Portos Inteligentes; Forum Puerto Ciudad: Río de Janeiro, Brazil, 2014. [Google Scholar]
- European Union. TrainMoS. (Project no.: 2011-EU-21004-S). Trans-European Transport Network (Ten-T); European Commission: Madrid, Spain, 2013. [Google Scholar]
- Saharan, S.; Bawa, S.; Kumar, N. Dynamic pricing techniques for Intelligent Transportation System in smart cities: A systematic review. Comput. Commun. 2019, 150, 603–625. [Google Scholar] [CrossRef]
- Poulsen, R.T.; Ponte, S.; Sornn-Friese, H. Environmental upgrading in global value chains: The potential and limitations of ports in the greening of maritime transport. Geoforum 2018, 89, 83–95. [Google Scholar] [CrossRef] [Green Version]
- Cui, H.; Notteboom, T. Modelling emission control taxes in port areas and port privatization levels in port competition and cooperation subgames. Transp. Res. Part D Transp. Environ. 2017, 56, 110–128. [Google Scholar] [CrossRef]
- Contini, D.; Merico, E. Recent Advances in Studying Air Quality and Health Effects of Shipping Emissions. Atmosphere 2021, 12, 92. [Google Scholar] [CrossRef]
- Bows-Larkin, A. All adrift: Aviation, shipping, and climate change policy. Clim. Policy 2015, 15, 681–702. [Google Scholar] [CrossRef]
- Acciaro, M.; Vanelslander, T.; Sys, C.; Ferrari, C.; Roumboutsos, A.; Giuliano, G.; Lam, J.S.L.; Kapros, S. Environmental sustainability in seaports: A framework for successful innovation. Marit. Policy Manag. 2014, 41, 480–500. [Google Scholar] [CrossRef]
- Viana, M.; Hammingh, P.; Colette, A.; Querol, X.; Degraeuwe, B.; De Vlieger, I.; Van Aardenne, J. Impact of maritime transport emissions on coastal air quality in Europe. Atmos. Environ. 2014, 90, 96–105. [Google Scholar] [CrossRef]
- International Group of Liquefied Natural Gas Importers. LNG Custody Transfer Handbook, 5th ed.; International Group of Liquefied Natural Gas Importers: Paris, France, 2017. [Google Scholar]
- Seithe, G.J.; Bonou, A.; Giannopoulos, D.; Georgopoulou, C.A.; Founti, M. Maritime Transport in a Life Cycle Perspective: How Fuels, Vessel Types, and Operational Profiles Influence Energy Demand and Greenhouse Gas Emissions. Energies 2020, 13, 2739. [Google Scholar] [CrossRef]
- Xu, L.; Zhang, J.; Sun, X.; Xu, S.; Shan, M.; Yuan, Q.; Li, W. Variation in Concentration and Sources of Black Carbon in a Megacity of China During the COVID-19 Pandemic. Geophys. Res. Lett. 2020, 47, e2020GL090444. [Google Scholar] [CrossRef] [PubMed]
- European Union. European Union. Costa. (Project no.: 2011-EU-21007-S). Trans-European Transport Network (Ten-T); European Commission: Madrid, Spain, 2014. [Google Scholar]
- Georgakaki, A.; Coffey, R.A.; Lock, G.; Sorenson, S.C. Transport and Environment Database System (TRENDS): Maritime air pollutant emission modelling. Atmos. Environ. 2005, 39, 2357–2365. [Google Scholar] [CrossRef] [Green Version]
- Goiogana, J. Natural Gas in Maritime Transport; Wärtsilä: Santiago de Compostela, Spain, 2017. [Google Scholar]
- Puertos del Estado (Spanish Ports). Statistical Yearbook; Ministerio de Fomento, Spanish Government: Madrid, Spain, 2019.
- California Air Resources Board. Emissions Estimation Methodology for Ocean-Going Vessels. 2011. Available online: http://www.arb.ca.gov/regact/2011/ogv11/ogv11appd.pdf (accessed on 10 March 2020).
- Yuan, J.; Nian, V. Ship energy consumption prediction with Gaussian process metamodel. Energy Procedia 2018, 152, 655–660. [Google Scholar] [CrossRef]
- Wärtsilä. Ship Power System; Wärtsilä: Santiago de Compostela, Spain, 2018. [Google Scholar]
- Company MAN Energy Solutions. Marine Engine Programme; MAN Diesel: Augsburg, Germany, 2018. [Google Scholar]
- Sui, C.; de Vos, P.; Stapersma, D.; Visser, K.; Ding, Y. Fuel Consumption and Emissions of Ocean-Going Cargo Ship with Hybrid Propulsion and Different Fuels over Voyage. J. Mar. Sci. Eng. 2020, 8, 588. [Google Scholar] [CrossRef]
- Rolls-Royce plc. Diesel & Gas Engines; Rolls-Royce plc: Manchester, UK, 2018. [Google Scholar]
- International Energy Agency. CO2 Emissions from Fuel Combustion; International Energy Agency: Paris, France, 2015.
- Van-Dal, E.S.; Bouallou, C. Design and simulation of a methanol production plant from CO2 hydrogenation. J. Clean. Prod. 2013, 57, 38–45. [Google Scholar] [CrossRef]
- Gil-Lopez, T.; Gimenez-Molina, C. Environmental, economic and energy analysis of double glazing with a circulating water chamber in residential buildings. Appl. Energy 2012, 101, 572–581. [Google Scholar] [CrossRef]
- Gil-López, T.; Gálvez-Huerta, M.A.; Castejón-Navas, J.; Gómez-García, V. Analysis of carbon impact using mix energy sources for industrial heating applications. An assessment of options to refit services in an existing building. Fuel Process. Technol. 2012, 103, 151–159. [Google Scholar] [CrossRef]


Publisher’s Note: MDPI stays neutral with regard to jurisdictional claims in published maps and institutional affiliations. |
© 2021 by the authors. Licensee MDPI, Basel, Switzerland. This article is an open access article distributed under the terms and conditions of the Creative Commons Attribution (CC BY) license (https://creativecommons.org/licenses/by/4.0/).