Abstract
A strong preference for suburban living has led to extensively developed suburbs that need retrofitting by improving their compactness. However, an attempt to make suburban areas more sustainable only by shaping their spatial form, without considering individual demands and preferences, is usually ineffective. The aim of this research is to better understand the factors that are important for suburban neighborhood satisfaction and to determine the relationship between neighborhood satisfaction and both the objective spatial attributes reflecting different levels of spatial chaos and satisfaction with particular neighborhood characteristics. The factor analysis and a linear multiple regression model have revealed that there are four significant subjective factors explaining neighborhood satisfaction, namely: assessed suburban assets, assessed accessibility, assessed walkability, and assessed mental and social attitude towards the neighborhood. Among these, the assessed accessibility is the most important predictor of the neighborhood satisfaction and synthetic indicator of spatial chaos the least significant one. Although the research proved that subjective measures are more important determinants of neighborhood satisfaction, fighting urban sprawl should be based on the interference in both subjective evaluations and objective spatial attributes, since two of the four subjective factors are likely to be strongly influenced by improving accessibility in the process of retrofitting suburbs.
1. Introduction
1.1. Context and Aim of the Research
A strong preference for suburban living—which has prevailed since the second half of the 20th century—has led to the uncontrolled development of city outskirts, first in western countries (especially in the United States [1,2]), and later in post-socialist Europe, including Poland [3,4]. This model of spatial development, known as urban sprawl, is characterized by the rapid expansion of cities in the form of low-density residential housing. Urban sprawl in Central and Eastern Europe, well recognized and described in the literature [5,6,7,8,9,10,11,12], often refers to the concept of spatial chaos in its functional aspect. Its negative connotations embrace social, economic, and environmental consequences. Spatial chaos usually manifests itself in irrational spatial structures: dispersion; cultivating auto-dependence; disproportionately depleting energy, land, and water resources; social isolation; monofunctionality; and a considerable proportion of gated communities [3,13,14,15,16,17]. These manifestations are often ignored by suburbanites who aim to live in a quiet, village-like neighborhood [3]. Moreover, suburban residents are usually satisfied with the settlements they inhabit, and the costs they bear living in chaotic suburbs are compensated by the assets of the suburban living environment [3,4].
While extensive dispersion is the driver of urban sprawl, compactness seems to be essential in preventing this phenomenon. Compactness is operationalized not only by density parameters but also by other detailed urban form characteristics. In the research of Mantey and Pokojski [18] it has been assumed that suburban compactness can be shaped, on the one hand, by introducing infrastructure that favors walkability (walkability leads to greater spatial coherence and encourages the densification of non-residential functions), and on the other hand, by better access to public functions, which entails a more strategic locating of public objects and public spaces in order to enhance their use, to have as many residents as possible using them (better accessibility results in more community cohesion, more social contacts, and greater economic vitality). The more pedestrian-oriented designs are and the better accessibility they include, the lower the level of spatial chaos. Walkability and accessibility are the spatial attributes that can be shaped by local authorities as well as by developers or housing cooperatives investing in large areas; hence, they are essential in the process of retrofitting chaotic suburbia.
Retrofitting contemporary suburbs and making them more sustainable can be initiated by the process of densification. The concept of densification through better walkability and accessibility is valuable, especially in the context of wider discussions on the potential of the compact city model. Until now, the idea of increased compactness has mainly focused on spatial parameters [19,20,21,22], leaving aside the given social context and individual demands. An attempt to make suburban areas sustainable only by shaping their urban form is usually ineffective [23]. The issue of those neighborhood attributes that are the most important in predicting residents’ satisfaction should be of great interest to policy-makers due to its potential contribution to a better understanding of the factors leading to the successful neighborhood regeneration [24]. Taking into account the contemporary development paradigm, which is based mostly on the quality of life, the increase in neighborhood satisfaction should be the purpose of all these changes.
Neighborhood satisfaction is a key concept in studying not only preferred living conditions, but also possibilities for retrofitting chaotic suburbia. Researchers have recognized different domains of residential satisfaction, including the nation, the community (the administrative unit), the neighborhood, and the residence (the dwelling unit and the lot) [25]. Neighborhood level seems to be the most appropriate scale, not only for urban sprawl research (spatial layouts analyzed at the community level may be too generalized) but also for fighting spatial chaos through retrofitting irrational spatial and social structures.
Spatial chaos and its synthetic measure, as an objective factor determining neighborhood satisfaction, is a novel idea in the literature. It seems interesting to examine whether less chaotic settlements lead to higher assessments of perceived spatial attributes of the suburbs and higher neighborhood satisfaction. More compact suburbs are expected to be in line with higher social sustainability, assuming that a socially sustainable neighborhood “provides residents with equitable access to facilities, services, and affordable housing; creates a viable and safe environment for interaction and participation in community activities; and promotes a sense of satisfaction and pride in the neighborhood in a way that people would like to live there now and in the future” [26] (p. 4). This leads to formulate the aim of the research, which is twofold. First, it contributes to a better understanding of the determinants of neighborhood satisfaction that are important for retrofitting Polish suburbs. Better understanding might give important insights into people’s preferences regarding their place of residence and, in this way, reveal suburbanites’ attitudes towards the extensive forms of urban development. Second, the study aims to determine the relationship between neighborhood satisfaction and both the objective spatial attributes reflecting different levels of spatial chaos and satisfaction with particular elements of a given built and social environment.
1.2. Theoretical Framework
1.2.1. Determinants of Neighborhood Satisfaction
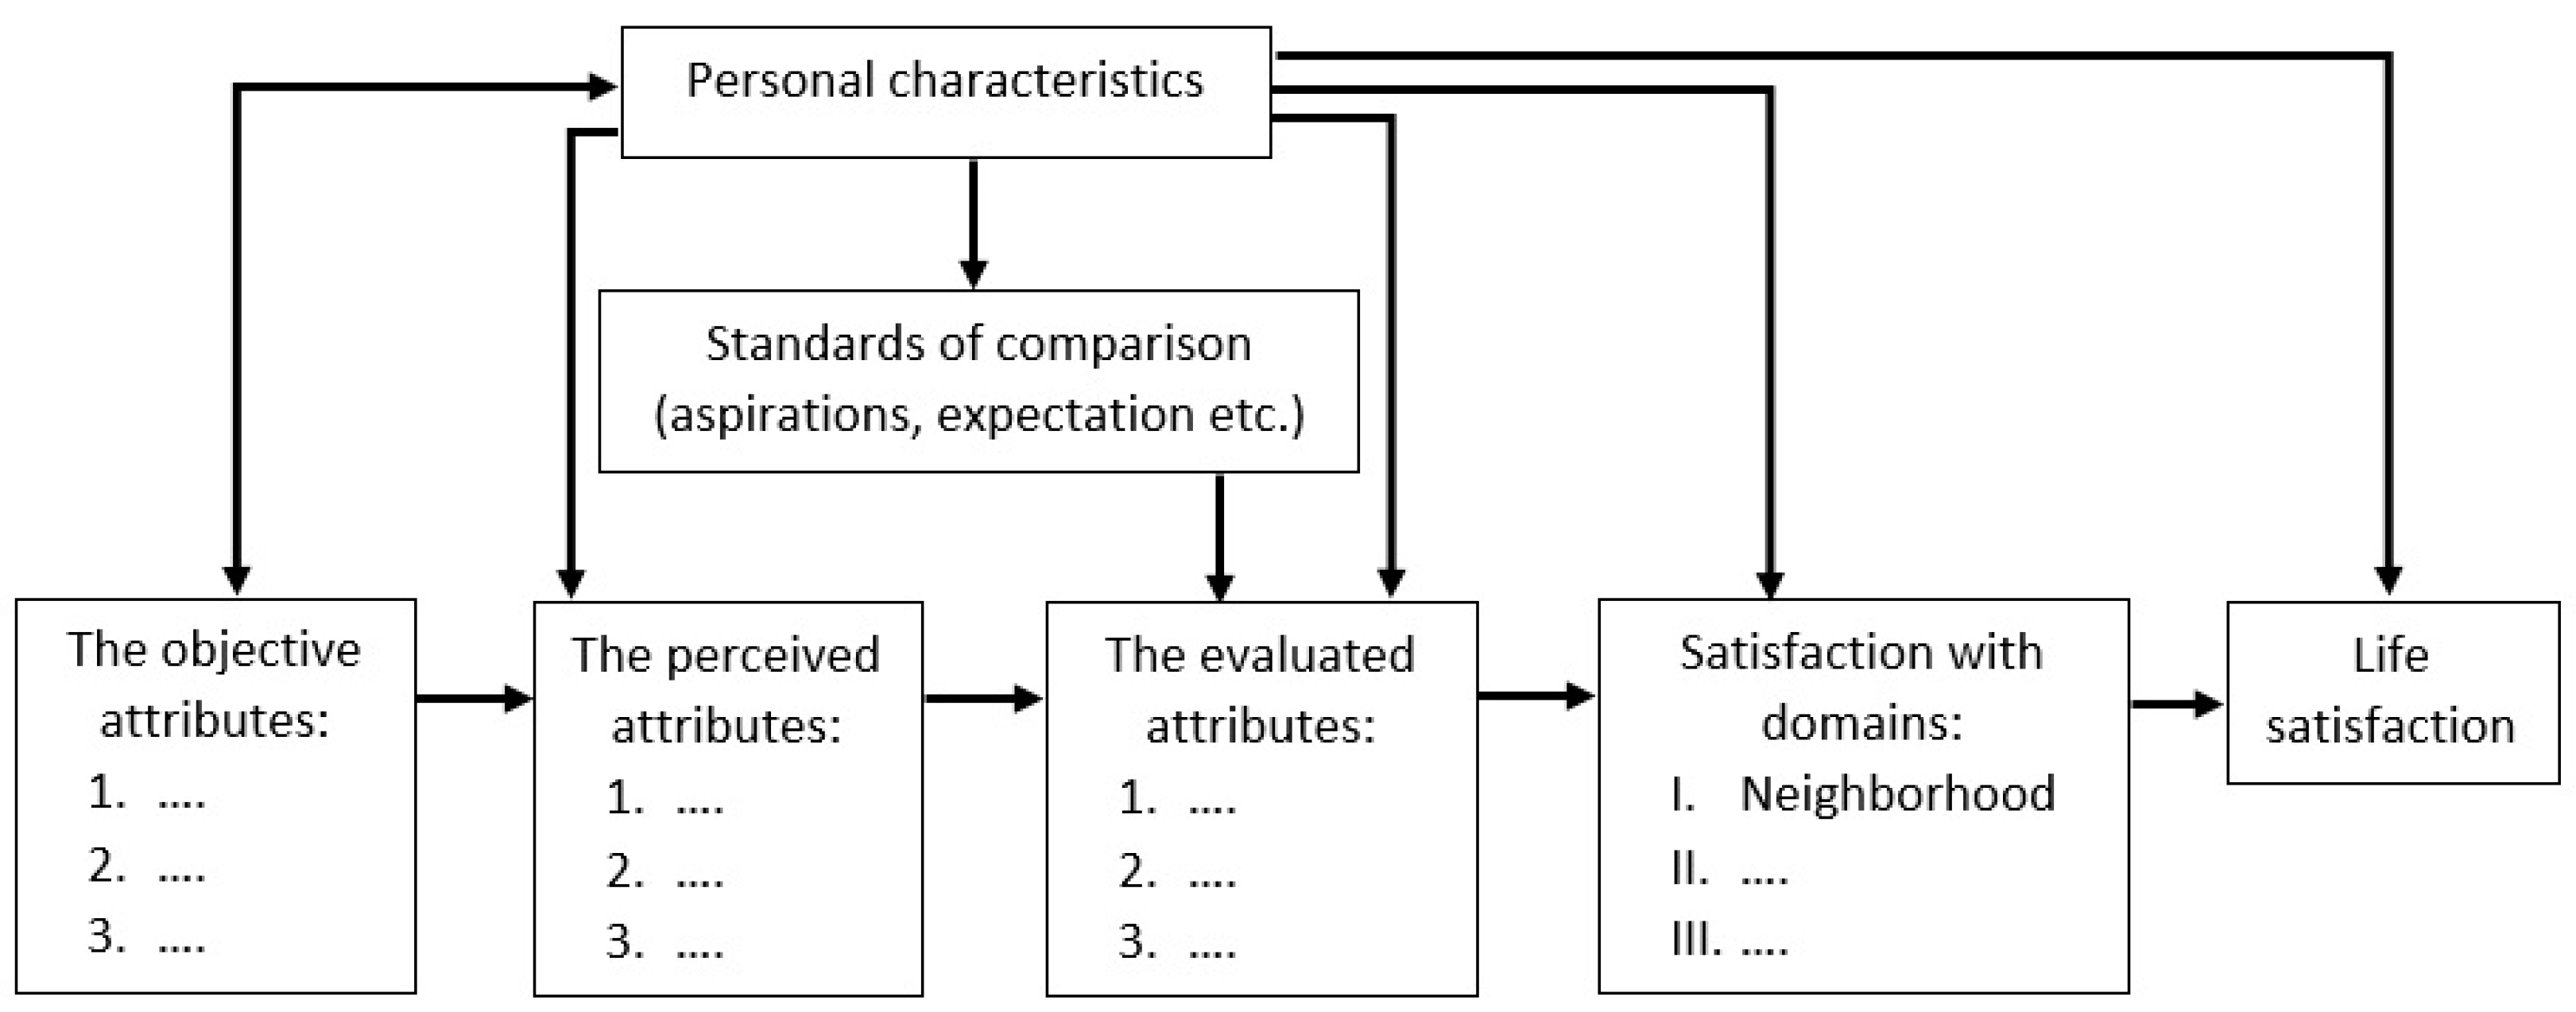
Neighborhood satisfaction is not only an element of a socially sustainable neighborhood, but also an intrinsic component of quality of life (reflected in life satisfaction), determined by both the opportunities created by the built environment and individual assessments of what is important in life. Neighborhood satisfaction is defined as the degree of “fit” or congruence between one’s neighborhood aspirations (or ideal neighborhood concept) and one’s actual residential circumstances [25]. The literature describes it as a combination of three factors: (1) objective neighborhood attributes (spatial attributes) such as walkability, density, accessibility, and distances to different functions; (2) subjective evaluation of neighborhood attributes; (3) personal/household characteristics [24,27]. In analyzing the linkages between the objective attributes and neighborhood satisfaction, the model of determinants of different domains of life satisfaction by Campbell et al. [25] can be followed (Figure 1). According to Campbell’s model, life satisfaction results from those objective (spatial) attributes that play a role of stimuli, subjective responses which reflect how these attributes are perceived and evaluated, and satisfaction with particular life domains that finally determine the overall life satisfaction. Among domains of life satisfaction, there are the following: house, community, neighborhood, health, family life, job, and leisure time, etc. Their impact on life satisfaction requires extensive research, so only one domain has been chosen for this study, namely the neighborhood. Other life domains and the category of life satisfaction have been omitted. Campbell’s model has been limited to the linkages between objective attributes of the neighborhood and the experiences of satisfaction. Neighborhood satisfaction results from the sequence of factors, where each factor follows from the previous one (chained causal mechanism). The sequence starts from the objective (spatial) attributes, which are followed first by cognitive response—reflecting how they are perceived—and next by the assessments of these attributes. The objective attributes are referred to as the features of the space as measured by outside observers or by any other technique that is independent of a given resident. Subjective evaluation of neighborhood attributes includes perceptions of environmental characteristics and, separately, their satisfaction with them. A person’s perception of neighborhood attributes is dependent on, but distinct from, the objective environment—the perceived environment is not necessarily identical to the environment as it actually is. While some scholars use perception and satisfaction interchangeably [28], others consider them to be different subjective measures. Campbell et al. [25] define perception as a cognitive evaluation of objective measures, and satisfaction as an assessment of the gap between perception and internal standards of comparison, as derived from past experience and current aspirations. Since individual experiences and aspirations vary, perception of the same reality will show divergences from person to person. This explains why perception and satisfaction are considered subjective evaluations of the neighborhood attributes. The model also suggests that characteristics of people (and households) can influence the way of perceiving and assessing spatial attributes, as well as the overall neighborhood satisfaction.

Figure 1.
Theoretical model of the relationship between objective environmental characteristics and the experienced level of life satisfaction. Source: own elaboration based on Campbell et al. [25].
In Campbell’s model, objective neighborhood characteristics are the sources of the cognitive and evaluative processes, as influenced by different personal characteristics and internal standards of comparison, hence the relation between the spatial configurations and the subjective responses are “indirect”. In addition, personal characteristics also “filter” the impact of spatial attributes on neighborhood satisfaction. Galster’s concept of the psychological construct of neighborhood satisfaction can help in explaining this mechanism. When evaluating the quality of a neighborhood, residents construct a “reference” condition for each aspect of the neighborhood that is based on their own demands and preferences [29]. The concept places more emphasis on individualized norms of neighborhood evaluation. These norms can be embedded in two concepts used by environmental psychologists: perception and cognitive map. According to a given set of felt needs and aspirations, an individual evaluates his or her neighborhood. On the one hand, the needs and aspirations perceived by a given individual are a complex of both individual characteristics (social class, life cycle stage, and so on) and cultural norms, each depending upon the individual. On the other hand, information on how people imagine the natural and built environment is stored in the brain as spatial networks called cognitive maps. These structures link one’s recall of experiences with their perception of present events, ideas, and emotions. Interestingly, what humans know about an environment is both more than external reality—in the sense that they perceive with prior knowledge and expectations—and less than external reality—in that they record only a portion of the entire visual frame yet recall it as complete and continuous [30]. Concluding, after Galster and Hesser [29], it should be stated that the objective characteristics of the neighborhood and the individual may not exclusively influence overall neighborhood satisfaction in a direct manner. They may, rather, partially or wholly operate through their effect on the individual’s subjective assessments of more limited aspects of the physical or social environment which, in turn, contribute to overall satisfaction levels.
Personal and household characteristics, as one of three main determinants of neighborhood satisfaction, influence the impact of spatial attributes on neighborhood satisfaction, the assessments of neighborhood characteristics, and the overall neighborhood satisfaction. However, previous research shows that perception and subjective evaluation of neighborhood attributes are more important determinants of neighborhood satisfaction than personal/household characteristics and neighborhood attributes per se [25,31,32,33]. It means that spatial attributes are related to neighborhood satisfaction, but not directly, and the effect is not very strong. Additionally, Parkes et al. [33] found that neighborhood spatial attributes accounted for more of the variance in neighborhood satisfaction than demographic factors did. This finding supports an expectation that improved neighborhood design can contribute to increased satisfaction, regardless of age, gender, income, or race/ethnicity. The perceptions of environmental attributes are also of less significance since they are dependent to a large degree (although not exclusively) on the corresponding objective attributes [25].
1.2.2. Objective and Subjective Determinants of Neighborhood Satisfaction—Suburban Context
One of the most frequently mentioned objective factors influencing neighborhood satisfaction is density; however, although advocated for its benefits to the environment, density tends to negatively affect residential satisfaction [34,35]. In other words, neighborhood satisfaction is inversely related to the size of the neighborhood and to the density and heterogeneity of the population [36]. Moreover, critical studies of urban sustainability have suggested that the correlation between compact settlements and urban sustainability is not as clear as previously assumed, and some claimed that advantages have not yet been empirically proven [37]. When it comes to the role of compactness in increasing neighborhood satisfaction, previous research shows that while very high densities are perceived negatively and lead to lower neighborhood satisfaction [38,39], the preference for low- versus mid-level density is more evenly split, as is the preference for mixed land uses [1]. However, there is no consensus on the universality of these outcomes. Some studies of European cities suggest that density, per se, does not have a negative impact on neighborhood satisfaction [40,41]. What we know is that residents of smaller towns and villages are happier than residents of big cities [42,43,44,45], but there can be many reasons for this. Additionally, Lovejoy et al. [46] have found that in the case of similar population densities, neighborhood satisfaction can be increased by space attributes that promote accessibility. Proximity to shopping facilities is generally expected to have a positive effect on neighborhood satisfaction [47], although the relative location of neighborhoods is not often included in neighborhood satisfaction studies.
As opposed to density, the proximity to natural areas and the view of forests and green landscapes are unanimously considered to be the most important positive factors in neighborhood satisfaction [48,49]. Other characteristics that are consistently found to be positively related with neighborhood satisfaction are safety, quietness, social ties among neighbors, and environmental attractiveness [46]. They are considered the most valuable suburban assets that still attract new inhabitants and preserve the image of suburbs as a peaceful and “idyllic” place to reside.
Previous research shows that the set of important predictors of neighborhood satisfaction also include the following: satisfaction with public services [47]; satisfaction with schools [33]; satisfaction with the general appearance of neighborhoods [33]; perceived safety [33,47,48,49]; satisfaction with fellow residents [50,51]; and quietness [51].
Some variables significantly affect neighborhood satisfaction only in a specific built environment. Cook [39] found that satisfaction with the home, proximity to school, and having friends and relatives nearby are significant determinants of satisfaction with the neighborhood, but only the suburban one. Some scholars claim that suburban residents do not derive more satisfaction from features associated with suburban living, namely: availability of parking, quiet neighborhoods, large yards, the presence of cul-de-sacs, and low density. Traditional neighborhood residents do not derive more neighborhood satisfaction from higher density and proximity to destinations (mixed land use), but rather from liveliness, neighboring, and diversity [46].
The advantage of using neighborhood satisfaction as a subjective measure of the quality of neighborhood life is that it appears to be the most appropriate yardstick against which to measure the impact of many perceived neighborhood attributes [33]. What is consistent across theories of neighborhood satisfaction is an emphasis on the importance of subjective evaluations of the neighborhood based on individual perceptions [27], which, according to some scholars, leads to the conclusion that perception carries more weight in explanations of neighborhood satisfaction than objective neighborhood characteristics [29,33].
2. Materials and Methods
2.1. General Concept
The general concept of the research is based on a simplified version of Campbell’s [25] model, describing the relationship between objective environmental characteristics and experienced neighborhood satisfaction. By focusing on those factors that the municipality may shape in the process of retrofitting suburbia, the basic model has been reduced to the most relevant determinants of neighborhood satisfaction. It has been assumed that these determinants include the objective elements of the suburban living environment and the subjective assessments of different determinants of neighborhood satisfaction. The individual’s perception, for the most part, corresponds to the attribute itself; therefore, perception has been omitted from the general concept of the research, as has personal/household characteristics. In the case of the latter, local authorities have no influence on them; therefore, this determinant is irrelevant to retrofitting perspective.
2.2. Study Area
Objective and subjective characteristics of suburban living environments were measured in three suburbs—Józefosław, Żółwin, and Owczarnia—located the south or the south-west of Warsaw (Figure 2). They were purposefully selected to represent three main urban sprawl forms: peripheral accretion, linear development, and leap-frogging development [52,53]. Moreover, they are examples of spatial chaos in its functional aspect.
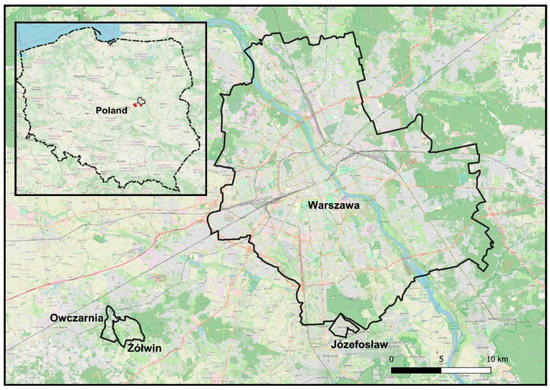
Figure 2.
Location of suburbs that are under study, in relation to Warsaw. Author: Pokojski W.
- Józefosław is an urban village adjacent to Warsaw that is connected to the city by public buses and was populated by 10,497 inhabitants in 2020 (data retrieved from the website of the municipality of Piaseczno: http://bip.piaseczno.eu/artykul/55/4150/demografia; accessed on 7 September 2021). It is diversified in terms of building types (single-family and multi-family houses). It is dominated by gated communities and private cul-de-sacs. It offers 38 units of other than residential functions (units of non-residential functions include bars, restaurants, banks, cash machines, pharmacies, shops, schools, post offices, local community centers, and churches [18]). Pedestrian infrastructure and recreational spaces are insufficient in relation to the area and the number of inhabitants. Józefosław represents a peripheral accretion form of urban sprawl.
- Żółwin and Owczarnia are two villages located much further from Warsaw than Józefosław, but are well connected to the city by commuter train, populated by 1637 (Żółwin) and 1455 (Owczarnia) inhabitants in 2019 (both data retrieved from the website of the municipality of Brwinów: https://bip.brwinow.pl/gmina-brwinow-w-liczbach; accessed on 7 September 2021). They are characterized by dispersed development, poor road and pedestrian infrastructures (the sidewalk along the main road makes the conditions for walking in Owczarnia much better than in Żółwin), and poor access to retail and services. Żółwin offers nine and Owczarnia five units with non-residential functions. Street layout in Żółwin consists of four intersecting main roads with cul-de-sacs perpendicular to them, while Owczarnia extends along one main road with cul-de-sacs on both sides. Only in the northern part of the village the road network is more grid-like. The whole area of Żółwin resembles a patchwork of houses, fields, and wasteland in between, so it represents the most dispersed type of urban sprawl, i.e., leap-frogging development. Owczarnia, in its larger part, is an example of ribbon sprawl (linear development) with intensive development along the main road and a rural landscape in the background.
2.3. Measurement of Objective Neighborhood Characteristics
The assessment of spatial attributes of the three suburbs under study (a synthetic indicator of spatial chaos) was conducted earlier and was described in the paper of Mantey and Pokojski [18]. The outcomes of that measurement have been included in the model of neighborhood satisfaction determinants as objective attributes of space. This paragraph presents the main assumptions and results of that assessment. The synthetic indicator of spatial chaos reflects the generalized situation for the entire suburb. It has been assumed that the basic planning and functional unit is the suburb, not the neighborhood, and that the way the former is developed affects the level of satisfaction with the latter.
The synthetic indicator of spatial chaos includes objective neighborhood characteristics reflecting different types of urban sprawl. Mantey and Pokojski [18] calculated the level of spatial chaos using ten indicators () representing five dimensions as follows: (1) street connectivity (); (2) pedestrian infrastructure (); (3) centrality/nuclearity on a local level (); (4) proximity to public objects and services (); (5) location of the main public open space () (Table 1). Each of the five dimensions of spatial chaos is represented by two indicators, so that each dimension is more comprehensively assessed. All indicators refer to the two most important manifestations of spatial chaos—walkability and accessibility—both indicating potential areas of intervention in the process of retrofitting Polish suburbs.

Table 1.
Spatial chaos of three suburbs, representing different types of urban sprawl.
Firstly, in the procedure of calculating the synthetic indicator of spatial chaos, a zero unitarization algorithm of normalizing the original data was used, according to the following formulas:
when is the value of the stimulant, and
when is the value of the destimulant; where —the original value of the j-th indicator of the i-th suburb; —the minimum value in the set of values of a given indicator; —the maximum value in the set of values of a given indicator.
Normalized diagnostic indicators are positive and take values from the same interval (0–1), which allows for their aggregation. A synthetic indicator of spatial chaos () is a weighted mean of the following normalized indicators:
where n—the number of included indicators; —the normalized value of the j-th indicator of the i-th suburb; —the weighting factor of the j-th indicator, assuming all weighting factors add up to 1.
To determine the weighting factors () of ten indicators, the entropy weighting method was applied. The method proceeds in two stages.
Calculating the entropy of the j-th indicator as follows:
where m—number of objects (suburbs); (when , make
Calculating the entropy weight of the j-th indicator as follows:
where: 0 ≤ ≤ 1 and .
Weighted synthetic indicators () of the three suburbs under investigation are presented in Table 1. The higher the value, the greater the spatial chaos.
According to the research of Mantey and Pokojski [18], Żółwin—which is the most dispersed suburb—has obtained the highest value of spatial chaos; Józefosław—representing peripheral accretion—has obtained the lowest value of spatial chaos; Owczarnia has been placed in between.
Although the concept of calculating indicators of spatial chaos is not the only possible approach to the analysis of this type, it seems to be rational in the case of studies on a local scale, where detailed data is often incomplete. Indicators of spatial chaos adopted for this research are easy to use and do not require advanced calculations and GIS techniques as in the case of fractal geometry in describing land uses [54], the spatial modelling method [55], graphs representing the urban network [56], and Walk Score, which is aimed at measuring walkability [57]. The method is universal and can be used in various types of built-up areas. However, the calculation of some spatial parameters is limited in the case of gated housing estates as well as recreational areas and playgrounds that are not accessible to the public. Other weaknesses of the method result from parameters included in some measures (e.g., the shape of the suburbs), which affects the scoring of indicators based on geometric calculations; however, all these constraints should be considered as a typical element of any algorithm and GIS analysis, which requires certain assumptions and simplifications.
2.4. Measurement of Subjective Neighborhood Characteristics
The subjective neighborhood characteristics have been measured using the survey, in which residents assessed their satisfaction with different aspects of the suburban living environment. It was conducted in July 2019 on a sample of adult residents of three suburbs: Józefosław, Owczarnia, and Żółwin. Houses or flats were selected using the random route method, and after obtaining consent to participate in the study, the interviewer asked the adult household member who had most recently celebrated his or her birthday to complete the questionnaire (this guarantees random sampling). Basic information about the respondents is presented in Table 2.
Table 2.
Characteristics of respondents.
Twenty-four questions of the questionnaire refer to respondents’ perception and satisfaction with selected elements of the suburban physical and social environment, and one to overall neighborhood satisfaction. Respondents, when asked about the neighborhood, usually have quite diverse areas in mind; however, they generally consider it a rather large area, but not as large as an administrative unit. Neither the previously tested sets of questions nor the standardized questionnaires were used in this research. This study suggests newly developed diagnostic questions that are in line with the concept of retrofitting suburbia. Their selection was preceded by the assumption that there is a five-dimensional structure of subjective neighborhood characteristics influencing neighborhood satisfaction. The structure includes not only satisfaction with (1) walkability/bikeability and (2) accessibility—both characteristics are considered important in the process of retrofitting suburbs—but also the following: (3) satisfaction with typical spatial assets of the suburban living environment, such as safety, quietness, and proximity to nature and rural landscape [3,4]; (5) satisfaction with the social environment, i.e., interactions, sense of community, and general attitude towards neighborhood and neighbors [28]; and (4) overall wellbeing and mental predisposition [58]. It has been assumed, after Mesch and Manor [59], that neighborhood satisfaction should be defined as the evaluation of not only the physical but also the social environment, which results from the type of urban sprawl. Overall wellbeing and mental predisposition have been included in the set of variables, because it is believed that this type of self-evaluation is impacted, among other factors, by better access to green areas—one of the most important determinants of satisfaction with suburban neighborhoods. The level of satisfaction have been captured by a five-point Likert scale from −2 to 2, where the higher the score, the better the situation. For all these variables, arithmetic means have been calculated for each suburb under the investigation. Table 3 presents the questions the respondents were asked and the basic statistics.
Table 3.
Questions included in the analysis.
The survey has been followed by two-step statistical analyses. To reduce the number of variables and to determine their structure, as well as the relationships between variables, exploratory factor analysis (EFC) was applied. EFC from a large set of related measures creates (if possible) a smaller set of variables (usually several dimensions). The number of dimensions was determined based on the scree plot. For the rotation, the varimax method was used, assuming that the factors are not correlated with each other. Next, the reliability of the hidden structure has been determined using Cronbach’s alpha. This measure allows assessment of internal consistency and shows how closely related the set of variables is, as a factor.
The purpose of the second step of the statistical analyses was to indicate the strength and direction of the impact of objective characteristics of suburban living environment (synthetic indicator of spatial chaos) and subjective evaluations of the neighborhood attributes (factors extracted in EFC) on neighborhood satisfaction. To achieve this goal, a linear multiple regression model was used. This procedure allowed us to determine how much of the variation in neighborhood satisfaction can be explained by independent variables “as a whole” (R2), as well as allowing assessment of the relationship between each predictor and the dependent variable (B and Beta). Moreover, the associated p-value for each regression coefficient was used to evaluate its statistical significance (the p-values below 0.05).
3. Results
EFA analysis has approved the anticipated five-dimensional structure of neighborhood satisfaction derived from physical characteristics of suburban living environment. The Kaiser–Mayer–Olkin coefficient (KMO) turned out to be greater than 0.5, which justifies using factor analysis in reducing the number of variables (24 components). The study began with the analysis of the variable correlation matrix. After confirming that most of the analyzed variables are significantly correlated with each other (p < 0.05), further steps were taken. Based on the analysis of the scree plot (Figure 3) four factors have been extracted. The extracted factors were rotated using the varimax method, which minimizes the relationships between the extracted orthogonal factors. Each of the four factors explain at least 10% of the total variance, and its eigenvalue exceeds 1. Together, the factors explain 52.2% of the total variance among the individual variables (Table 4), which is sufficient for identification the hidden construct.
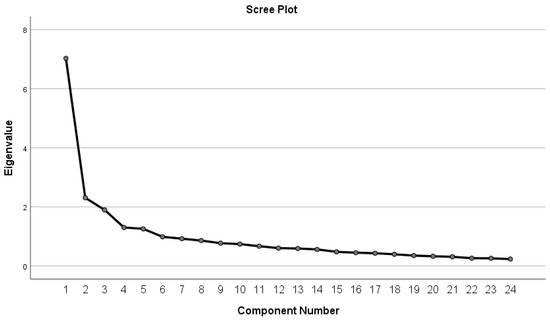
Figure 3.
A scree plot used to determine the number of components.
Table 4.
Results of factor analysis (N = 448).
It was assumed that a given component is included in a factor, if its factor load value is at least 0.40. If a given component loads more than one factor, it is assigned to the factor with which it is correlated more strongly. Table 4 presents the range of factor loadings of individual components for the entire sample studied. The factors turned out to be consistent with the five categories of determinants of neighborhood satisfaction that were included in the analysis. The only difference is that overall wellbeing and mental predisposition, together with perception of the social environment, build one dimension (factor). The Cronbach’s alphas of all dimensions (factors) exceeded the commonly used threshold value of 0.6 [60], which indicates acceptable internal reliability of each factor. The four distinguished factors can be described as follows.
- Factor 1. Assessed suburban assets. The first factor explains 16.3% of the total common variance and is represented by eight components relating to the level of satisfaction with the most important assets of the suburb. These assets, considered to be the factors attracting new residents, are as follows: landscape, the density of buildings (lower than in the city), little traffic and noise, safety, the possibility of walking, relaxing, and spending time in a natural setting.
- Factor 2. Assessed accessibility. The second factor explains 14.5% of the total common variance and is represented by seven components. It reflects satisfaction with the potential of the place of residence to meet basic needs (access to shops, schools, etc.) and to pursue aspiration, passions, and interest. The assessed accessibility also includes public transport and time spent commuting, as well as the access to places to spend free time. This factor can be referred to as accessibility, a category of the quality of suburban living environment (accessibility was used also in the assessment of the level of spatial chaos representing objective neighborhood characteristics).
- Factor 3. Assessed walkability. The third factor explains 10.9% of the total common variance and is represented by four components directly related to the level of the walkability of the suburb (conditions for walking and cycling, satisfaction with the safety of pedestrians and cyclists). Walkability, as with accessibility, was included in the synthetic indicator of spatial chaos.
- Factor 4. Assessed mental and social attitude. The fourth factor explains 10.5% of the total common variance. It includes five components, which determine wellbeing as well as mental and social predispositions of suburbanites towards the place of residence and co-residents (mental health, wellbeing, feeling of pride in the place of residence, satisfaction with relationships with people from the neighborhood, and possibilities to participate in social life).
In the second step of data analysis, multiple regression analyses were conducted to investigate the influence of objective and subjective characteristics on neighborhood satisfaction using synthetic indicators of spatial chaos and factors extracted during EFA. When checking the assumptions of multiple regression, eight outliers were detected and removed from further analysis. The results of the regression analysis appear in Table 5. The table shows that there are positive relationships between each of these predictors and neighborhood satisfaction. One objective and four subjective statistically significant factors predict neighborhood satisfaction. All five variables added to the prediction statistically significantly (p < 0.05); however, it should be emphasized that the quality of the model fit (as measured by the R2 determination coefficient) is moderately satisfactory, which indicates that there are many other potential factors (apart from those included in the study) that could better explain what neighborhood satisfaction depends on. Standardized Beta proves that assessed accessibility is the most important predictor in the developed model, followed by the assessed mental and social attitude. The least significant predictor is the synthetic indicator of spatial chaos representing the objective characteristics of suburban neighborhoods. Partial correlations confirm these results. Assessed accessibility is the strongest correlate of neighborhood satisfaction and synthetic indicator of spatial chaos is the weakest correlate, whilst controlling for other predictors (Figure 4). It should be remembered that, according to Campbell’s model, the effect of objective spatial attributes on neighborhood satisfaction is always filtered by personal characteristics; however, the scale of this influence was not the subject of the present research.
Table 5.
Multiple regression analyses between neighborhood satisfaction and its predictors.
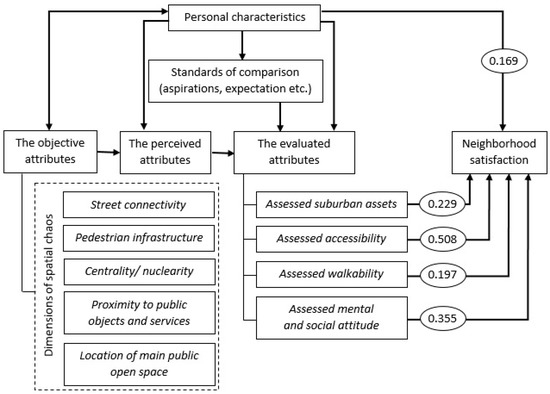
Figure 4.
Identified relationships between objective, evaluated attributes and neighborhood satisfaction (partial correlations).
4. Discussion
Results of the research allowed us to better understand factors that are important for suburban neighborhood satisfaction. They provided some evidence that neighborhood built and social attributes, measured both objectively and subjectively, were associated with neighborhood satisfaction. Since different studies include different variables, it is difficult to compare results across studies and draw conclusions about the most important environmental drivers of neighborhood satisfaction [61]. This study attempts to organize the above mentioned variety into a few of the most important correlates, but contrary to the previous studies, it shifts the subject of interest from urban to suburban built and social environment.
Neighborhood satisfaction is driven by two sets of influences: objective and subjective. In this study, both types of determinants have been analyzed separately. Other scholars suggest that objective evaluations of neighborhood characteristics are less important in explaining neighborhood satisfaction than subjective measures [32,33,62]. This research confirmed the general findings of previous studies, although most of them concern cities, not suburbs. When generalizing the concept that subjective measures are more important than objective ones, more caution should be exercised, since two of the four main factors identified—that determine neighborhood satisfaction—are likely to be strongly influenced by improving accessibility and walkability in the process of retrofitting suburbs. In addition, the results of the research are based on no more than three neighborhoods, which allows only preliminary recognition of possible regularities.
It has been proven that a higher score of the synthetic indicator of spatial chaos reflecting poor accessibility and walkability translates into a slightly higher level of neighborhood satisfaction. The most satisfied residents are those living in Żółwin, the least compact suburb. We can therefore conclude after other scholars that residential density [63,64], walkability [63], and objectively measured retail land use [65,66,67] are negatively associated with neighborhood satisfaction; however, in this study all these spatial attributes have been combined into one synthetic indicator. The impact of individual objective characteristics investigated separately may vary depending on the type of built environment and individual spatial and social conditions of the suburb. The advantage of the synthetic indicator of spatial chaos is, however, that it allows for a comprehensive assessment of at least several objective spatial conditions, which are often related to each other.
When it comes to the subjective correlates of neighborhood satisfaction, the factor analysis has revealed that there are four significant factors explaining half of the total variance among input variables. They include assessed suburban assets, assessed accessibility, assessed walkability, and assessed mental and social attitude towards the neighborhood. Referring to the model of Campbell et al. [25], these four factors can be considered as subjective evaluations of neighborhood attributes. The research shows that, in the case of suburbs, the level of satisfaction with suburban assets—such as picturesque landscape, low density of buildings, little traffic and noise, safety, the possibility of walking, relaxing, and spending time in a natural setting—is significantly associated with neighborhood satisfaction, but accessibility seems to be of more importance. Although, according to previous research, factors including peace, greenery, closeness to nature, and better conditions for raising children are decisive when choosing a particular suburb as a place of residence [3,68,69], with time, the initial enthusiasm for suburban assets diminishes due to numerous problems associated with the daily functioning in the urban region and commuting [3,4,69]. This may explain why, in the case of suburbs (having four factors to choose from), the perceived accessibility is the most strongly correlated with neighborhood satisfaction. Long distances and car dependency, as the main functional problems resulting from urban sprawl [3], seem to be crucial destimulants. Contrary to the suburbs, one of the strongest correlates of neighborhood satisfaction in cities is satisfaction with aesthetics, greenery [46,70,71], and the feelings of safety from crime and traffic [40,46,47,62,70,72]. Better accessibility is an obvious asset of the urban built environment, that is why it cannot affect neighborhood satisfaction as much as other factors that cities have problems with.
Interestingly, the correlation with suburban neighborhood satisfaction was higher in the case of assessed wellbeing and social aspects of suburban living than assessed walkability. It occurred that more positive mental and social attitudes towards the place of residence can more easily shift into a higher level of neighborhood satisfaction than better-assessed conditions for walking and cycling. This finding confirms, to some extent, the study of Lee et al. [61], who claim that perceived walking/cycling facilities and street connectivity are not significant determinants of neighborhood satisfaction. In the case of suburbs, the factors that diminish the need for walking—thus, reducing the impact of assessed pedestrian infrastructure on neighborhood satisfaction—are private gardens serving as a space for recreation, and the car dependency phenomenon [3,73].
The results interpreted above prove how important geographical and social context is. Some variables significantly affect neighborhood satisfaction only in a specific built environment. Cook [39] found that satisfaction with the home, proximity to school, and having friends and relatives nearby are significant determinants of satisfaction with the neighborhood, but only the suburban one. According to Lovejoy et al. [46], those who choose suburban neighborhoods do not derive more satisfaction from features associated with suburban living—such as quiet, the presence of cul-de-sacs, low density, and safety—probably because people sort into different neighborhoods according to pre-existing preferences. If we assume that people have different housing needs and make trade-offs on the pros and cons of different places when deciding where to live, the average level of neighborhood satisfaction should be similar in different built environments [42]. Most people are quite satisfied with various types of residence [74,75]. Factors that have determined which neighborhood to choose may increase neighborhood satisfaction, but not too much. More satisfaction can be derived from the factors that were not considered when choosing a place to live (e.g., accessibility to places for spending free time, basic services, and school). While the extensive spatial development in the suburbs (identified with the preferred built environment) translates into greater neighborhood satisfaction, worse subjective assessments of individual aspects of suburban living, resulting directly from greater scale of urban sprawl, are accompanied by lower neighborhood satisfaction. Better accessibility as a result of the retrofitting process should increase its subjective assessment, and thus, the level of neighborhood satisfaction.
5. Conclusions
The article attempts to resolve the dilemma of how to reconcile the need for densification of the suburban built environment with the preferences of suburbanites, so that it ultimately translates into greater neighborhood satisfaction. This could be achieved through retrofitting suburbs, namely by improving the walkability and accessibility to main public objects and basic services; however, walkability and accessibility are not decisive factors when choosing a place to live. Suburbanites are driven mainly by the assets of extensive land development (urban sprawl). A positive relationship between spatial chaos (which manifests in poor walkability and accessibility) and neighborhood satisfaction presents challenges to planners and policymakers who understand that sustainable suburbs need moderate density and better accessibility. A critical mass of inhabitants and better walkability are required to support the shops and services in creating vibrant and complete communities. The profitability of services requires a minimum level of residential density, which in turn is negatively correlated with neighborhood satisfaction. This research shows, however, that it is premature to conclude that increased compactness reduces satisfaction with suburban neighborhoods, since the impact of objective determinants of neighborhood satisfaction is modified by the subjective assessments of spatial, social, and personal characteristics. Fighting urban sprawl could therefore be based, to a greater extent than before, on subjective evaluations of neighborhood attributes, as they are more strongly correlated with neighborhood satisfaction than objective factors. Among these evaluations, satisfaction with different aspects of accessibility seems to be of special importance. Further research on the impact of increased accessibility to different services and spaces should be continued.
Funding
This paper was funded by University of Warsaw.
Institutional Review Board Statement
Not applicable.
Informed Consent Statement
Informed consent was obtained from all subjects involved in the study.
Data Availability Statement
The data presented in this study are available on request from the corresponding author.
Conflicts of Interest
The author declares no conflict of interest. The funders had no role in the design of the study; in the collection, analyses, or interpretation of data; in the writing of the manuscript, or in the decision to publish the results.
References
- Ewing, R. Is Los Angeles-style sprawl desirable? J. Am. Plan. Assoc. 1997, 63, 107–126. [Google Scholar] [CrossRef]
- Patacchini, E.; Zenou, Y. Urban Sprawl in Europe. Brook.-Whart. Pap. Urban Aff. 2009, 10, 125–149. [Google Scholar]
- Mantey, D. Żywiołowość’ Lokalizacji Osiedli Mieszkaniowych na Terenach Wiejskich Obszaru Metropolitalnego Warszawy [Spontaneity of Location of Housing Estates in Rural Areas of the Metropolitan Area of Warsaw]; Uniwersytet WarszawskiWydział Geografii i Studiów Regionalnych: Warsaw, Poland, 2011. [Google Scholar]
- Kajdanek, K. Pomiędzy Miastem a Wsia˛. Suburbanizacja na Przykładzie Osiedli Podmiejskich Wrocławia [Between the City and the Village. Suburbanization on the Example of Wrocław Suburban Housing Estates]; NOMOS: Kraków, Poland, 2011. [Google Scholar]
- Tsenkova, S.; Nedović-Budić, Z. The Urban. Mosaic of Post-Socialist Europe: Space, Institutions and Policy; Physica-Verlag: New York, NY, USA, 2006. [Google Scholar]
- Sykora, L.; Ourednicek, M. Sprawling Post-Communist Metropolis: Commercial and Residential Suburbanisation in Prague and Brno, the Czech Republic. In Employment Deconcentration in European Metropolitan Areas: Market. Forces versus Planning Regulations; Dijst, M., Razin, E., Vazquez, C., Eds.; Springer: Dordrecht, The Netherlands, 2007; pp. 209–234. [Google Scholar]
- Pichler-Milanović, N.; Gutry-Korycka, M.; Rink, D. Sprawl in the Post-Socialist City: The Changing Economic and Institutional Context of Central and Eastern European Cities. In Urban Sprawl in Europe, Landscape, Land-Use Change and Policy; Couch, C., Leontidou, L., Petschel-Held, G., Eds.; Wiley-Blackwell: Hoboken, NY, USA, 2007; pp. 102–135. [Google Scholar]
- Tammaru, T.; Ahas, R.; Leetmaa, K.; Silm, S. Temporal and Spatial Dynamics of the New Residential Areas Around Tallinn. Eur. Plan. Stud. 2009, 17, 423–439. [Google Scholar] [CrossRef] [Green Version]
- Hirt, S. Iron Curtains: Gates, Suburbs and Privatization of Space in the Post-Socialist City; Wiley-Blackwell: Oxford, UK; Malden, MA, USA, 2012. [Google Scholar]
- Stanilov, K.; Sýkora, L. Confronting Suburbanization: Urban Decentralization in Post-Socialist Central and Eastern Europe; JohnWiley & Sons: Chichester, UK, 2014. [Google Scholar]
- Dinić, M.; Mitković, P. Suburban design: From “bedroom communities” to sustainable neighborhoods. Geod. Vestn. 2016, 60, 98–113. [Google Scholar] [CrossRef]
- Taubenböck, H.; Gerten, C.; Rusche, K.; Siedentop, S.; Wurm, M. Patterns of Eastern European urbanisation in the mirror of Western trends—Convergent, unique or hybrid? Environ. Plan. B Urban Anal. City Sci. 2019, 46, 1206–1225. [Google Scholar] [CrossRef] [Green Version]
- Zuziak, Z. Strefa podmiejska w architekturze miasta. W stronę nowej architektoniki regionu miejskiego [The suburban area in the city’s architecture. Towards a new architecture of the urban region]. In Problem Suburbanizacji [The Problem of Suburbanization]; Lorens, P., Ed.; Urbanista: Warsaw, Poland, 2005; pp. 17–32. [Google Scholar]
- Chmielewski, J.M. Problemy rozpraszania się zabudowy na obszarze metropolitalnym Warszawy [Problems of building dispersion in the metropolitan area of Warsaw]. In Problem Suburbanizacji [The Problem of Suburbanization]; Lorens, P., Ed.; Urbanista: Warsaw, Poland, 2005; pp. 52–62. [Google Scholar]
- Zimnicka, A.; Czernik, L. Kształtowanie Przestrzeni wsi Podmiejskiej. Raport z Badań Obszaru Oddziaływania Miasta Szczecin [Shaping the Space of a Suburban Village. Research Report on the Area of Influence of the City of Szczecin]; Hogben: Szczecin, Poland, 2007. [Google Scholar]
- Springer, F. Wanna z kolumnadą [A Bath with the Colonnade]; Wyd. Czarne: Wołowiec, Poland, 2013. [Google Scholar]
- Solarek, K. Struktura Przestrzenna Strefy Podmiejskiej Warszawy: Determinanty Współczesnych Przekształceń [Spatial Structure of the Warsaw Suburban Zone: Determinants of Contemporary Transformations]; Oficyna Wydawnicza Politechniki Warszawskiej: Warsaw, Poland, 2013. [Google Scholar]
- Mantey, D.; Pokojski, W. New Indicators of Spatial Chaos in the Context of the Need for Retrofitting Suburbs. Land 2020, 9, 276. [Google Scholar] [CrossRef]
- Dunham-Jones, E.; Willianson, J. Retrofitting Suburbia: Urban. Design Solutions for Redesigning Suburbs; John Wiley & Sons: Hoboken, NY, USA, 2009. [Google Scholar]
- Marique, A.F.; Reiter, S. Retrofitting the Suburbs: Insulation, density, urban form and location. Environ. Manag. Sustain. Dev. 2014, 3, 138–153. [Google Scholar] [CrossRef] [Green Version]
- Talen, E. Retrofitting Sprawl: Addressing Seventy Years of Failed Urban Form; University of Georgia Press: Athens, GA, USA, 2015. [Google Scholar]
- Tachieva, G. Sprawl Repair Manual; Island Press: Washington, DC, USA, 2010. [Google Scholar]
- Newman, M. The Compact City Fallacy. J. Plan. Educ. Res. 2005, 25, 11–26. [Google Scholar] [CrossRef]
- Permentier, M.; Bolt, G.; Van Ham, M. Determinants of Neighborhood Satisfaction and Perception of Neighborhood Reputation. Urban Stud. 2011, 48, 977–996. [Google Scholar] [CrossRef] [Green Version]
- Campbell, A.; Converse, P.E.; Rodgers, W.L. The Quality of American Life: Perceptions, Evaluations, and Satisfaction; Russell Sage Foundation: New York, NY, USA, 1976. [Google Scholar]
- Larimian, T.; Sadeghi, A. Measuring Urban Social Sustainability: Scale Development and Validation. Environ. Plan. B Urban Anal. City Sci. 2021, 48, 621–637. [Google Scholar] [CrossRef] [Green Version]
- Grogan-Kaylor, A.; Alaimo, K.; Gant, L.; Gilster, M.; Karb, R.; MacFarlane, P.; Gant, L.; Woolley, M. Predictors of Neighborhood Satisfaction. J. Community Pract. 2006, 14, 27–50. [Google Scholar] [CrossRef]
- Hur, M.; Morrow-Jones, H. Factors that influence residents’ satisfaction with neighborhoods. Environ. Behav. 2008, 40, 619–635. [Google Scholar] [CrossRef]
- Galster, G.C.; Hesser, G.W. Residential satisfaction: Compositional and contextual correlates. Environ. Behav. 1981, 13, 735–758. [Google Scholar] [CrossRef]
- De Young, R. Environmental Psychology. In Encyclopedia of Environmental Science; Alexander, D.E., Fairbridge, R.W., Eds.; Kluwer Academic Publishers: Hingham, MA, USA, 1999. [Google Scholar]
- Galster, G. Homeowners and Neighborhood Reinvestment; Duke University Press: Durham, NC, USA, 1987. [Google Scholar]
- Lu, M. Determinants of residential satisfaction: Ordered logit vs. regression models. Growth Change 1999, 30, 264–287. [Google Scholar] [CrossRef]
- Parkes, A.; Atkinson, R.; Kearns, A. What makes people dissatisfied with their neighborhoods? Urban Stud. 2002, 39, 2413–2438. [Google Scholar] [CrossRef]
- Rodgers, W.L. Density, crowding, and satisfaction with the residential environment. Soc. Indic. Res. 1981, 10, 75–102. [Google Scholar] [CrossRef]
- Mantey, D. Podmiejskie tereny otwarte–oczekiwania mieszkańców a lokalne dokumenty planistyczne (przykład podwarszawskiej gminy Lesznowola) [Suburban open areas-residents’ expectations and local planning documents (example of the Lesznowola municipality near Warsaw)]. Prace i Studia Geograficzne 2016, 61, 51–70. [Google Scholar]
- Wirth, L. Urbanism as a way of life. Am. J. Sociol. 1938, 44, 1–24. [Google Scholar] [CrossRef]
- Chen, H.; Jia, B.; Lau, S.S.Y. Sustainable urban form for Chinese compact cities: Challenges of a rapid urbanization economy. Habitat Int. 2008, 32, 28–40. [Google Scholar] [CrossRef]
- Bramley, G.; Brown, C.; Dempsey, N.; Power, S.; Watkins, D. Social sustainability and urban form: Evidence from five British cities. Environ. Plan. A 2009, 41, 2125–2142. [Google Scholar] [CrossRef]
- Cook, C.C. Components of neighborhood satisfaction responses from urban and suburban single-parent women. Environ. Behav. 1988, 20, 115–149. [Google Scholar] [CrossRef]
- Howley, P.; Redmond, D.; Scott, M. Sustainability versus liveability: An investigation of neighborhood satisfaction. J. Environ. Plan. Manag. 2009, 52, 847–864. [Google Scholar] [CrossRef]
- Arundel, R.; Ronald, R. The role of urban form in sustainability of community: The case of Amsterdam. Environ. Plan. B Urban Anal. City Sci. 2017, 44, 33–53. [Google Scholar] [CrossRef]
- Morrison, P.S. Subjective wellbeing and the city. Soc. Policy J. N. Z. 2007, 31, 74–103. [Google Scholar]
- Berry, B.J.L.; Okulicz-Kozaryn, A. An urban-rural happiness gradient. Urban Geogr. 2011, 32, 871–883. [Google Scholar] [CrossRef]
- Ballas, D.; Tranmer, M. Happy people or happy places? A multilevel modeling approach to the analysis of happiness and well-being. Int. Reg. Sci. Rev. 2012, 35, 70–102. [Google Scholar] [CrossRef]
- Sørensen, J.F.L. Rural-urban differences in life satisfaction: Evidence from the European Union. Reg. Stud. 2014, 48, 1451–1466. [Google Scholar] [CrossRef]
- Lovejoy, K.; Handy, S.; Mokhtarian, P. Neighborhood satisfaction in suburban versus traditional environments: An Evaluation of Contributing Characteristics in Eight California Neighborhoods. Landsc. Urban Plan. 2010, 97, 37–48. [Google Scholar] [CrossRef]
- Basolo, V.; Strong, D. Understanding the neighborhood: From residents’ perceptions and needs to action. Hous. Policy Debate 2002, 13, 83–105. [Google Scholar] [CrossRef]
- Kaplan, R. Nature at the door step: Residential satisfaction and the nearby environment. J. Archit. Plan. Res. 1985, 2, 115–127. [Google Scholar]
- Kearney, A.R. Residential development patterns and neighborhood satisfaction: Impacts of density and nearby nature. Environ. Behav. 2006, 38, 112–139. [Google Scholar] [CrossRef]
- Harris, D. Why are whites and blacks averse to black neighbors? Soc. Sci. Res. 2001, 30, 100–116. [Google Scholar] [CrossRef]
- Mohan, J.; Twigg, L. Sense of place, quality of life and local socioeconomic context: Evidence from the survey of English housing, 2002/03. Urban Stud. 2007, 44, 2029–2045. [Google Scholar] [CrossRef]
- Peiser, R. Decomposing urban sprawl. Town Plan. Rev. 2001, 72, 275–298. [Google Scholar] [CrossRef]
- Chin, N. Unearthing the roots of urban sprawl: A critical analysis of form, function and methodology. In CASA Working Papers 47; Centre for Advanced Spatial Analysis (UCL): London, UK, 2002. [Google Scholar]
- Purevtseren, M.; Tsegmid, B.; Indra, M.; Sugar, M. The Fractal Geometry of Urban Land Use: The Case of Ulaanbaatar City, Mongolia. Land 2018, 7, 67. [Google Scholar] [CrossRef] [Green Version]
- Ye, Y.; van Nes, A. Quantitative tools in urban morphology: Combining space syntax, spacematrix and mixed-use index in a GIS framework. Urban Morphol. 2014, 18, 97–118. [Google Scholar]
- Blanchard, P.; Volchenkov, D. Mathematical Analysis of Urban Spatial Networks; Springer: Berlin/Heidelberg, Germany, 2009. [Google Scholar]
- Walk Score®. Available online: https://www.walkscore.com/ (accessed on 29 September 2021).
- Zhang, Y.; Van den Berg, A.E.; Van Dijk, T.; Weitkamp, G. Quality over Quantity: Contribution of urban Green space to neighborhood satisfaction. Int. J. Environ. Res. Public Health 2017, 14, 535. [Google Scholar] [CrossRef]
- Mesch, G.S.; Manor, O. Social ties, environmental perception, and local attachment. Environ. Behav. 1998, 30, 504–519. [Google Scholar] [CrossRef]
- Bagozzi, R.P.; Youjae, Y. On the Evaluation of Structural Equation Models. J. Acad. Mark. Sci. 1988, 16, 74–94. [Google Scholar] [CrossRef]
- Lee, S.M.; Cain, K.L.; Conway, T.L.; Frank, L.D.; Saelens, B.E.; Sallis, J.F. The Relation of Perceived and Objective Environment Attributes to Neighborhood Satisfaction. Environ. Behav. 2017, 49, 136–160. [Google Scholar] [CrossRef]
- Bruin, M.J.; Cook, C.C. Understanding constraints and residential satisfaction among low-income single-parent families. Environ. Behav. 1997, 29, 532–553. [Google Scholar] [CrossRef]
- Van Dyck, D.; Cardon, G.; De Bourdeaudhuij, I.; Deforche, B. Do adults like living in high-walkable neighborhoods? Associations of walkability parameters with neighborhood satisfaction and possible mediators. Health Place 2011, 17, 971–977. [Google Scholar] [CrossRef] [PubMed]
- MacCulloch, A. Housing density as a predictor of neighborhood satisfaction among families with young children in urban England. Popul. Space Place 2012, 18, 85–99. [Google Scholar] [CrossRef]
- Ellis, C.D.; Kweon, B.; Lee, S. Retail land use, neighborhood satisfaction and the urban forest: An investigation into the moderating and mediating effects of trees and shrubs. Landsc. Urban Plan. 2006, 74, 70–78. [Google Scholar] [CrossRef]
- Kweon, B.; Ellis, C.D.; Leiva, P.; Rogers, G.O. Landscape components, land use, and neighborhood satisfaction. Environ. Plan. B Plan. Des. 2010, 37, 500–517. [Google Scholar] [CrossRef]
- Yang, Y.; Stockard, J. Do smart-growth environments benefit single mothers? Evidence from thirty MSAs using the American Housing Survey data. J. Plan. Educ. Res. 2013, 33, 411–426. [Google Scholar] [CrossRef]
- Beim, M. Modelowanie Procesu Suburbanizacji w Aglomeracji Poznańskiej [Modeling the Suburbanization Process in the Poznań Agglomeration]; Bogucki Wydawnictwo Naukowe: Poznań, Poland, 2009. [Google Scholar]
- Kajdanek, K. Suburbanizacja po Polsku [Suburbanization in the Polish Version]; NOMOS: Kraków, Poland, 2012. [Google Scholar]
- Leslie, E.; Cerin, E. Are perceptions of the local environment related to neighborhood satisfaction and mental health in adults? Prev. Med. 2008, 47, 273–278. [Google Scholar] [CrossRef]
- De Jong, K.; Albin, M.; Björk, J.; Grahn, P.; Skärbäck, E. Perceived green qualities were associated with neighborhood satisfaction, physical activity, and general health: Results from a cross-sectional study in suburban and rural Scania, southern Sweden. Health Place 2012, 18, 1374–1380. [Google Scholar] [CrossRef]
- Hur, M.; Nasar, J.L. Physical upkeep, perceived upkeep, fear of crime and neighborhood satisfaction. J. Environ. Psychol. 2014, 38, 186–194. [Google Scholar] [CrossRef]
- Mantey, D. Wzorzec Miejskiej Przestrzeni Publicznej w Konfrontacji z Podmiejską Rzeczywistością [A Model of Urban Public Space in Confrontation with Suburban Reality]; WUW: Warsaw, Poland, 2019. [Google Scholar]
- Jansen, S. Why is housing always satisfactory? A study into the impact of preference and experience on housing appreciation. Soc. Indic. Res. 2013, 113, 785–805. [Google Scholar] [CrossRef] [PubMed] [Green Version]
- Jansen, S. Why is housing always satisfactory? A study into the impact of cognitive restructuring and future perspectives on housing appreciation. Soc. Indic. Res. 2014, 116, 353–371. [Google Scholar] [CrossRef]


Publisher’s Note: MDPI stays neutral with regard to jurisdictional claims in published maps and institutional affiliations. |
© 2021 by the author. Licensee MDPI, Basel, Switzerland. This article is an open access article distributed under the terms and conditions of the Creative Commons Attribution (CC BY) license (https://creativecommons.org/licenses/by/4.0/).