Abstract
Bangladesh is one of the most climate-vulnerable countries on the globe. The country is frequently affected by numerous climatic events including floods, droughts, cyclones, etc., which damages the farm household’s livelihood and socio-economic condition. Therefore, this work intends to appraise the smallholder farmers’ perceived climate-related risk, impact, and the factors that influence their choices of adaptation strategies to cope with the adverse impact of the climatic extreme events in northern Bangladesh. Survey data were collected from 300 respondents from two drought-prone districts of northern Bangladesh in January–February 2020. The climate-related risk perception index (CRRPI) was constructed to assess the farmers’ perceived risk. The multinominal logit (MNL) model was employed to explore the factors influencing farmers’ choices of adaptation strategies. Farmers’ perceptions of climate change risk were found to be consistent with meteorological data in the research area. Results of the CRRPI revealed that flood, drought, riverbank erosion, and heat waves were the critical risks perceived by the farmers. Farmers used a variety of adaptation measures to deal with these climatic threats, including agricultural diversification, changes in fertilizer and insecticides, and crop and seed changes. The MNL model results showed that the factors that influenced a farmer’s choices of adaptation strategies were age, education level, family members, income level, year of farming experience, and the farmer’s information on climate change. This study also demonstrated that water scarcity in the dry period and the frequency of crop diseases were the major limiting factors experienced by the farmers whilst undertaking adaptation strategies. Thus, awareness and capacity building through training and support to adopt the adaptation strategies are essential to enhance the resilience of the farmers.
1. Introduction
Poor households in developing countries such as Bangladesh are highly affected by climate change due to their low adaptive capacity and inadequate access to alternate means of livelihood [1,2,3,4]. Moreover, extreme weather phenomena are projected to become more recurrent and intense in the forthcoming period, with potentially severe adverse effects on the livelihood of farmers in developing countries, including Bangladesh [3,5,6]. Climate change will negatively affect crop production and lead to substantial changes in farming practices [7]. Despite technological advancements, climate change and variability are yet a primary determinant of agricultural crop production, where temperature and rainfall serve as critical driving factors in productivity and rural food security perspectives [8,9]. Growing climate issues are driving the demand for efficient solutions in the agriculture sector, which will improve farmers’ livelihoods and economic situations to cope with climate change [10]. Numerous studies have predicted that changes in climatic conditions will increase the frequency and magnitude of various dangerous climatic events and disasters such as floods, drought, storms, and cyclones [2,3,4,5,6,7].
Bangladesh is one of the most densely populated agriculture-based countries across the globe. Agriculture contributes about 13% to the gross domestic product (GDP), and employment of more than 42% [11]. However, the agriculture sector is the most vulnerable to climate change and is most affected by numerous climatic change impacts such as flood, drought, riverbank erosion, extreme weather, etc., and the northern regions of Bangladesh are particularly vulnerable to such climatic impacts. Drought is an extreme climatic event in this region that harshly affects agricultural production and rural household’s livelihoods [12,13]. Flood is the most severe adverse effect on human livelihoods, and leads to more fatalities and triggers widespread material damage to such a degree that the household cannot cope without outside support due to their limited adaptive capacity and resources [13,14]. Flood and drought frequency and magnitude are mostly linked to environmental and meteorological changes in developing countries. If the impacts of climate change on farming systems are not detected properly, they might have a significant impact on food production and food security, as well as become an impediment to poverty-reduction initiatives and sustainable development. The emissions of CO2 and other greenhouse gases is rising continuously around the world, which results in an increasing temperature level that will result in climate change variability and more threats to the agricultural sector [15]. Climate change will have a substantial impact on agricultural productivity, and will result in significant changes in agricultural output [7]. To tackle climate change risk and impacts, many nations have turned to green agriculture technology, which provides sustainable adaptation measures [16].
Many studies have addressed climatic risk, impacts, and adaptation strategies in different countries in regards to mitigating the negative impacts of climate change on agriculture, including Nepal [17], China [18], Pakistan [19,20,21], Africa [22,23], Canada [24], and Australia [25]. In Bangladesh, studies on farm-level adaptation strategies have concentrated on the salinity-prone southwestern coastal region; for example, [26,27,28], drought-prone regions in the northwestern areas [12,29,30,31,32,33,34], both drought and flood-prone northern areas [9,13,35,36,37], and rural riparian areas [2,38,39]. Previous research has demonstrated that farmers typically adopt a variety of strategies to adjust agriculture to climate change risk [19,20,29,35]. Farmers use a variety of techniques in their agricultural sector such as altering crop varieties, farm diversification [35,36,37]; nonagricultural income [9,13], and changing fertilizers and pesticides [15,34]. Technological improvements include the growth of novel and heat-tolerant crops, as well as developments in irrigation and water supply systems [21,35,36]. Farmers’ psychological variables are a major concern that has resulted in different risk perceptions and adaptation techniques in response to climate change. The psychological elements assist farmers in comprehending extreme climatic occurrences, such as their risk, effects, and consequences, and so provide a perspective of taking adaptation measures to lessen climate change risk and impact [33,34,36,37].
However, research regarding farmers’ context-specific perceived climate change vulnerability associated with extreme climatic event and adaptation strategies are scarce in the northern region of Bangladesh, which is one of the extreme vulnerable regions of the country. Understanding farmers’ context-specific perceived climate-related risk and their adaptation strategies at the local farm level is crucial for supporting farm households in combatting climate change issues [26,37,40,41]. To close this research gap in earlier literature, this study aimed to investigate the smallholder farmers’ perceived climate-related risks and impact. The study further reveals the major factors influencing the choices of adaptation strategies by using farm-level data from northern Bangladesh.
2. Conceptual Framework of the Study
Climate risks, including extreme climatic phenomena such as droughts, floods, riverbank erosion, and heatwaves, have adversely affected crop production and the livelihoods of millions of households [7,42]. To combat climate-related risk and impacts on crop production, farmers persistently take many adaptation measures [43] that are not always similar to other’s livelihood pursuits. In our research, we defined climate change as observed or perceived changes in the local atmospheric condition over the past 30 years in terms of frequency of extreme environmental phenomena such as droughts, floods, heatwaves, cold periods, and so on [44]. Therefore, the level to which an environmental system (in our case, a farm) is susceptible to an environmental stimulus is associated with the farm’s capacity to be adversely affected and cope with its detrimental effects [45].
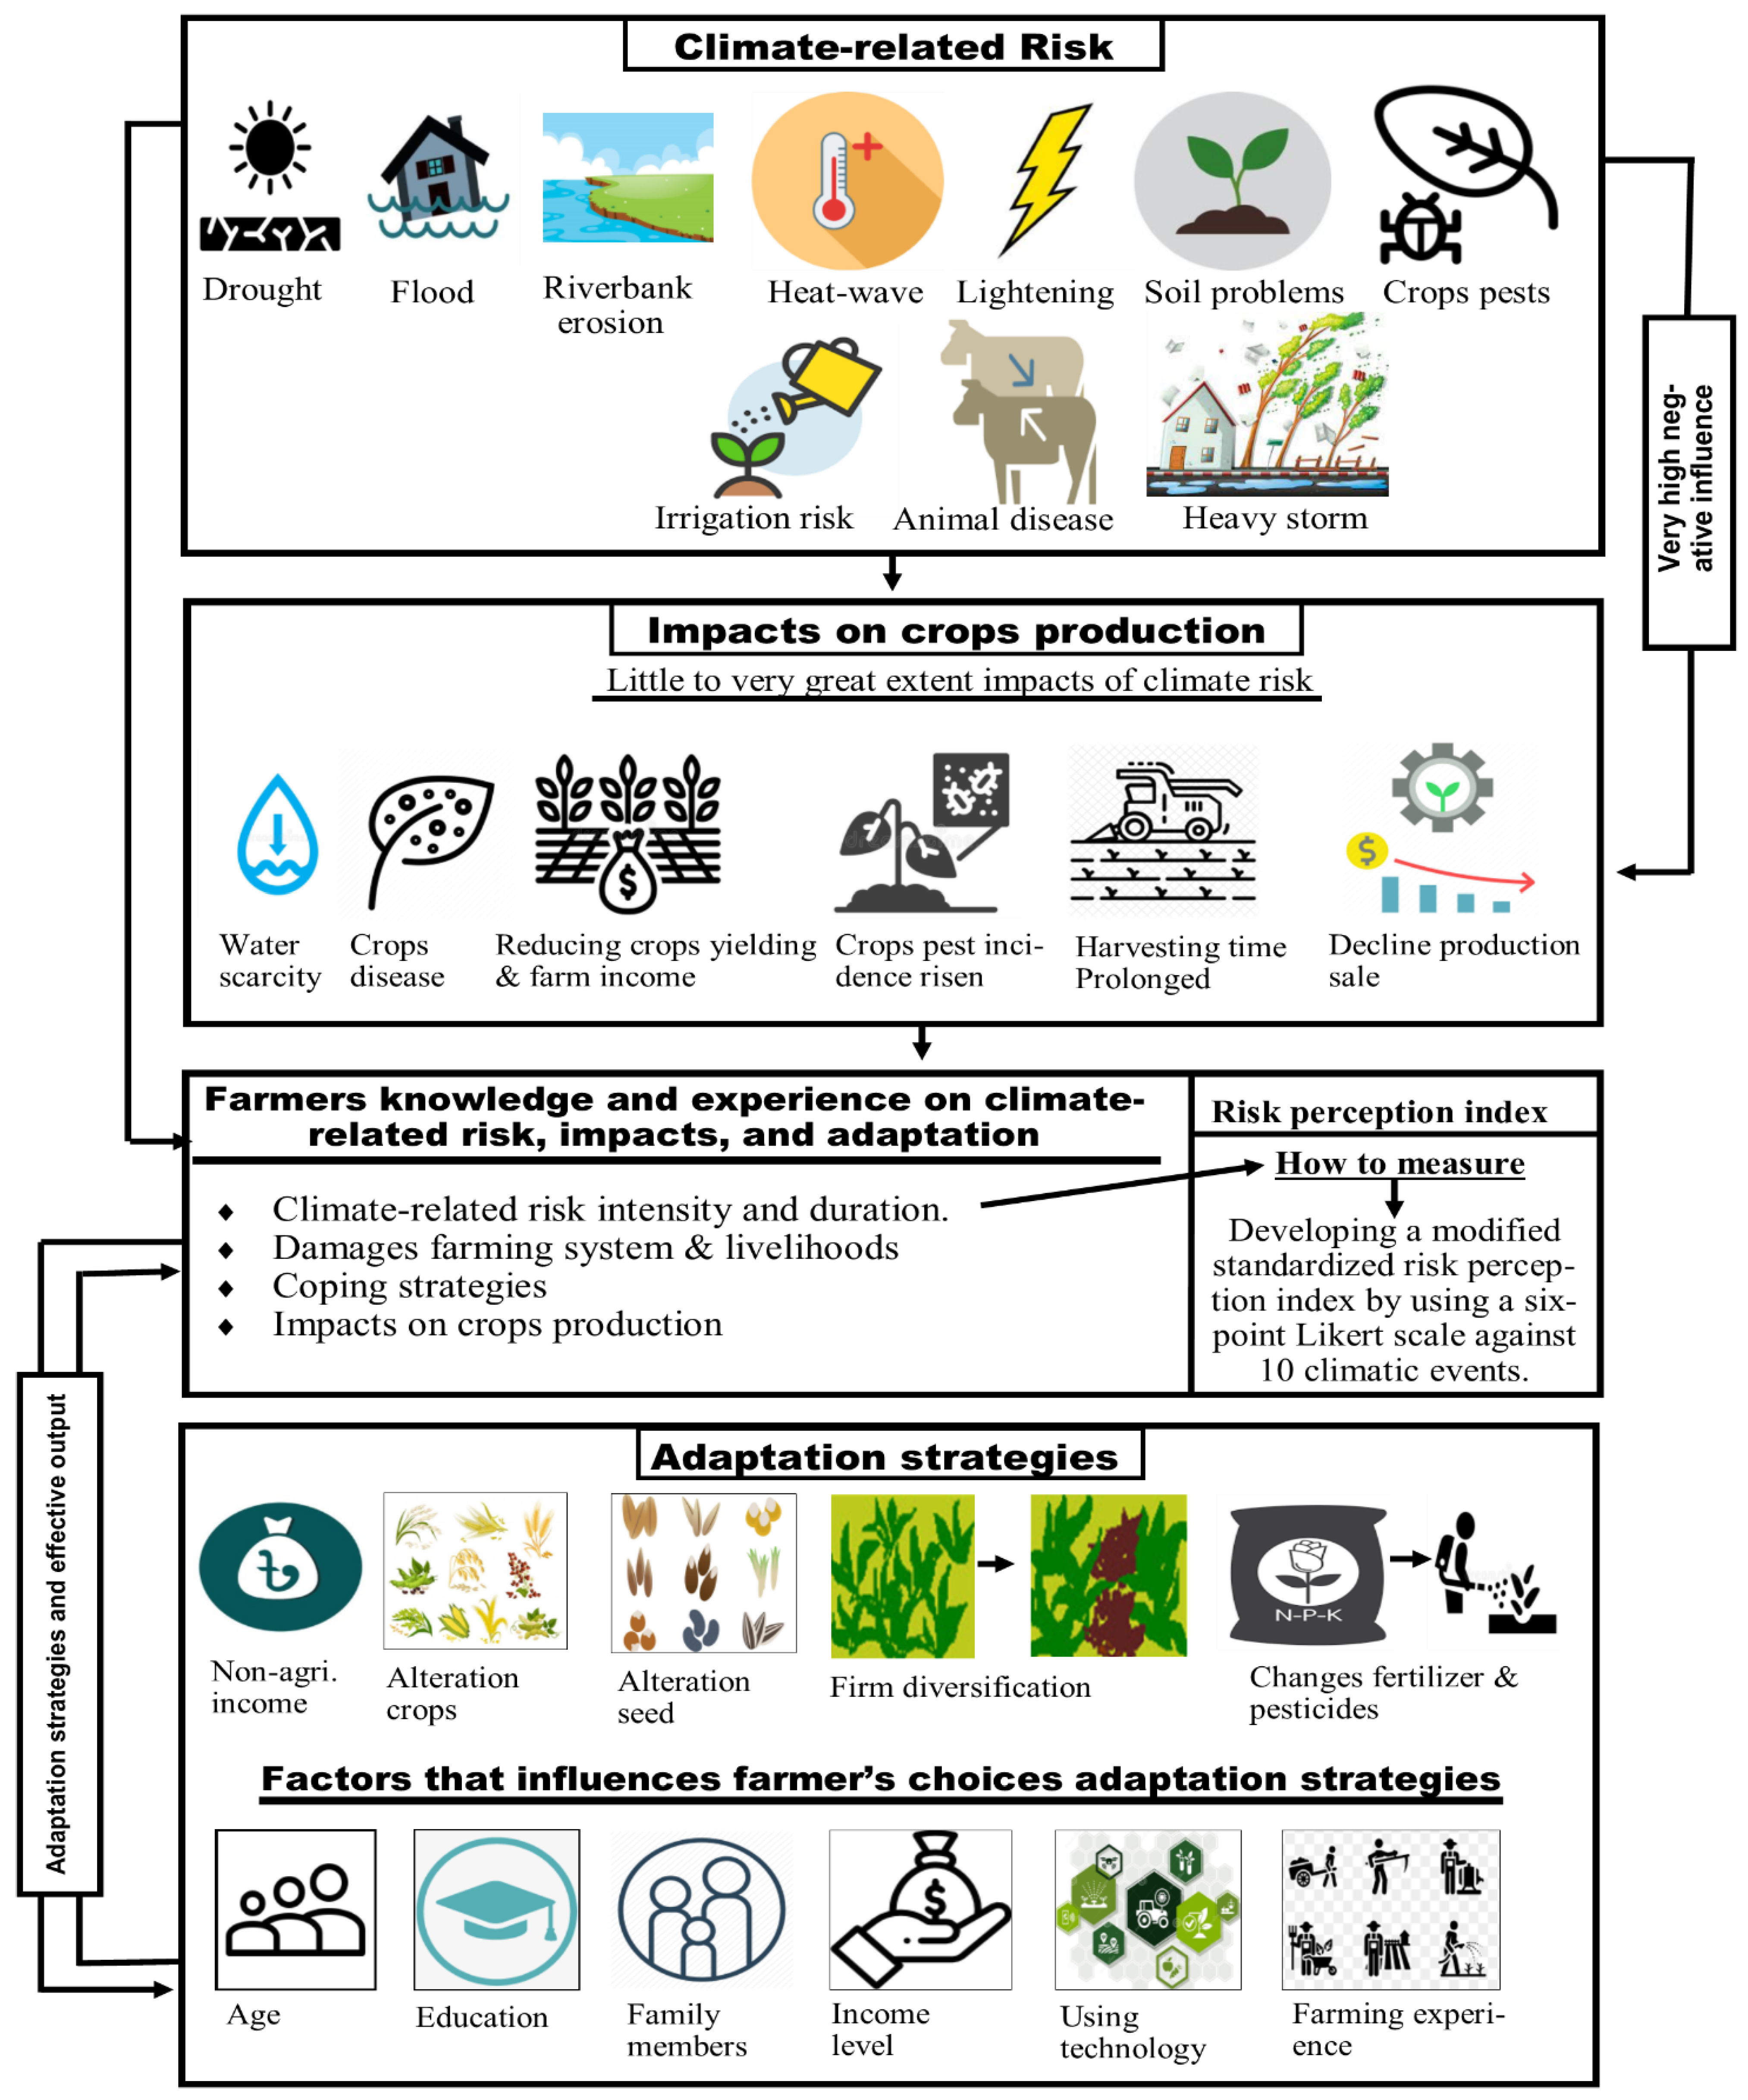
Many approaches have been used in the existing literature to gain insights into climate-related risk perceptions. Of these, most studies have focused on measuring risk perception of climate change from their own experiences and through different factors, including social, cultural, and psychological, by using Likert scales [2,38,39,46]. The Likert scale is broadly utilized in behavioral studies that help to develop relative insight scales. In this study, we also adopted a Likert scale to measure farmers’ risk perception of climate change. In such a manner, the perception output is expressed by index-based values. These index values are defined by a modified climate-related risk perception score (CRRPS) and the modified climate-related risk perception index (CRRPI) to inspire a superior understanding of how farmers perceive climate-related risks and impacts (Section 3.5). Such climatic risks include crop pests, irrigation risks, animal diseases, etc., which adversely affect water availability, reducing crop yields and farm income, and increases crop pests (Figure 1).
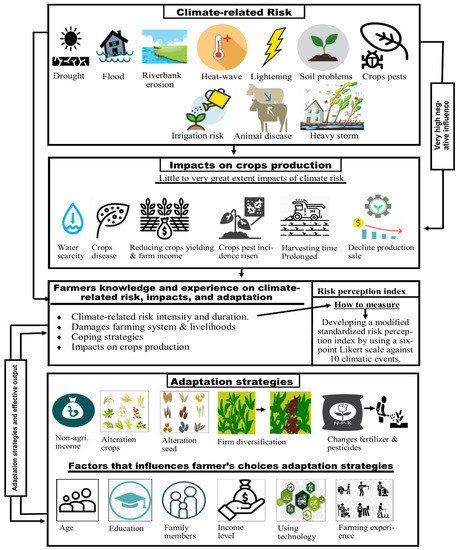
Figure 1.
A conceptual framework for the implication of assessing farmers’ perceived climate-related risk, impact, and adaptation strategies.
Adaptation strategies to cope with the effects of climate change in principle can be planned for farm households’ resilience. For example, on a short-term basis, a few adaptation measures, such as livestock rearing and vegetable gardening, as well as nonagricultural income, provide a better resilience. The farmers take some medium-term adaptation measures to strengthen resiliency, such as altering crop varieties, altering seed quality, and changes in irrigation systems and planting time to fight against medium-term impacts of climatic risk and vulnerabilities (Figure 1) [35]. In long-term adaptation strategies, farmers’ practice farm diversification; increasing nonagricultural income helps them to cope with extreme climatic events such as droughts, floods, heatwaves, etc. [36,37].
Most of the measures were reported as short to medium-term plans. However, we did not differentiate farmers’ adaptation measures into short-, medium-, or long-term, and instead represented them as specific measures, and explored the significant adaptation measures and persistency that effectively helped the farmers cope with climate change (Figure 1). Based on these criteria, we reported the following assumptions: (i) farmers who have sound understanding or knowledge and experience of a higher degree of effects in terms of climate-related risk on their crop production and livelihoods are more probable to adopt adaptation measures than other farmers; and (ii) the adaptation strategies are effectively helping the farmers to cope with this climate change in this region by reducing impacts and vulnerabilities. The decision to pursue these adaptation measures while considering the related factors is an appropriate action against the effects of climate change on their crop production, and economic and property damages. Thus, exploring these risk perceptions, effects, and effective adaptation strategies is used to make sustainable planning, policy, and appropriate measures concerning climate change.
3. Materials and Methods
3.1. Study Area
The present study was performed at the Phulbari and Hatibandha Upazilas in the Kurigram and Lalmonirhat districts of the northern region of Bangladesh, respectively. The area is geographically situated within 25 adaptation strategies. suste and 89°0′0″ E to 89°3′0″ E longitude (Figure 2). Then, four villages from these two Upazlias were selected for data collection while considering three aspects: (i) these villages, situated on the bank of the Teesta and Dharla Rivers, are highly vulnerable to flooding, and every year enormous floods occur in this area; (ii) the levels of severity of riverbank erosion that was recognized through an extensive review of the reports in newspapers and in consultation with local-level field experts; and (iii) the intensity of heatwaves and droughts in the dry period that was acknowledged by the review of a scientific journal and discussion with local people [37]. Char Gorok Mondol and Asiyar Bazar of Phulbari Upazila, East Daoabari, and North Daoabari of Hatibandha Upazila were selected for this research based on the aforementioned aspects.
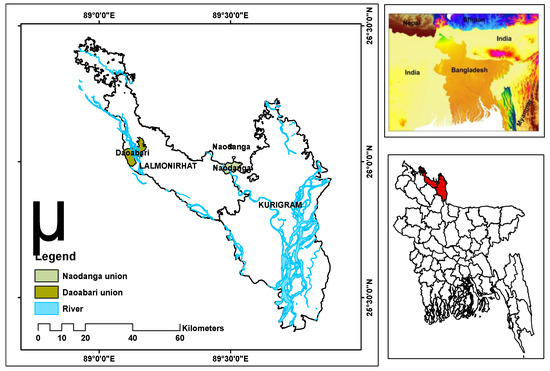
Figure 2.
Map showing the survey sites in northern Bangladesh.
More than 72% of the people are directly dependent on agriculture in this area. In terms of geographical location, the climatic condition of the region is sub-tropical wet and dry, and low rainfall in the area (<1200 mm on average) has been observed in the last three decades. Moreover, the future prediction shows that this will be decreasing slightly within the 21st century [3]. These climatic disasters and their impacts in the area severely damaged the farmers’ agricultural sectors, livelihoods, and properties, which lead to socio-economic disruption and threats to food security. Therefore, a multistage sampling technique was applied to appraise farmers’ perceived climate-related risk, impact on crop productions, and the factors influencing farmers’ adaptation strategies in northern Bangladesh. In the first stage, the two Upazilas in the Kurigram and Lalmonirhat districts were selected. The second stage included the random selection of four villages corresponding to population size, while the third stage included the random selection of villages corresponding to each village size. The final stage was the random selection of 300 households equivalent to the size of the chosen villages.
3.2. Sample Size Determination
Cochran’s formula was used to determine the sample size [47]. According to the Upazila agricultural office of Phulbari and Hatibandha, the total number of farmers in these selected four villages was 1400. The estimated sample size was 300 (80 for Char Gorok Mondal, 70 for Asiyar Bazar in Phulbari Upazila, 80 for East Daoabari, and 70 for North Daoabari in Hatibandha Upazila). The confidence level and margin of error (confidence interval) were 95% and 5%, respectively.
where:
= Sample size of a given population;
= Sample size for infinitive population; and
N = Population size.
3.3. Data Collection
Both qualitative and quantitative approaches, including a household survey and key informant interviews, were adopted to collect the dataset for this research. The survey datasets were collected from January to February 2020, before the COVID-19 pandemic began, through a semistructured questionnaire (see supplementary material) using a face-to-face interview method. The household head (male or female) was the respondent. The respondents were selected randomly from the list of farmers, which was received from the local agricultural extension office, and this technique also utilized a top-down approach to explore the real climate-related risk, impact, and adaptation strategies in two drought-prone regions. Before designing a questionnaire, regular discussions were held with the community-educated persons, including teachers, an elderly person with good knowledge, local government authorities, nongovernmental organizations (NGOs), farmers, and during field observations. Each of the questions followed a chronological association to understand the influence of various variables related to climate-related risk, impacts, and adaptation strategies. There were five sections in the questionnaire: (1) demographic and farm profiles of the respondents such as age, education, income level, earning members, etc.; (2) farmers’ perceived risks related to climate change, (3) determinants of climate change and its risk severity including floods, droughts, and riverbank erosion; (4) perception of climate change vulnerability in crop production; and (5) farmers’ adoption of the adaptation strategies toward these threats.
Moreover, we gathered rainfall and temperature datasets for the last 35 years (1984–2018) from the Rangpur observation station of the Bangladesh Meteorological Department [48]. General linear regression was performed to obtain the mean rainfall and temperature trends [7]. The aim of the climatic dataset was to verify the climatic variables with farmers’ perceptions, which change frequently in the study region. In addition, photos of several major adaptation strategies with necessary notes were taken while visiting and surveying the study sites.
3.4. Multinomial Logit (MNL) Model
The multinomial logit (MNL) model is the most robust regression model that is widely used for the nominal result [9,49]. The main advantage of this model is that it permits the study of choices over more than two categories and allows the determination of choice likelihoods for various classes [9,49]. Any adaptation strategies may be adopted under the certain circumstance of efficiency and benefit maximization [50]. Thus, this study used this model due to farmer’s adaptation strategies utilizing discrete dependent variables with various choices of strategies.
To represent MNL, let Uh and Uk imply a random choice variable of farmers i, who can select between any two choices, then the random utility model can be stated as follows:
where and are the farmer random utility in Equation (2) of farmers’ selected options h and k, respectively; , indicate the deterministic (explainable) or systematic utility components; and are the stochastic (random) variables that represent the unobservable effect on individual selections and measurement errors, and are expected to be independently and identically distributed [51]. On the basis of utility extension performance, a farm household will only select an option h if for all . Deterministic components or denote an attribute vector x; for example, or . Therefore, utility is not easily noticeable; rather, a farm household’s selection of an adaption measure can be seen. While there are numerous options, the likelihood of different adaptations can be represented as a probability:
where represents an unknown vector coefficient, x denotes a vector of explanatory factors influencing adaptation choice, and indicates a random error term. The probability that a farm household will select option h for a given x is provided as follows:
The selected models can evaluate Equation (5) [51]. The assumption of independence of irrelevant alternatives (IIA) must be met in order to obtain unbiased and reliable parameters of the model [52]. It implies that the likelihood of a certain farm family adopting a specific adaptation approach is independent from the probability of picking an alternative adaptation strategy. The parameters assessed by the MNL model offer only the direction of the impact of the independent variables on the dependent variable, but the assessment does not describe either the actual level of changes or likelihoods. So, the marginal effects are functions of the probability itself, and compute the predictable change in likelihood of a specific choice being made to a unit variation in an independent variable from the mean [53]. The marginal impact can be represented by the following Equation (6):
Marginal effects determine the likelihood of variation in the probability of adapting to a specific choice in response to a unit change in an explanatory variable [51]. An MNL model may be thought of as simultaneously calculating binary logits for all potential differences among the results. With Z outputs, only Z-1 binary logits must be approximated. Farmers could select their preferred choice from a set of unordered and distinct adaption strategies, one of which was the base category. For this work, there were seven adaptation strategies (dependent variables), and 10 explanatory variables (independent variable) were chosen for the MNL analysis to explore the factors that influenced the choices of farmer’s adaptation strategies, which are shown in the following Table 1.

Table 1.
Description of the variables used in the multinominal logit model.
3.5. Climate-Related Risk Perception Index (CRRPI)
The climate-related risk perception index (CRRPI) was constructed based on the modified climate-related risk perception score (CRRPS) to evaluate the farmers’ perceived climate-related risks against any climatic phenomenon based on their inherent experience [39]. Climate change risk perception is a multitask procedure that depends on different factors including socio-economic, demographic, political, and cultural activities [54]. Overall, personal understanding leads to a pivotal role in identifying farmers’ perceived climate-related risks [55]. Some studies have adopted Likert scales to estimate farmer’s perceived climate-related risks [2,38,39,46]. The Likert scale is generally employed in behavioral research that aids in developing a relative perception level. In our study, we also adopted a similar type of Likert scale to determine farmers’ perceived climate-related risks. In such a case, the CRRPS and CRRPI were applied thoroughly to obtain a better understanding of how farmers perceived climate-related risks.
The participants were requested to appraise their view on 10 climatic phenomenon statements to gain a thorough understanding of the relative perception of the respondents on the 10 chosen climatic phenomena. A six-point Likert scale was adopted to estimate their perception levels. The Likert scale ranged from “no perception” to “very high perception” where in the middle of two lower and upper corners, “very low perception”, “low perception”, “medium perception”, and “high perception” were incorporated in this study. For ease of analysis, the values of equivalent perception scales were varied; for example, 0 for no, 1 for very low, 2 for low, 3 for medium, 4 for high, and 5 for very high, respectively.
The CCRPS was computed to justify the purpose using Equation (7):
where CRRPn = the number of participants with no perception;
- CRRPvl = the number of participants with very low perception;
- CRRPl = the number of participants with low perception;
- CRRPm = the number of participants with medium perception;
- CRRPh = the number of participants with high perception, and;
- CRRPvh = the number of participants with very high perception of risk.
Since there were 150 respondents from Phulbari Upazila and 150 respondents from Hatibandha Upazila, the CRRPS for any climatic phenomenon could be varied from 0 to 750 in both the Upazilas, which meant the lower boundary would be 0 and the upper boundary would be 750, respectively. Afterward, we transformed the CRRPS into a standardized index for further explanation of the outcomes. To standardize the CRRPS, we applied Equation (8):
where the total CRRPS value was computed by multiplying perception values with total perception frequency against each climatic phenomenon, and the respective maximum CRRPS value was computed by dividing the total CRRPS value by the uppermost maximum boundary value and multiplying it by 100. CRRPI allowed us to understand and classify farmers’ perceived climate-related risks [39,42,49]. The CRRPI values ranged from 0 to 100, where 0 and 100 were the minimum and maximum levels of farmers’ perceived climate-related risks in the study area.
CRRPI = (Total CRRPS Value)/ (Respective maximum CRRPS Value) × 100
3.6. Statistical Analyses
Statistical analyses, such as a descriptive analysis and the mean annual temperature and annual rainfall datasets, were performed for 1984–2018 to compare these with farmers’ perceptions of the climate change variables. A general linear regression was performed to obtain the mean temperature and rainfall trends. In this study, we used an MNL model to reveal the factors influencing adaptation strategies that the farmers in the study region adopted in their choices of adaptation strategies [9,52,53,56,57]. All statistical analyses were performed using STATA (version 12) and MATLAB (version 2018a) software, and the study map was prepared using ArcGIS (version 10.7).
3.7. Ethical Statement
Participants were informed of the particular purpose of this research before proceeding to the questionnaire. Participants’ consent was acquired before the survey, and their anonymity was established. The survey was done only once, and the survey could be accomplished or ended whenever they wished. The questionnaire survey content and procedure were suitably reviewed and approved by the proposal assessment and ethical committee of the Department of Disaster Management of Begum Rokeya University, Rangpur.
4. Results
4.1. Demographic and Farm Profiles of the Respondents
The demographic and farm types of the farmers are outlined in Table 2. Most of the respondents were in the age group of 41–50 years in both the Upazilas. The education level of the respondents in both the Upazilas showed that only a small percentage had education status above the secondary level. In the Phulbari and Hatibandha Upazila, about 23.3% and 36% had primary education, and 26% and 24% had secondary education, respectively. The majority of the respondents in both the Upazilas had four or five members in their family. Still, the member ratio of more than six (>6) was higher in Phulbari Upazila (24.7%) than in Hatibandha Upazila (12.7%). Farmers in Phulbari Upazila were less experienced in farming than in Hatibandha (Table 2).
Table 2.
Demographic and farm characteristics of the study participants.
Most of the farmers relied on agricultural activities. For farmers’ monthly income levels in the region, most households had income levels ranging from USD 47.05 to USD 70.58. The streets and transportation are also insufficient in the region. Small machines that farmers drive to market their goods primarily included vans, cycles, rickshaws, and tempos.
4.2. Farmers’ Perception about Climate Change
To investigate farmers’ perception of climate change, they were asked their opinion on whether the temperature, rainfall, flood, and drought frequency in the region over the last 30 years had increased, decreased, or did not change, or if they did not know. Figure 3 shows that most of the farmers in both the Upazilas perceived that the temperature and drought intensity were increased over the last 30 years (Figure 3a). Regarding temperature and drought in Phulbari Upazila, 93% and 69.87% of the farmers, respectively, perceived an increase. The farmers observed irregularities in this climatic variable with time and distribution, which caused solemn concerns for their farming plan. The study revealed that the farmers perceived the rainfall as slightly decreasing, and that the flood frequency was continually increasing due to the geographical transboundary river setting. In Phulbari and Hatibandha Upazilas, 37% and 34% of the farmers respectively perceived that the rainfall was decreasing. Regarding flood intensity, most of the respondents in Phulbari and Hatibandha Upazilas perceived that flooding was increasing, and the ratios were 88.73% and 94.68%, respectively.
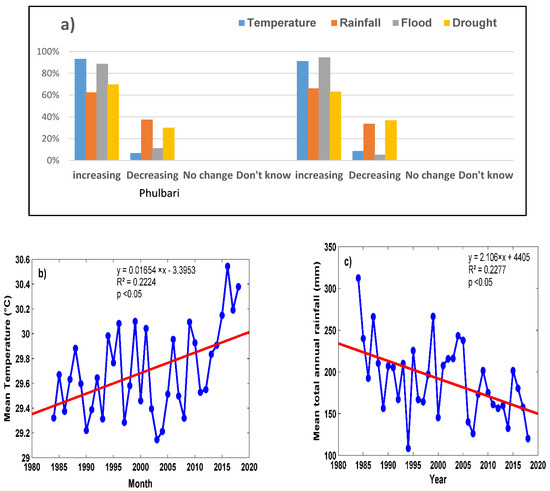
Figure 3.
(a) Farmers’ perceptions of temperature, rainfall, flood, and drought changes in last 30 years (source: field survey, 2020); (b) observed annual mean temperature; and (c) observed mean total annual rainfall (mm) trends in the study area in 1984–2018 from the Rangpur observation station of the Bangladesh Meteorological Department, 2020.
More importantly, the farmers’ perception of rainfall and temperature changes was also supported by the observed meteorological data. The observed datasets indicated that annual mean temperature showed an upward trend (R2 = 0.2224, p < 0.05) from 1984 to 2018 in the study region (Figure 3b). By contrast, the mean rainfall exhibited a downward trend (R2 = 0.2277, p < 0.05) over the observation period (Figure 3c), which was in good agreement with the farmers’ perceptions.
4.3. Farmers Perceived Climate-Related Risks
On the basis of the modified climate-related risk perception score (CRRPS), we can state that the farmers had very low to very high levels of sensitivity. In Phulbari Upazila, the results showed that the three climatic events; e.g., soil problems, crop pests, and animal disease (score 300–388), had very low to medium sensitivity levels, while in Hatibandha Upazila, only the soil problem (score 331) had the same level of sensitivity. On the other hand, the remaining climatic phenomena in both the Upazilas had medium to very high sensitivity levels: in Phulbari Upazila, the scores ranged from 444 to 543; and in Hatibandha Upazila, 436 to 553.
The SCCRPI values in both the Upazilas represented that the farmers’ perceived climate-related risk type was heterogeneous, and varied from 40–72.40 in Phulbari Upazila and 44.13–73.73 in Hatibandha Upazila (Table 3). Most of the farmers in both Upazilas had medium to very high risk perception index values (Table 3). Farmers rated various climatic events such as droughts, floods, riverbank erosion, and other events on a scale of very high, high, medium, low, and very low, depending on psychological, socio-economic, demographic, and cultural factors [54]. Farmers in both Upazilas believed that soil problems, crop pests, and irrigation dangers were all serious threats to their agriculture industry as a result of climate change. Several studies already stated this climate risk perception based on Likert scales [2,38,39,46]. This study showed that the farmers of the Hatibandha Upazila were most risk-prone to climatic events. The FGD also indicated that estimated index values for every climatic event matched with farmers’ accumulative responses. Table 3 shows the farmers’ perceived climate-related risk according to 10 prearranged climatic phenomena, along with risk perception scores and risk index values.
Table 3.
Climate change risk perceptions of farmers.
Afterward, we calculated the respective risk perception score and risk index value for each climactic phenomenon; we ranked them on a 1–10 scale for sound understanding and analysis. The CRRPI showed that in both the Upazilas, farmers perceived that floods, droughts, riverbank erosion, heatwaves, crop pests, and irrigation risks were the significant risks of climate change. In addition, different researchers found comparative outcomes [2,38,39,58].
4.4. Perceived Impacts of Climate Change on Crop Production
Table 4 presents the farmers’ perceptions of the impacts of climate change on crop production. Drought appeared as the main risk to crop production in the study area. Respondents implied that rivers, channels, and dams with good water supply sources for their agricultural fields were no longer adequate or had wholly dried up. Most of the respondents stated that droughts impacted crop production “to a great extent”, and soil conditions had become unsuitable for planting “little to some extent”. In addition, the frequency of crop disease increased due to the incidence of pests and other climate-related hazards, which made it difficult to produce quality crops. Thus, farmers incurred huge income losses from farming.
Table 4.
Farmers’ perceived impacts of climate change on crop production.
4.5. Adaptation Strategies Choices by the Farmers
The adaptation strategies that farmers chose to cope with climate change are outlined in Table 5. The survey results showed that a majority of the farmers in both the Upazilas chose changing fertilizers and pesticides—37.3% in Phulbari Upazila and 40% in Hatibandha Upazila. The ratio of increasing nonagricultural-income in the Phulbari and Hatibandha Upazilas were 27% and 23%, respectively. In addition, 16% of farmers in the Phulbari and 15% in Hatibandha Upazilas were changing their irrigation systems and crop-planting times for better agricultural output.
Table 5.
Distributions of farmers according to adaptation strategies.
The climate-tolerable crop variety and good seed quality brought the farmers excellent agricultural output in the region. Table 5 shows that 11% of the farmers in Hatibandha Upazila and 14.7% in Phulbari Upazila chose alteration of seed quality. Livestock rearing and vegetable gardening were effective adaptation strategies to fight against climate change. The results revealed that the livestock rearing and vegetable gardening ratio in Phulbari Upazila was higher than in the Hatibandha Upazila, and the ratios were 9.3% and 6.6%, respectively. Farmers reported that they used more irrigation for their crops during periods of drought or extreme temperature, and particularly at swing steps while increasing crop pests due to heavy rainfall and after flooding, farmers used more pesticides to protect their crops from damage. In addition, farmers who were informed of soil problems reported using changes in fertilizer to preserve soil fertility.
4.6. Factors Influencing Farmers’ Choices of Adaptation Strategies
Table 6 shows the factors influencing farmers’ adaptation strategies for climate change in the study area. The MNL model was noteworthy at a 1% level, which denoted that all the independent variables jointly influenced the dependent variables. In both the Upazilas, the age of the farmers was positively related to the increasing nonagricultural income, changes in fertilizer and pesticides, and alterations of seed quality. In Phulbari Upazila, a farmer’s age positively influenced increasing nonagricultural income (0.001, p < 0.05), changing fertilizers and pesticides (0.003, p < 0.05), and alterations of seed quality (0.005, p < 0.05); while in Hatibandha Upazila, increasing nonagricultural income (0.115, p < 0.1) and changing fertilizers and pesticides (0.035, p < 0.05) were positively related to age, but alteration of seed quality was conversely related to age (−g.082, p < 0.1). Thus, an increasing farmer’s age in the both Upazilas increased their nonagricultural income, and the rate of changing fertilizers and pesticides. Altering seed quality adaptation strategies is increasing, which also is relative to livestock rearing and vegetable gardening adaptation strategies. Evidence from various sources denoted a positive influence of a households’ education level on climate change adaptation [50]. This indicated that farmers who had a higher level of education were more expected to adapt better to climate change impacts. Education levels in both Upazilas were positively related to irrigation systems and planting time (0.064, p < 0.01 in Phulbari Upazila and 0.025, p < 0.05 in Hatibandha Upazila). Farmers’ farming experience was significantly related to three adaptation strategies in both the Upazilas. In Phulbari and Hatibandha Upazilas, farming experience showed a significant positive influence on changing fertilizers and pesticides (0.063, p < 0.1; 0.088, p < 0.05), and changing irrigation systems and planting times (p < 0.05; p < 0.01). This revealed that the farmers with increasing farming experience had adopted changing fertilizers and pesticides, and changing irrigation systems and planting times, relative to livestock rearing and vegetable gardening strategies, to combat climate change. Table 6 shows that credit accessibility and using technology had no significant influence on adaption strategies in the study area. The study showed that support from the government, nongovernment, and others in both Upazilas had a positive relation with alteration of seed quality in Phulbari Upazila (0.021, p < 0.1) and in Hatibandha Upazila (0.009, p < 0.1).
Table 6.
Factors that influenced farmers’ choices of adaptation strategies for climate change using a multinomial logit model.
Table 6 shows that the family members had a positive relationship with increasing nonagricultural income and alteration of crop varieties. In Phulbari and Hatibandha Upazilas, for increasing nonagricultural income, the results were 0.019, p < 0.05 and 0.019, p < 0.05, respectively; and for alteration of crop varieties, 0.033, p < 0.05 and 0.016, p < 0.01, respectively. The results revealed that increasing income level and land ownership positively influenced all the adaptation strategies in the study region. Shiferaw and Holden emphasized that wealth is assumed to represent prior achievement of the household head and their capability to tolerate risks [59]. Thus, a household head with a high income level and more assets is in a good position to choose adaptation strategies. The study also found that farmers had more information on climate change, altered crop varieties, and changing irrigation and planting times. In Phulbari and Hatibandha Upazilas, farmers that had more information of climate change made choices on alteration of crop varieties (0.085, p < 0.05; 0.115, p < 0.05) and changing irrigation and planting times (0.007, p < 01; 0.175, p < 0.1) relative to livestock rearing and vegetable gardening adaptation strategies. The outcome agreed with with earlier studies that showed that access to information via additional services raises the probability of adapting to climate change impacts [60].
5. Discussion
5.1. Farmers Perception on Temperature and Rainfall Changes
It was noteworthy that farmers’ perceptions of temperature and rainfall variations in the last three decades were similar to the observed changes, in that temperature is increasing significantly, and rainfall is decreasing (Figure 2). A similar type of finding was also reported by [2,61,62], which implies that farmer’s opinions were beneficial, and their perceptions were consistent with the observed changes in temperature and rainfall in Bangladesh. Similarly, [63,64] found a comparable farmer perception of climate change at a global scale in which more accurate perceptions were seen in temperature compared to rainfall.
In comparison, [61] revealed that household-level perceptions of precipitation and winter temperatures in coastal Bangladesh were not well comparable with the recorded dataset, which could have been due to a lack of knowledge and some other socio-economic status. However, this study found a higher accuracy rate for climate change perceptions among the farmers, better education and socio-economic status, living closer to the market, using media, etc. The reasons for drought can be meteorological or hydrological, which result in irregularities in temperature and rainfall; a high evaporation rate; or groundwater depletion, all of which damage the agricultural sector and socio-economic conditions [12,53,60,61]. The meteorological and hydrological drought combination results in agricultural drought, which confines the loss of agricultural productivity to impacts including low precipitation, humidity, evapotranspiration, soil moisture, etc. [65]. These findings showed that farmers in the region face numerous drought risks associated with socio-economic threats. This situation becomes exceptionally severe, as the farmers have already lost agricultural productivity and farming income, with a probable further downward trend in the future. The farmers in this region may remain vulnerable to severe drought if they are not able to develop appropriate adaptation strategies. So, external support is essential for the farmers in the area to enhance their adaptation capacities.
5.2. Farmers’ Perceived Climate-Related Risk, Impacts, and Their Choices of Adaptation Strategies
Several studies [2,62,65,66,67,68,69,70] have identified that farmers’ perceptions of climate change impacts and their adaptions play a crucial role in reducing climate change impacts on crop production. Farm households’ reported numbers of risks revealed the significance of climate-related situations for agricultural operation. The study revealed that floods, droughts, riverbank erosion, heatwaves, and crop pests were the major climatic risks of climate change perceived by the farmers in both the Upazilas. Farmers rated these climatic occurrences on a scale of very high, high, medium, low, and very low, depending on their demographic, cultural, and psychological aspects, and then made a decision to implement adaptation measures to mitigate the risks and repercussions of climate change. Comparative outcomes were found by different researchers [2,38,39,58,61,66]. On the basis of the climate-related risk perception index (CRRPI) it was revealed that in Phulbari Upazila, heatwaves, droughts, heavy storms, and riverbank erosion were the top climatic risks. Floods, crop pests, animal diseases, and irrigation risks were also identified by the farmers in both Upazilas. Similar results were reported in the studies of [71,72], which indicated that farmers’ perceptions were comparable and reliable in formulating and implementing adaptation policies and strategies. The maintenance of crop production is essential for the farmers, but climate change is severely influencing it. The scarcity of water, increasing crop diseases, reduced crop yields, increasing pest incidence, and changing planting times were among the worst impacts due to climate-related risks such as droughts, floods, heat waves, crop pests, etc., in both Upazilas. Farmers reported that in recent times, the quality of crop production has been more complicated and climate change prolongs crop harvesting. Another study conducted by [12] identified droughts as a major disaster in northern Bangladesh that have more significant impacts on agriculture, social life, and human health. If the effects of climate change on farming systems are not identified in a cost-effective manner, it could seriously affect food production and food security, and also might be a hindrance to poverty-reduction attempts.
Farm households have pursued many adaptation strategies in response to numerous climate-related risks and impacts. In this study, we initially reported seven adaptation strategies based on their farm experience, climate-related risk, impacts, and factors including socio-demographic, cultural, and psychological. The adaptation strategies were: increasing nonagricultural income, alteration of crop varieties, alteration of seed quality, changing irrigation systems and planting times, and farm diversification, which reduced the impacts and vulnerabilities of the crop production as well as socio-economic damages due to climate change. Farmers’ practices included all these measurements at various times; for example, in livestock rearing and vegetable gardening in the short- and medium-terms, their practices were to change crop varieties, alter seed quality, change irrigation systems and planting times, etc. The study revealed that changing fertilizers and pesticides was the topmost adaptation strategy taken by farmers that resulted in increasing crops yields and helped to protect crops from diseases and pests. Farmers also changed fertilizer and pesticide brands and increased doses in a systematic ways, which resulted in better crop outputs. The salient feature of this study was that it identified the factors that influenced farmers in their choices of climate change adaptation. Age, income level, family members, farming experience, and climate change information positively affected farmers when choosing those adaptation strategies to combat the impacts of climate change [64]. The age of the farmers was positively related to increasing nonagricultural income, changing fertilizers and pesticides, and alteration of seed quality, which indicated that with an increasing age of the farmers, they chose these strategies more relative to livestock rearing and vegetable gardening. The different studies found that if the household head had a higher education, it positively influenced climate change adaptation [57]. The study also found similar results in that education positively influenced the farmers to change irrigation systems and planting times, and change fertilizers and pesticides in the region. Family members had a positive relationship with increasing nonagricultural income and farm diversification, which denoted that increasing family members also increased nonagricultural income and farm diversification, which improved the livelihood standards of the farmers. The study also found that farmers had more information on climate change, and that they had increased the likelihood of adopting strategies to climate change [60]. Strategies to increase nonagricultural income, which were practiced by the farmers, could be for short or long periods, depending on the risk scenarios. The farmers practiced increasing nonagricultural income to decrease agricultural dependency, and changed fertilizers, pesticides, and irrigation systems, which helped them to cope with climate change with resiliency (Figure 4). Farmers in the region adopted changing irrigation systems during drought events, while during flood events, they adopted nonagricultural income. The implementation of these adaptation measures at the right time can help to mitigate the future negative effects of climate change in the study region.

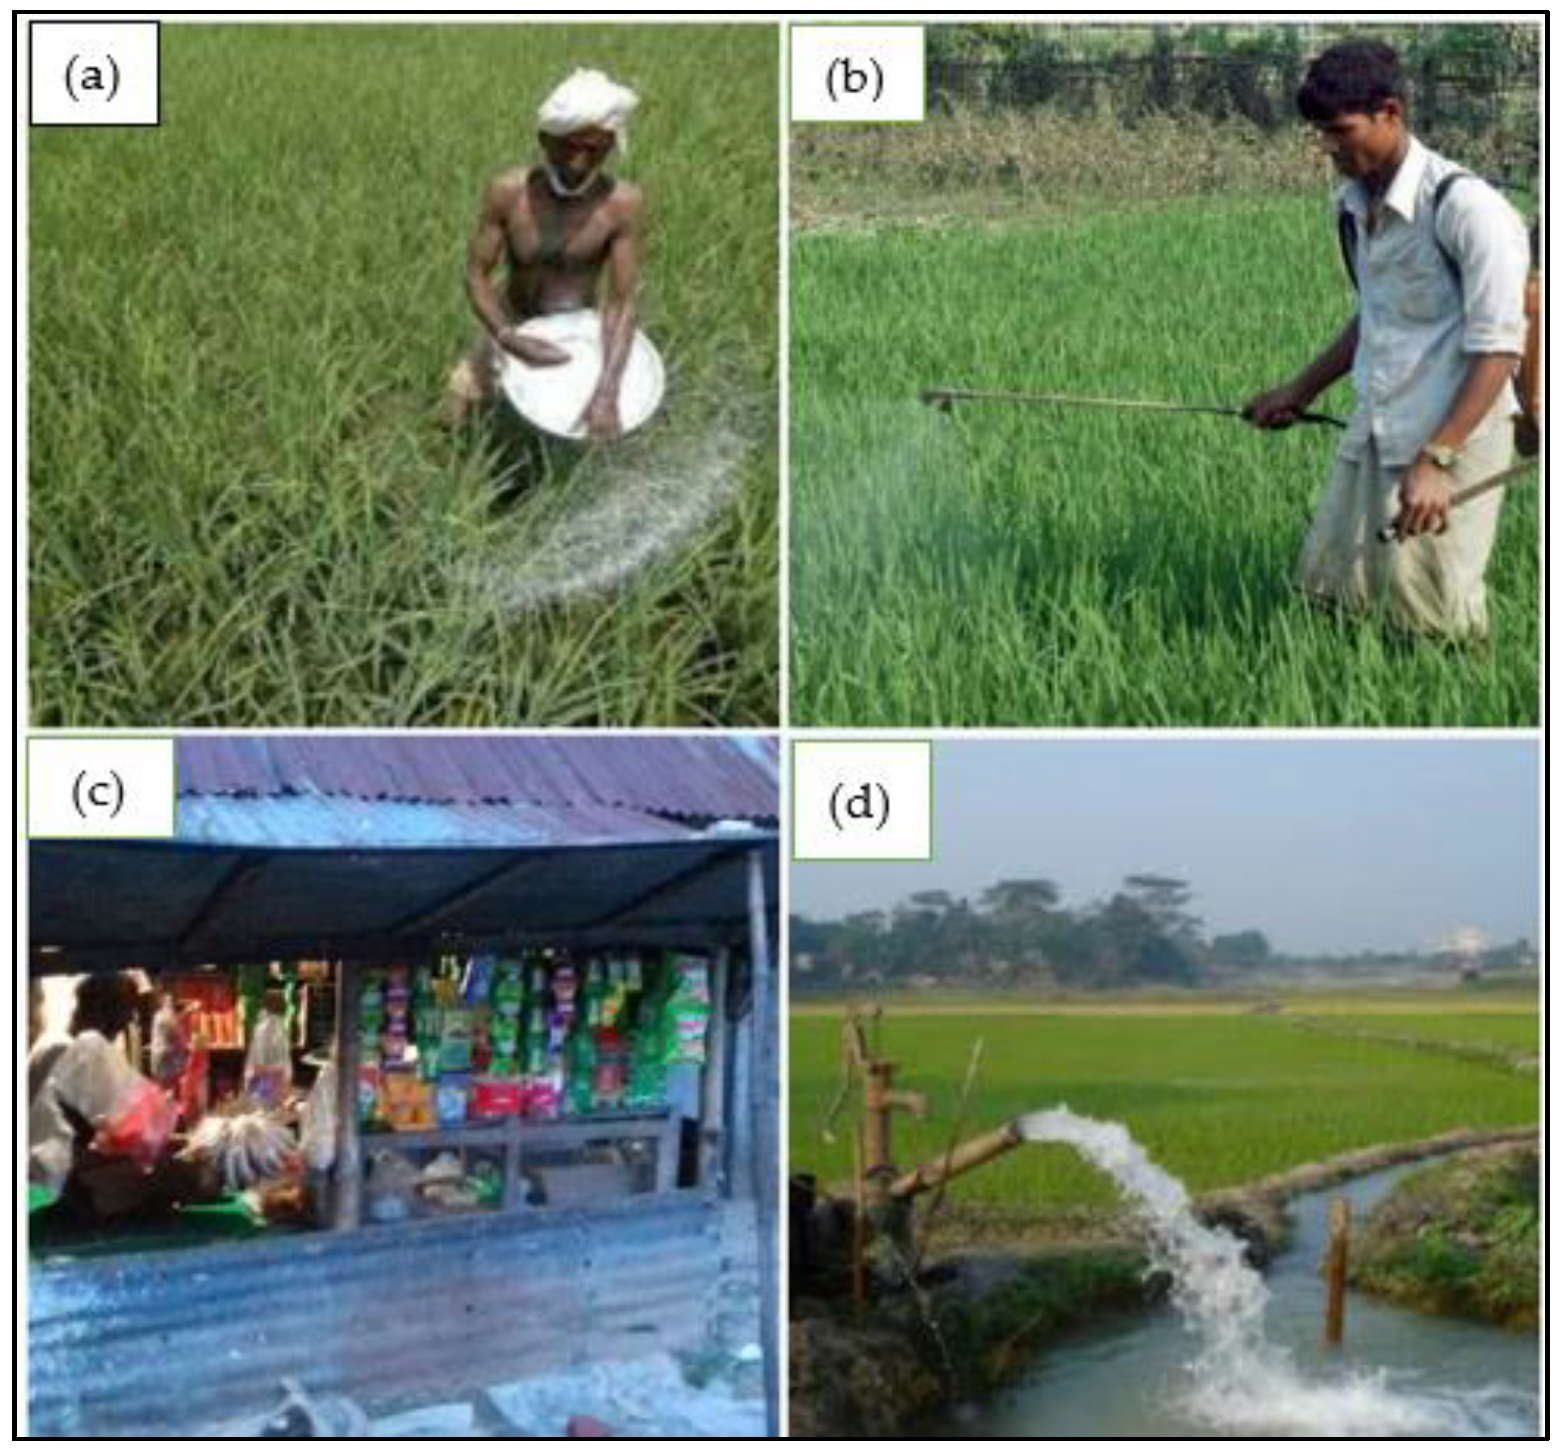
Figure 4.
Adaptation strategies of farmers that adapted to cope with climate change in the study area: (a) changing fertilizers; (b) changing pesticides; (c) nonagricultural income; (d) changing irrigation systems.
6. Limitations of the Study
This work had some limitations, such as a small sample size, a self-reported questionnaire that was prone to bias, and cross-sectional data. However, necessary steps were taken to solve the problems associated with cross-sectional survey data, resulting in rigorous results. In this study mostly socio-economic variables were considered for analysis, but there might have been other variables that influenced farmers’ adaptation strategies. The wider generalization of the results should be interpreted with caution, because the data were collected mainly from farm households in the Phulbari and Hatibandha Upazilas of Bangladesh.
7. Conclusions and Policy Recommendations
This study examined smallholder farmers’ perceptions of climate-related risks, their influence on agriculture, and their adaptation strategies for dealing with the adverse impact of climatic hazards on their farms. A total of 380 households were surveyed. The study revealed that climate change has a detrimental effect on the agricultural sectors, particularly on rural farmers in northern region of Bangladesh. CCRPI values revealed that floods, droughts, riverbank erosion, heatwaves, and attraction of crop pests were the significant risks of climate change perceived by the farmers. These events have a substantial impact on their agricultural activities. Farm households’ perceived risks related to climate change were further supported by the meteorological data in the study area. The study revealed that water shortages in the dry period and the frequency of crop diseases were the major restrictive factors on crop production faced by the farmers. Farmers in the region identified changing fertilizers and insecticides as the most effective adaptation techniques. Results from MNL analyses indicated that education, information on climate change, and age were the factors that positively influenced farmers’ choices of adaptation strategies. Extension services managed by experienced and skilled extension mediators would be encouraged to instruct and sensitize farmers about the impact of climate change on agriculture, as well as to teach efficient use of farm inputs such as farm chemicals, the unnecessary use of which could worsen the impact of climate change on farming production in the future. For long-term climate adaptability of the farmers, nonformal education services would provide a future resiliency. The modern irrigation system and rainwater harvesting could be introduced by the government in this region. It is essential to make the farmers aware of the climate risks and provide early warnings associated with natural disasters to diminish farming and livestock losses. The farmers could also offer information about flood- and drought-tolerant, high-yield crop varieties to improve soil quality and irrigation tools for the sustainability of farming.
8. Highlights
- Climate-related risk perception index was constructed to assess farmer’s perceived risk
- The multi-nominal logit model identified the factor influencing adaptation strategies
- Flood, drought, riverbank erosion, and heat wave were the key risk perceived by the farmers.
- Adaptation strategies were affected by farmer’s ability to respond to climatic hazards
Supplementary Materials
The following are available online at https://www.mdpi.com/article/10.3390/su132111922/s1, Questionnaire On Smallholder Farmers’ Perceived Climate-Related Risk, Impact, and Their Choices of Sustainable Adaptation Strategies.
Author Contributions
Conceptualization, A.A.M. and A.R.M.T.I.; methodology, S.C.P.; software, A.A.M.; validation, G.M.M.A., A.R.M.T.I. and J.M.; formal analysis, A.A.M.; investigation, M.A.S.; resources, E.A.; data curation, S.R.; writing—original draft preparation, A.R.M.T.I.; writing—review and editing, A.A.M.; visualization, S.R.; supervision, A.R.M.T.I.; project administration, J.M.; funding acquisition, E.A., J.M. All authors have read and agreed to the published version of the manuscript.
Funding
The authors extend their appreciation to the Deanship of Scientific Research at King Khalid University (grant number R.G.P.2/194/42). The authors also appreciate the Krishi Gobeshona Foundation (KGF) for funding this work.
Institutional Review Board Statement
“The study was conducted according to the guidelines of the Declaration of Helsinki, and approved by the Institutional Review Board (or Ethics Committee) of Dept. of Disaster Management, Begum Rokeya University, Rangpur (protocol code 2021/1000(1) and 15 April 2021.
Informed Consent Statement
Written informed consent has been obtained from the participants to publish this paper.
Data Availability Statement
Data are available on reasonable request on corresponding author.
Acknowledgments
The authors gratefully acknowledge generous philanthropic support from the Office of the Vice President of the Rabdan Academy, The United Arab Emirates (UAE).
Conflicts of Interest
The authors declare no conflict of interest.
References
- Ahmed, M.; Asif, M.; Sajad, M.; Khattak, J.Z.K.; Ijaz, W.; Wasaya, A.; Chun, J.A. Could agricultural system be adapted to climate change? A review. Aust. J. Crop Sci. 2013, 7, 1642. [Google Scholar]
- Alam, G.M.M.; Alam, K.; Mushtaq, S. Climate change perceptions and local adaptation strategies of hazard-prone rural households in Bangladesh. Clim. Risk Manag. 2017, 17, 52–63. [Google Scholar] [CrossRef]
- IPCC. Summary for Policymakers. In Climate Change 2007: Impacts, Adaptation and Vulnerability; Contribution of Working Group II to the Fourth Assessment Report of the Intergovernmental Panel on Climate Change; Parry, M.L., Canziani, O.F., Palutikot, J.P., van der Linden, P.J., Hanson, C.E., Eds.; IPCC: Geneva, Switzerland, 2007. [Google Scholar]
- Skoufias, E.; Vinha, K.; Conroy, H.V. The Impacts of Climate Variability on Household Welfare in Rural Mexico; Working Paper No. 5555, January 2011; World Bank Policy Research: Washington, DC, USA, 2011. [Google Scholar]
- Karim, M.F.; Mimura, N. Impacts of climate change and sea-level rise on cyclonic storm surge floods in Bangladesh. Glob. Environ. Chang. 2008, 18, 490–500. [Google Scholar] [CrossRef]
- Dastagir, M.R. Modeling recent climate change induced extreme events in Bangladesh: A review. Weather Clim. Extrem. 2015, 7, 49–60. [Google Scholar] [CrossRef] [Green Version]
- IPCC. Climate Change 2014: Impacts, Adaptation, and Vulnerability. In Part A: Global and Sectoral Aspects; Contribution of Working Group II to the Fifth Assessment Report of the Intergovernmental Panel on Climate Change; Field, C.B., Barros, V.R., Dokken, D.J., Mach, K.J., Mastrandrea, M.D., Bilir, T.E., Chatterjee, V., Ebi, K.L., Estrada, Y.O., Genova, R.C., et al., Eds.; Cambridge University Press: Cambridge, UK; New York, NY, USA, 2014. [Google Scholar]
- Huong, N.T.L.; Bo, Y.S.; Fahad, S. Economic impact of climate change on agriculture using Ricardian approach: A case of northwest Vietnam. J. Saudi Soc. Agric. Sci. 2018, 18, 449–457. [Google Scholar] [CrossRef]
- Islam, A.R.M.T.; Shill, B.K.; Salam, R.; Alam Siddik, N.; Patwary, M.A. Insight into farmers’ agricultural adaptive strategy to climate change in northern Bangladesh. Environ. Dev. Sustain. 2021, 23, 2439–2464. [Google Scholar] [CrossRef]
- Prandecki, K.; Wrzaszcz, W.; Zieliński, M. Environmental and Climate Challenges to Agriculture in Poland in the Context of Objectives Adopted in the European Green Deal Strategy. Sustainability 2021, 13, 10318. [Google Scholar] [CrossRef]
- World Bank. World Development Indicator; World Bank: Washington, DC, USA, 2019. [Google Scholar]
- Habiba, U.; Shaw, R.; Takeuchi, Y. Farmer’s perception and adaptation practices to cope with drought: Perspectives from Northwestern Bangladesh. Int. J. Disaster Risk Reduct. 2012, 1, 72–84. [Google Scholar] [CrossRef]
- Mondal, M.S.H.; Murayama, T.; Nishikizawa, S. Assessing the flood risk of riverine households: A case study from the right bank of the Teesta River, Bangladesh. Int. J. Disaster Risk Reduct. 2020, 51, 101758. [Google Scholar] [CrossRef]
- Islam, A.T.; Shen, S.; Yang, S.; Hu, Z.; Chu, R. Assessing recent impacts of climate change on design water requirement of Boro rice season in Bangladesh. Theor. Appl. Clim. 2019, 138, 97–113. [Google Scholar] [CrossRef]
- Ikram, M.; Zhang, P.Q.; Sroufe, P.R.; Shah, P.S.Z.A. Towards a sustainable environment: The nexus between ISO 14001, renewable energy consumption, access to electricity, agriculture and CO2 emissions in SAARC countries. Sustain. Prod. Consum. 2020, 22, 218–230. [Google Scholar] [CrossRef]
- Ikram, M.; Ferasso, M.; Sroufe, R.; Zhang, Q. Assessing green technology indicators for cleaner production and sustainable investments in a developing country context. J. Clean. Prod. 2021, 322, 129090. [Google Scholar] [CrossRef]
- Budhathoki, N.K.; Paton, D.; Lassa, J.A.; Zander, K.K. Assessing farmers’ preparedness to cope with the impacts of multiple climate change-related hazards in the Terai lowlands of Nepal. Int. J. Disaster Risk Reduct. 2020, 49, 101656. [Google Scholar] [CrossRef]
- Zhai, S.-Y.; Song, G.-X.; Qin, Y.-C.; Ye, X.-Y.; Leipnik, M. Climate change and Chinese farmers: Perceptions and determinants of adaptive strategies. J. Integr. Agric. 2018, 17, 949–963. [Google Scholar] [CrossRef] [Green Version]
- Fahad, S.; Wang, J. Farmers’ risk perception, vulnerability, and adaptation to climate change in rural Pakistan. Land Use Policy 2018, 79, 301–309. [Google Scholar] [CrossRef]
- Shah, S.I.A.; Zhou, J.; Shah, A.A. Ecosystem-based Adaptation (EbA) practices in smallholder agriculture; emerging evidence from rural Pakistan. J. Clean. Prod. 2019, 218, 673–684. [Google Scholar] [CrossRef]
- Mahmood, N.; Arshad, M.; Mehmood, Y.; Shahzad, M.F.; Kächele, H. Farmers’ perceptions and role of institutional arrangements in climate change adaptation: Insights from rainfed Pakistan. Clim. Risk Manag. 2021, 32, 100288. [Google Scholar] [CrossRef]
- Popoola, O.O.; Monde, N.; Yusuf, S.F.G. Perceptions of climate change impacts and adaptation measures used by crop smallholder farmers in Amathole district municipality, Eastern Cape Province, South Africa. GeoJournal 2017, 83, 1205–1221. [Google Scholar] [CrossRef]
- Shackleton, S.; Ziervogel, G.; Sallu, S.; Gill, T.; Tschakert, P. Why issocially-just climate change adaptation in sub-Saharan Africa so challenging? Areview of barriers identified from empirical cases. Clim. Chang. 2015, 6, 321–344. [Google Scholar]
- Bradshaw, B.; Dolan, H.; Smit, B. Farm-level adaptation to climatic variability and change: Crop diversification in the Canadian prairies. Clim. Chang. 2004, 67, 119–214. [Google Scholar] [CrossRef]
- Wheeler, S.A.; Zuo, A.; Bjornlund, H. Farmers’ climate change beliefs and adaptation strategies for a water scarce future in Australia. Glob. Environ. Chang. 2013, 23, 537–547. [Google Scholar] [CrossRef]
- Aryal, J.P.; Sapkota, T.B.; Rahut, D.B.; Krupnik, T.J.; Shahrin, S.; Jat, M.L.; Stirling, C.M. Major Climate risks and Adaptation Strategies of Smallholder Farmers in Coastal Bangladesh. Environ. Manag. 2020, 66, 105–120. [Google Scholar] [CrossRef]
- Khan, M.H.; Bryceson, I.; Kolivras, K.N.; Faruque, F.; Rahman, M.M.; Haque, U. Natural disasters and land-use/land-cover change in the southwest coastal areas of Bangladesh. Reg. Environ. Chang. 2014, 15, 241–250. [Google Scholar] [CrossRef]
- Vivekananda, J.; Schilling, J.; Mitra, S.; Pandey, N. On shrimp, salt and security: Livelihood risks and responses in South Bangladesh and East India. Environ. Dev. Sustain. 2014, 16, 1141–1161. [Google Scholar] [CrossRef]
- Ahmed, A.K.; Chowdhury, E.H. Study on Livelihood Systems Assessment, Vulnerable Groups Profiling and Livelihood Adaptation to Climate Hazard and Long-Term Climate Change in Drought-Prone Areas of NW Bangladesh, Final Report; Food and Agriculture Organization of the United Nations (FAO)/Department of Agricultural Extension: Rome, Italy; Dhaka, Bangladesh, 2006. [Google Scholar]
- FAO. Livelihood Adaptation to Climate Variability and Change in Drought-Prone Areas of Bangladesh. Improved Adaptive Capacity to Climate Change for Sustainable Livelihoods in the Agriculture Sector; Food and Agriculture Organization of the United Nations (FAO): Rome, Italy, 2006. [Google Scholar]
- Alauddin, M.; Sarker, M.A.R. Climate change and farm-level adaptation decisions and strategies in drought-prone and groundwater-depleted areas of Bangladesh: An empirical investigation. Ecol. Econ. 2014, 106, 204–213. [Google Scholar] [CrossRef]
- Hassan, A.; Wahid, S.; Shrestha, M.L.; Rashid, M.A.; Ahmed, T.; Mazumder, A.; Sarker, M.H.; Al Hossain, B.M.T.; Mumu, S.; Sarker, M.H. Climate Change and Water Availability in the Ganges-Brahmaputra-Meghna Basin: Impact on Local Crop Production and Policy Directives. Research Insights on Climate and Water in the Hindu Kush Himalayas; International Centre for Integrated Mountain Development: Lalitpur, Nepal, 2014; pp. 97–108. [Google Scholar]
- Alam, K. Farmer’s adaptation to water scarcity in drought-prone environments: A case study of Rajshahi District, Bangladesh. Agric. Water Manag. 2015, 148, 196–206. [Google Scholar] [CrossRef] [Green Version]
- Kabir, J.; Alauddin, M.; Crimp, S. Farm-level adaptation to climate change in Western Bangladesh: An analysis of adaptation dynamics, profitability and risks. Land Use Policy 2017, 64, 212–224. [Google Scholar] [CrossRef] [Green Version]
- Bhuiyan, M.A.; Parvez, L.; Islam, M.A.; Dampare, S.B.; Suzuki, S. Heavy metal pollution of coal mine-affected agricultural soils in the northern part of Bangladesh. J. Hazard. Mater. 2010, 173, 384–392. [Google Scholar] [CrossRef]
- Karim, M.R.; Thiel, A. Role of community based local institution for climate change adaptation in the Teesta riverine area of Bangladesh. Clim. Risk Manag. 2017, 17, 92–103. [Google Scholar] [CrossRef]
- Islam, A.R.M.T.; Tasnuva, A.; Sarker, S.C.; Rahman, M.M.; Mondal, M.S.H.; Islam, M.M.U. Drought in Northern Bangladesh: Social, Agroecological Impact and Local Perception. Int. J. Ecosyst. 2014, 4, 150–158. [Google Scholar] [CrossRef]
- Sarker, N.I.; Wu, M.; Alam, G.M.; Shouse, R.C. Life in riverine islands in Bangladesh: Local adaptation strategies of climate vulnerable riverine island dwellers for livelihood resilience. Land Use Policy 2020, 94, 104574. [Google Scholar] [CrossRef]
- Ahmed, Z.; Guha, G.S.; Shew, A.M.; Alam, G.M. Climate change risk perceptions and agricultural adaptation strategies in vulnerable riverine char islands of Bangladesh. Land Use Policy 2021, 103, 105295. [Google Scholar] [CrossRef]
- Burke, M.; Lobell, D. Food security and adaptation to climate change: What do we know? In Climate Change and Food Security: Adapting Agriculture to A Warmer World, Advances in Global Change Research No. 37; Lobell, D., Burke, M., Eds.; Springer: New York, NY, USA, 2014. [Google Scholar]
- Tasnuva, A.; Hossain, R.; Salam, R.; Islam, A.R.M.T.; Patwary, M.M.; Ibrahim, S.M. Employing social vulnerability index to assess household social vulnerability of natural hazards: An evidence from southwest coastal Bangladesh. Environ. Dev. Sustain. 2021, 23, 10223–10245. [Google Scholar] [CrossRef]
- Eitzinger, A.; Binder, C.R.; Meyer, M.A. Risk perception and decision-making: Do farmers consider risks from climate change? Clim. Chang. 2018, 151, 507–524. [Google Scholar] [CrossRef] [Green Version]
- Amare, A.; Simane, B. Determinants of smallholder farmers’ decision to adopt adaptation options to climate change and variability in the Muger Sub basin of the Upper Blue Nile basin of Ethiopia. Agric. Food Secur. 2017, 6, 64. [Google Scholar] [CrossRef] [Green Version]
- Bryan, E.; Ringler, C.; Okoba, B.; Roncoli, C.; Silvestri, S.; Herrero, M. Adapting agriculture to climate change in Kenya: Household strategies and determinants. J. Environ. Manag. 2013, 114, 26–35. [Google Scholar] [CrossRef]
- Smith, B.; Pilifosova, O. From adaptation to adaptive capacity and vulnerability reduction. In Climate Change, Adaptive Capacity and Development; World Scientific: Singapore, 2003; pp. 9–28. [Google Scholar]
- Akanda, M.G.R.; Howlader, M.S. Coastal farmers’ perception of climate change effects on agriculture at Galachipa Upazila under Patuakhali District of Bangladesh. Glob. J. Sci. Front. Res. Agric. Vet. 2015, 15, 31–39. [Google Scholar]
- Cochran, W.G.; Son, W.J. Sampling Techniques, 3rd ed.; John Wiley and Sons: New York, NY, USA, 1977. [Google Scholar]
- BMD (Bangladesh Meteorological Department). Personal Interview; BMD (Bangladesh Meteorological Department): Dhaka, Bangladesh, 2020.
- Wooldridge, J.M. Econometric Analysis of Cross Section and Panel Data; MIT Press: Cambridge, MA, USA, 2002. [Google Scholar]
- Gbetibouo, G.A. Understanding Farmers’ Perception and Adaptation to Climate Change and Variability: The Case of Limpopo Basin, South Africa; Discussion Paper 00849; International Food Policy Research Institute (IFPRI): Washington, DC, USA, 2009. [Google Scholar]
- Greene, W.H. Econometric Analysis, 7th ed.; Prentice Hall: Hoboken, NJ, USA, 2012. [Google Scholar]
- Cameron, A.C.; Trivedi, P.K. Microeconometrics Using STATA; Stata Press: College Station, TX, USA, 2009. [Google Scholar]
- Alam, G.M.; Alam, K.; Mushtaq, S. Influence of institutional access and social capital on adaptation decision: Empirical evidence from hazard-prone rural households in Bangladesh. Ecol. Econ. 2016, 130, 243–251. [Google Scholar] [CrossRef]
- Cutter, L.S.; Osman-Elasha, B.; Campbell, J.; Cheong, S.M.; McCormick, S.; Pulwarty, R.; Supratid, S.; Ziervogel, G.; Calvo, E.; Mutabazi, K.; et al. Managing the Risks from Climate Extremes at the Local Level. In Managing the Risks of Extreme Events and Disasters to Advance Climate Change Adaptation; Cambridge University Press: Cambridge, UK, 2012; pp. 291–338. [Google Scholar]
- Linden, S.V.D. Determinants and measurement of climate change risk perception, worry, and concern. In The Oxford Encyclopedia of Climate Change Communication; Nisbet, M.C., Schafer, M., Markowitz, E., Ho, S., O’Neill, S., Thaker, J., Eds.; Oxford University Press: Oxford, UK, 2017; pp. 1–53. [Google Scholar] [CrossRef]
- Luu, T.D. Factors Influencing Farmers’ Adoption of Climate-Smart Agriculture in Rice Production in Vietnam’s Mekong Delta. Asian J. Agric. Dev. 2020, 17, 109–124. [Google Scholar] [CrossRef]
- Obayelu, O.A.; Adepoju, A.O.; Idowu, T. Factors influencing farmers’ choices of adaptation to climate change in Ekiti State, Nigeria. J. Agric. Environ. Int. Dev. 2014, 108, 3–16. [Google Scholar] [CrossRef]
- Lahiri-Dutt, K.; Samanta, G. ‘Like the Drifting Grains of Sand’1 Vulnerability, Security and Adjustment by Communities in the Char lands of the Damodar River, India. South Asia: J. South Asian Stud. 2007, 30, 327–350. [Google Scholar] [CrossRef]
- Shiferaw, B.; Holden, S.T. Resource degradation and adoption of land conservation technologies in the Ethiopian Highlands: A case study in Andit Tid, North Shewa. Agric. Econ. 1998, 18, 233–247. [Google Scholar] [CrossRef]
- Alam, G.M.M.; Alam, K.; Mushtaq, S.; Khatun, M.N.; Mamun, M.S.A.K. Influence of socio-demographic factors on mobile phone adoption in rural Bangladesh: Policy implications. Inf. Dev. 2018, 35, 739–748. [Google Scholar] [CrossRef]
- Sattar, A.; Biswas, A.A.A.; Islam, T.; Hossain, A.; Siddeqa, M.; Rahim, A.; Amin, N.; Touhiduzzaman Rahman, A.; Aktar, S. Disaster vulnerability and mitigation of humanitarian issues in coastal Bangladesh: Local evidence and knowledge gaps. Prog. Disaster Sci. 2020, 8, 100138. [Google Scholar] [CrossRef]
- Hasan, K.; Kumar, L. Comparison between meteorological data and farmer perceptions of climate change and vulnerability in relation to adaptation. J. Environ. Manag. 2019, 237, 54–62. [Google Scholar] [CrossRef]
- Dai, A. Drought under global warming: A review. Wiley Interdiscip. Rev. Clim. Chang. 2011, 2, 45–65. [Google Scholar] [CrossRef] [Green Version]
- Nath, R.; Nath, D.; Li, Q.; Chen, W.; Cui, X. Impact of drought on agriculture in the Indo-Gangetic Plain, India. Adv. Atmos. Sci. 2017, 34, 335–346. [Google Scholar] [CrossRef]
- Craft, K.E.; Mahmood, R.; King, S.A.; Goodrich, G.; Yan, J. Droughts of the twentieth and early twenty-first centuries: Influences on the production of beef and forage in Kentucky, USA. Sci. Total Environ. 2017, 577, 122–135. [Google Scholar] [CrossRef]
- Limantol, A.M.; Keith, B.E.; Azabre, B.A.; Lennartz, B. Farmers’ Perception and Adaptation Practice to Climate Variability and Change: A Case Study of the Vea Catchment in Ghana; Springer Plus: Berlin/Heidelberg, Germany, 2016; Volume 5, p. 830. [Google Scholar]
- Ullah, R.; Shivakoti, G.P.; Zulfiqar, F.; Kamran, M.A. Farm risks and uncertainties: Sources, impacts and management. Outlook Agric. 2016, 45, 199–205. [Google Scholar] [CrossRef]
- Alam, G.M.M.; Alam, K.; Shahbaz, M.; Khatun, M.N.; Filho, W.L. Strategies and barriers to adaptation of hazard-prone rural households in Bangladesh. In Limits to Climate Change Adaptation; Filho, W.L., Nalau, J., Eds.; Springer: Berlin/Heidelberg, Germany, 2018; pp. 11–24. [Google Scholar] [CrossRef]
- Waibel, H.; Pahlisch, T.H.; Völker, M. Farmers’ Perceptions of and Adaptations to Climate Change in Southeast Asia: The Case Study from Thailand and Vietnam. In Climate Smart Agriculture: Building Resilience to Climate Change; Lipper, L., McCarthy, N., Zilberman, D., Asfaw, S., Branca, G., Eds.; Springer International Publishing: Cham, Switzerland, 2018; pp. 137–160. [Google Scholar]
- Karki, S.; Burton, P.; Mackey, B. The experiences and perceptions of farmers about the impacts of climate change and variability on crop production: A review. Clim. Dev. 2019, 12, 80–95. [Google Scholar] [CrossRef]
- Sarkar, D.; Pramanik, B.; Zerin, A.; Ara, I. Climatic impact assessment: A case study of Teesta barrage irrigation project in Bangladesh. Int. J. Civ. Environ. Eng. 2011, 11, 99–110. [Google Scholar]
- Nirapad. Study Report on Disaster Risk Reduction (DRR) and Climate Change (CC) Policy of RDRS Bangladesh in Northwest Region; Nirapad: Dhaka, Bangladesh, 2011. [Google Scholar]


Publisher’s Note: MDPI stays neutral with regard to jurisdictional claims in published maps and institutional affiliations. |
© 2021 by the authors. Licensee MDPI, Basel, Switzerland. This article is an open access article distributed under the terms and conditions of the Creative Commons Attribution (CC BY) license (https://creativecommons.org/licenses/by/4.0/).