
A Review on Indoor Environment Quality of Indian School Classrooms

 ,
, 
 ,
, 
Abstract
1. Introduction
Objectives of the Study
2. Review Methodology
3. Indian Climatic Classification and Indoor Environmental Quality
3.1. IEQ and Its Parameters
3.1.1. Thermal Comfort (TC)
3.1.2. Indoor Air Quality (IAQ)
3.1.3. Visual Comfort (VC)
3.1.4. Acoustic Comfort (AcC)
4. Indoor Environmental Quality in Indian School Classrooms
4.1. Thermal Comfort (TC) in Indian School Classrooms
4.2. Indoor Air Quality (IAQ) in Indian School Classrooms
4.3. Acoustic Comfort (AcC) in Indian School Classrooms
4.4. Visual Comfort (VC) in Indian School Classrooms
5. Recommended Levels of IEQ Parameters according to Existing Indian Standards and Codes
6. Discussion
6.1. Study Types and Publication Trends
6.2. Existing Gaps and Deficiencies
6.3. Factors Influencing Future Research on IEQ in Indian School Classrooms
6.4. Advances in IEQ with Artificial Intelligence (AI)
6.4.1. AI in TC
6.4.2. AI in IAQ
6.4.3. AI in VC
6.4.4. AI in AcC
6.5. IEQ Demands in Indian School Classrooms
- Studies on IEQ parameters in Indian school classrooms are inadequate, unorganized, and unevenly geographically scattered. Therefore, more real-time subjective and objective studies are needed in India along with effective policies and well-drafted plans to implement and enhance IEQ in school classrooms. There are various inconsistencies in methods used by Indian researchers. Therefore, there is a need to standardize the testing methods. This will finally help in creating India-specific public IEQ standards for school buildings as there are no public codes for IEQ in school classrooms to date.
- There is a huge difference among various IEQ parameter studies. VC is the least-researched parameter in Indian schools. Therefore, maximum IEQ parameters must be considered during future objective and subjective surveys. Age variation also impacts the results, hence education-level-specific studies should be conducted and all the levels should receive proper attention.
- Interdisciplinary quality research based on the scientific approach is required on IEQ in Indian school buildings. The energy and health domain should also be studied and included in research along with IEQ performance in Indian school classrooms.
- Occupants’ social, economic, and cultural aspects should be considered properly for more accuracy in results and accurate future predictions as all these aspects vary largely among the student population in any class.
- The Hawthorne effect must be considered during real-time research execution in school classrooms so that the results have less deviation due to psychological variations among subjects.
- Different authors adopt different methods for assessing the quality of the indoor environment in school classrooms, so it is hard to compare the results of different studies as outcomes vary significantly both in quantitative and qualitative terms. Therefore, more empirical and data-driven research is essential for advancing classroom IEQ research.
- Effective techniques for merging natural daylight with artificial lighting, effective ventilation techniques, energy-efficient conditioning, and proper design interventions for the acoustic environment are some steps that must be taken to increase IEQ in the Indian school classroom.
- As none of the studies tried to determine the interrelation between different parameters of indoor environmental quality in school buildings, it is very difficult to comment on the combined effect of IEQ parameters on students and teachers in Indian school classrooms. No real-time study considers all IEQ parameters in Indian school classrooms. Therefore, there is a need to study the interrelation and combined effect of IEQ.
- As very scarce studies in the Indian climatic zones are carried out on single or multiple IEQ parameters in the school classroom, more studies are needed in the future for better understanding and climate-wise comparison.
- Overcrowding must be avoided in classrooms with increased natural ventilation, as stagnant air can create serious health conditions with spreading COVID-19 at a faster rate. The recirculation of air must not be executed in school buildings. Openings in the classrooms must be well supported with such a system/technology that can destroy viruses suspended in the air. If possible, school authorities can temporarily think about open-air classrooms with precautions.
- AI, IoT, Big Data, Robotics, and Cloud-like advanced technologies and techniques should be used to innovate and create smart, efficient, technical gazettes as well as applications related to IEQ and HBI. Additionally, advanced techniques and technology should be developed to face COVID-19-like situations in the present and future.
- Increasing air pollution and other factors that have higher probabilities of affecting IEQ in buildings should be further explored, and it is essential to research these factors and their impact on IEQ conditions so that existing and future codes and standard show less deviation from the real-time indoor comfort conditions. Likewise, air-conditioned school classrooms and other air-conditioned spaces in schools need more research related to their indoor environment. Additionally, AQI should be updated and include biological factors along with chemical and particulate matter.
7. Conclusions and Future Direction
Future Direction
- For the design, construction, and operation of new as well as existing buildings to prevent them from the indoor transmission of SARS-CoV-2-like viruses, a special publication as an annexure to the National Building Code or a separate document is required. The authors are working on these guidelines.
- All naturally ventilated schools, as well as naturally ventilated buildings, need an economical retrofitting solution or device to tackle IAQ problems (virus transmission) inside classrooms. The authors are researching this.
- Air-conditioned schools, as well as spaces in schools such as libraries, computer labs, auditoriums, digital classrooms, and other air-conditioned buildings, need an urgent solution to decontaminate the air. Therefore, the authors are researching this direction to prevent the SARS-CoV-2 or other similar airborne pathogens transmission through devices installed in air-conditioned buildings.
Author Contributions
Funding
Acknowledgments
Conflicts of Interest
References
- Kapoor, N.R.; Kumar, A.; Meena, C.S.; Kumar, A.; Alam, T.; Balam, N.B.; Ghosh, A. A Systematic Review on Indoor Environmental Quality in Naturally Ventilated School Classrooms: A Way Forward. Adv. Civ. Eng. 2021, 2021, 8851685. [Google Scholar] [CrossRef]
- Osborne, S.; Uche, O.; Mitsakou, C.; Exley, K.; Dimitroulopoulou, S. Air quality around schools: Part II—Mapping PM2.5 concentrations and inequality analysis. Environ. Res. 2021, 197, 111038. [Google Scholar] [CrossRef]
- Adekunle, T.O. Thermal performance and apparent temperature in school buildings: A case of cross-laminated timber (CLT) school development. J. Build. Eng. 2021, 33, 101731. [Google Scholar] [CrossRef]
- Li, X.; Yang, D.; Yang, J.; Zheng, G.; Han, G.; Nan, Y.; Li, W. Analysis of coastal wind speed retrieval from CYGNSS mission using artificial neural network. Remote Sens. Environ. 2021, 260, 112454. [Google Scholar] [CrossRef]
- Seurat, E.; Verdin, A.; Cazier, F.; Courcot, D.; Fitoussi, R.; Vié, K.; Desauziers, V.; Momas, I.; Seta, N.; Achard, S. Influence of the environmental relative humidity on the inflammatory response of skin model after exposure to various environmental pollutants. Environ. Res. 2021, 196, 110350. [Google Scholar] [CrossRef]
- Yang, H.; Guo, B.; Shi, Y.; Jia, C.; Li, X.; Liu, F. Interior daylight environment of an elderly nursing home in Beijing. Build. Environ. 2021, 200, 107915. [Google Scholar] [CrossRef]
- IQair—Air Quality Status of Indian Cities and US AQI of India. Available online: https://www.iqair.com/us/india (accessed on 26 March 2021).
- Kanchan, K.; Gorai, A.; Goyal, P. A Review on Air Quality Indexing System. Asian J. Atmos. Environ. 2015, 9, 101–113. [Google Scholar] [CrossRef]
- Gronlund, C.J.; Sullivan, K.P.; Kefelegn, Y.; Cameron, L.; O’Neill, M.S. Climate change and temperature extremes: A review of heat- and cold-related morbidity and mortality concerns of municipalities. Maturitas 2018, 114, 54–59. [Google Scholar] [CrossRef]
- Global Climate Change. Available online: https://climate.nasa.gov/effects/ (accessed on 26 March 2021).
- Ministry of Health and Family Welfare, Government of India. Operational Guidelines for 12th Five-Year Plan. National Programme for the Prevention & Control of Deafness Report; Ministry of Health and Family Welfare: New Delhi, India. Available online: https://main.mohfw.gov.in/sites/default/files/51892751619025258383.pdf (accessed on 26 March 2021).
- National Programme for The Prevention & Control of Deafness (NPPCD). National Health Mission, Government of India. Available online: https://nhm.gov.in/index1.php?lang=1&level=2&sublinkid=1051&lid=606 (accessed on 26 March 2021).
- Ministry of Statistics and Programme Implementation, Government of India. Disabled Persons in India. National Sample Survey Report No. 485 (58/26/1); Ministry of Statistics and Programme Implementation: New Delhi, India, 2001. Available online: http://mospi.nic.in/sites/default/files/publication_reports/485_final.pdf (accessed on 26 March 2021).
- Dandona, R.; Pandey, A.; George, S.; Kumar, G.A.; Dandona, L. India’s disability estimates: Limitations and way forward. PLoS ONE 2019, 14, e0222159. [Google Scholar] [CrossRef]
- Klepeis, N.E.; Nelson, W.C.; Ott, W.R.; Robinson, J.P.; Tsang, A.M.; Switzer, P.; Behar, J.V.; Hern, S.C.; Engelmann, W.H. The National Human Activity Pattern Survey (NHAPS): A resource for assessing exposure to environmental pollutants. J. Expo. Sci. Environ. Epidemiol. 2001, 11, 231–252. [Google Scholar] [CrossRef] [PubMed]
- Goyal, R.; Khare, M. Indoor–outdoor concentrations of RSPM in classroom of a naturally ventilated school building near an urban traffic roadway. Atmos. Environ. 2009, 43, 6026–6038. [Google Scholar] [CrossRef]
- Singh, M.K.; Ooka, R.; Rijal, H.B.; Kumar, S.; Kumar, A.; Mahapatra, S. Progress in thermal comfort studies in classrooms over last 50 years and way forward. Energy Build. 2019, 188–189, 149–174. [Google Scholar] [CrossRef]
- Jindal, A. Investigation and analysis of thermal comfort in naturally ventilated secondary school classrooms in the composite climate of India. Archit. Sci. Rev. 2019, 62, 466–484. [Google Scholar] [CrossRef]
- Ministry of Human Resource Development, Government of India. Selected Information on School Education in India; 2009. Available online: http://14.139.60.153/bitstream/123456789/885/1/SELECTED%20INFORMATION%20OF%20SCHOOL%20EDUCATION%20IN%20INDIA%202006-07%20%26%202007-08%28NO%20ASSENSSION%20NUMBER%29.pdf (accessed on 26 March 2021).
- OECD. Teaching Hours (Indicator); OECD: Paris, France, 2018; Available online: https://doi.org/10.1787/af23ce9b-en (accessed on 26 March 2021). [CrossRef]
- Ministry of Human Resource Development, Government of India. National Education Policy 2020; Ministry of Human Resource Development: New Delhi, India, 2020. Available online: https://www.education.gov.in/sites/upload_files/mhrd/files/NEP_Final_English_0.pdf (accessed on 29 March 2021).
- Shree, V.; Marwaha, B.M.; Awasthi, P. Indoor air quality (IAQ) investigation in primary schools at Hamirpur (India). J. Indian Chem. Soc. 2019, 96, 1455–1460. Available online: https://www.nepjol.info/index.php/HN/article/view/23583 (accessed on 29 March 2021).
- UNESCO. Education: From Disruption to Recovery; UNESCO: Paris, France, 2020; Available online: https://en.unesco.org/covid19/educationresponse (accessed on 29 March 2021).
- Raj, N.; Kumar, A.; Kumar, A.; Goyal, S. Indoor Environmental Quality: Impact on Productivity, Comfort, and Health of Indian Occupants. In Proceedings of the International Conference on Building Energy Demand Reduction in Global South (BUILDER’19), New Delhi, India, 13–14 December 2019; pp. 1–9. Available online: https://nzeb.in/event/builder19/ (accessed on 29 March 2021).
- Sarkhosh, M.; Najafpoor, A.A.; Alidadi, H.; Shamsara, J.; Amiri, H.; Andrea, T.; Kariminejad, F. Indoor Air Quality associations with sick building syndrome: An application of decision tree technology. Build. Environ. 2021, 188, 107446. [Google Scholar] [CrossRef]
- Crook, B.; Burton, N.C. Indoor moulds, Sick Building Syndrome and building related illness. Fungal Biol. Rev. 2010, 24, 106–113. [Google Scholar] [CrossRef]
- Li, Z.; Bian, X.; Yin, J.; Zhang, X.; Mu, G. The Effect of Air Pollution on the Occurrence of Nonspecific Conjunctivitis. J. Ophthalmol. 2016, 2016, 3628762. [Google Scholar] [CrossRef]
- Cincinelli, A.; Martellini, T. Indoor Air Quality and Health. Int. J. Environ. Res. Public Health 2017, 14, 1286. [Google Scholar] [CrossRef] [PubMed]
- Bert, P.D.P.; Mercader, E.M.H.; Pujol, J.; Sunyer, J.; Mortamais, M. The Effects of Air Pollution on the Brain: A Review of Studies Interfacing Environmental Epidemiology and Neuroimaging. Curr. Environ. Health Rep. 2018, 5, 351–364. [Google Scholar] [CrossRef] [PubMed]
- González-Díaz, S.N.; Arias-Cruz, A.; Macouzet-Sánchez, C.; Partida-Ortega, A.B. Impact of air pollution in respiratory allergic diseases. Med. Univ. 2016, 18, 212–215. [Google Scholar] [CrossRef]
- Manisalidis, I.; Stavropoulou, E.; Stavropoulos, A.; Bezirtzoglou, E. Environmental and Health Impacts of Air Pollution: A Review. Front. Public Health 2020, 8, 14. [Google Scholar] [CrossRef]
- Dujardin, C.E.; Mars, R.A.; Manemann, S.M.; Kashyap, P.C.; Clements, N.S.; Hassett, L.C.; Roger, V.L. Impact of air quality on the gastrointestinal microbiome: A review. Environ. Res. 2020, 186, 109485. [Google Scholar] [CrossRef]
- Larsen, T.S.; Rohde, L.; Jønsson, K.T.; Rasmussen, B.; Jensen, R.L.; Knudsen, H.N.; Witterseh, T.; Bekö, G. IEQ-Compass—A tool for holistic evaluation of potential indoor environmental quality. Build. Environ. 2020, 172, 106707. [Google Scholar] [CrossRef]
- World Population Clock. Available online: https://www.census.gov/popclock/ (accessed on 29 March 2021).
- Countries of the World by Population. Available online: https://www.nationsonline.org/oneworld/population-by-country.htm (accessed on 29 March 2021).
- Statista. The 30 Largest Countries in the World by Total Area. Available online: https://www.statista.com/statistics/262955/largest-countries-in-the-world/ (accessed on 29 March 2021).
- World Population. U.S. Census Bureau Current Population. Available online: https://www.census.gov/popclock/print.php?component=counter (accessed on 29 March 2021).
- Bureau of Indian Standards, Government of India. National Building Code of India; Bureau of Indian Standards: New Delhi, India, 2016; Volume 2. Available online: https://bis.gov.in/index.php/standards/technical-department/national-building-code/ (accessed on 29 March 2021).
- Bureau of Energy Efficiency (BEE), Ministry of Power, Government of India. Energy Conservation Building Code (ECBC) 2017; BEE: New Delhi, India, 2017. Available online: https://beeindia.gov.in/sites/default/files/BEE_ECBC%202017.pdf (accessed on 29 March 2021).
- Bayer, C.W. Evidence-Based Design for Indoor Environmental Quality and Health. Encyclopedia of Sustainability Science and Technology; Meyers, R.A., Ed.; Springer: New York, NY, USA, 2017; pp. 1–20. [Google Scholar] [CrossRef]
- Mujeebu, M.A. Introductory Chapter: Indoor Environmental Quality. In Indoor Environmental Quality; Mujeebu, M.A., Ed.; IntechOpen: London, UK, 2019; pp. 1–13. [Google Scholar] [CrossRef]
- Wargocki, P.; Wyon, D.P. Ten questions concerning thermal and indoor air quality effects on the performance of office work and schoolwork. Build. Environ. 2017, 112, 359–366. [Google Scholar] [CrossRef]
- Mistar, N.A.; Sulaiman, R.; Che Din, N.B. A Conceptual Framework for Acoustic Comfort Classification in Eatery Places: Critical Reviews of the Determining Factors. Acoust. Aust. 2020, 48, 337–348. [Google Scholar] [CrossRef]
- Wang, Z.; de Dear, R.; Luo, M.; Lin, B.; He, Y.; Ghahramani, A.; Zhu, Y. Individual difference in thermal comfort: A literature review. Build. Environ. 2018, 138, 181–193. [Google Scholar] [CrossRef]
- Ochoa, C.E.; Capeluto, I.G. Evaluating visual comfort and performance of three natural lighting systems for deep office buildings in highly luminous climates. Build. Environ. 2006, 41, 1128–1135. [Google Scholar] [CrossRef]
- Cao, T.; Lian, Z.; Ma, S.; Bao, J. Thermal comfort and sleep quality under temperature, relative humidity and illuminance in sleep environment. J. Build. Eng. 2021, 43, 102575. [Google Scholar] [CrossRef]
- Vellei, M.; Herrera, M.; Fosas, D.; Natarajan, S. The influence of relative humidity on adaptive thermal comfort. Build. Environ. 2017, 124, 171–185. [Google Scholar] [CrossRef]
- Wan, J.W.; Yang, K.; Zhang, W.J.; Zhang, J.L. A new method of determination of indoor temperature and relative humidity with consideration of human thermal comfort. Build. Environ. 2009, 44, 411–417. [Google Scholar] [CrossRef]
- Jin, Y.; Wang, F.; Carpenter, M.; Weller, R.B.; Tabor, D.; Payne, S.R. The effect of indoor thermal and humidity condition on the oldest-old people’s comfort and skin condition in winter. Build. Environ. 2020, 174, 106790. [Google Scholar] [CrossRef]
- Kong, D.; Liu, H.; Wu, Y.; Li, B.; Wei, S.; Yuan, M. Effects of indoor humidity on building occupants’ thermal comfort and evidence in terms of climate adaptation. Build. Environ. 2019, 155, 298–307. [Google Scholar] [CrossRef]
- Chung, J.D.; Hong, H.; Yoo, H. Analysis on the impact of mean radiant temperature for the thermal comfort of underfloor air distribution systems. Energy Build. 2010, 42, 2353–2359. [Google Scholar] [CrossRef]
- Frontini, F.; Kuhn, T.E. The influence of various internal blinds on thermal comfort: A new method for calculating the mean radiant temperature in office spaces. Energy Build. 2012, 54, 527–533. [Google Scholar] [CrossRef]
- Wang, D.; Chen, G.; Song, C.; Liu, Y.; He, W.; Zeng, T.; Liu, J. Experimental study on coupling effect of indoor air temperature and radiant temperature on human thermal comfort in non-uniform thermal environment. Build. Environ. 2019, 165, 106387. [Google Scholar] [CrossRef]
- Avantaggiato, M.; Belleri, A.; Oberegger, U.F.; Pasut, W. Unlocking thermal comfort in transitional spaces: A field study in three Italian shopping centres. Build. Environ. 2021, 188, 107428. [Google Scholar] [CrossRef]
- Hwang, R.-L.; Shih, W.-M.; Huang, K.-T. Performance-rating-based approach to formulate a new envelope index for commercial buildings in perspective of energy efficiency and thermal comfort. Appl. Energy 2020, 264, 114725. [Google Scholar] [CrossRef]
- Ribeiro, B.P.V.B.; Junior, T.Y.; de Oliveira, D.D.; de Lima, R.R.; Zangeronimo, M.G. Thermoneutral zone for laying hens based on environmental conditions, enthalpy and thermal comfort indexes. J. Therm. Biol. 2020, 93, 102678. [Google Scholar] [CrossRef] [PubMed]
- Rodríguez, C.M.; Coronado, M.C.; Medina, J.M. Thermal comfort in educational buildings: The Classroom-Comfort-Data method applied to schools in Bogotá, Colombia. Build. Environ. 2021, 194, 107682. [Google Scholar] [CrossRef]
- Rissetto, R.; Schweiker, M.; Wagner, A. Personalized ceiling fans: Effects of air motion, air direction and personal control on thermal comfort. Energy Build. 2021, 235, 110721. [Google Scholar] [CrossRef]
- Zhai, Y.; Arens, E.; Elsworth, K.; Zhang, H. Selecting air speeds for cooling at sedentary and non-sedentary office activity levels. Build. Environ. 2017, 122, 247–257. [Google Scholar] [CrossRef]
- Schiavon, S.; Melikov, A.K. Energy saving and improved comfort by increased air movement. Energy Build. 2008, 40, 1954–1960. [Google Scholar] [CrossRef]
- Nejat, P.; Ferwati, M.S.; Calautit, J.; Ghahramani, A.; Sheikhshahrokhdehkordi, M. Passive cooling and natural ventilation by the windcatcher (Badgir): An experimental and simulation study of indoor air quality, thermal comfort and passive cooling power. J. Build. Eng. 2021, 41, 102436. [Google Scholar] [CrossRef]
- Gao, S.; Ooka, R.; Oh, W. Experimental investigation of the effect of clothing insulation on thermal comfort indices. Build. Environ. 2021, 187, 107393. [Google Scholar] [CrossRef]
- Zhang, H.; Xie, X.; Hong, S.; Lv, H. Impact of metabolism and the clothing thermal resistance on inpatient thermal comfort. Energy Built Environ. 2021, 2, 223–232. [Google Scholar] [CrossRef]
- Sarwar, N.; Humayoun, U.B.; Khan, A.A.; Kumar, M.; Nawaz, A.; Yoo, J.H.; Yoon, D.H. Engineering of sustainable clothing with improved comfort and thermal properties-A step towards reducing chemical footprint. J. Clean. Prod. 2020, 261, 121189. [Google Scholar] [CrossRef]
- Xu, X.; Liu, W.; Lian, Z. Dynamic indoor comfort temperature settings based on the variation in clothing insulation and its energy-saving potential for an air-conditioning system. Energy Build. 2020, 220, 110086. [Google Scholar] [CrossRef]
- Molliet, D.S.; Mady, C.E.K. Exergy analysis of the human body to assess thermal comfort conditions: Comparison of the thermal responses of males and females. Case Stud. Therm. Eng. 2021, 25, 100972. [Google Scholar] [CrossRef]
- Fletcher, M.J.; Glew, D.W.; Hardy, A.; Gorse, C. A modified approach to metabolic rate determination for thermal comfort prediction during high metabolic rate activities. Build. Environ. 2020, 185, 107302. [Google Scholar] [CrossRef]
- Ji, W.; Luo, M.; Cao, B.; Zhu, Y.; Geng, Y.; Lin, B. A new method to study human metabolic rate changes and thermal comfort in physical exercise by CO2 measurement in an airtight chamber. Energy Build. 2018, 177, 402–412. [Google Scholar] [CrossRef]
- Yang, L.; Zhao, S.; Gao, S.; Zhang, H.; Arens, E.; Zhai, Y. Gender differences in metabolic rates and thermal comfort in sedentary young males and females at various temperatures. Energy Build. 2021, 251, 111360. [Google Scholar] [CrossRef]
- Marn, J.; Chung, M.; Iljaž, J. Relationship between metabolic rate and blood perfusion under Fanger thermal comfort conditions. J. Therm. Biol. 2019, 80, 94–105. [Google Scholar] [CrossRef] [PubMed]
- Luo, M.; Zhou, X.; Zhu, Y.; Sundell, J. Revisiting an overlooked parameter in thermal comfort studies, the metabolic rate. Energy Build. 2016, 118, 152–159. [Google Scholar] [CrossRef]
- Uğursal, A.; Culp, C.H. The effect of temperature, metabolic rate and dynamic localized airflow on thermal comfort. Appl. Energy 2013, 111, 64–73. [Google Scholar] [CrossRef]
- de Dear, R.; Xiong, J.; Kim, J.; Cao, B. A review of adaptive thermal comfort research since 1998. Energy Build. 2020, 214, 109893. [Google Scholar] [CrossRef]
- Yao, R.; Li, B.; Liu, J. A theoretical adaptive model of thermal comfort—Adaptive Predicted Mean Vote (aPMV). Build. Environ. 2009, 44, 2089–2096. [Google Scholar] [CrossRef]
- Fanger, P.O. Thermal Comfort: Analysis and Applications in Environmental Engineering; Danish Technical Press: Copenhagen, Denmark, 1970; pp. 1–244. Available online: https://www.cabdirect.org/cabdirect/abstract/19722700268# (accessed on 12 April 2021).
- CEN/TC 122—Ergonomics, International Organization for Standardization. Ergonomics of the Thermal Environment—Analytical Determination and Interpretation of Thermal Comfort Using Calculation of the PMV and PPD Indices and Local Thermal Comfort Criteria (ISO 7730:2005); ISO: Geneva, Switzerland, 2005; Available online: https://www.iso.org/obp/ui/#iso:std:iso:7730:ed-3:v1:en (accessed on 12 April 2021).
- Dear, R.D.; Brager, G.S. Developing an adaptive model of thermal comfort and preference. ASHRAE Trans. 1998, 104, 1–18. Available online: https://escholarship.org/uc/item/4qq2p9c6 (accessed on 12 April 2021).
- Albatayneh, A.; Alterman, D.; Page, A.; Moghtaderi, B. The Significance of the Adaptive Thermal Comfort Limits on the Air-Conditioning Loads in a Temperate Climate. Sustainability 2019, 11, 328. [Google Scholar] [CrossRef]
- Thermal Comfort. Available online: https://www.humanitarianlibrary.org/search-resources?keyword=thermal+comfort (accessed on 12 April 2021).
- Xie, R.; Xu, Y.; Yang, J.; Zhang, S. Indoor air quality investigation of a badminton hall in humid season through objective and subjective approaches. Sci. Total Environ. 2021, 771, 145390. [Google Scholar] [CrossRef]
- Khovalyg, D.; Kazanci, O.B.; Halvorsen, H.; Gundlach, I.; Bahnfleth, W.P.; Toftum, J.; Olesen, B.W. Critical review of standards for indoor thermal environment and air quality. Energy Build. 2020, 213, 109819. [Google Scholar] [CrossRef]
- Brilli, F.; Ghirardo, A.; de Visser, P.; Calatayud, V.; Muñoz, A.; Annesi-Maesano, I.; Sebastiani, F.; Alivernini, A.; Varriale, V.; Menghini, F. Plants for Sustainable Improvement of Indoor Air Quality. Trends Plant Sci. 2018, 23, 507–512. [Google Scholar] [CrossRef]
- Abdullah, S.; Abd Hamid, F.F.; Ismail, M.; Ahmed, A.N.; Wan Mansor, W.N. Data on Indoor Air Quality (IAQ) in kindergartens with different surrounding activities. Data Brief 2019, 25, 103969. [Google Scholar] [CrossRef] [PubMed]
- Mentese, S.; Mirici, N.A.; Elbir, T.; Palaz, E.; Mumcuoğlu, D.T.; Cotuker, O.; Bakar, C.; Oymak, S.; Otkun, M.T. A long-term multi-parametric monitoring study: Indoor air quality (IAQ) and the sources of the pollutants, prevalence of sick building syndrome (SBS) symptoms, and respiratory health indicators. Atmos. Pollut. Res. 2020, 11, 2270–2281. [Google Scholar] [CrossRef]
- Lim, A.-Y.; Yoon, M.; Kim, E.-H.; Kim, H.-A.; Lee, M.J.; Cheong, H.-K. Effects of mechanical ventilation on indoor air quality and occupant health status in energy-efficient homes: A longitudinal field study. Sci. Total Environ. 2021, 785, 147324. [Google Scholar] [CrossRef]
- Prakash, K.B.; Subramaniayan, C.; Chandrasekaran, M.; Kumar, P.M.; Saravanakumar, S. Development of mathematical model to study the effect of indoor air quality parameters and optimization using response surface methodology. Mater. Today Proc. 2021, 45, 8195–8198. [Google Scholar] [CrossRef]
- Cho, H.; Cabrera, D.; Sardy, S.; Kilchherr, R.; Yilmaz, S.; Patel, M.K. Evaluation of performance of energy efficient hybrid ventilation system and analysis of occupants’ behavior to control windows. Build. Environ. 2021, 188, 107434. [Google Scholar] [CrossRef]
- Wang, S.; Xu, X. Optimal and robust control of outdoor ventilation airflow rate for improving energy efficiency and IAQ. Build. Environ. 2004, 39, 763–773. [Google Scholar] [CrossRef]
- Lee, S.; Hwangbo, S.; Kim, J.T.; Yoo, C.K. Gain scheduling based ventilation control with varying periodic indoor air quality (IAQ) dynamics for healthy IAQ and energy savings. Energy Build. 2017, 153, 275–286. [Google Scholar] [CrossRef]
- McLaughlin, B.; Snow, S.; Chapman, A. 11—Codesign to improve IAQ awareness in classrooms. In Intelligent Environmental Data Monitoring for Pollution Management; Bhattacharyya, S., Mondal, N.K., Platos, J., Snášel, V., Krömer, P., Eds.; Academic Press: Cambridge, MA, USA, 2021; pp. 241–267. [Google Scholar] [CrossRef]
- Poirier, B.; Guyot, G.; Geoffroy, H.; Woloszyn, M.; Ondarts, M.; Gonze, E. Pollutants emission scenarios for residential ventilation performance assessment. A review. J. Build. Eng. 2021, 42, 102488. [Google Scholar] [CrossRef]
- Fabbri, K.; Boeri, A. IAQ evaluation in kindergarten: The Italian case of Asilo Diana. Adv. Build. Energy Res. 2014, 8, 241–258. [Google Scholar] [CrossRef]
- Lee, G.; Na, Y.; Kim, J.T.; Kim, S. A Computing Model for Lifecycle Health Performance Evaluations of Sustainable Healthy Buildings. Indoor Built Environ. 2012, 22, 7–20. [Google Scholar] [CrossRef]
- Silva, H.E.; Henriques, F.M.A. The impact of tourism on the conservation and IAQ of cultural heritage: The case of the Monastery of Jerónimos (Portugal). Build. Environ. 2021, 190, 107536. [Google Scholar] [CrossRef]
- Mendes, A.; Teixeira, J.P. Sick Building Syndrome. In Encyclopedia of Toxicology, 3rd ed.; Wexler, P., Ed.; Academic Press: Oxford, UK, 2014; pp. 256–260. [Google Scholar] [CrossRef]
- Fermo, P.; Artíñano, B.; De Gennaro, G.; Pantaleo, A.M.; Parente, A.; Battaglia, F.; Colicino, E.; Di Tanna, G.; da Silva Junior, A.G.; Pereira, I.G.; et al. Improving indoor air quality through an air purifier able to reduce aerosol particulate matter (PM) and volatile organic compounds (VOCs): Experimental results. Environ. Res. 2021, 197, 111131. [Google Scholar] [CrossRef] [PubMed]
- Nishihama, Y.; Nakayama, S.F.; Tamura, K.; Isobe, T.; Michikawa, T.; Iwai-Shimada, M.; Kobayashi, Y.; Sekiyama, M.; Taniguchi, Y.; Yamazaki, S. Indoor air quality of 5,000 households and its determinants. Part A: Particulate matter (PM2.5 and PM10–2.5) concentrations in the Japan Environment and Children’s Study. Environ. Res. 2021, 198, 111196. [Google Scholar] [CrossRef]
- Branco, P.T.B.S.; Alvim-Ferraz, M.C.M.; Martins, F.G.; Sousa, S.I.V. Indoor air quality in urban nurseries at Porto city: Particulate matter assessment. Atmos. Environ. 2014, 84, 133–143. [Google Scholar] [CrossRef]
- Mendoza, D.L.; Benney, T.M.; Boll, S. Long-term analysis of the relationships between indoor and outdoor fine particulate pollution: A case study using research grade sensors. Sci. Total Environ. 2021, 776, 145778. [Google Scholar] [CrossRef] [PubMed]
- Korsavi, S.S.; Montazami, A.; Mumovic, D. Indoor air quality (IAQ) in naturally-ventilated primary schools in the UK: Occupant-related factors. Build. Environ. 2020, 180, 106992. [Google Scholar] [CrossRef]
- Shrestha, P.M.; Humphrey, J.L.; Carlton, E.J.; Adgate, J.L.; Barton, K.E.; Root, E.D.; Miller, S.L. Impact of Outdoor Air Pollution on Indoor Air Quality in Low-Income Homes during Wildfire Seasons. Int. J. Environ. Res. Public Health 2019, 16, 3535. [Google Scholar] [CrossRef] [PubMed]
- Loy-Benitez, J.; Heo, S.; Yoo, C. Imputing missing indoor air quality data via variational convolutional autoencoders: Implications for ventilation management of subway metro systems. Build. Environ. 2020, 182, 107135. [Google Scholar] [CrossRef]
- Wagiman, K.R.; Abdullah, M.N.; Hassan, M.Y.; Mohammad Radzi, N.H. A new metric for optimal visual comfort and energy efficiency of building lighting system considering daylight using multi-objective particle swarm optimization. J. Build. Eng. 2021, 43, 102525. [Google Scholar] [CrossRef]
- MeshkinKiya, M.; Paolini, R. Uncertainty of solar radiation in urban canyons propagates to indoor thermo-visual comfort. Sol. Energy 2021, 221, 545–558. [Google Scholar] [CrossRef]
- Nasrollahi, N.; Shokri, E. Daylight illuminance in urban environments for visual comfort and energy performance. Renew. Sustain. Energy Rev. 2016, 66, 861–874. [Google Scholar] [CrossRef]
- ElBatran, R.M.; Ismaeel, W.S.E. Applying a parametric design approach for optimizing daylighting and visual comfort in office buildings. Ain Shams Eng. J. 2021, 12, 3275–3284. [Google Scholar] [CrossRef]
- Shafavi, N.S.; Zomorodian, Z.S.; Tahsildoost, M.; Javadi, M. Occupants visual comfort assessments: A review of field studies and lab experiments. Sol. Energy 2020, 208, 249–274. [Google Scholar] [CrossRef]
- Wirz-Justice, A.; Skene, D.J.; Münch, M. The relevance of daylight for humans. Biochem. Pharmacol. 2020, 191, 114304. [Google Scholar] [CrossRef] [PubMed]
- Yang, W.; Moon, H.J. Combined effects of acoustic, thermal, and illumination conditions on the comfort of discrete senses and overall indoor environment. Build. Environ. 2019, 148, 623–633. [Google Scholar] [CrossRef]
- Kwong, Q.J. Light level, visual comfort and lighting energy savings potential in a green-certified high-rise building. J. Build. Eng. 2020, 29, 101198. [Google Scholar] [CrossRef]
- Liu, X.; Sun, Y.; Wei, S.; Meng, L.; Cao, G. Illumination distribution and daylight glare evaluation within different windows for comfortable lighting. Results Opt. 2021, 3, 100080. [Google Scholar] [CrossRef]
- Hu, Y.; Luo, M.R.; Yang, Y. A study on lighting uniformity for LED smart lighting system. In Proceedings of the 12th China International Forum on Solid State Lighting (SSLCHINA), Shenzhen, China, 2–4 November 2015; pp. 127–130. [Google Scholar] [CrossRef]
- Roetzel, A.; DeKay, M.; Nakai Kidd, A.; Klas, A.; Sadick, A.M.; Whittem, V.; Zinkiewicz, L. Architectural, indoor environmental, personal and cultural influences on students’ selection of a preferred place to study. Archit. Sci. Rev. 2020, 63, 275–291. [Google Scholar] [CrossRef]
- Lu, M.; Hu, S.; Mao, Z.; Liang, P.; Xin, S.; Guan, H. Research on work efficiency and light comfort based on EEG evaluation method. Build. Environ. 2020, 183, 107122. [Google Scholar] [CrossRef]
- Salamati, M.; Mathur, P.; Kamyabjou, G.; Taghizade, K. Daylight performance analysis of TiO2@W-VO2 thermochromic smart glazing in office buildings. Build. Environ. 2020, 186, 107351. [Google Scholar] [CrossRef]
- Shamsul, B.M.T.; Sia, C.C.; Ng, Y.G.; Karmegan, K. Effects of Light’s Colour Temperatures on Visual Comfort Level, Task Performances, and Alertness among Students. Am. J. Public Health Res. 2013, 1, 159–165. [Google Scholar] [CrossRef]
- Hosseini, S.M.; Mohammadi, M.; Rosemann, A.; Schröder, T.; Lichtenberg, J. A morphological approach for kinetic façade design process to improve visual and thermal comfort: Review. Build. Environ. 2019, 153, 186–204. [Google Scholar] [CrossRef]
- Andargie, M.S.; Touchie, M.; O’Brien, W. A review of factors affecting occupant comfort in multi-unit residential buildings. Build. Environ. 2019, 160, 106182. [Google Scholar] [CrossRef]
- Michael, A.; Heracleous, C. Assessment of natural lighting performance and visual comfort of educational architecture in Southern Europe: The case of typical educational school premises in Cyprus. Energy Build. 2017, 140, 443–457. [Google Scholar] [CrossRef]
- Fakhari, M.; Vahabi, V.; Fayaz, R. A study on the factors simultaneously affecting visual comfort in classrooms: A structural equation modeling approach. Energy Build. 2021, 249, 111232. [Google Scholar] [CrossRef]
- Álvarez, S.P. Natural Light Influence on Intellectual Performance. A Case Study on University Students. Sustainability 2020, 12, 4167. [Google Scholar] [CrossRef]
- Eijkelenboom, A.; Kim, D.H.; Bluyssen, P.M. First results of self-reported health and comfort of staff in outpatient areas of hospitals in the Netherlands. Build. Environ. 2020, 177, 106871. [Google Scholar] [CrossRef]
- Kharvari, F.; Rostami-Moez, M. Assessment of occupant adaptive behavior and visual comfort in educational facilities: A cross-sectional field survey. Energy Sustain. Dev. 2021, 61, 153–167. [Google Scholar] [CrossRef]
- Day, J.K.; Futrell, B.; Cox, R.; Ruiz, S.N.; Amirazar, A.; Zarrabi, A.H.; Azarbayjani, M. Blinded by the light: Occupant perceptions and visual comfort assessments of three dynamic daylight control systems and shading strategies. Build. Environ. 2019, 154, 107–121. [Google Scholar] [CrossRef]
- Korsavi, S.S.; Montazami, A.; Mumovic, D. The impact of indoor environment quality (IEQ) on school children’s overall comfort in the UK; a regression approach. Build. Environ. 2020, 185, 107309. [Google Scholar] [CrossRef]
- Elnaklah, R.; Walker, I.; Natarajan, S. Moving to a green building: Indoor environment quality, thermal comfort and health. Build. Environ. 2021, 191, 107592. [Google Scholar] [CrossRef]
- Pölönen, M.; Järvenpää, T.; Bilcu, B. Stereoscopic 3D entertainment and its effect on viewing comfort: Comparison of children and adults. Appl. Ergon. 2013, 44, 151–160. [Google Scholar] [CrossRef]
- Cheong, K.H.; Teo, Y.H.; Koh, J.M.; Acharya, U.R.; Man Yu, S.C. A simulation-aided approach in improving thermal-visual comfort and power efficiency in buildings. J. Build. Eng. 2020, 27, 100936. [Google Scholar] [CrossRef]
- Howarth, P.A.; Hodder, S.G. Subjective responses to display bezel characteristics. Appl. Ergon. 2015, 47, 253–258. [Google Scholar] [CrossRef][Green Version]
- Dewang, A.; Rebika, D.; Sneha, A.; Rohit, S.; Radhika, T. Current Perspectives in Low Vision and its Management. Open Access J. Ophthalmol. 2017, 2, 000125. [Google Scholar] [CrossRef]
- Bedrosian, T.A.; Nelson, R.J. Timing of light exposure affects mood and brain circuits. Transl. Psychiatry 2017, 7, e1017. [Google Scholar] [CrossRef]
- Budkowska, M.; Lebiecka, A.; Marcinowska, Z.; Woźniak, J.; Jastrzębska, M.; Dołęgowska, B. The circadian rhythm of selected parameters of the hemostasis system in healthy people. Thromb. Res. 2019, 182, 79–88. [Google Scholar] [CrossRef] [PubMed]
- Xiao, H.; Cai, H.; Li, X. Non-visual effects of indoor light environment on humans: A review. Physiol. Behav. 2012, 228, 113195. [Google Scholar] [CrossRef] [PubMed]
- Reid, K.J. Assessment of Circadian Rhythms. Neurol. Clin. 2019, 37, 505–526. [Google Scholar] [CrossRef] [PubMed]
- Claudi, L.; Arnesano, M.; Chiariotti, P.; Battista, G.; Revel, G.M. A soft-sensing approach for the evaluation of the acoustic comfort due to building envelope protection against external noise. Measurement 2019, 146, 675–688. [Google Scholar] [CrossRef]
- Oral, G.K.; Yener, A.K.; Bayazit, N.T. Building envelope design with the objective to ensure thermal, visual and acoustic comfort conditions. Build. Environ. 2004, 39, 281–287. [Google Scholar] [CrossRef]
- Naticchia, B.; Carbonari, A. Feasibility analysis of an active technology to improve acoustic comfort in buildings. Build. Environ. 2007, 42, 2785–2796. [Google Scholar] [CrossRef]
- Kuerer, R.C. Classes of acoustical comfort in housing: Improved information about noise control in buildings. Appl. Acoust. 1997, 52, 197–210. [Google Scholar] [CrossRef]
- Alonso, A.; Patricio, J.; Suárez, R.; Escandón, R. Acoustical retrofit of existing residential buildings: Requirements and recommendations for sound insulation between dwellings in Europe and other countries worldwide. Build. Environ. 2020, 174, 106771. [Google Scholar] [CrossRef]
- Camara, T.; Kamsu-Foguem, B.; Diourte, B.; Faye, J.P.; Hamadoun, O. Management of acoustic risks for buildings near airports. Ecol. Inform. 2018, 44, 43–56. [Google Scholar] [CrossRef]
- Dong, X.; Wu, Y.; Chen, X.; Li, H.; Cao, B.; Zhang, X.; Yan, X.; Li, Z.; Long, Y.; Li, X. Effect of thermal, acoustic, and lighting environment in underground space on human comfort and work efficiency: A review. Sci. Total Environ. 2021, 786, 147537. [Google Scholar] [CrossRef]
- Torresin, S.; Albatici, R.; Aletta, F.; Babich, F.; Oberman, T.; Siboni, S.; Kang, J. Indoor soundscape assessment: A principal components model of acoustic perception in residential buildings. Build. Environ. 2020, 182, 107152. [Google Scholar] [CrossRef]
- Tsirigoti, D.; Giarma, C.; Tsikaloudaki, K. Indoor Acoustic Comfort Provided by an Innovative Preconstructed Wall Module: Sound Insulation Performance Analysis. Sustainability 2020, 12, 8666. [Google Scholar] [CrossRef]
- Zhisheng, L.; Dongmei, L.; Sheng, M.; Guoqiang, Z.; Jianlong, L. Noise Impact and Improvement on Indoors Acoustic Comfort for the Building Adjacent to Heavy Traffic Road. Chin. J. Popul. Resour. Environ. 2007, 5, 17–25. [Google Scholar] [CrossRef]
- Nowicka, E. The acoustical assessment of the commercial spaces and buildings. Appl. Acoust. 2020, 169, 107491. [Google Scholar] [CrossRef]
- Wu, Y.; Meng, Q.; Li, L.; Mu, J. Interaction between Sound and Thermal Influences on Patient Comfort in the Hospitals of China’s Northern Heating Region. Appl. Sci. 2019, 9, 5551. [Google Scholar] [CrossRef]
- Ramlee, N.A.; Naveen, J.; Jawaid, M. Potential of oil palm empty fruit bunch (OPEFB) and sugarcane bagasse fibers for thermal insulation application—A review. Constr. Build. Mater. 2021, 271, 121519. [Google Scholar] [CrossRef]
- Kim, A.; Wang, S.; McCunn, L.; Prozuments, A.; Swanson, T.; Lokan, K. Commissioning the Acoustical Performance of an Open Office Space Following the Latest Healthy Building Standard: A Case Study. Acoustics 2019, 1, 27. [Google Scholar] [CrossRef]
- Ismail, M.R. A parametric investigation of the acoustical performance of contemporary mosques. Front. Archit. Res. 2013, 2, 30–41. [Google Scholar] [CrossRef]
- Subramaniam, N.; Ramachandraiah, A. Speech Intelligibility Issues in Classroom Acoustics—A Review. IE(I) J.-AR 2006, 87, 1–5. Available online: https://www.researchgate.net/publication/290266910_Speech_intelligibility_issues_in_classroom_acoustics-_A_review (accessed on 13 April 2021).
- Klatte, M.; Lachmann, T.; Meis, M. Effects of noise and reverberation on speech perception and listening comprehension of children and adults in a classroom-like setting. Noise Health 2010, 12, 270–282. Available online: https://www.noiseandhealth.org/text.asp?2010/12/49/270/70506 (accessed on 13 April 2021). [CrossRef]
- Mokari, P.G.; Gafos, A.; Williams, D. Perceptuomotor compatibility effects in vowels: Beyond phonemic identity. Atten. Percept. Psychophys. 2020, 82, 2751–2764. [Google Scholar] [CrossRef] [PubMed]
- Fogerty, D.; Humes, L.E. The role of vowel and consonant fundamental frequency, envelope, and temporal fine structure cues to the intelligibility of words and sentences. J. Acoust. Soc. Am. 2012, 131, 1490–1501. [Google Scholar] [CrossRef]
- Schomer, P.D.; Swenson, G.W. 40-Electroacoustics. In Reference Data for Engineers, 9th ed.; Middleton, W.M., Valkenburg, M.E.V., Eds.; Newnes: Woburn, MA, USA, 2002; pp. 40-1–40-28. [Google Scholar] [CrossRef]
- World Health Organization. Guidelines for Community Noise; WHO: Geneva, Switzerland, 1999; Available online: https://www.who.int/docstore/peh/noise/Comnoise-1.pdf (accessed on 15 April 2021).
- Acoustical Society of America. Acoustical Performance Criteria, Design Requirements and Guidelines for Schools (ANSI S12.60-2002); American National Standard: Melville, NY, USA, 2002; Available online: https://citeseerx.ist.psu.edu/viewdoc/download?doi=10.1.1.196.5704&rep=rep1&type=pdf (accessed on 15 April 2021).
- Department of Education. Acoustic Design of Schools: Performance Standards, Building Bulletin 93; Department of Education: London, UK, 2015. Available online: https://assets.publishing.service.gov.uk/government/uploads/system/uploads/attachment_data/file/400784/BB93_February_2015.pdf (accessed on 15 April 2021).
- ISHRAE. Indoor Environmental Quality Standard ISHRAE Standard—10001; ISHRAE: New Delhi, India, 2019. [Google Scholar]
- American Speech–Language–Hearing Association (ASHA). Statement and Guidelines for Acoustics in Educational Environments; ASHA: New York, NY, USA, 1995; Available online: https://leader.pubs.asha.org/doi/full/10.1044/leader.FTR2.13132008.14 (accessed on 15 April 2021).
- Bureau of Indian Standards, Government of India. Code of Practice for Sound Insulation of Non-Industrial Buildings IS:1950; Bureau of Indian Standards: New Delhi, India, 1962. Available online: https://law.resource.org/pub/in/bis/S03/is.1950.1962.pdf (accessed on 16 April 2021).
- British Association of Teachers of the Deaf Classroom Acoustics—Recommended Standards. BATOD Magazine; British Association of Teachers of the Deaf Classroom Acoustics: High Wycombe, UK, 2001; Available online: https://www.batod.org.uk/wp-content/uploads/2018/08/acoustic-standards.pdf (accessed on 16 April 2021).
- Sharma, M.R.; Ali, S. Tropical summer index—A study of thermal comfort of Indian subjects. Build. Environ. 1986, 21, 11–24. [Google Scholar] [CrossRef]
- Bureau of Indian Standards, Government of India. Handbook on Functional Requirements of Buildings (Other Than Industrial Buildings) SP:41; Bureau of Indian Standards: New Delhi, India, 1987. Available online: https://law.resource.org/pub/in/bis/S03/is.sp.41.1987.pdf (accessed on 16 April 2021).
- Bureau of Indian Standards, Government of India. National Building Code of India; Bureau of Indian Standards: New Delhi, India, 2005. Available online: https://www.wbphed.gov.in/resources/manuals/is_sp_7_2005_nbc.pdf (accessed on 16 April 2021).
- Kapoor, N.R.; Tegar, J.P. Human comfort indicators pertaining to indoor environmental quality parameters of residential buildings in Bhopal. Int. Res. J. Eng. Technol. 2018, 5, 2395-0056. Available online: https://www.irjet.net/archives/V5/i7/IRJET-V5I7311.pdf (accessed on 17 April 2021).
- Choyimanikandiyil, K. Occupants’ Comfort in School Buildings. Int. J. Chem. Environ. Biol. Sci. 2013, 1, 675–677. Available online: http://www.isaet.org/images/extraimages/D1013039.pdf (accessed on 17 April 2021).
- Choyimanikandiyil, K. Critical Gap in Research on Adaptive Thermal Comfort of Children in Primary School Buildings. Int. J. Adv. Mech. Civ. Eng. 2016, 3, 84–88. Available online: http://www.iraj.in/journal/journal_file/journal_pdf/13-243-146277020184-88.pdf (accessed on 17 April 2021).
- Jindal, A. Thermal comfort study in naturally ventilated school classrooms in composite climate of India. Build. Environ. 2018, 142, 34–46. [Google Scholar] [CrossRef]
- Singh, M.K.; Ooka, R.; Rijal, H.B. Thermal comfort in Classrooms: A critical review. In Proceedings of the 10th Windsor Conference 2018, Cumberland Lodge Conference Centre in Windsor Great Park, London, UK, 12–15 April 2018; pp. 649–668. Available online: https://windsorconference.com/wp-content/uploads/2019/04/W18_PROCEEDINGS-compressed.pdf (accessed on 17 April 2021).
- Gadkari, N.; Pervez, S. Source apportionment of personal exposure of fine particulates among school communities in India. Environ. Monit. Assess. 2008, 142, 227–241. [Google Scholar] [CrossRef] [PubMed]
- Gadkari, N.M. Study of personal–indoor–ambient fine particulate matters among school communities in mixed urban–industrial environment in India. Environ. Monit. Assess. 2010, 165, 365–375. [Google Scholar] [CrossRef]
- Habil, M.; Taneja, A. Children’s Exposure to Indoor Particulate Matter in Naturally Ventilated Schools in India. Indoor Built Environ. 2011, 20, 430–448. [Google Scholar] [CrossRef]
- Goyal, R.; Khare, M. Indoor air quality modeling for PM10, PM2.5, and PM1.0 in naturally ventilated classrooms of an urban Indian school building. Environ. Monit. Assess. 2011, 176, 501–516. [Google Scholar] [CrossRef]
- Majumdar, D.; Gajghate, D.G.; Pipalatkar, P.; Chalapati Rao, C.V. Assessment of Airborne Fine Particulate Matter and Particle Size Distribution in Settled Chalk Dust during Writing and Dusting Exercises in a Classroom. Indoor Built Environ. 2011, 21, 541–551. [Google Scholar] [CrossRef]
- Chithra, V.S.; Shiva Nagendra, S.M. Indoor air quality investigations in a naturally ventilated school building located close to an urban roadway in Chennai, India. Build. Environ. 2012, 54, 159–167. [Google Scholar] [CrossRef]
- Habil, M.; Massey, D.D.; Taneja, A. Exposure of children studying in schools of India to PM levels and metal contamination: Sources and their identification. Air Qual. Atmos. Health 2013, 6, 575–587. [Google Scholar] [CrossRef]
- Goel, S.; Patidar, R.; Baxi, K.; Thakur, R.S. Investigation of particulate matter performances in relation to chalk selection in classroom environment. Indoor Built Environ. 2015, 26, 119–131. [Google Scholar] [CrossRef]
- Habil, M.; Massey, D.D.; Taneja, A. Exposure from particle and ionic contamination to children in schools of India. Atmos. Pollut. Res. 2015, 6, 719–725. [Google Scholar] [CrossRef]
- Sireesha, A.N.L.; Padmavathi, P.P. A Study on Assessment of Indoor Air Quality in Secondary Schools of Hyderabad City, India. J. Environ. Sci. Comput. Sci. Eng. Technol. 2015, 4, 248–260. Available online: https://www.jecet.org/download_frontend.php?id=143&table=Env%20Science (accessed on 17 April 2021).
- Jan, R.; Roy, R.; Yadav, S.; Satsangi, P.G. Exposure assessment of children to particulate matter and gaseous species in school environments of Pune, India. Build. Environ. 2017, 111, 207–217. [Google Scholar] [CrossRef]
- Jayakumar, S.; Apte, M.G. Estimation and analysis of ventilation rates in schools in Indian context: IAQ and Indoor Environmental Quality. IOP Conf. Ser. Mater. Sci. Eng. 2019, 609, 032046. [Google Scholar] [CrossRef]
- Singh, P.; Arora, R.; Goyal, R. Classroom Ventilation and Its Impact on Concentration and Performance of Students: Evidences from Air-Conditioned and Naturally Ventilated Schools of Delhi. In Indoor Environmental Quality; Springer: Berlin/Heidelberg, Germany, 2020; pp. 125–137. [Google Scholar] [CrossRef]
- Chithra, V.S.; Nagendra, S.M.S. Characterizing and predicting coarse and fine particulates in classrooms located close to an urban roadway. J. Air Waste Manag. Assoc. 2014, 64, 945–956. [Google Scholar] [CrossRef] [PubMed]
- Bhalekar, A.A.; Sneha, R. Assessment of Indoor & Outdoor Air Quality of School Buildings Located Close to Urban Roadway in Manipal (Karnataka). Int. J. Civ. Eng. Technol. 2018, 9, 61–73. Available online: http://www.iaeme.com/citearticle.asp?Ed=12193&Jtype=IJCIET&VType=9&Itype=7 (accessed on 18 April 2021).
- Central Pollution Control Board, Ministry of Environment; Forest & Climate Change (MoEFCC), Government of India. National Ambient Air Quality Standards (NAAQS); ENVIS Centre CPCB: New Delhi, India, 2009. Available online: https://scclmines.com/env/DOCS/NAAQS-2009.pdf (accessed on 18 April 2021).
- American Society of Heating, Refrigerating and Air-Conditioning Engineers (ASHRAE). Ventilation for Acceptable Indoor Air Quality (ASHRAE 62.1); ASHRAE: Atlanta, GA, USA, 2013; Available online: http://www.myiaire.com/product-docs/ultraDRY/ASHRAE62.1.pdf (accessed on 18 April 2021).
- Barrett, P.; Davies, F.; Zhang, Y.; Barrett, L. The impact of classroom design on pupils’ learning: Final results of a holistic, multi-level analysis. Build. Environ. 2015, 89, 118–133. [Google Scholar] [CrossRef]
- Puglisi, G.E.; Cutiva, L.C.; Pavese, L.; Castellana, A.; Bona, M.; Fasolis, S.; Lorenzatti, V.; Carullo, A.; Burdorf, A.; Bronuzzi, F.; et al. Acoustic Comfort in High-school Classrooms for Students and Teachers. Energy Procedia 2015, 78, 3096–3101. [Google Scholar] [CrossRef]
- Montiel, I.; Mayoral, A.M.; Pedreño, J.N.; Maiques, S. Acoustic Comfort in Learning Spaces: Moving Towards Sustainable Development Goals. Sustainability 2019, 11, 3573. [Google Scholar] [CrossRef]
- Rahmaniar, I.; Putra, J.C.P. Effect of Acoustic and Thermal Comfort to Support Learning Process in a University. Procedia Eng. 2017, 170, 280–285. [Google Scholar] [CrossRef]
- John, J.; Thampuram, A.; Premlet, B. Acoustic Evaluation of Vernacular School Buildings in Kerala. Int. J. Sci. Eng. Res. 2014, 5, 33–40. Available online: https://www.ijser.org/researchpaper/Acoustic-Evaluation-of-Vernacular-School-Buildings-in-Kerala.pdf (accessed on 18 April 2021).
- Mondal, N.K.; Ghatak, B. Vulnerability of school children exposed to traffic noise. Int. J. Environ. Health Eng. 2014, 3, 45–52. [Google Scholar] [CrossRef]
- John, J.; Thampuran, A.L.; Premlet, B. Acoustic Comfort of Schools in Tropical Humid Climate. Int. J. Eng. Adv. Technol. 2015, 4, 13–19. Available online: https://www.semanticscholar.org/paper/Acoustic-Comfort-of-Schools-in-Tropical-Humid-John-Thampuran/d60a9f7eaa0f37226b833a373424193691f974f7#paper-header (accessed on 19 April 2021).
- Gupta, V. Policy on Classroom Acoustics in India. DEI-FOERA A Res. J. Educ. 2015, 8, 1–16, ISSN No. 0974-7966. Available online: https://www.academia.edu/23900873/Policy_on_Classroom_Acoustics_in_India (accessed on 19 April 2021).
- Roy, K.P. Global case studies of acoustics in classrooms. In Proceedings of the 22nd International Congress on Acoustics (ICA 2016), Buenos Aires, Argentina, 5–9 September 2016; Available online: http://www.ica2016.org.ar/ica2016proceedings/ica2016/ICA2016-0102.pdf (accessed on 19 April 2021).
- Sundaravadhanan, G.; Selvarajan, H.G.; McPherson, B. Classroom Listening Conditions in Indian Primary Schools: A Survey of Four Schools. Noise Health 2017, 19, 31–40. Available online: https://www.noiseandhealth.org/text.asp?2017/19/86/31/199240 (accessed on 20 April 2021).
- Saravanan, G.; Selvarajan, H.G.; McPherson, B. Profiling Indian classroom listening conditions in schools for children with hearing impairment. Noise Health 2019, 21, 83–95. Available online: https://www.ncbi.nlm.nih.gov/pmc/articles/PMC7158895/ (accessed on 20 April 2021). [CrossRef]
- Kwon, M.; Remøy, H.; van den Bogaard, M. Influential design factors on occupant satisfaction with indoor environment in workplaces. Build. Environ. 2019, 157, 356–365. [Google Scholar] [CrossRef]
- Hassanain, M.A. Analysis of factors influencing office workplace planning and design in corporate facilities. J. Build. Apprais. 2010, 6, 183–197. [Google Scholar] [CrossRef]
- Mohd Azmi, N.A.S.; Juliana, N.; Azmani, S.; Mohd Effendy, N.; Abu, I.F.; Mohd Fahmi Teng, N.I.; Das, S. Cortisol on Circadian Rhythm and Its Effect on Cardiovascular System. Int. J. Environ. Res. Public Health 2021, 18, 676. [Google Scholar] [CrossRef]
- Singh, P.; Arora, R. Classroom Illuminance: Its impact on Students’ Health Exposure & Concentration Performance. In Proceedings of the International Ergonomics Conference HWWE 2014, Guwahati, India, 3–5 December 2014; Available online: https://www.researchgate.net/publication/311301869_Classroom_Illuminance_Its_impact_on_Students’_Health_Exposure_Concentration_Performance (accessed on 20 April 2021).
- Singh, P.; Arora, R.; Goyal, R. Impact of lighting on performance of students in Delhi schools. In Indoor Environmental Quality; Springer: Berlin/Heidelberg, Germany, 2020; pp. 95–108. [Google Scholar] [CrossRef]
- Kumar, A.; Kumar, A.; Jain, K. Apps for Integrating Daylight with Artificial Lighting for Improving Building Energy Efficiency during Daytime in All Climates of India; GOI: New Delhi, India, 2019.
- GRIHA. GRIHA—Prakriti Rating for Existing Day Schools; GRIHA: New Delhi, India, 2014. [Google Scholar]
- IGBC. IGBC Green Schools Rating System; IGBC: Hyderabad, India, 2015; Available online: http://www.activeads.in/ebook/gbc2016/images/IGBC-Rating-Systems/06-IGBC%20Green%20School%20rating-Oct2015.pdf (accessed on 20 April 2021).
- Bureau of Indian Standards, Government of India. Code of Practice for Daylighting of Educational Buildings IS:7942; Bureau of Indian Standards: New Delhi, India, 1976. Available online: https://law.resource.org/pub/in/bis/S03/is.7942.1976.pdf (accessed on 20 April 2021).
- Bureau of Indian Standards, Government of India. Recommendations for Basic Requirements of School Buildings IS:8827; Bureau of Indian Standards: New Delhi, India, 1978. Available online: https://law.resource.org/pub/in/bis/S03/is.8827.1978.pdf (accessed on 20 April 2021).
- Vervoort, J.; Boestra, A.; Virta, M.; Mishra, A.; Frijns, A.; Loomans, M.; Hensen, J. Healthy low energy redesigns for schools in Delhi. REHVA J. 2018, 42–46. Available online: https://www.rehva.eu/rehva-journal/chapter/healthy-low-energy-redesigns-for-schools-in-delhi (accessed on 20 April 2021).
- Majra, J.P.; Gur, A. School environment and sanitation in rural India. J. Glob. Infect. Dis. 2010, 2, 109–111. [Google Scholar] [CrossRef]
- Singh, P. Indoor Environmental Quality & Student Health and Performance: A Conceptual Review. Int. J. Phys. Soc. Sci. 2013, 3, 96–107. Available online: https://www.indianjournals.com/ijor.aspx?target=ijor:ijpss&volume=3&issue=7&article=007 (accessed on 20 April 2021).
- Caligiuri, P.; Cieri, H.D.; Minbaeva, D.; Verbeke, A.; Zimmermann, A. International HRM insights for navigating the COVID-19 pandemic: Implications for future research and practice. J. Int. Bus. Stud. 2020, 51, 697–713. [Google Scholar] [CrossRef]
- Burns, D.; Dagnall, N.; Holt, M. Assessing the Impact of the COVID-19 Pandemic on Student Wellbeing at Universities in the United Kingdom: A Conceptual Analysis. Front. Educ. 2020, 5, 204. [Google Scholar] [CrossRef]
- Sundarasen, S.; Chinna, K.; Kamaludin, K.; Nurunnabi, M.; Baloch, G.M.; Khoshaim, H.B.; Hossain, S.F.A.; Sukayt, A. Psychological Impact of COVID-19 and Lockdown among University Students in Malaysia: Implications and Policy Recommendations. Int. J. Environ. Res. Public Health 2020, 17, 6206. [Google Scholar] [CrossRef]
- Ghosh, A.; Nundy, S.; Mallick, T.K. How India is dealing with COVID-19 pandemic. Sens. Int. 2020, 1, 100021. [Google Scholar] [CrossRef]
- Osborn, P.D. Section A—Data charts and tables. In Handbook of Energy Data and Calculations; Osborn, P.D., Ed.; Butterworth-Heinemann: Oxford, UK, 1985; pp. 1–67. [Google Scholar] [CrossRef]
- Wang, Z.; Ding, Y.; Deng, H.; Yang, F.; Zhu, N. An Occupant-Oriented Calculation Method of Building Interior Cooling Load Design. Sustainability 2018, 10, 1821. [Google Scholar] [CrossRef]
- Wang, M.; Han, X.; Fang, H.; Xu, C.; Lin, X.; Xia, S.; Yu, W.; He, J.; Jiang, S.; Tao, H. Impact of Health Education on Knowledge and Behaviors Toward Infectious Diseases among Students in Gansu Province, China. BioMed Res. Int. 2018, 2018, 6397340. [Google Scholar] [CrossRef]
- Management of Infection Diseases in Schools. Available online: https://www.hpsc.ie/a-z/lifestages/schoolhealth/File,14304,en.pdf (accessed on 22 April 2021).
- Ridenhour, B.J.; Braun, A.; Teyrasse, T.; Goldsman, D. Controlling the Spread of Disease in Schools. PLoS ONE 2011, 6, e29640. [Google Scholar] [CrossRef]
- Transmission of SARS-CoV-2: Implications for Infection Prevention Precautions. Available online: https://www.who.int/news-room/commentaries/detail/transmission-of-sars-cov-2-implications-for-infection-prevention-precautions (accessed on 22 April 2021).
- Scientific Brief: SARS-CoV-2 Transmission. Available online: https://www.cdc.gov/coronavirus/2019-ncov/science/science-briefs/sars-cov-2-transmission.html (accessed on 10 May 2021).
- Heating, Ventilation and Air-Conditioning Systems in the Context of COVID-19: First Update. Available online: https://www.ecdc.europa.eu/sites/default/files/documents/Heating-ventilation-air-conditioning-systems-in-the-context-of-COVID-19-first-update.pdf (accessed on 10 May 2021).
- Sopeyin, A.; Hornsey, E.; Okwor, T.; Alimi, Y.; Raji, T.; Mohammed, A.; Moges, H.; Onwuekwe, E.V.; Minja, F.J.; Gon, G.; et al. Transmission risk of respiratory viruses in natural and mechanical ventilation environments: Implications for SARS-CoV-2 transmission in Africa. BMJ Glob. Health 2020, 5, e003522. [Google Scholar] [CrossRef] [PubMed]
- Chirico, F.; Sacco, A.; Bragazzi, N.L.; Magnavita, N. Can Air-Conditioning Systems Contribute to the Spread of SARS/MERS/COVID-19 Infection? Insights from a Rapid Review of the Literature. Int. J. Environ. Res. Public Health 2020, 17, 6052. [Google Scholar] [CrossRef]
- Lipinski, T.; Ahmad, D.; Serey, N.; Jouhara, H. Review of ventilation strategies to reduce the risk of disease transmission in high occupancy buildings. Int. J. 2020, 7–8, 100045. [Google Scholar] [CrossRef]
- Morawska, L.; Tang, J.W.; Bahnfleth, W.; Bluyssen, P.M.; Boerstra, A.; Buonanno, G.; Cao, J.; Dancer, S.; Floto, A.; Franchimon, F.; et al. How can airborne transmission of COVID-19 indoors be minimised? Environ. Int. 2020, 142, 105832. [Google Scholar] [CrossRef]
- Burridge, H.C.; Bhagat, R.K.; Stettler, M.E.; Kumar, P.; De Mel, I.; Demis, P.; Hart, A.; Johnson-Llambias, Y.; King, M.F.; Klymenko, O.; et al. The ventilation of buildings and other mitigating measures for COVID-19: A focus on wintertime. Proc. R. Soc. A Math. Phys. Eng. Sci. 2021, 477, 855. [Google Scholar] [CrossRef]
- Aliabadi, A.A.; Rogak, S.N.; Bartlett, K.H.; Green, S.I. Preventing Airborne Disease Transmission: Review of Methods for Ventilation Design in Health Care Facilities. Adv. Prev. Med. 2011, 2011, 124064. [Google Scholar] [CrossRef]
- García de Abajo, F.J.; Hernández, R.J.; Kaminer, I.; Meyerhans, A.; Rosell-Llompart, J.; Sanchez-Elsner, T. Back to Normal: An Old Physics Route to Reduce SARS-CoV-2 Transmission in Indoor Spaces. ACS Nano 2020, 14, 7704–7713. [Google Scholar] [CrossRef]
- Ai, Z.T.; Melikov, A.K. Airborne spread of expiratory droplet nuclei between the occupants of indoor environments: A review. Indoor Air 2018, 28, 500–524. [Google Scholar] [CrossRef]
- Liu, L.; Li, Y.; Nielsen, P.V.; Wei, J.; Jensen, R.L. Short-range airborne transmission of expiratory droplets between two people. Indoor Air 2017, 27, 452–462. [Google Scholar] [CrossRef]
- Falahi, S.; Kenarkoohi, A. Transmission routes for SARS-CoV-2 infection: Review of evidence. New Microbes New Infect. 2020, 38, 100778. [Google Scholar] [CrossRef]
- Karia, R.; Gupta, I.; Khandait, H.; Yadav, A.; Yadav, A. COVID-19 and its Modes of Transmission. SN Compr. Clin. Med. 2020, 2, 1798–1801. [Google Scholar] [CrossRef]
- Modes of transmission of virus causing COVID-19: Implications for IPC precaution recommendations. Available online: https://www.who.int/news-room/commentaries/detail/modes-of-transmission-of-virus-causing-covid-19-implications-for-ipc-precaution-recommendations (accessed on 10 May 2021).
- Borak, J. Airborne Transmission of COVID-19. Occup. Med. 2020, 70, 297–299. [Google Scholar] [CrossRef]
- Yan, J.; Grantham, M.; Pantelic, J.; De Mesquita, P.J.B.; Albert, B.; Liu, F.; Ehrman, S.; Milton, D.K.; Consortium, E. Infectious virus in exhaled breath of symptomatic seasonal influenza cases from a college community. Proc. Natl. Acad. Sci. USA 2018, 115, 1081. [Google Scholar] [CrossRef] [PubMed]
- Solevåg, A.L.; Eggen, E.H.; Schröder, J.; Nakstad, B. Use of a modified pediatric early warning score in a department of pediatric and adolescent medicine. PLoS ONE 2013, 8, e72534. [Google Scholar] [CrossRef] [PubMed]
- Saikia, D.; Mahanta, B. Cardiovascular and respiratory physiology in children. Int. J. Anesth. 2019, 63, 690–697. Available online: https://www.ijaweb.org/text.asp?2019/63/9/690/266805 (accessed on 10 May 2021). [CrossRef] [PubMed]
- Subbarao, K.; Mahanty, S. Respiratory Virus Infections: Understanding COVID-19. Immunity 2020, 52, 905–909. [Google Scholar] [CrossRef] [PubMed]
- Hsia, C.C.W.; Schmitz, A.; Lambertz, M.; Perry, S.F.; Maina, J.N. Evolution of Air Breathing: Oxygen Homeostasis and the Transitions from Water to Land and Sky. Compr. Physiol. 2013, 3, 849–915. [Google Scholar] [CrossRef]
- Greenhalgh, T.; Jimenez, J.L.; Prather, K.A.; Tufekci, Z.; Fisman, D.; Schooley, R. Ten scientific reasons in support of airborne transmission of SARS-CoV-2. Lancet 2021, 397, 1603–1605. [Google Scholar] [CrossRef]
- Agarwal, N.; Meena, C.S.; Raj, B.P.; Saini, L.; Kumar, A.; Gopalakrishnan, N.; Kumar, A.; Balam, N.B.; Alam, T.; Kapoor, N.R.; et al. Indoor air quality improvement in COVID-19 pandemic: Review. Sustain. Cities Soc. 2021, 70, 102942. [Google Scholar] [CrossRef]
- Darling-Hammond, L.; Flook, L.; Cook-Harvey, C.; Barron, B.; Osher, D. Implications for educational practice of the science of learning and development. Appl. Dev. Sci. 2020, 24, 97–140. [Google Scholar] [CrossRef]
- Gopalan, H.S.; Misra, A. COVID-19 pandemic and challenges for socio-economic issues, healthcare and National Health Programs in India. Diabetes Metab. Syndr. 2020, 14, 757–759. [Google Scholar] [CrossRef] [PubMed]
- Chaudhary, M.; Sodani, P.R.; Das, S. Effect of COVID-19 on Economy in India: Some Reflections for Policy and Programme. J. Health Manag. 2020, 22, 169–180. [Google Scholar] [CrossRef]
- Centers for Disease Control and Prevention. Operational Considerations for Schools. Available online: https://www.cdc.gov/coronavirus/2019-ncov/global-covid-19/schools.html (accessed on 10 May 2021).
- UNICEF. Classroom Precautions During COVID-19 Tips for Teachers to Protect Themselves and Their Students. Available online: https://www.unicef.org/coronavirus/teacher-tips-classroom-precautions-covid-19 (accessed on 12 May 2021).
- Hassen, T.B.; Bilali, H.E.; Allahyari, M.S. Impact of COVID-19 on Food Behavior and Consumption in Qatar. Sustainability 2020, 12, 6973. [Google Scholar] [CrossRef]
- Sahoo, K.; Sahoo, B.; Choudhury, A.; Sofi, N.; Kumar, R.; Bhadoria, A. Childhood obesity: Causes and consequences. Fam. Pract. 2015, 4, 187–192. [Google Scholar] [CrossRef]
- Browning, M.H.E.M.; Larson, L.R.; Sharaievska, I.; Rigolon, A.; McAnirlin, O.; Mullenbach, L.; Cloutier, S.; Vu, T.M.; Thomsen, J.; Reigner, N.; et al. Psychological impacts from COVID-19 among university students: Risk factors across seven states in the United States. PLoS ONE 2021, 16, e0245327. [Google Scholar] [CrossRef] [PubMed]
- Browne, N.T.; Snethen, J.A.; Greenberg, C.S.; Frenn, M.; Kilanowski, J.F.; Gance-Cleveland, B.; Burke, P.J.; Lewandowski, L. When Pandemics Collide: The Impact of COVID-19 on Childhood Obesity. J. Pediatric Nurs. 2021, 56, 90–98. [Google Scholar] [CrossRef]
- Rodgers, R.F.; Lombardo, C.; Cerolini, S.; Franko, D.L.; Omori, M.; Fuller-Tyszkiewicz, M.; Linardon, J.; Courtet, P.; Guillaume, S. The impact of the COVID-19 pandemic on eating disorder risk and symptoms. Int. J. Eat. Disord. 2020, 53, 1166–1170. [Google Scholar] [CrossRef]
- Hill, J.O.; Wyatt, H.R.; Peters, J.C. Energy Balance and Obesity. Circulation 2012, 126, 126–132. [Google Scholar] [CrossRef]
- Kyrou, I.; Randeva, H.S.; Tsigos, C.; Kaltsas, G.; Weickert, M.O. Clinical Problems Caused by Obesity. In Endotext [Internet]; Feingold, K.R., Anawalt, B., Boyce, A., Chrousos, G., de Herder, W.W., Dhatariya, K., Dungan, K., Grossman, A., Hershman, J.M., Hofland, J., et al., Eds.; MDText.com, Inc.: South Dartmouth, MA, USA, 2000. Available online: https://www.ncbi.nlm.nih.gov/books/NBK278973/ (accessed on 12 May 2021).
- Poirier, P.; Giles, T.D.; Bray, G.A.; Hong, Y.; Stern, J.S.; Pi-Sunyer, F.X.; Eckel, R.H. Obesity and Cardiovascular Disease: Pathophysiology, Evaluation, and Effect of Weight Loss. Circulation 2006, 113, 898–918. [Google Scholar] [CrossRef] [PubMed]
- González-Muniesa, P.; Mártinez-González, M.-A.; Hu, F.B.; Després, J.P.; Matsuzawa, Y.; Loos, R.J.F.; Moreno, L.A.; Bray, G.A.; Martinez, J.A. Obesity. Nat. Rev. Dis. Primers 2017, 3, 17034. [Google Scholar] [CrossRef]
- Nammi, S.; Koka, S.; Chinnala, K.M.; Boini, K.M. Obesity: An overview on its current perspectives and treatment options. Nutr. J. 2004, 3, 3. [Google Scholar] [CrossRef] [PubMed][Green Version]
- De’, R.; Pandey, N.; Pal, A. Impact of digital surge during COVID-19 pandemic: A viewpoint on research and practice. Int. J. Inf. Manag. 2020, 55, 102171. [Google Scholar] [CrossRef]
- Physical Education. Available online: https://ncert.nic.in/textbook/pdf/jehp101.pdf (accessed on 25 May 2021).
- Physical Activity and Physical Education: Relationship to Growth, Development, and Health. In Educating the Student Body; Hwiii, K., Cook, H.D., Eds.; National Academies Press: Washington, DC, USA, 2013; Volume 3. Available online: https://www.ncbi.nlm.nih.gov/books/NBK201497/ (accessed on 25 May 2021).
- Kumar, A.; Singh, A.; Kumar, A.; Singh, M.K.; Mahanta, P.; Mukhopadhyay, S.C. Sensing Technologies for Monitoring Intelligent Buildings: A Review. IEEE Sens. J. 2018, 18, 4847–4860. [Google Scholar] [CrossRef]
- Coulby, G.; Clear, A.; Jones, O.; Godfrey, A. A Scoping Review of Technological Approaches to Environmental Monitoring. Int. J. Environ. Res. Public Health 2020, 17, 3995. [Google Scholar] [CrossRef]
- Zaballos, A.; Briones, A.; Massa, A.; Centelles, P.; Caballero, V. A Smart Campus’ Digital Twin for Sustainable Comfort Monitoring. Sustainability 2020, 12, 9196. [Google Scholar] [CrossRef]
- Wang, C.; Zhang, F.; Wang, J.; Doyle, J.K.; Hancock, P.A.; Mak, C.M.; Liu, S. How indoor environmental quality affects occupants’ cognitive functions: A systematic review. Build. Environ. 2021, 193, 107647. [Google Scholar] [CrossRef]
- Vathanam, G.S.O.; Kalyanasundaram, K.; Elavarasan, R.M.; Hussain Khahro, S.; Subramaniam, U.; Pugazhendhi, R.; Ramesh, M.; Gopalakrishnan, R.M. A Review on Effective Use of Daylight Harvesting Using Intelligent Lighting Control Systems for Sustainable Office Buildings in India. Sustainability 2021, 13, 4973. [Google Scholar] [CrossRef]
- Lee, S.H. Sustainability in Energy and Buildings. In Proceedings of the International Conference in Sustainability in Energy and Buildings (SEB’09), Brighton, UK, 29 April–1 May 2009. [Google Scholar] [CrossRef]
- Meng, Y.; Yang, Y.; Chung, H.; Lee, P.-H.; Shao, C. Enhancing Sustainability and Energy Efficiency in Smart Factories: A Review. Sustainability 2020, 10, 4779. [Google Scholar] [CrossRef]
- Fagas, I.; Gallagher, J.P.; Gammaitoni, L.; Paul, D.J. Energy Challenges for ICT. In ICT—Energy Concepts for Energy Efficiency and Sustainability; Fagas, G., Gammaitoni, L., Gallagher, J.P., Paul, D.J., Eds.; IntechOpen: London, UK, 2017; pp. 1–36. [Google Scholar] [CrossRef]
- Mehmood, M.U.; Chun, D.; Han, H.; Jeon, G.; Chen, K. A review of the applications of artificial intelligence and big data to buildings for energy-efficiency and a comfortable indoor living environment. Energy Build. 2019, 202, 109383. [Google Scholar] [CrossRef]
- Nam, K.; Heo, S.; Li, Q.; Loy-Benitez, J.; Kim, M.; Park, D.; Yoo, C. A proactive energy-efficient optimal ventilation system using artificial intelligent techniques under outdoor air quality conditions. Appl. Energy 2020, 266, 114893. [Google Scholar] [CrossRef]
- Ngarambe, J.; Yun, G.Y.; Santamouris, M. The use of artificial intelligence (AI) methods in the prediction of thermal comfort in buildings: Energy implications of AI-based thermal comfort controls. Energy Build. 2020, 211, 109807. [Google Scholar] [CrossRef]
- Yu, K.-H.; Chen, Y.A.; Jaimes, E.; Wu, W.C.; Liao, K.K.; Liao, J.C.; Lu, K.C.; Sheu, W.J.; Wang, C.C. Optimization of thermal comfort, indoor quality, and energy-saving in campus classroom through deep Q learning. Case Stud. Therm. Eng. 2021, 24, 100842. [Google Scholar] [CrossRef]
- Kok, I.; Guzel, M.; Ozdemir, S. 8-Recent trends in air quality prediction: An artificial intelligence perspective. In Intelligent Environmental Data Monitoring for Pollution Management; Bhattacharyya, S., Mondal, N.K., Platos, J., Snášel, V., Krömer, P., Eds.; Academic Press: Cambridge, MA, USA, 2021; pp. 195–221. [Google Scholar] [CrossRef]
- Chen, C.-F.; Yilmaz, S.; Pisello, A.L.; De Simone, M.; Kim, A.; Hong, T.; Bandurski, K.; Bavaresco, M.V.; Liu, P.L.; Zhu, Y. The impacts of building characteristics, social psychological and cultural factors on indoor environment quality productivity belief. Build. Environ. 2020, 185, 107189. [Google Scholar] [CrossRef]
- Mahbub, M.; Hossain, M.M.; Gazi, M.S.A. IoT-Cognizant cloud-assisted energy efficient embedded system for indoor intelligent lighting, air quality monitoring, and ventilation. Internet Things 2020, 11, 100266. [Google Scholar] [CrossRef]
- Ramdevi, M.; Gujjula, R.; Ranjith, M.; Sneha, S. IoT Evaluating Indoor Environmental Quality Check of Air and Noise. Mater. Today Proc. 2021, in press. [Google Scholar] [CrossRef]
- Tagliabue, L.C.; Cecconi, F.R.; Rinaldi, S.; Ciribini, A.L.C. Data driven indoor air quality prediction in educational facilities based on IoT network. Energy Build. 2021, 236, 110782. [Google Scholar] [CrossRef]
- Liu, Y.; Pang, Z.; Karlsson, M.; Gong, S. Anomaly detection based on machine learning in IoT-based vertical plant wall for indoor climate control. Build. Environ. 2020, 183, 107212. [Google Scholar] [CrossRef]
- Luna-Navarro, A.; Fidler, P.; Law, A.; Torres, S.; Overend, M. Building Impulse Toolkit (BIT): A novel IoT system for capturing the influence of façades on occupant perception and occupant-façade interaction. Build. Environ. 2021, 193, 107656. [Google Scholar] [CrossRef]
- Dhanalakshmi, S.; Poongothai, M.; Sharma, K. IoT Based Indoor Air Quality and Smart Energy Management for HVAC System. Procedia Comput. Sci. 2020, 171, 1800–1809. [Google Scholar] [CrossRef]
- Jeon, Y.; Cho, C.; Seo, J.; Kwon, K.; Park, H.; Oh, S.; Chung, I.J. IoT-based occupancy detection system in indoor residential environments. Build. Environ. 2018, 132, 181–204. [Google Scholar] [CrossRef]
- Wall, D.; McCullagh, P.; Cleland, I.; Bond, R. Development of an Internet of Things Solution to Monitor and Analyse Indoor Air Quality. Internet Things 2021, 14, 100392. [Google Scholar] [CrossRef]
- Mahbub, M.; Hossain, M.M.; Gazi, M.S.A. Cloud-Enabled IoT-based embedded system and software for intelligent indoor lighting, ventilation, early stage fire detection and prevention. Comput. Netw. 2021, 184, 107673. [Google Scholar] [CrossRef]
- Souza, R.P.P.M.; dos Santos, L.J.A.; Coimbra, G.T.P.; Silva, F.A.; Silva, T.R.M.B. A Big Data-Driven Hybrid Solution to the Indoor-Outdoor Detection Problem. Big Data Res. 2021, 24, 100194. [Google Scholar] [CrossRef]
- Seo, J.; Choi, A.; Sung, M. Recommendation of indoor luminous environment for occupants using big data analysis based on machine learning. Build. Environ. 2021, 198, 107835. [Google Scholar] [CrossRef]
- Zuo, J.; Ji, W.; Ben, Y.; Hassan, M.A.; Fan, W.; Bates, L.; Dong, Z. Using big data from air quality monitors to evaluate indoor PM2.5 exposure in buildings: Case study in Beijing. Environ. Pollut. 2018, 240, 839–847. [Google Scholar] [CrossRef]
- Dionova, B.W.; Mohammed, M.N.; Al-Zubaidi, S.; Yusuf, E. Environment indoor air quality assessment using fuzzy inference system. ICT Express 2020, 6, 185–194. [Google Scholar] [CrossRef]
- Mantha, B.R.K.; Jung, M.K.; García de Soto, B.; Menassa, C.C.; Kamat, V.R. Generalized task allocation and route planning for robots with multiple depots in indoor building environments. Autom. Constr. 2020, 119, 103359. [Google Scholar] [CrossRef]
- Yang, Y.; Feng, Q.; Cai, H.; Xu, J.; Li, F.; Deng, Z.; Yan, C.; Li, X. Experimental study on three single-robot active olfaction algorithms for locating contaminant sources in indoor environments with no strong airflow. Build. Environ. 2019, 155, 320–333. [Google Scholar] [CrossRef]
- Miao, C.; Chen, G.; Yan, C.; Wu, Y. Path planning optimization of indoor mobile robot based on adaptive ant colony algorithm. Comput. Ind. Eng. 2021, 156, 107230. [Google Scholar] [CrossRef]
- Gregory, C.; Vardy, A. microUSV: A low-cost platform for indoor marine swarm robotics research. HardwareX 2020, 7, e00105. [Google Scholar] [CrossRef]
- Yang, C.-T.; Chen, S.-T.; Den, W.; Wang, Y.-T.; Kristiani, E. Implementation of an Intelligent Indoor Environmental Monitoring and management system in cloud. Future Gener. Comput. Syst. 2019, 96, 731–749. [Google Scholar] [CrossRef]
- Wang, C.; Hou, S.; Wen, C.; Gong, Z.; Li, Q.; Sun, X.; Li, J. Semantic line framework-based indoor building modeling using backpacked laser scanning point cloud. ISPRS J. Photogramm. Remote Sens. 2018, 143, 150–166. [Google Scholar] [CrossRef]
- Huang, F.; Wen, C.; Luo, H.; Cheng, M.; Wang, C.; Li, J. Local quality assessment of point clouds for indoor mobile mapping. Neurocomputing 2016, 196, 59–69. [Google Scholar] [CrossRef]
- Merabet, G.H.; Essaaidi, M.; Haddou, M.B.; Qolomany, B.; Qadir, J.; Anan, M.; Al-Fuqaha, A.; Abid, M.R.; Benhaddou, D. Intelligent building control systems for thermal comfort and energy-efficiency: A systematic review of artificial intelligence-assisted techniques. Renew. Sustain. Energy Rev. 2021, 144, 110969. [Google Scholar] [CrossRef]
- Michalski, R.S.; Carbonell, J.G.; Mitchell, T.M. Machine Learning: An Artificial Intelligence Approach; Springer: Berlin/Heidelberg, Germany; New York, NY, USA, 1983; pp. 1–510. Available online: https://www.springer.com/gp/book/9783662124079 (accessed on 12 June 2021).
- Hayes-Roth, F.; Waterman, D.A.; Lenat, D.B. Building Expert Systems; Addison-Wesley Longman Publishing Co., Inc.: Boston, MA, USA, 1983; pp. 1–350. Available online: https://dl.acm.org/doi/book/10.5555/6123 (accessed on 12 June 2021).
- Jackson, P. Introduction to Expert Systems; Addison-Wesley Pub. Co.: Wokingham, Berkshire, UK, 1986; Available online: https://www.semanticscholar.org/paper/Introduction-to-expert-systems-Jackson/719e4e1328be9487b33a13dc38b6120993999ed5 (accessed on 12 June 2021).
- Poole, D.L.; Mackworth, A.K. Artificial Intelligence: Foundations of Computational Agents, 2nd ed.; Cambridge University Press: Cambridge, UK, 2010; pp. 1–820. Available online: https://www.cambridge.org/in/academic/subjects/computer-science/artificial-intelligence-and-natural-language-processing/artificial-intelligence-foundations-computational-agents-2nd-edition?format=HB&isbn=9781107195394#user_reviews (accessed on 12 June 2021).
- Russell, S.; Norvig, P. Artificial Intelligence: A Modern Approach, 4th ed.; Prentice-Hall Inc.: Hoboken, NJ, USA, 2002; pp. 1–1115. Available online: http://aima.cs.berkeley.edu/ (accessed on 12 June 2021).
- Smolensky, P. Connectionist AI, symbolic AI, and the brain. Artif. Intell. Rev. 2004, 1, 95–109. Available online: https://doi.org/2C-symbolic-AI%2C-and-the-brain-Smolensky/03f026f794776a489f15d305677367bcca999a37 (accessed on 12 June 2021). [CrossRef]
- Moon, J.W.; Jung, S.K. Algorithm for optimal application of the setback moment in the heating season using an artificial neural network model. Energy Build. 2016, 127, 859–869. [Google Scholar] [CrossRef]
- Mba, L.; Meukam, P.; Kemajou, A. Application of artificial neural network for predicting hourly indoor air temperature and relative humidity in modern building in humid region. Energy Build. 2016, 121, 32–42. [Google Scholar] [CrossRef]
- Valladares, W.; Galindo, M.; Gutiérrez, J.; Wu, W.C.; Liao, K.K.; Liao, J.C.; Lu, K.C.; Wang, C.C. Energy optimization associated with thermal comfort and indoor air control via a deep reinforcement learning algorithm. Build. Environ. 2019, 155, 105–117. [Google Scholar] [CrossRef]
- Li, W.; Zhang, J.; Zhao, T.; Ren, J. Experimental study of an indoor temperature fuzzy control method for thermal comfort and energy saving using wristband device. Build. Environ. 2021, 187, 107432. [Google Scholar] [CrossRef]
- Bienvenido-Huertas, D.; Rubio-Bellido, C.; Solís-Guzmán, J.; Oliveira, M.J. Experimental characterisation of the periodic thermal properties of walls using artificial intelligence. Energy 2020, 203, 117871. [Google Scholar] [CrossRef]
- Gao, G.; Li, J.; Wen, Y. DeepComfort: Energy-Efficient Thermal Comfort Control in Buildings Via Reinforcement Learning. IEEE Internet Things J. 2020, 7, 8472–8484. [Google Scholar] [CrossRef]
- Irshad, K.; Khan, A.I.; Irfan, S.A.; Alam, M.M.; Almalawi, A.; Zahir, M.H. Utilizing Artificial Neural Network for Prediction of Occupants Thermal Comfort: A Case Study of a Test Room Fitted with a Thermoelectric Air-Conditioning System. IEEE Access 2020, 8, 99709–99728. [Google Scholar] [CrossRef]
- Kim, Y.J. A Supervised-Learning-Based Strategy for Optimal Demand Response of an HVAC System in a Multi-Zone Office Building. IEEE Trans. Smart Grid 2020, 11, 4212–4226. [Google Scholar] [CrossRef]
- Thongkhome, P.; Dejdumrong, N. A Neural Network Based Modeling of Closed Room Thermal Comfort Environmental Prediction for Sensor Hub. In Proceedings of the 17th International Conference on Electrical Engineering/Electronics, Computer, Telecommunications and Information Technology (ECTI-CON), Phuket, Thailand, 24–27 June 2020; pp. 55–58. [Google Scholar] [CrossRef]
- Zhou, Y.; Wang, X.; Xu, Z.; Su, Y.; Liu, T.; Shen, C.; Guan, X. A Model-Driven Learning Approach for Predicting the Personalized Dynamic Thermal Comfort in Ordinary Office Environment. In Proceedings of the IEEE 15th International Conference on Automation Science and Engineering (CASE), Vancouver, BC, Canada, 22–26 August 2019; pp. 739–744. [Google Scholar] [CrossRef]
- Rehman, S.U.; Javed, A.R.; Khan, M.U.; Awan, M.N.; Farukh, A.; Hussien, A. Personalised Comfort: A personalised thermal comfort model to predict thermal sensation votes for smart building residents. Enterp. Inf. Syst. 2020, 2, 1–23. [Google Scholar] [CrossRef]
- Luo, M.; Wang, Z.; Ke, K.; Cao, B.; Zhai, Y.; Zhou, X. Human metabolic rate and thermal comfort in buildings: The problem and challenge. Build. Environ. 2018, 131, 44–52. [Google Scholar] [CrossRef]
- Xie, Q.; Ni, J.-q.; Su, Z. A prediction model of ammonia emission from a fattening pig room based on the indoor concentration using adaptive neuro fuzzy inference system. J. Hazard. Mater. 2017, 325, 301–309. [Google Scholar] [CrossRef] [PubMed]
- Challoner, A.; Pilla, F.; Gill, L. Prediction of indoor air exposure from outdoor air quality using an artificial neural network model for inner city commercial buildings. Int. J. Environ. Res. Public Health 2015, 12, 15233–15253. [Google Scholar] [CrossRef] [PubMed]
- Ahn, J.; Shin, D.; Kim, K.; Yang, J. Indoor air quality analysis using deep learning with sensor data. Sensors 2017, 17, 2476. [Google Scholar] [CrossRef] [PubMed]
- Adeleke, J.A.; Moodley, D.; Rens, G.; Adewumi, A.O. Integrating statistical machine learning in a semantic sensor web for proactive monitoring and control. Sensors 2017, 17, 807. [Google Scholar] [CrossRef]
- Liu, Z.; Cheng, K.; Li, H.; Cao, G.; Wu, D.; Shi, Y. Exploring the potential relationship between indoor air quality and the concentration of airborne culturable fungi: A combined experimental and neural network modeling study. Environ. Sci. Pollut. Res. 2018, 25, 3510–3517. [Google Scholar] [CrossRef] [PubMed]
- Benitez, J.L.; Vilela, P.; Li, Q.; Yoo, C.K. Sequential prediction of quantitative health risk assessment for the fine particulate matter in an underground facility using deep recurrent neural networks. Ecotoxicol. Environ. Saf. 2019, 169, 316–324. [Google Scholar] [CrossRef] [PubMed]
- Vanus, J.; Martinek, R.; Bilik, P.; Zidek, J.; Dohnalek, P.; Gajdos, P. New method for accurate prediction of CO2 in the smart home. In Proceedings of the IEEE International Instrumentation and Measurement Technology Conference Proceedings, Taipei, Taiwan, 23–26 May 2016; pp. 1–5. [Google Scholar] [CrossRef]
- Ha, Q.P.; Metia, S.; Phung, M.D. Sensing data fusion for enhanced indoor air quality monitoring. IEEE Sens. J. 2020, 20, 4430–4441. [Google Scholar] [CrossRef]
- Elhariri, E.; Taie, S.A. H-ahead multivariate microclimate forecasting system based on deep learning. In Proceedings of the International Conference on Innovative Trends in Computer Engineering (ITCE), Aswan, Egypt, 8–9 February 2019; pp. 168–173. [Google Scholar] [CrossRef]
- Fang, B.; Xu, Q.; Park, T.; Zhang, M. AirSense: An intelligent home-based sensing system for indoor air quality analytics. In Proceedings of the 2016 ACM International Joint Conference on Pervasive and Ubiquitous Computing, Berlin/Heidelberg, Germany, 12–16 September 2016; pp. 109–119. [Google Scholar] [CrossRef]
- Maag, B.; Zhou, Z.; Thiele, L. W-air: Enabling personal air pollution monitoring on wearables. Proc. ACM Interact. Mob. Wearable Ubiquitous Technol. 2018, 2, 1–25. [Google Scholar] [CrossRef]
- Schwee, J.H.; Sangogboye, F.C.; Kjærgaard, M.B. Anonymizing building data for data analytics in cross-organizational settings. In Proceedings of the International Conference on Internet of Things Design and Implementation, Montreal, QC, Canada, 15–18 April 2019; pp. 1–12. [Google Scholar] [CrossRef]
- Xiahou, R.; Yi, J.; He, L.; He, W.; Huang, T. Indoor air monitoring system based on Internet of things and its prediction model. In Proceedings of the International Conference on Industrial Control Network and System Engineering Research—ICNSER2019, Shenyang, China, 15–16 March 2019; ACM Press: New York, NY, USA, 2019; pp. 58–63. [Google Scholar] [CrossRef]
- Rodríguez, J.M.; Castilla, M.; Álvarez, J.D.; Rodríguez, F.; Berenguel, M. A Fuzzy Controller for Visual Comfort inside a Meeting-Room. In Proceedings of the 23rd Mediterranean Conference on Control and Automation (MED), Torremolinos, Spain, 16–19 June 2015; Available online: https://core.ac.uk/download/pdf/143458187.pdf (accessed on 15 June 2021). [CrossRef]
- Penacchio, O.; Wilkins, A.J. Visual discomfort and the spatial distribution of Fourier energy. Vis. Res. 2015, 108, 1–7. [Google Scholar] [CrossRef] [PubMed]
- Delgarm, N.; Sajadi, B.; Delgarm, S.; Kowsary, F. A novel approach for the simulation-based optimization of the buildings energy consumption using NSGA-II: Case study in Iran. Energy Build. 2016, 127, 552–560. [Google Scholar] [CrossRef]
- Kim, W.; Jeon, Y.; Kim, Y. Simulation-based optimization of an integrated daylighting and HVAC system using the design of experiments method. Appl. Energy 2016, 162, 666–674. [Google Scholar] [CrossRef]
- Cen, L.; Choi, J.-H.; Yao, X.; Gil, Y.; Narayanan, S.; Pentz, M. A personal visual comfort model: Predict individual’s visual comfort using occupant eye pupil size and machine learning. IOP Conf. Ser. Mater. Sci. Eng. 2019, 609, 042097. [Google Scholar] [CrossRef]
- Kar, P.; Shareef, A.; Kumar, A.; Harn, K.T.; Kalluri, B.; Panda, S.K. ReViCEE: A recommendation based approach for personalized control, visual comfort & energy efficiency in buildings. Build. Environ. 2019, 152, 135–144. [Google Scholar] [CrossRef]
- Zhong, L.; Yuan, J.; Fleck, B. Indoor Environmental Quality Evaluation of Lecture Classrooms in an Institutional Building in a Cold Climate. Sustainability 2019, 11, 6591. [Google Scholar] [CrossRef]
- Yeh, C.-Y.; Tsay, Y.-S. Using Machine Learning to Predict Indoor Acoustic Indicators of Multi-Functional Activity Centers. Appl. Sci. 2021, 11, 5641. [Google Scholar] [CrossRef]
- Khan, N.A.; Bhattacharjee, B. Methodology for Simultaneous Optimization of the Thermal, Visual, and Acoustic Performance of Building Envelope. J. Archit. Eng. 2021, 27, 04021015. [Google Scholar] [CrossRef]


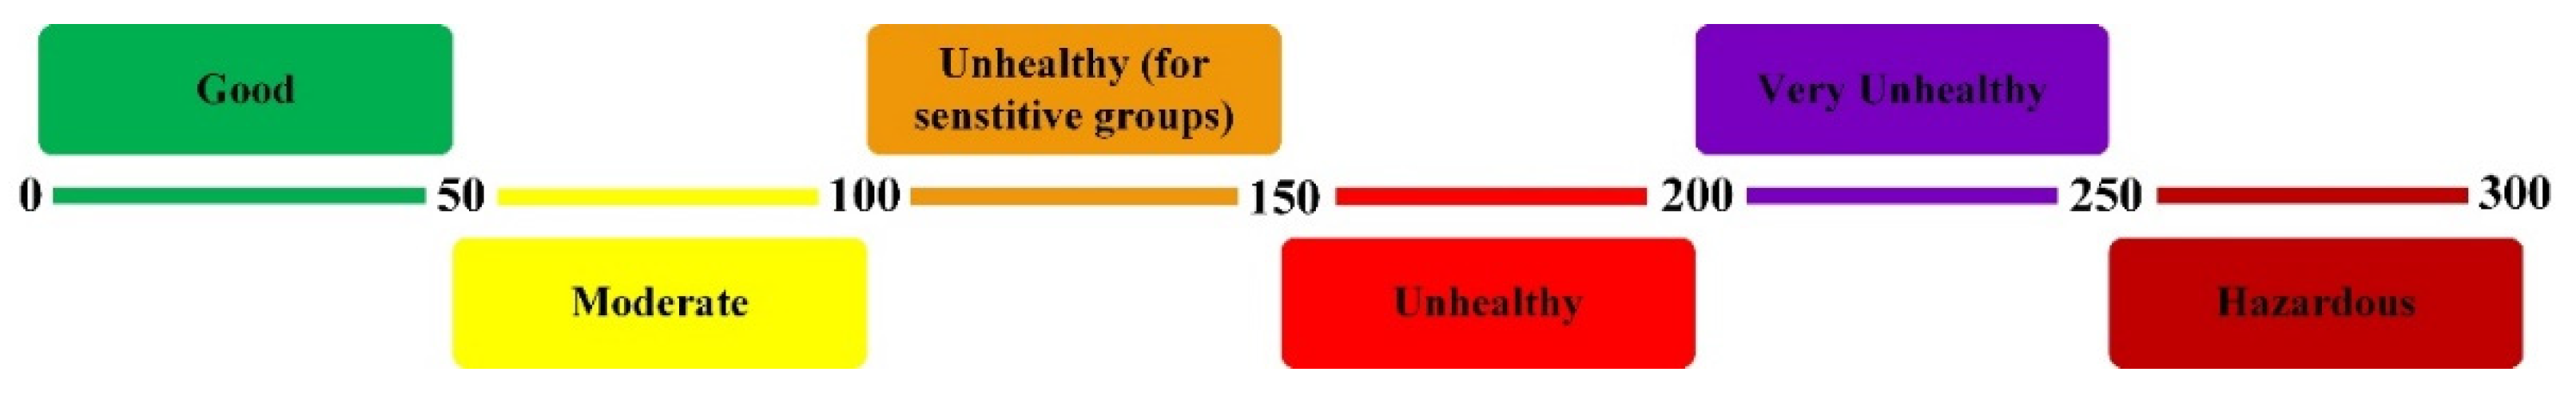
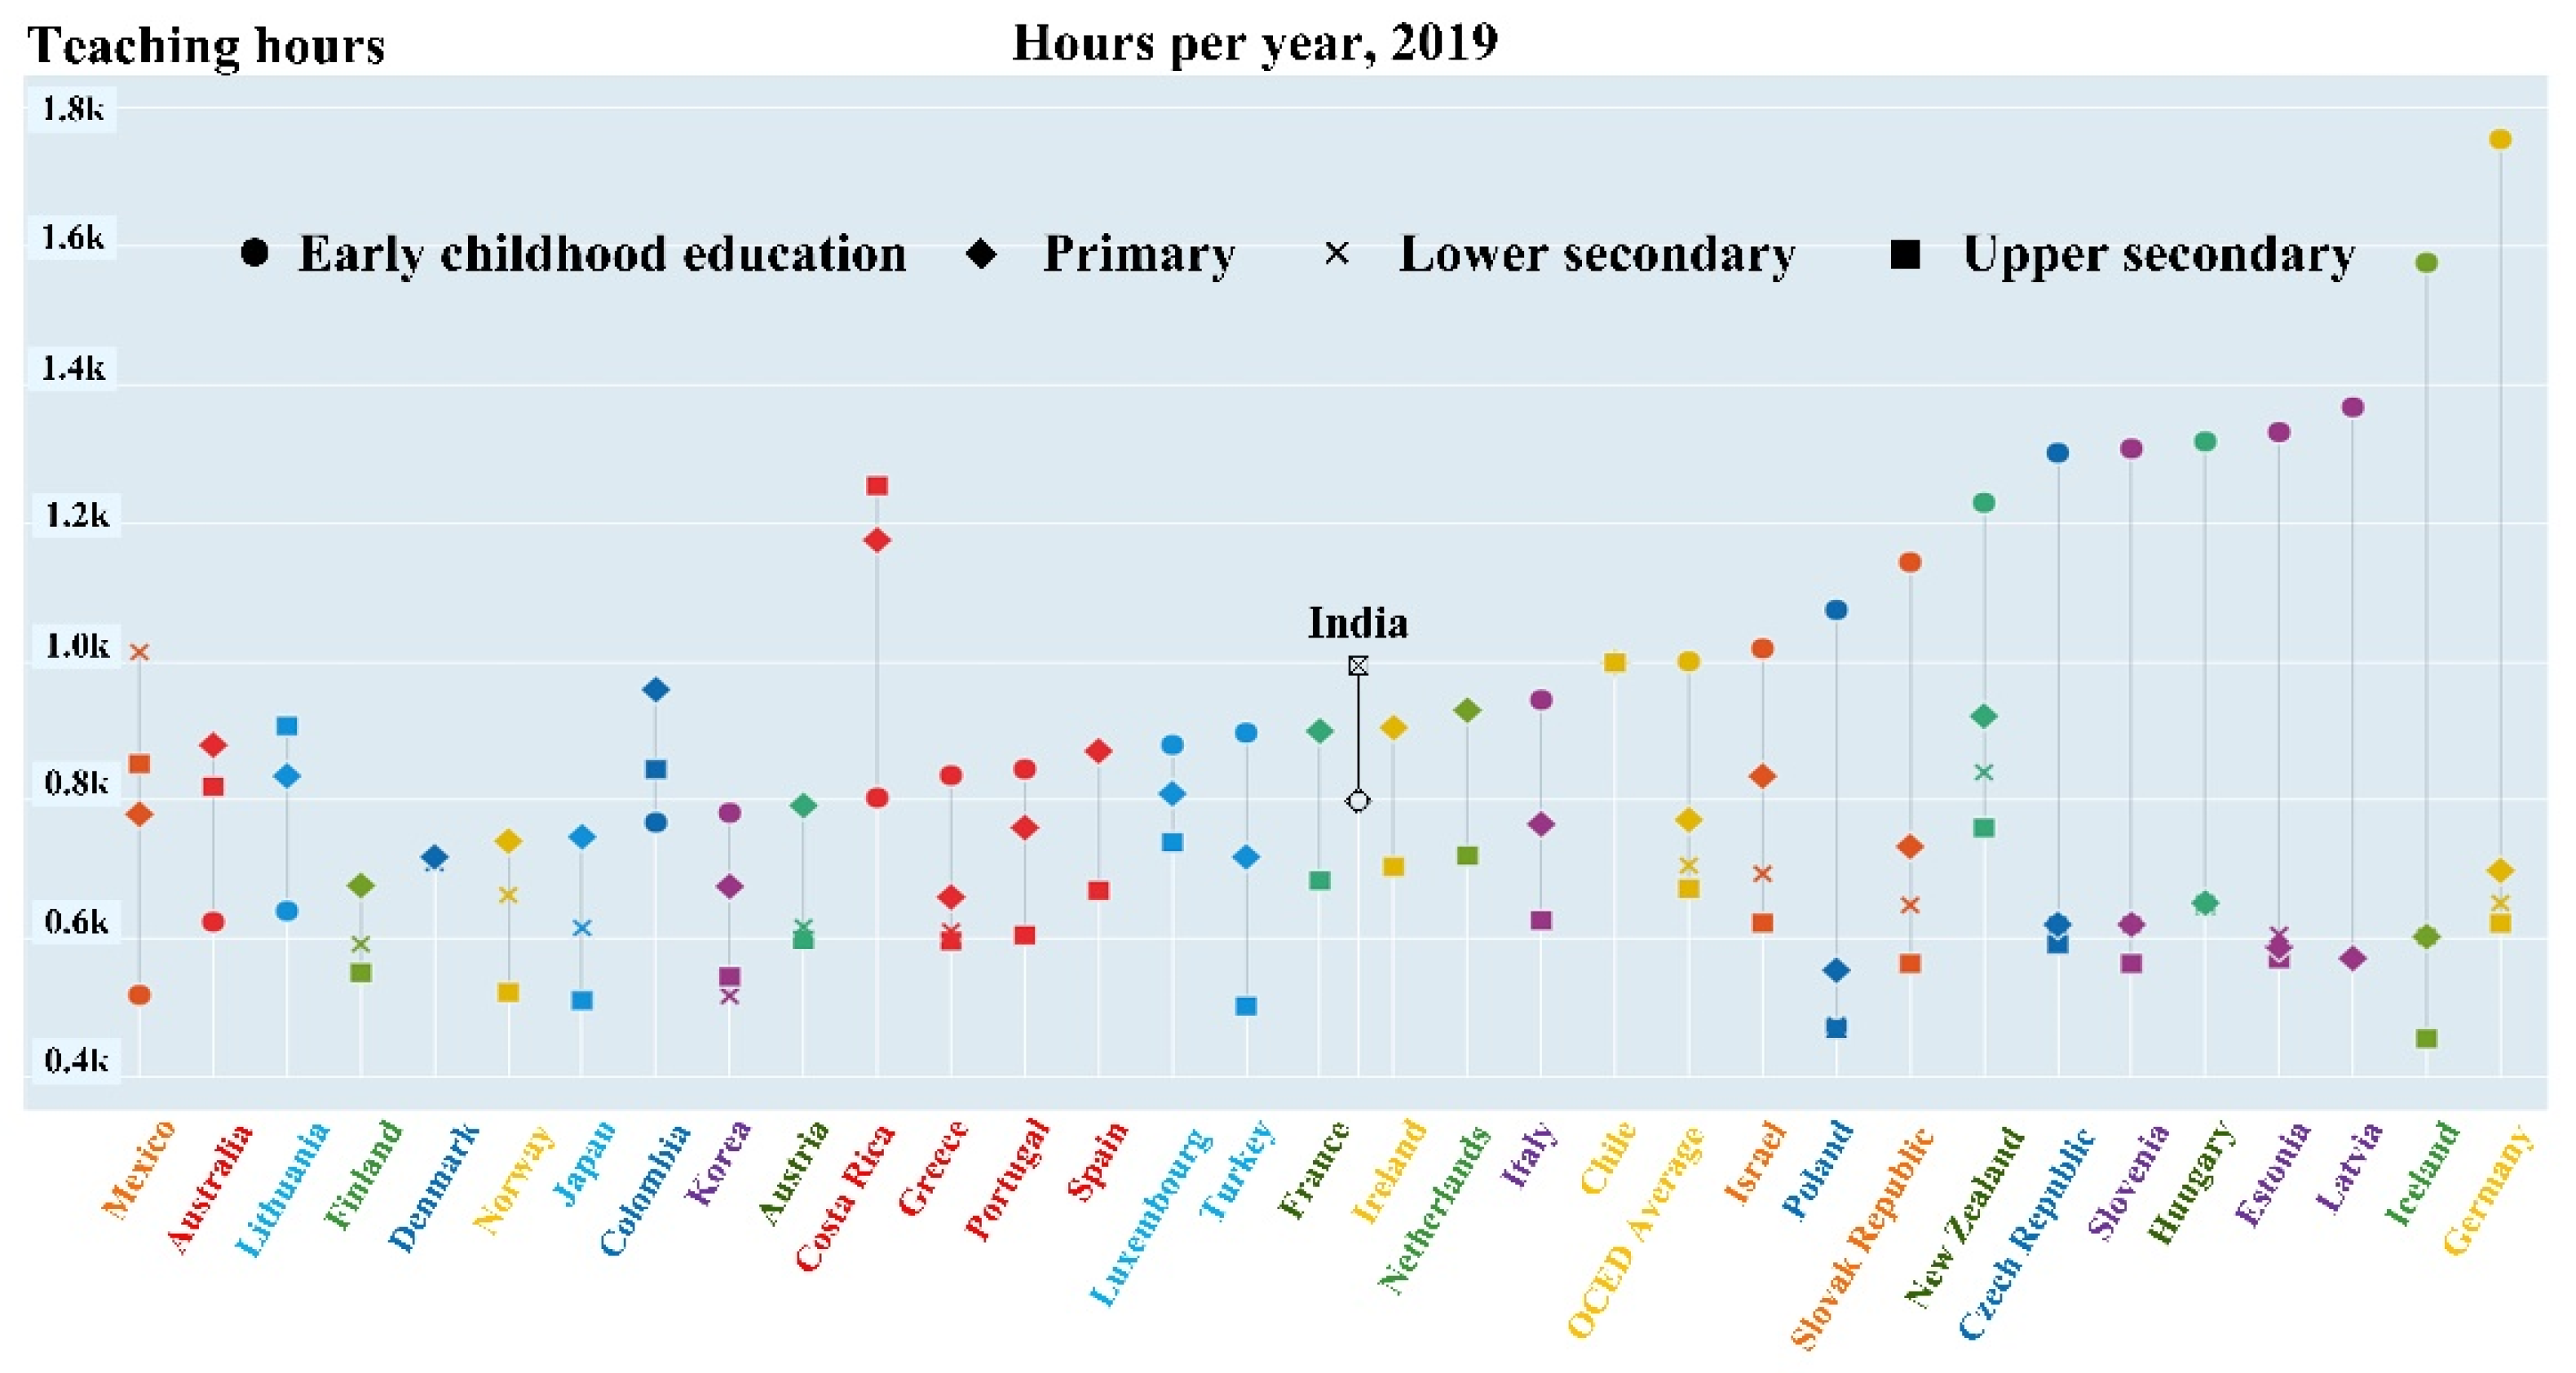
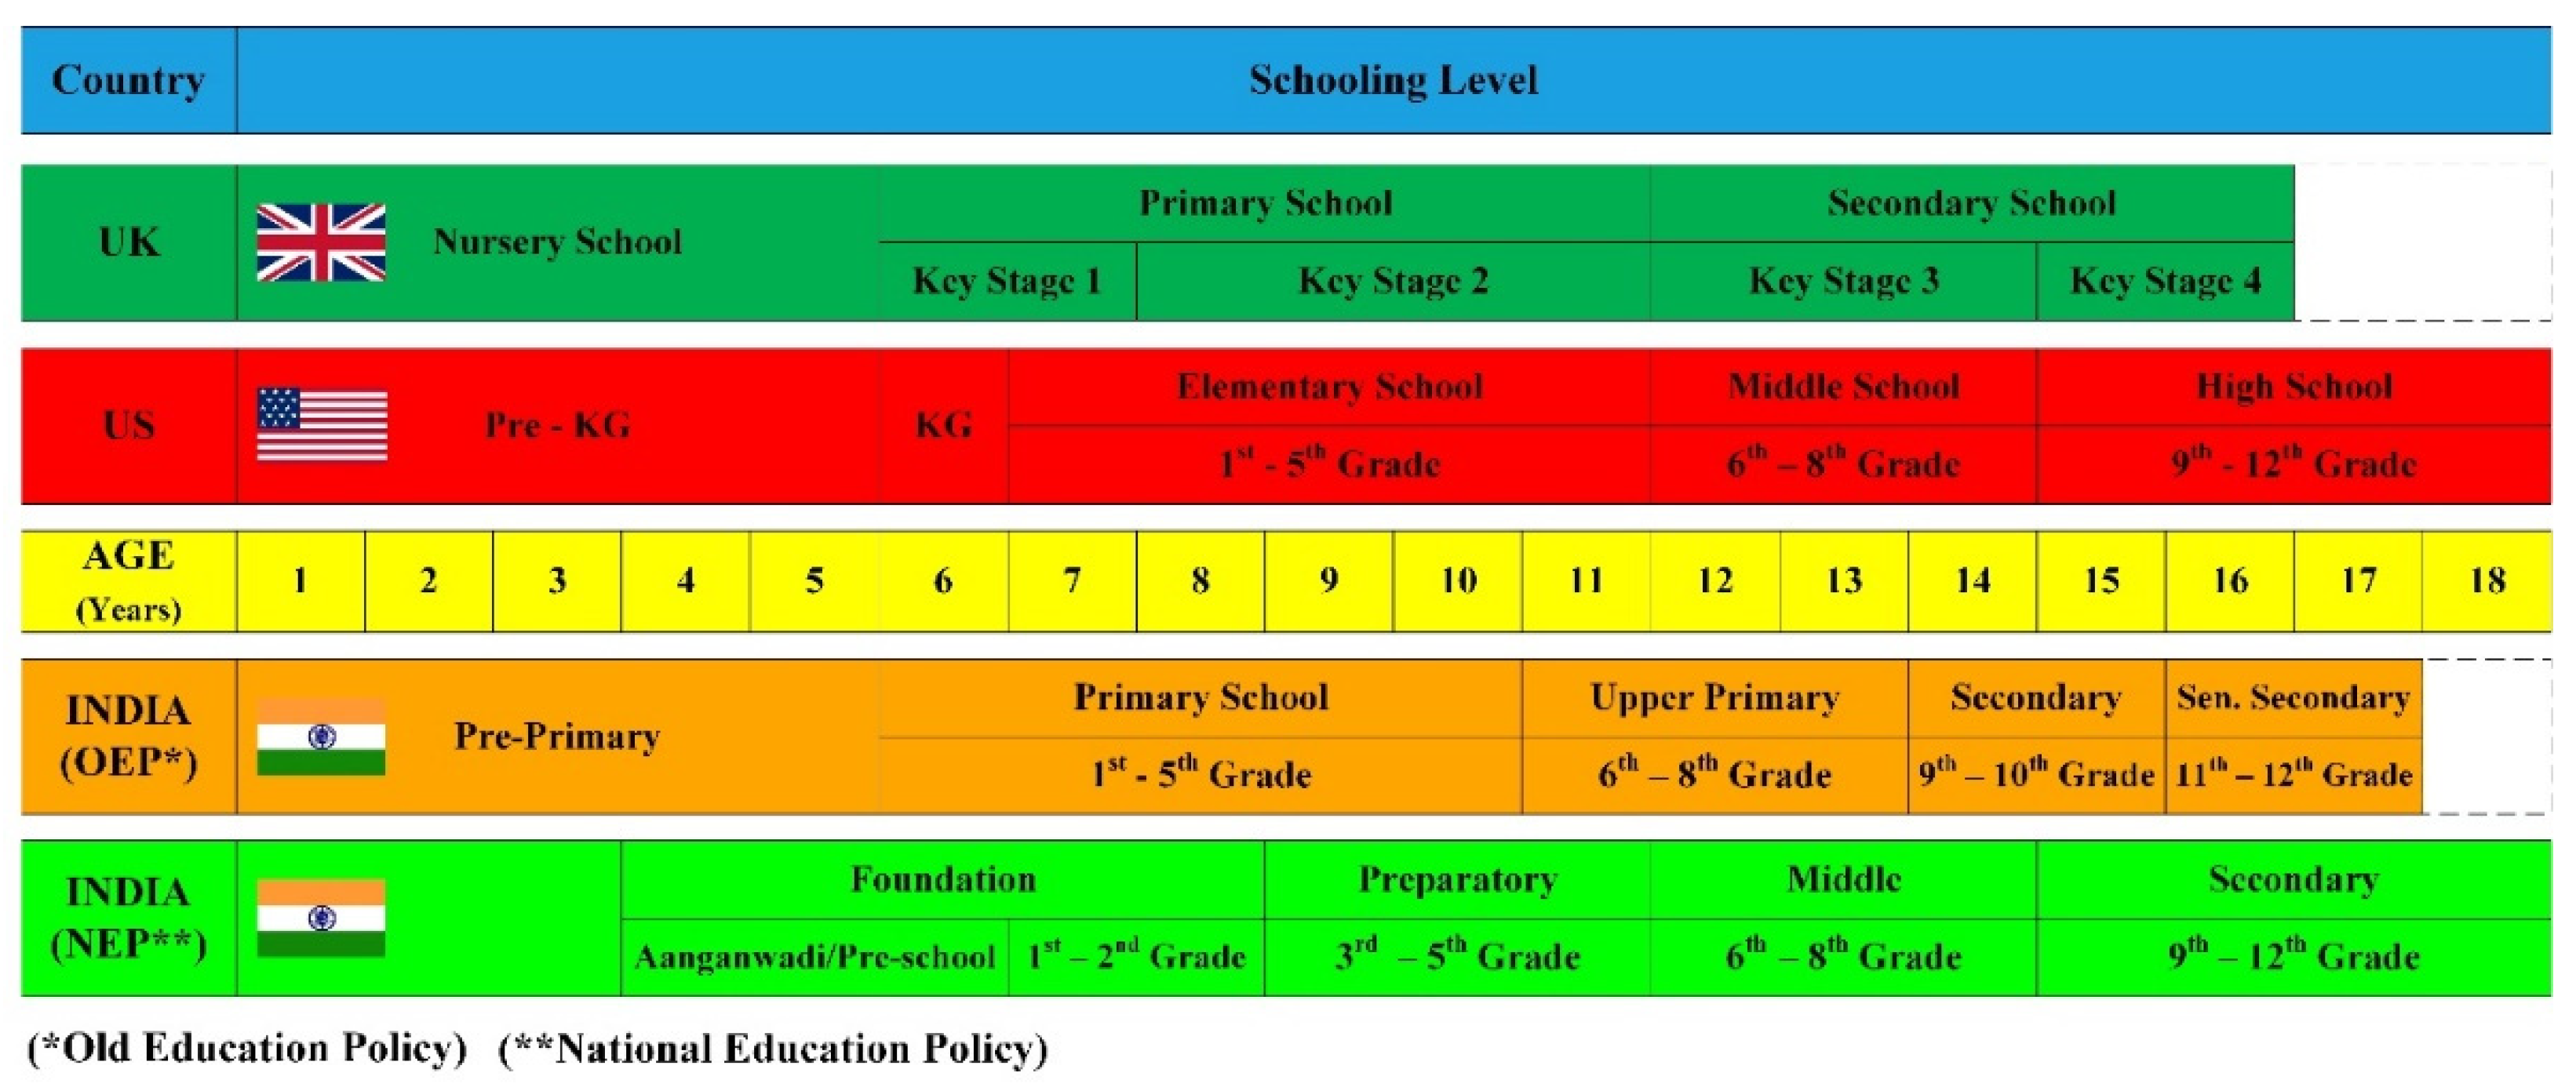
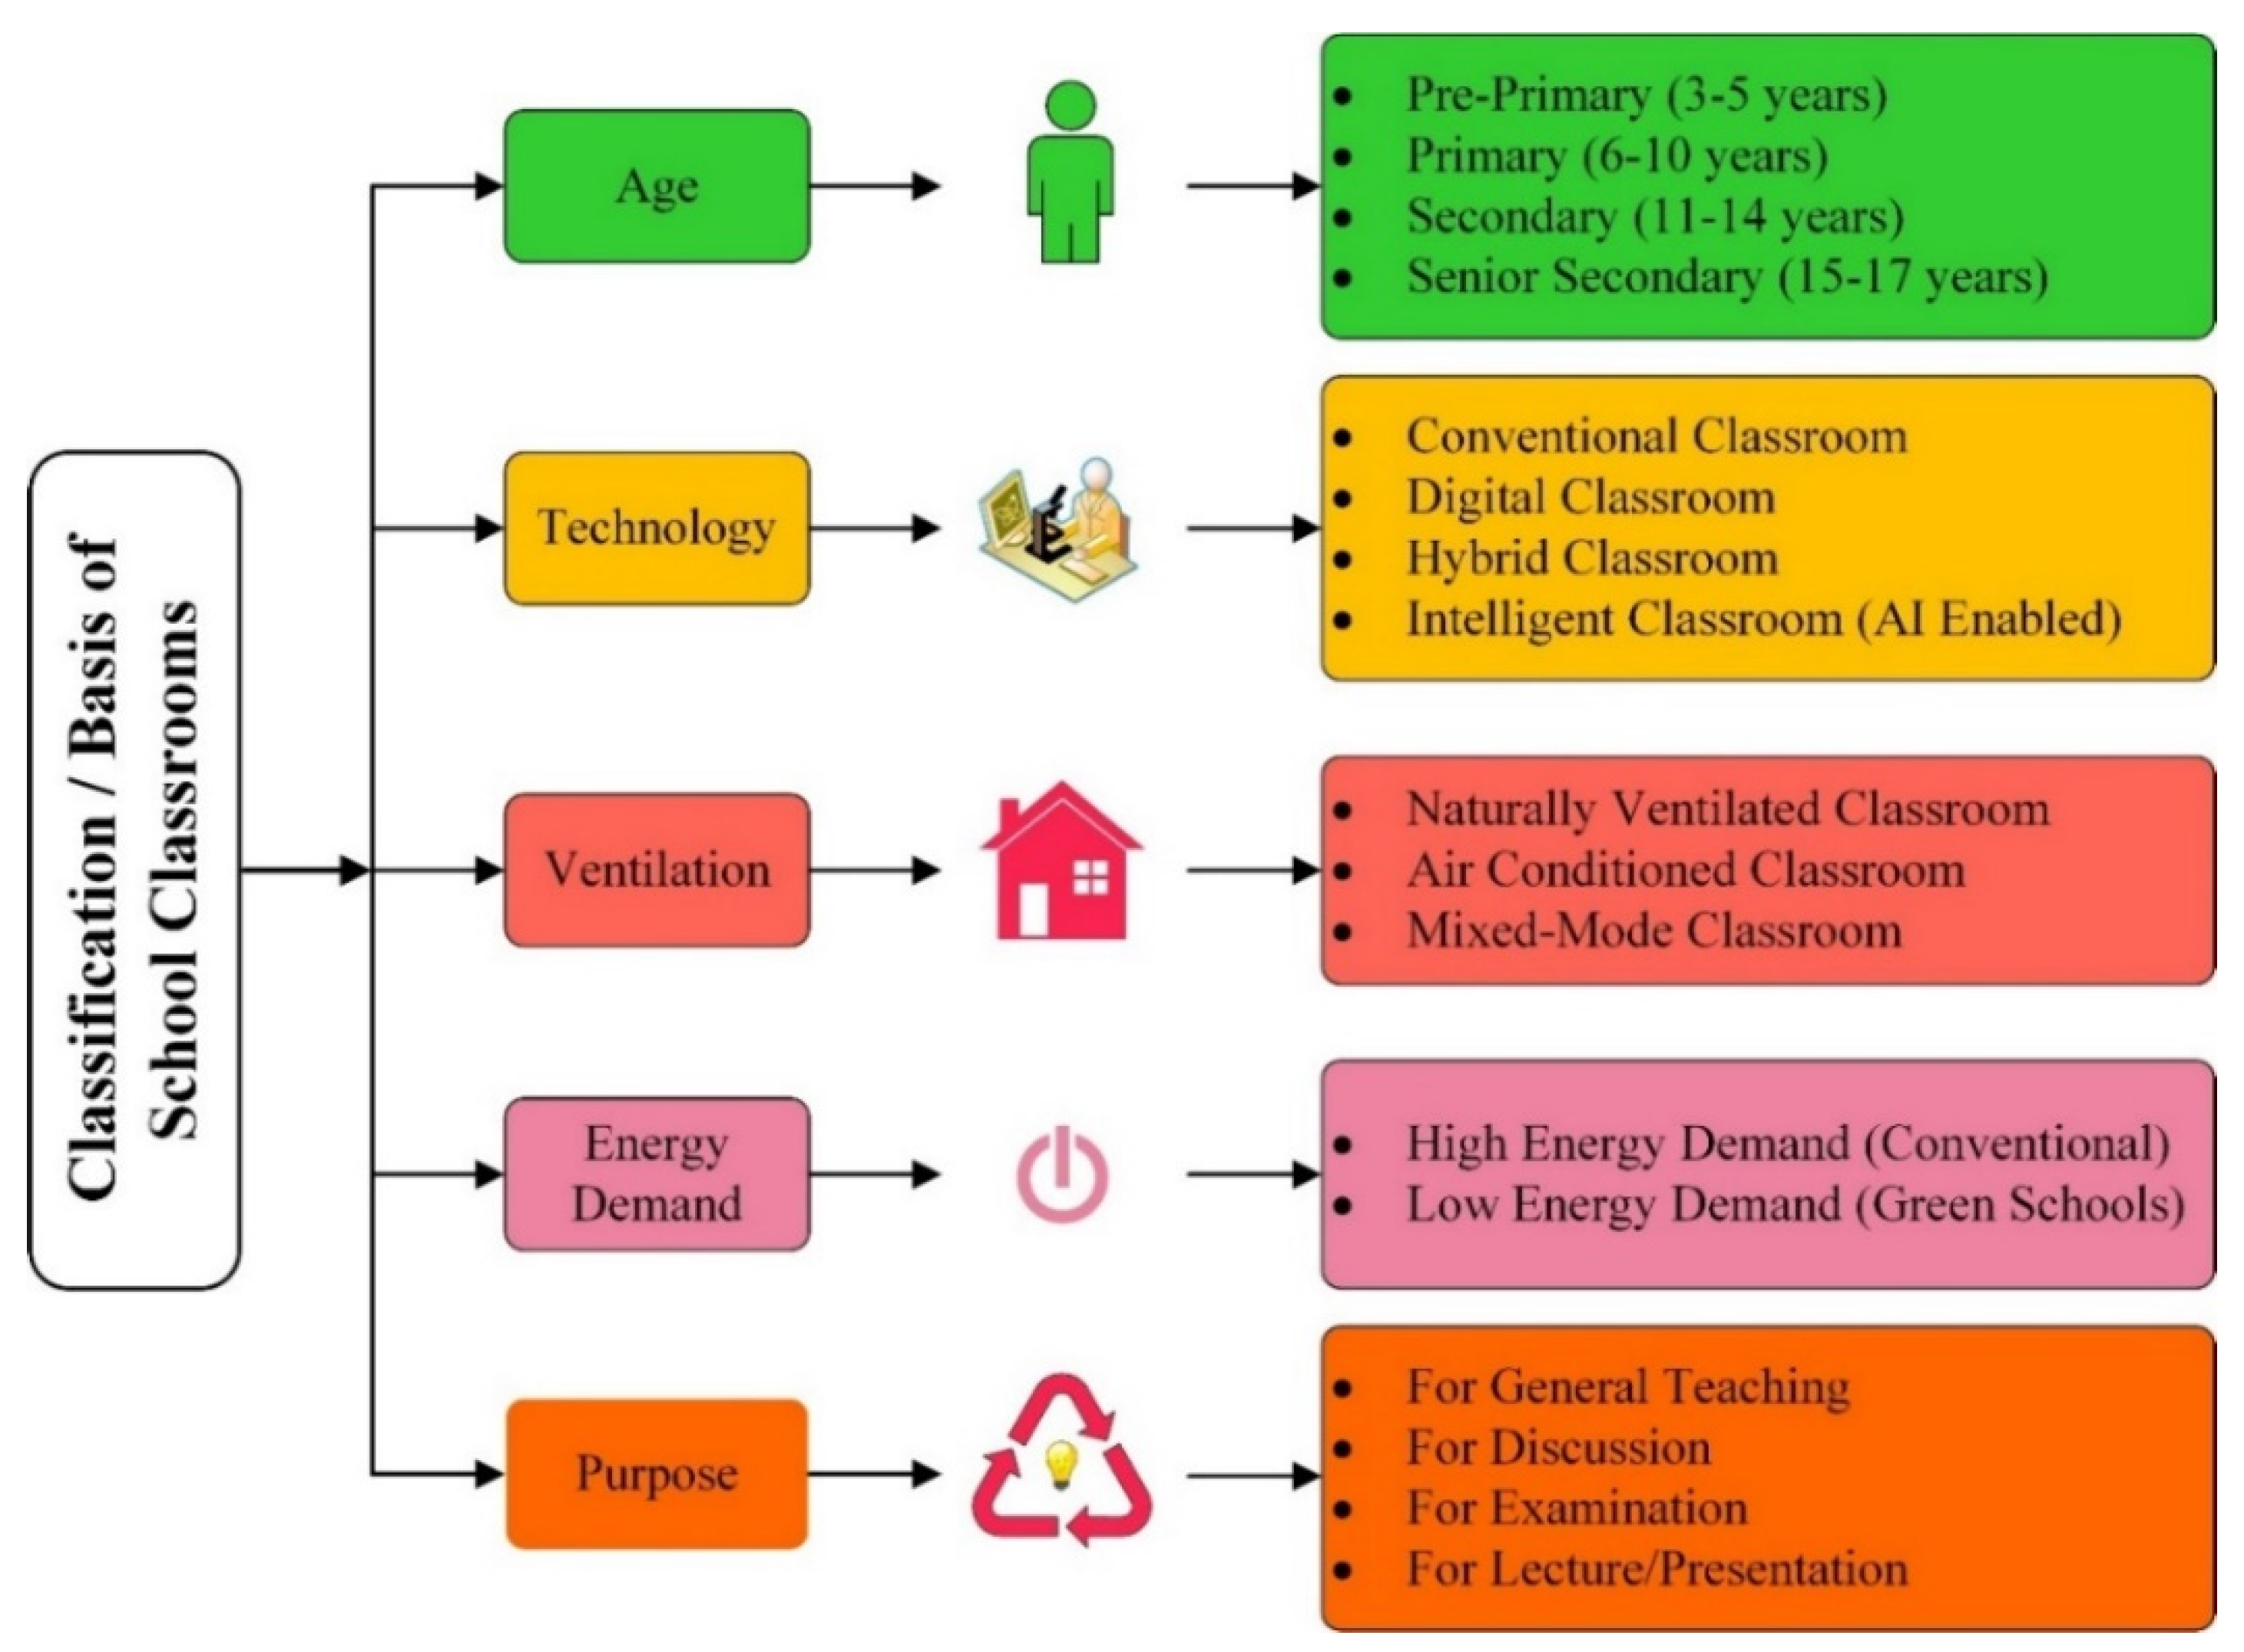
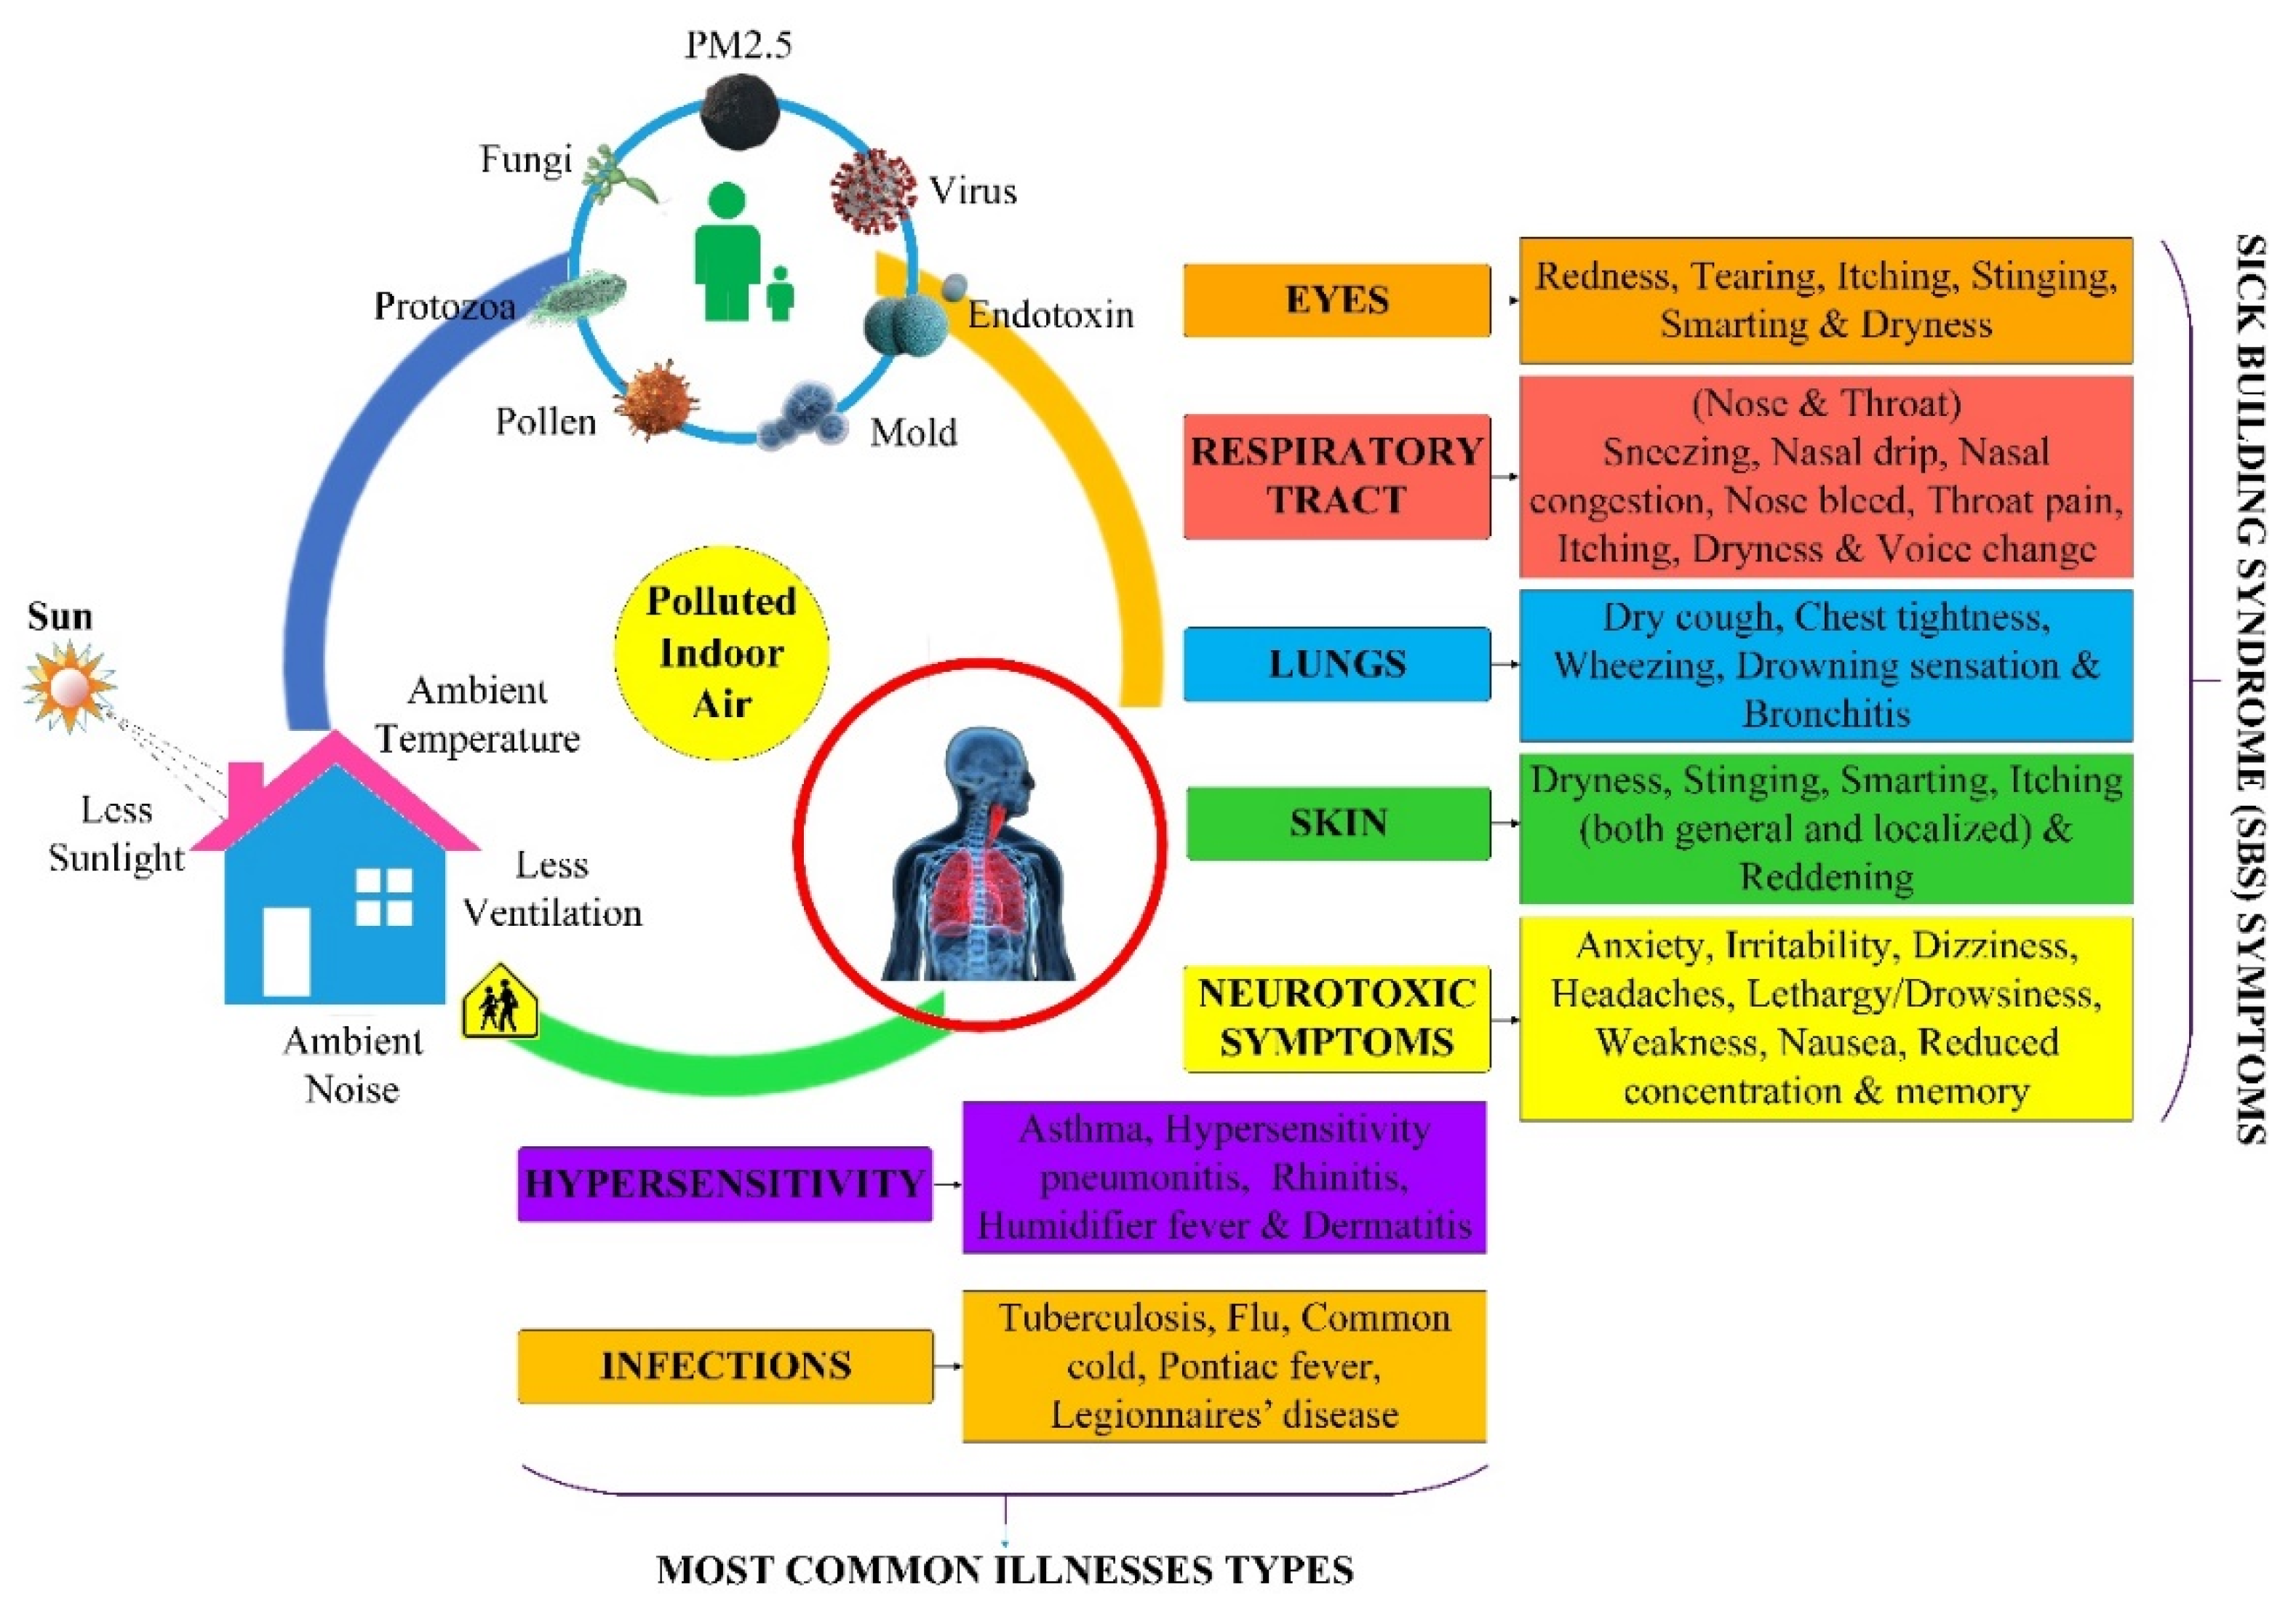
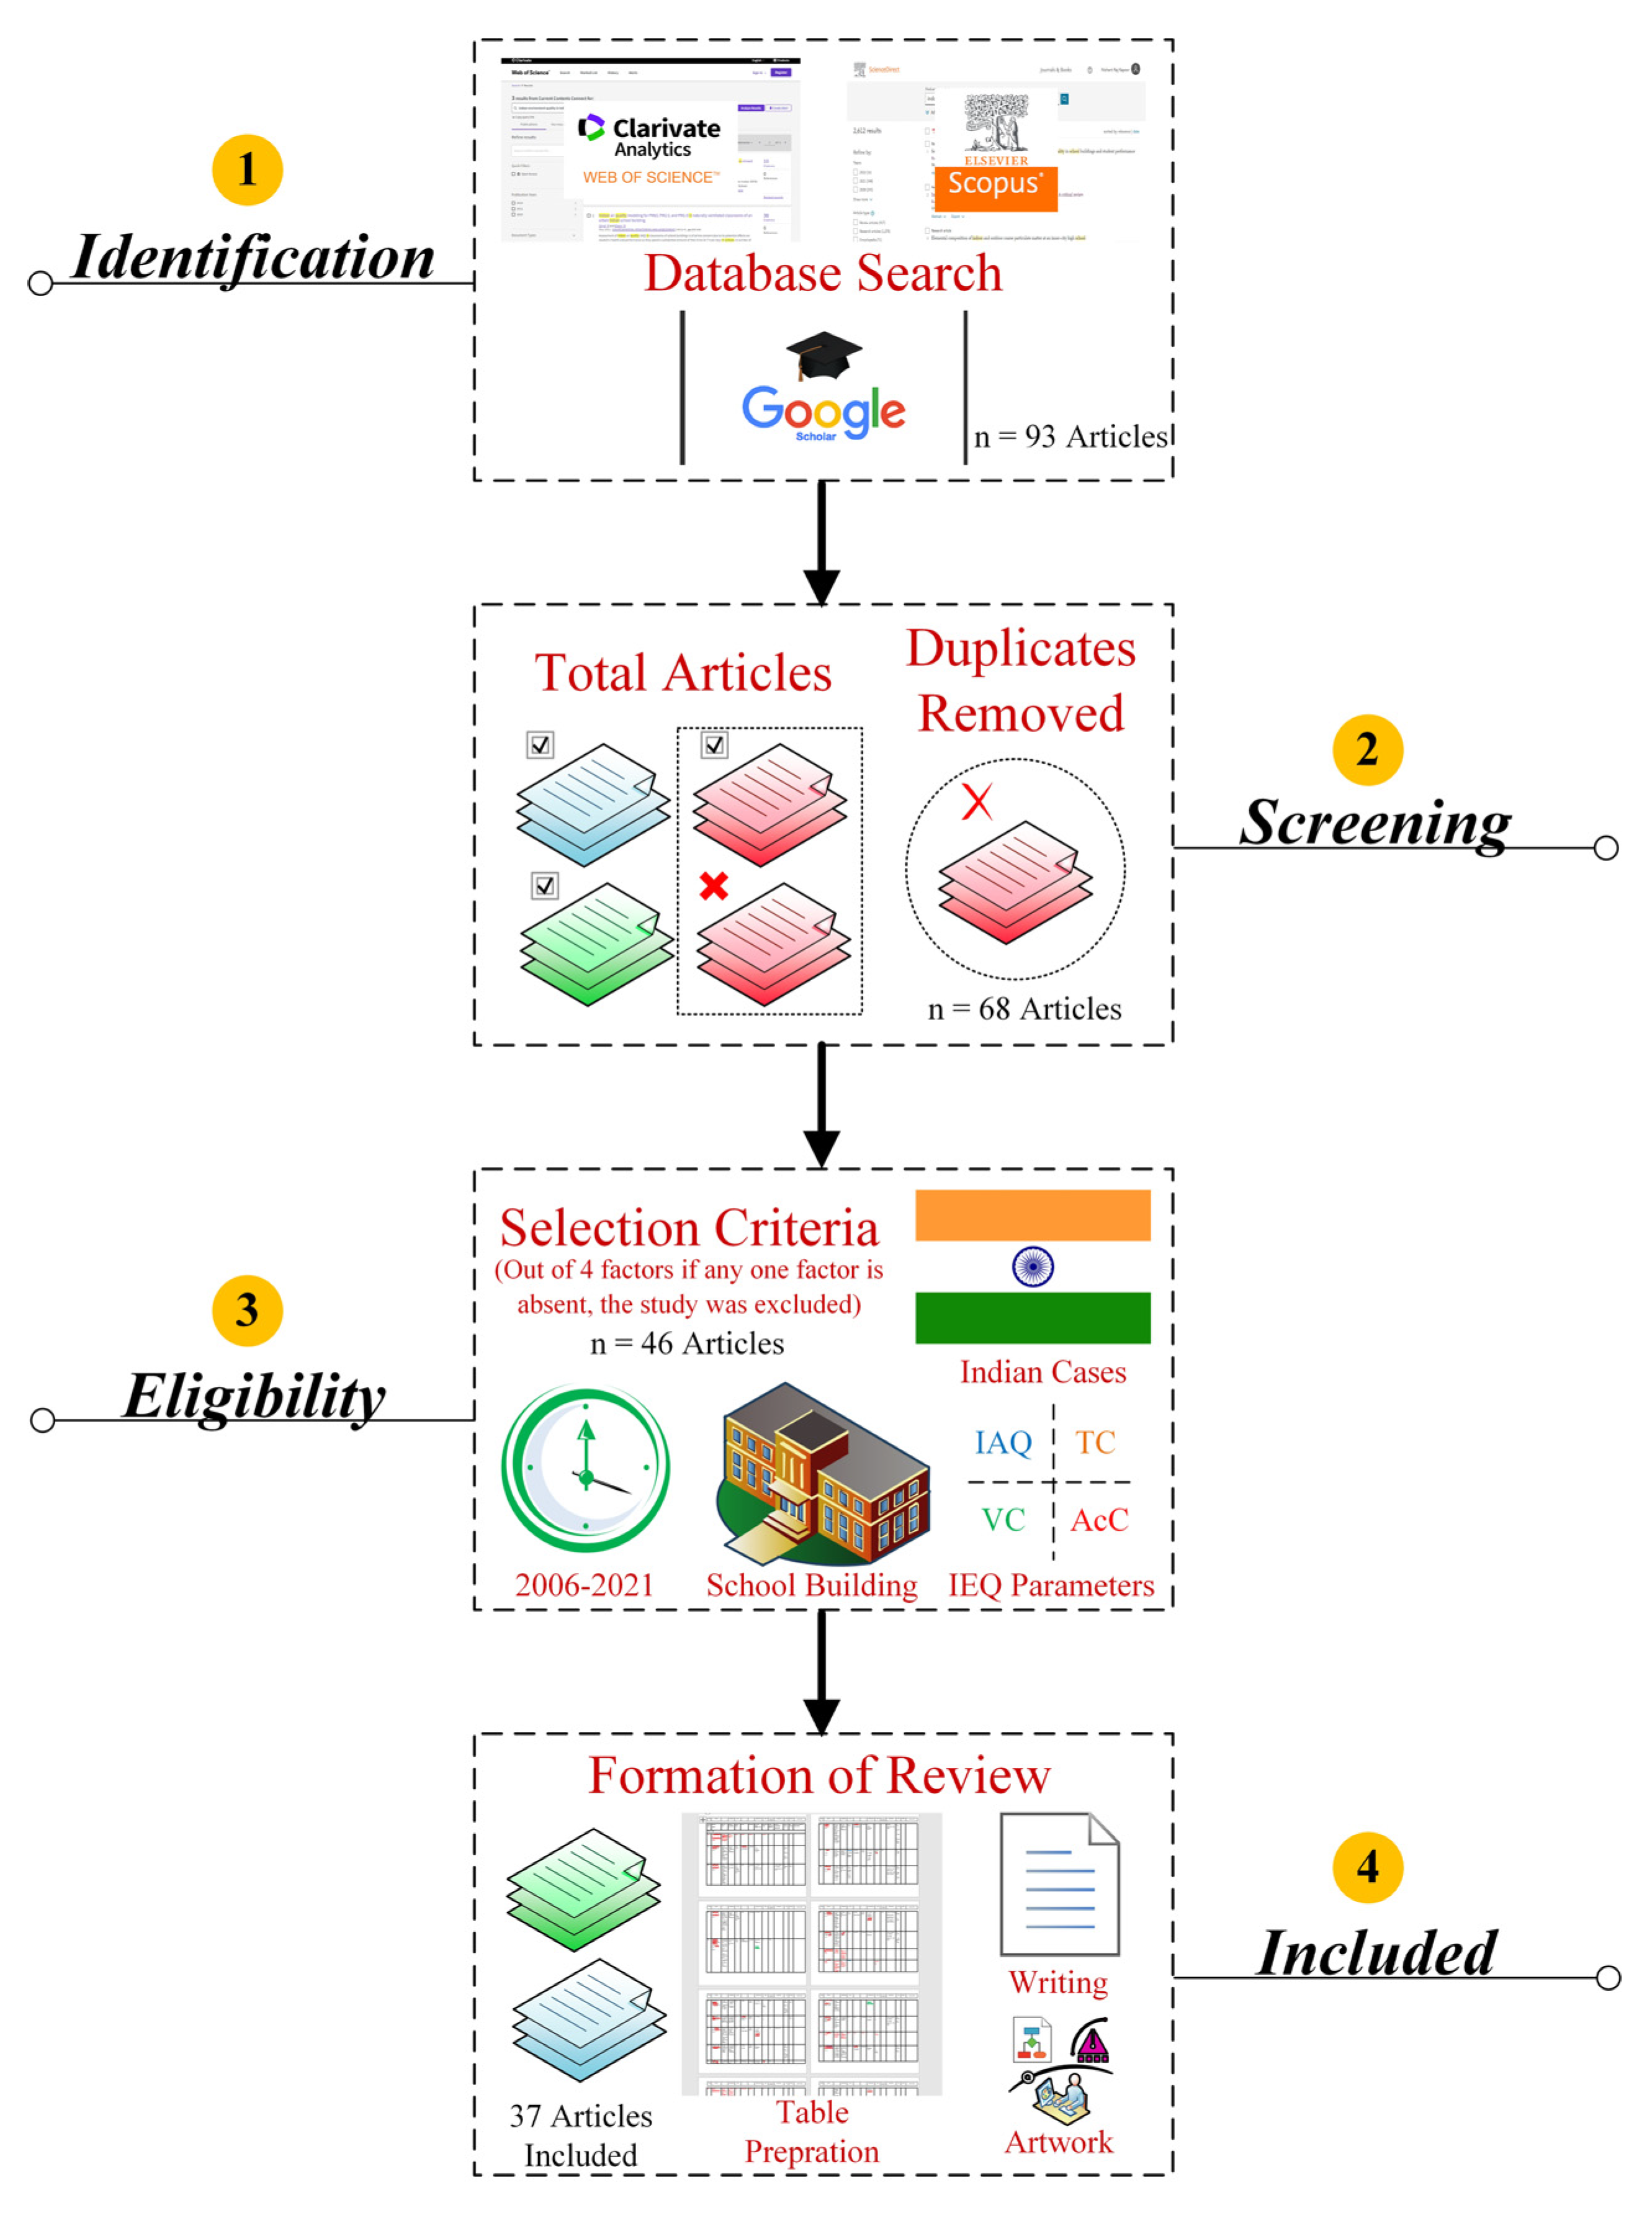
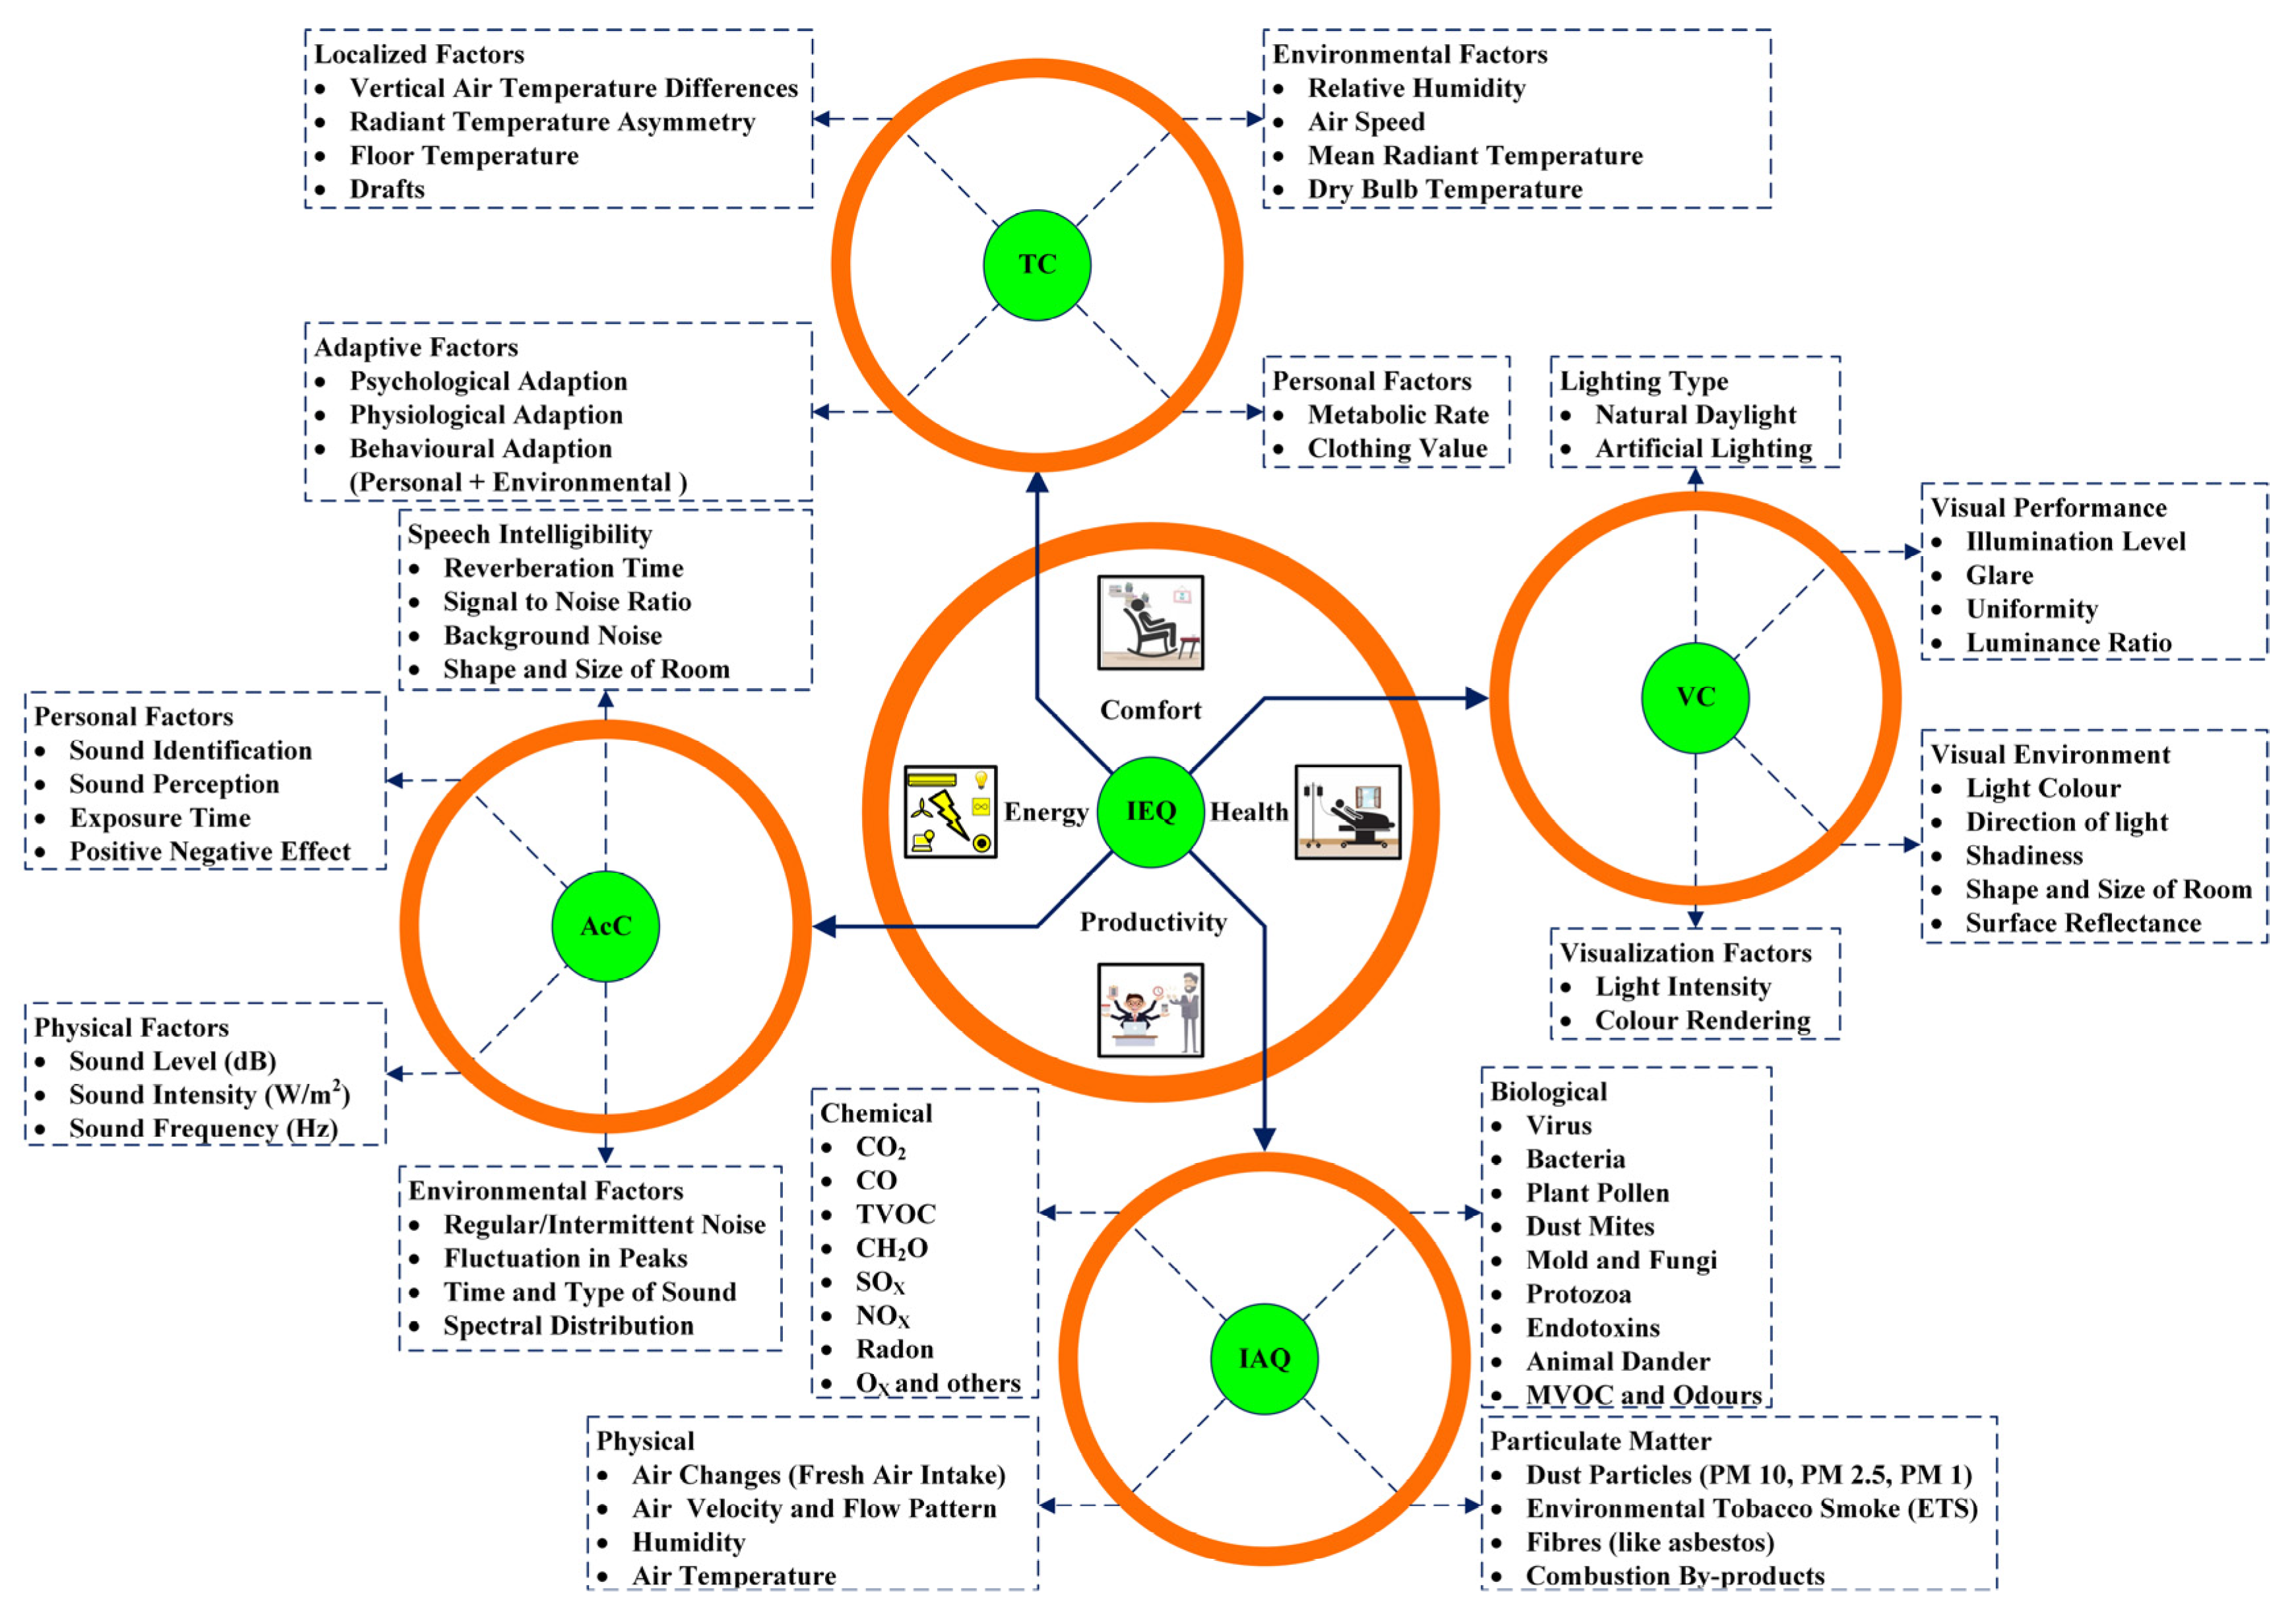
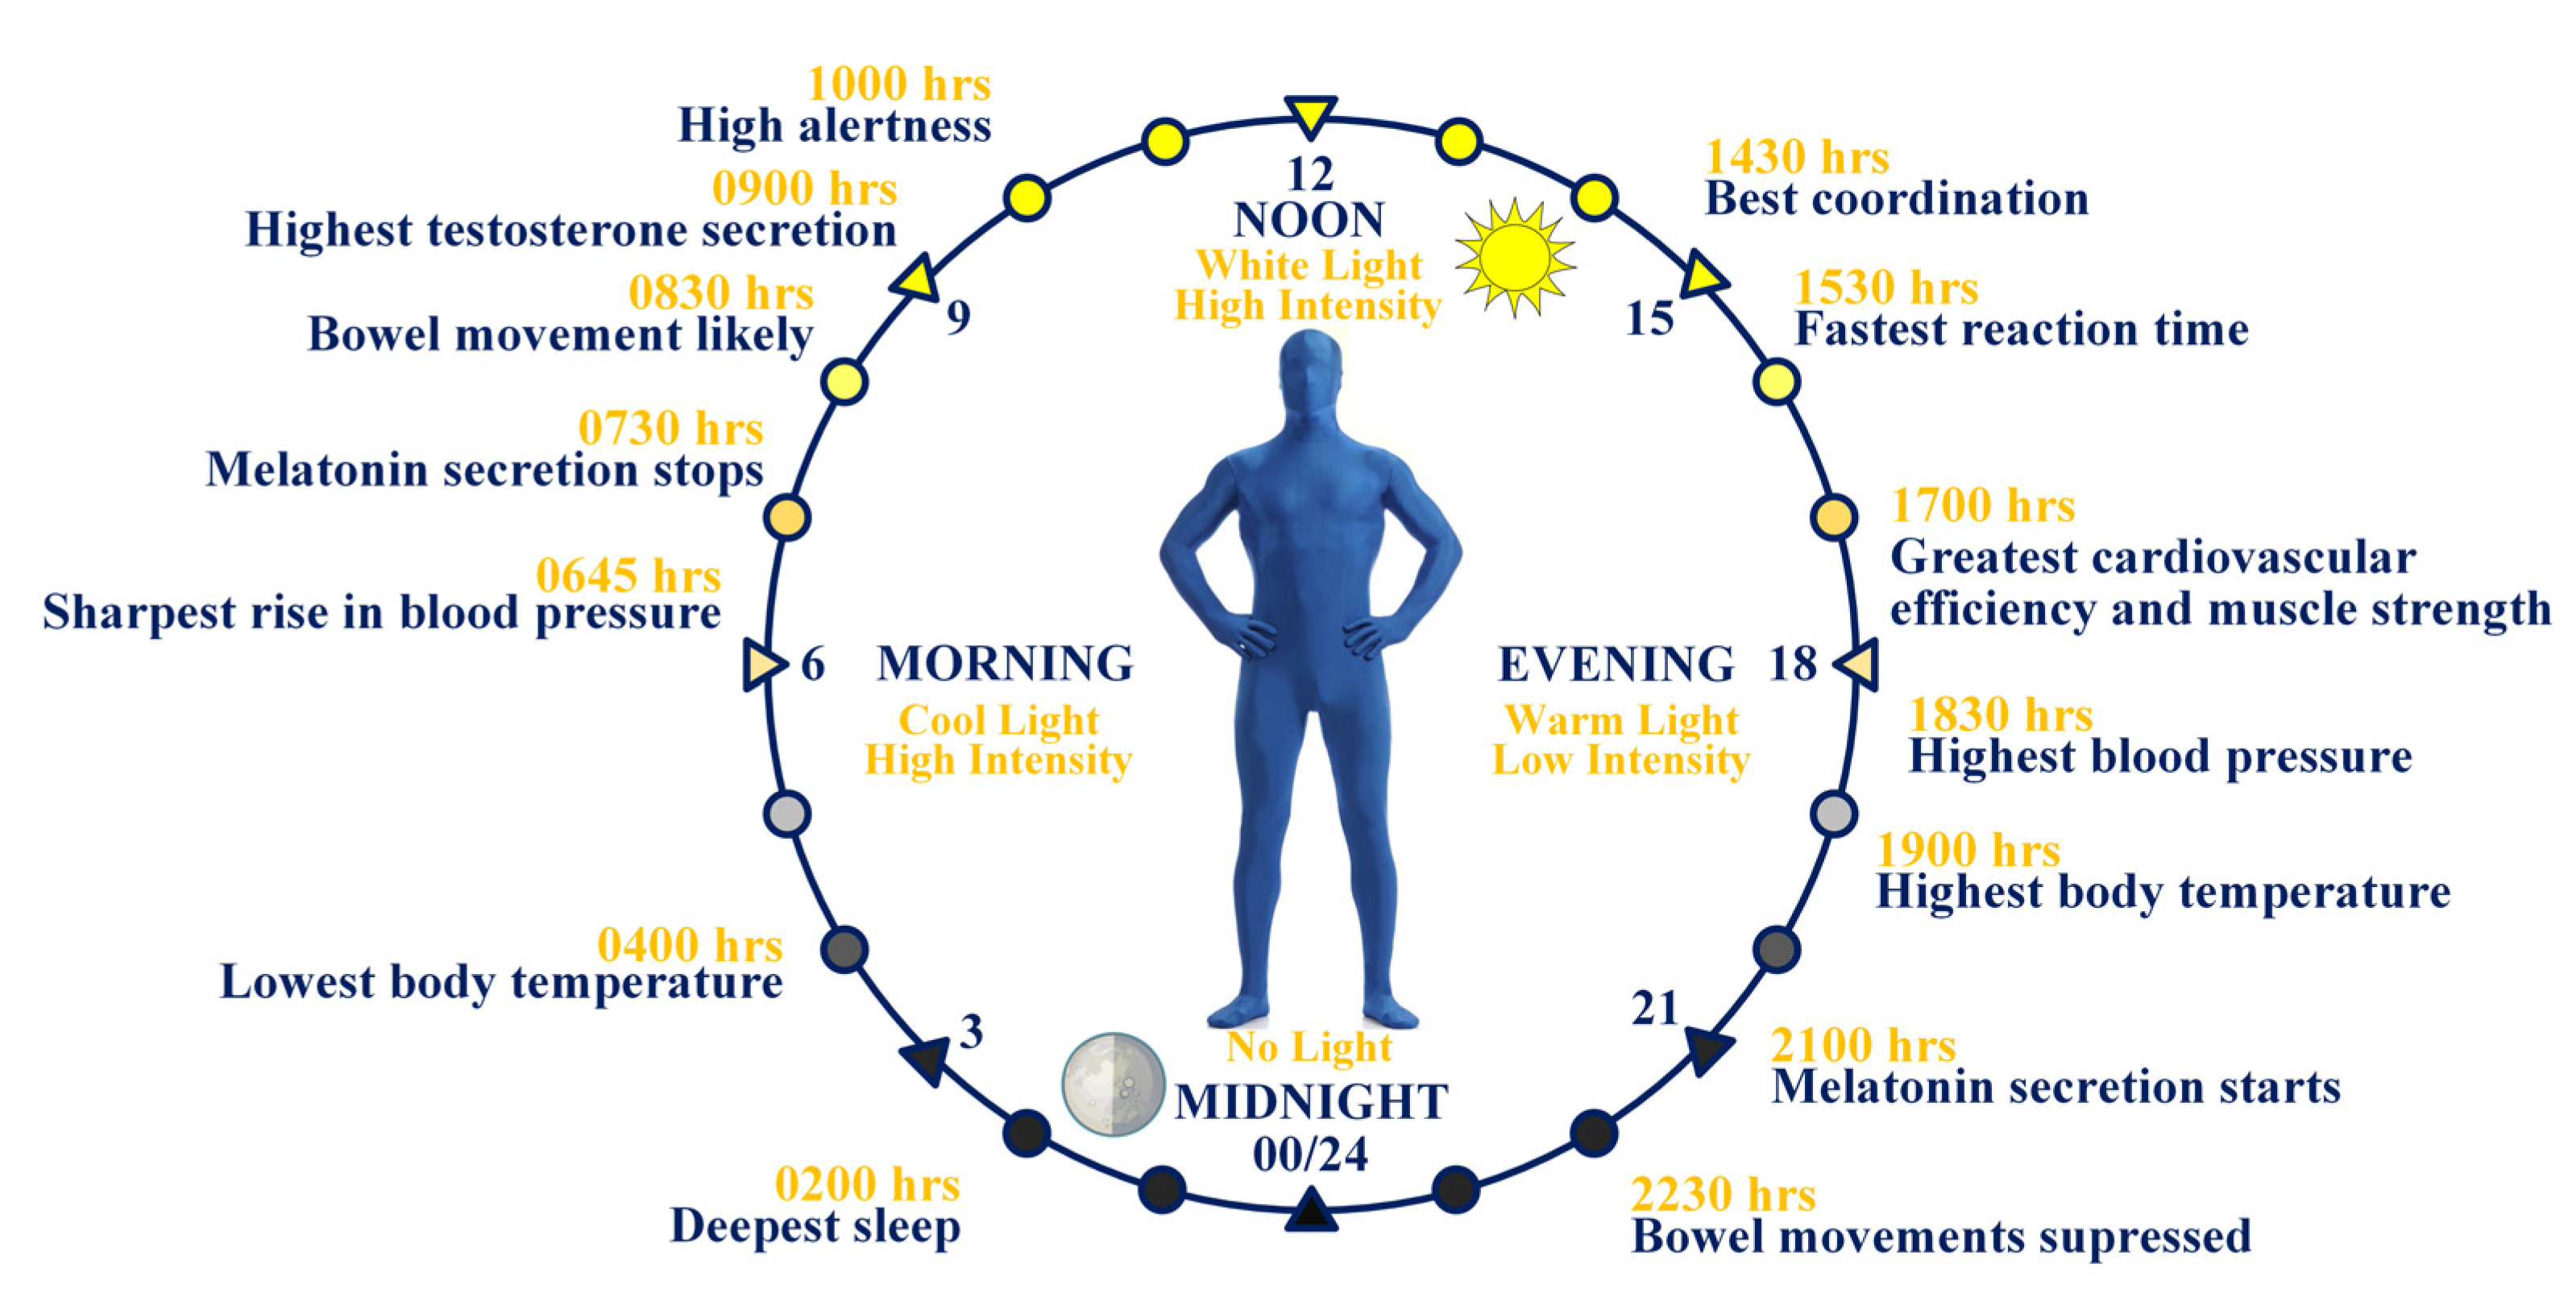
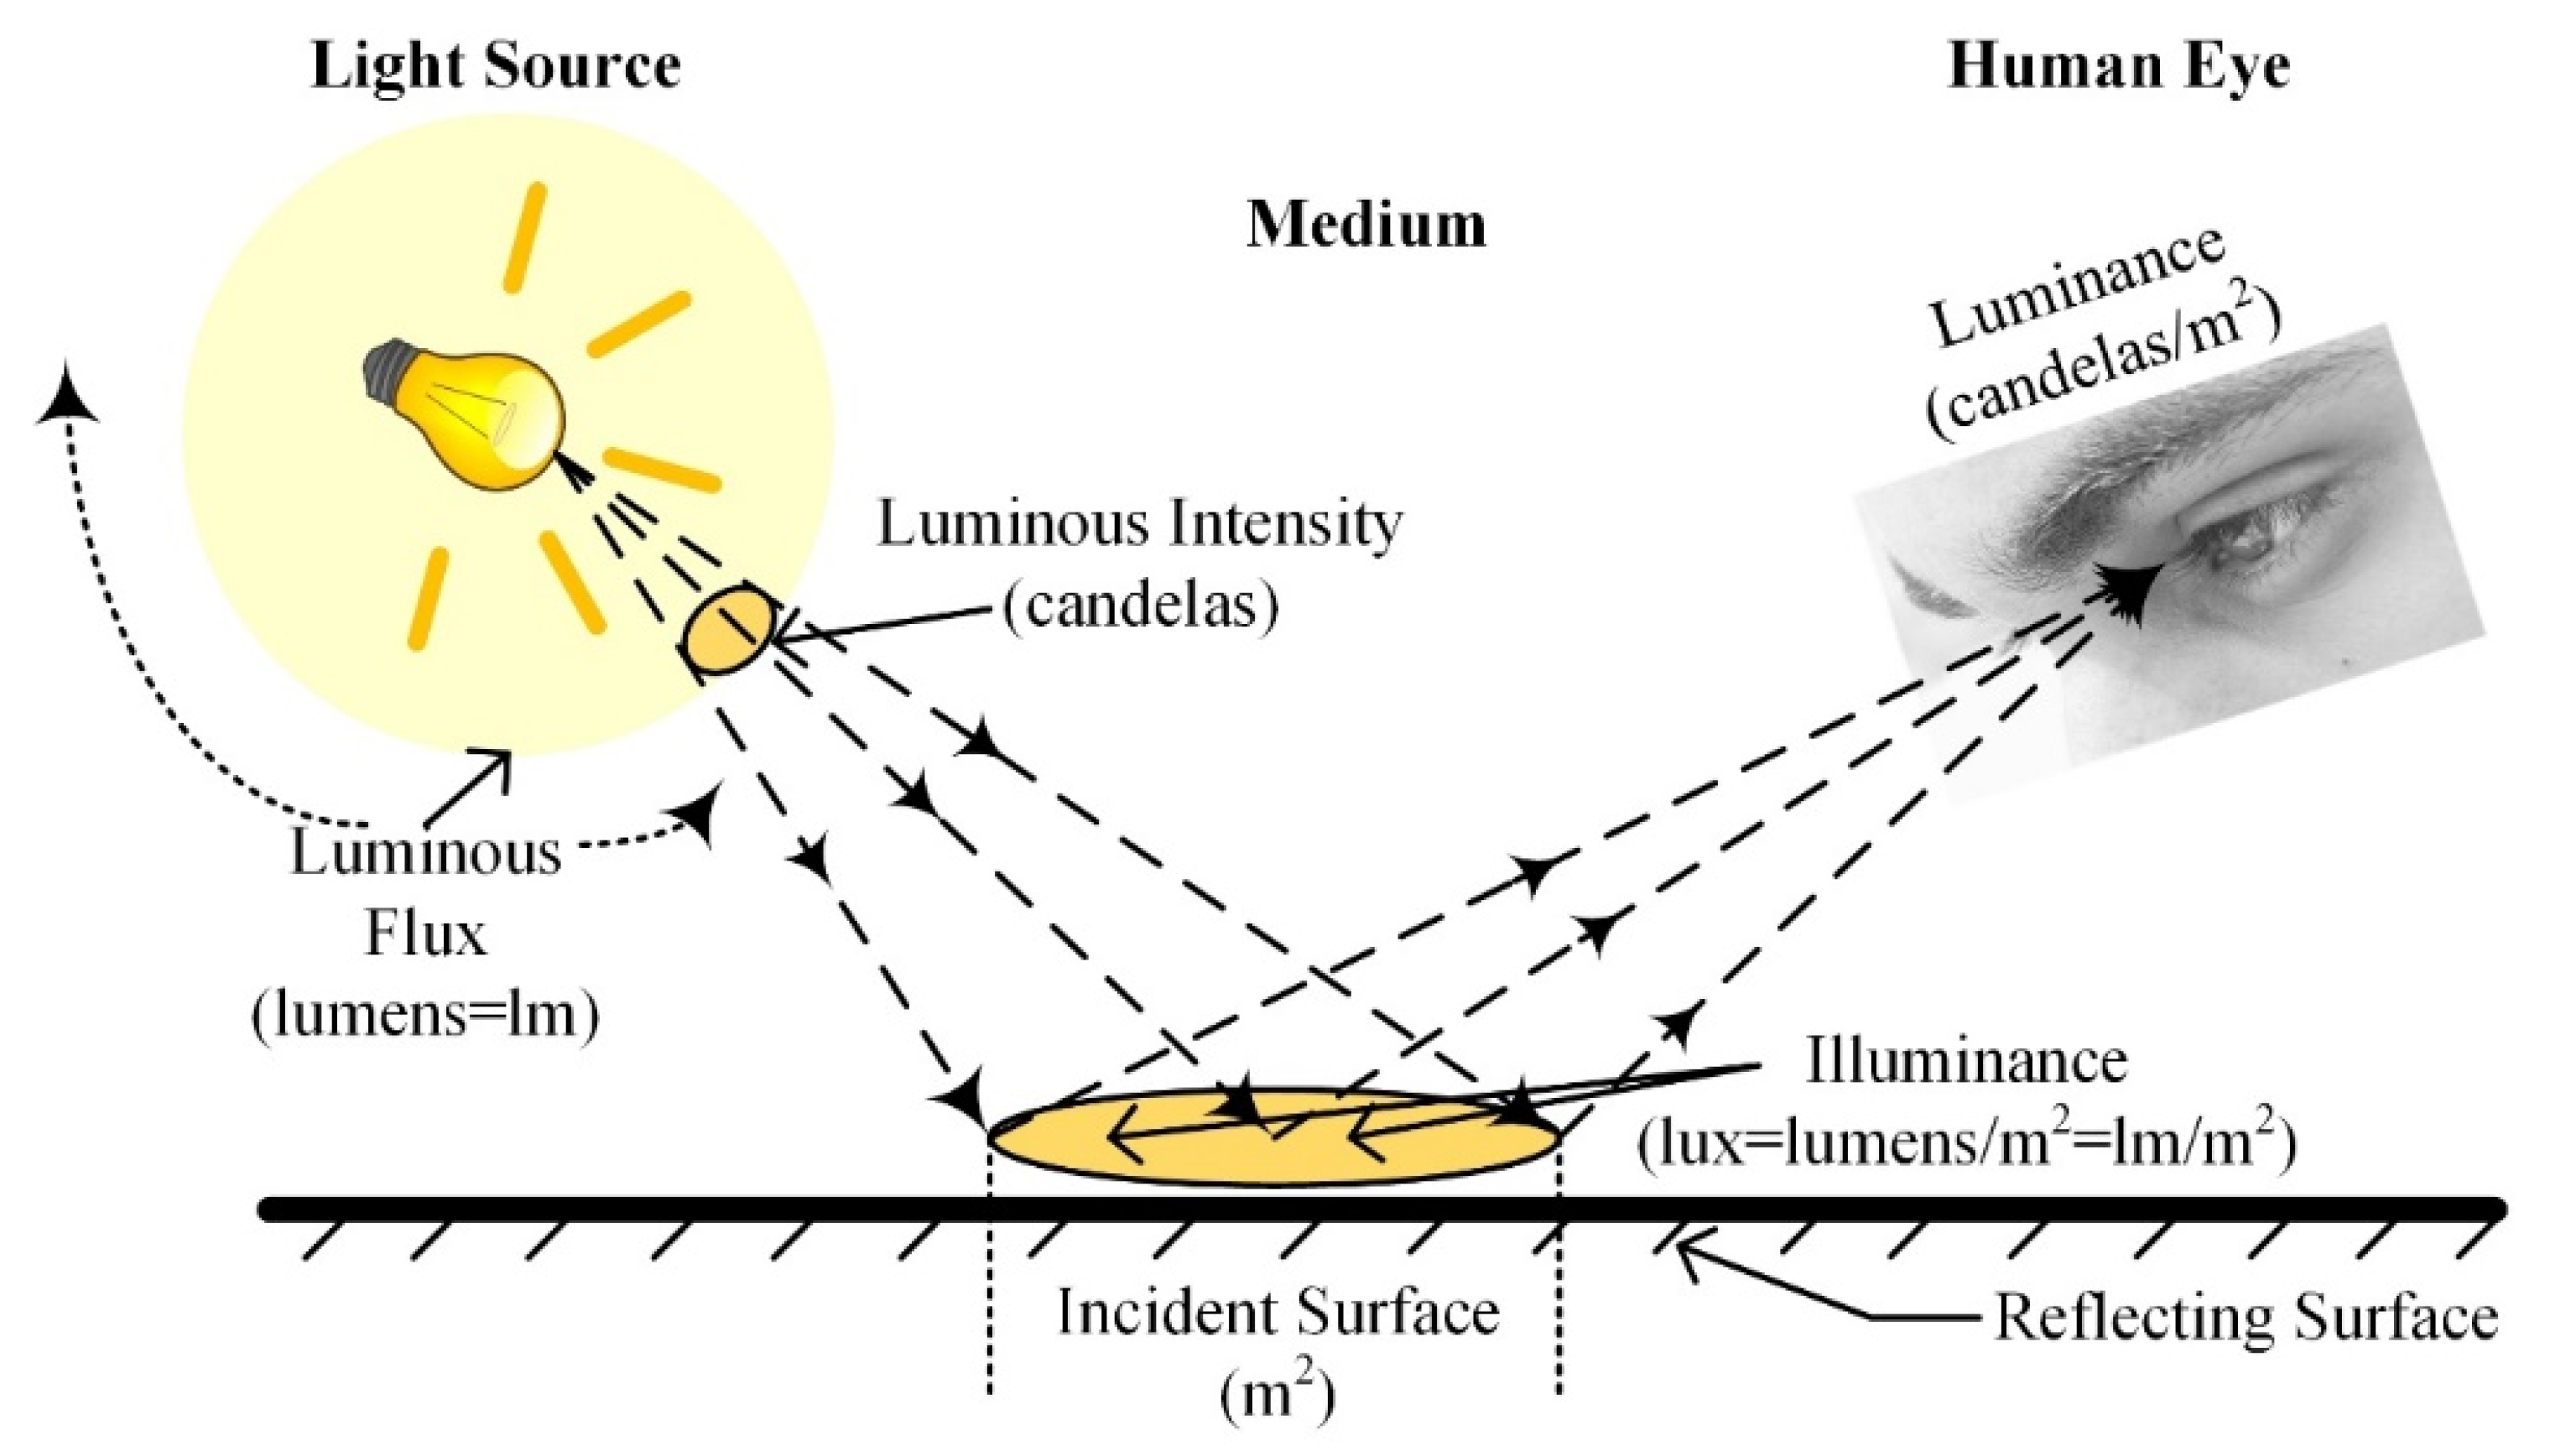
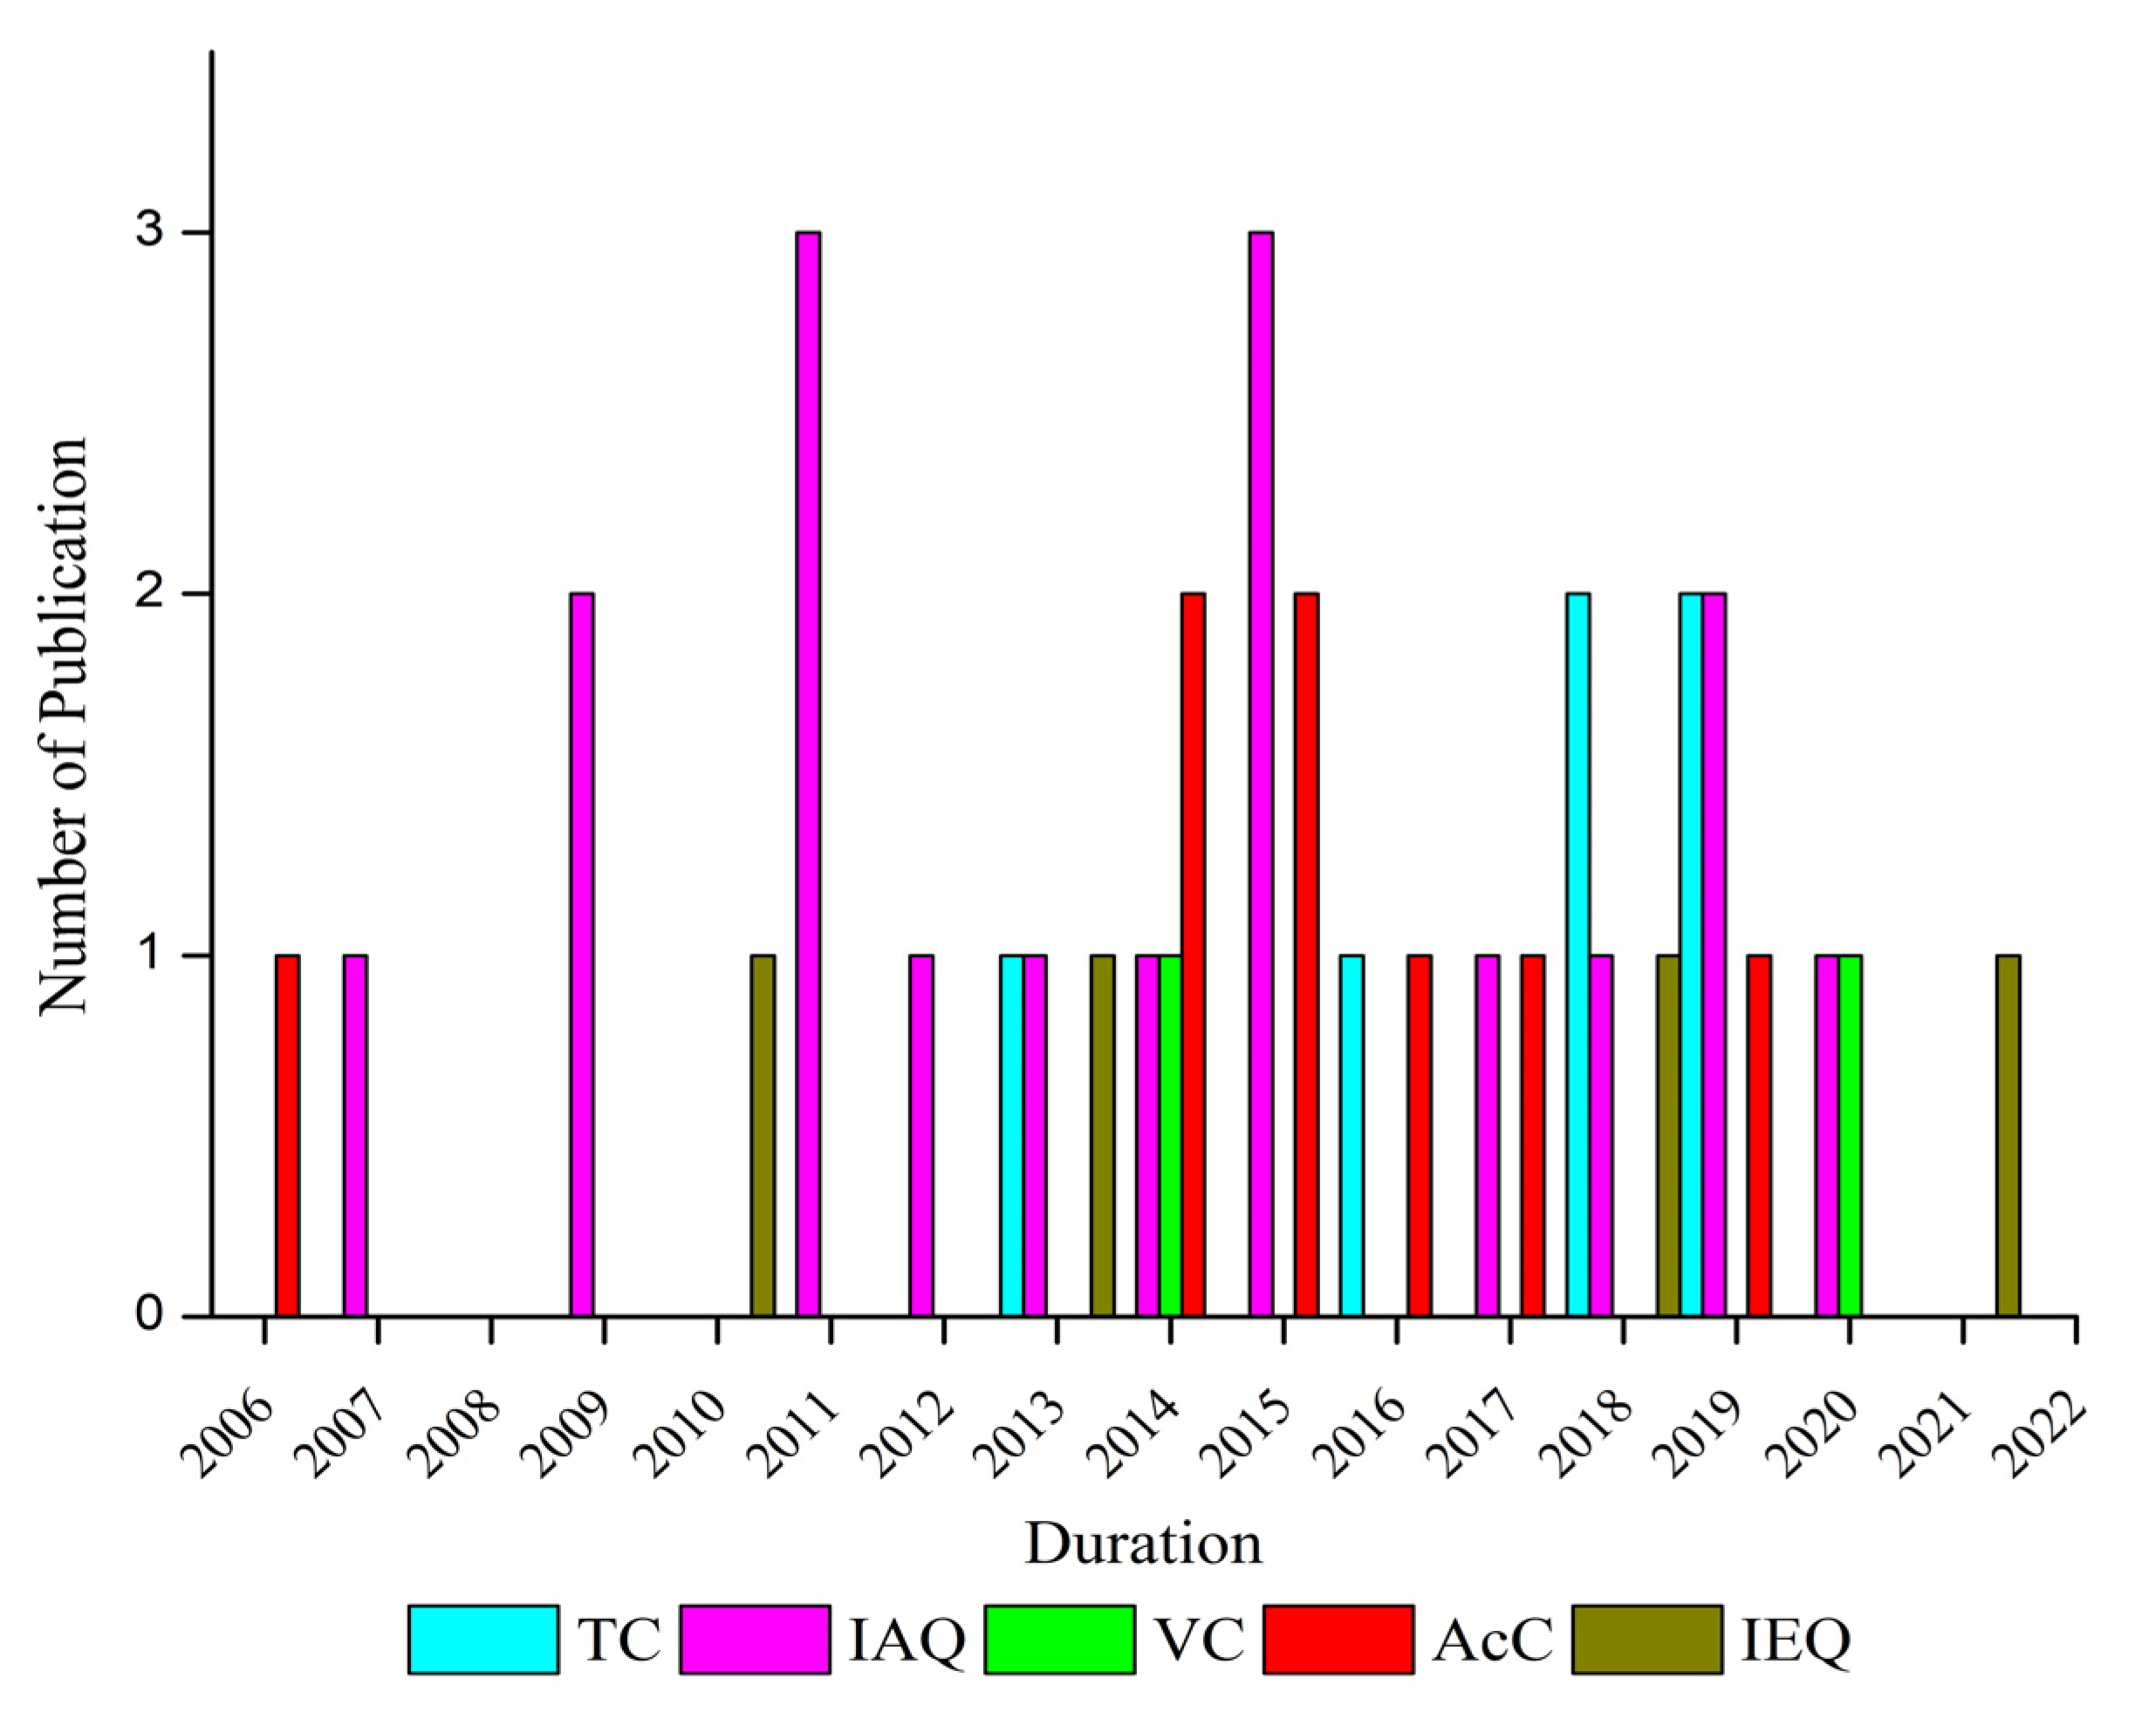
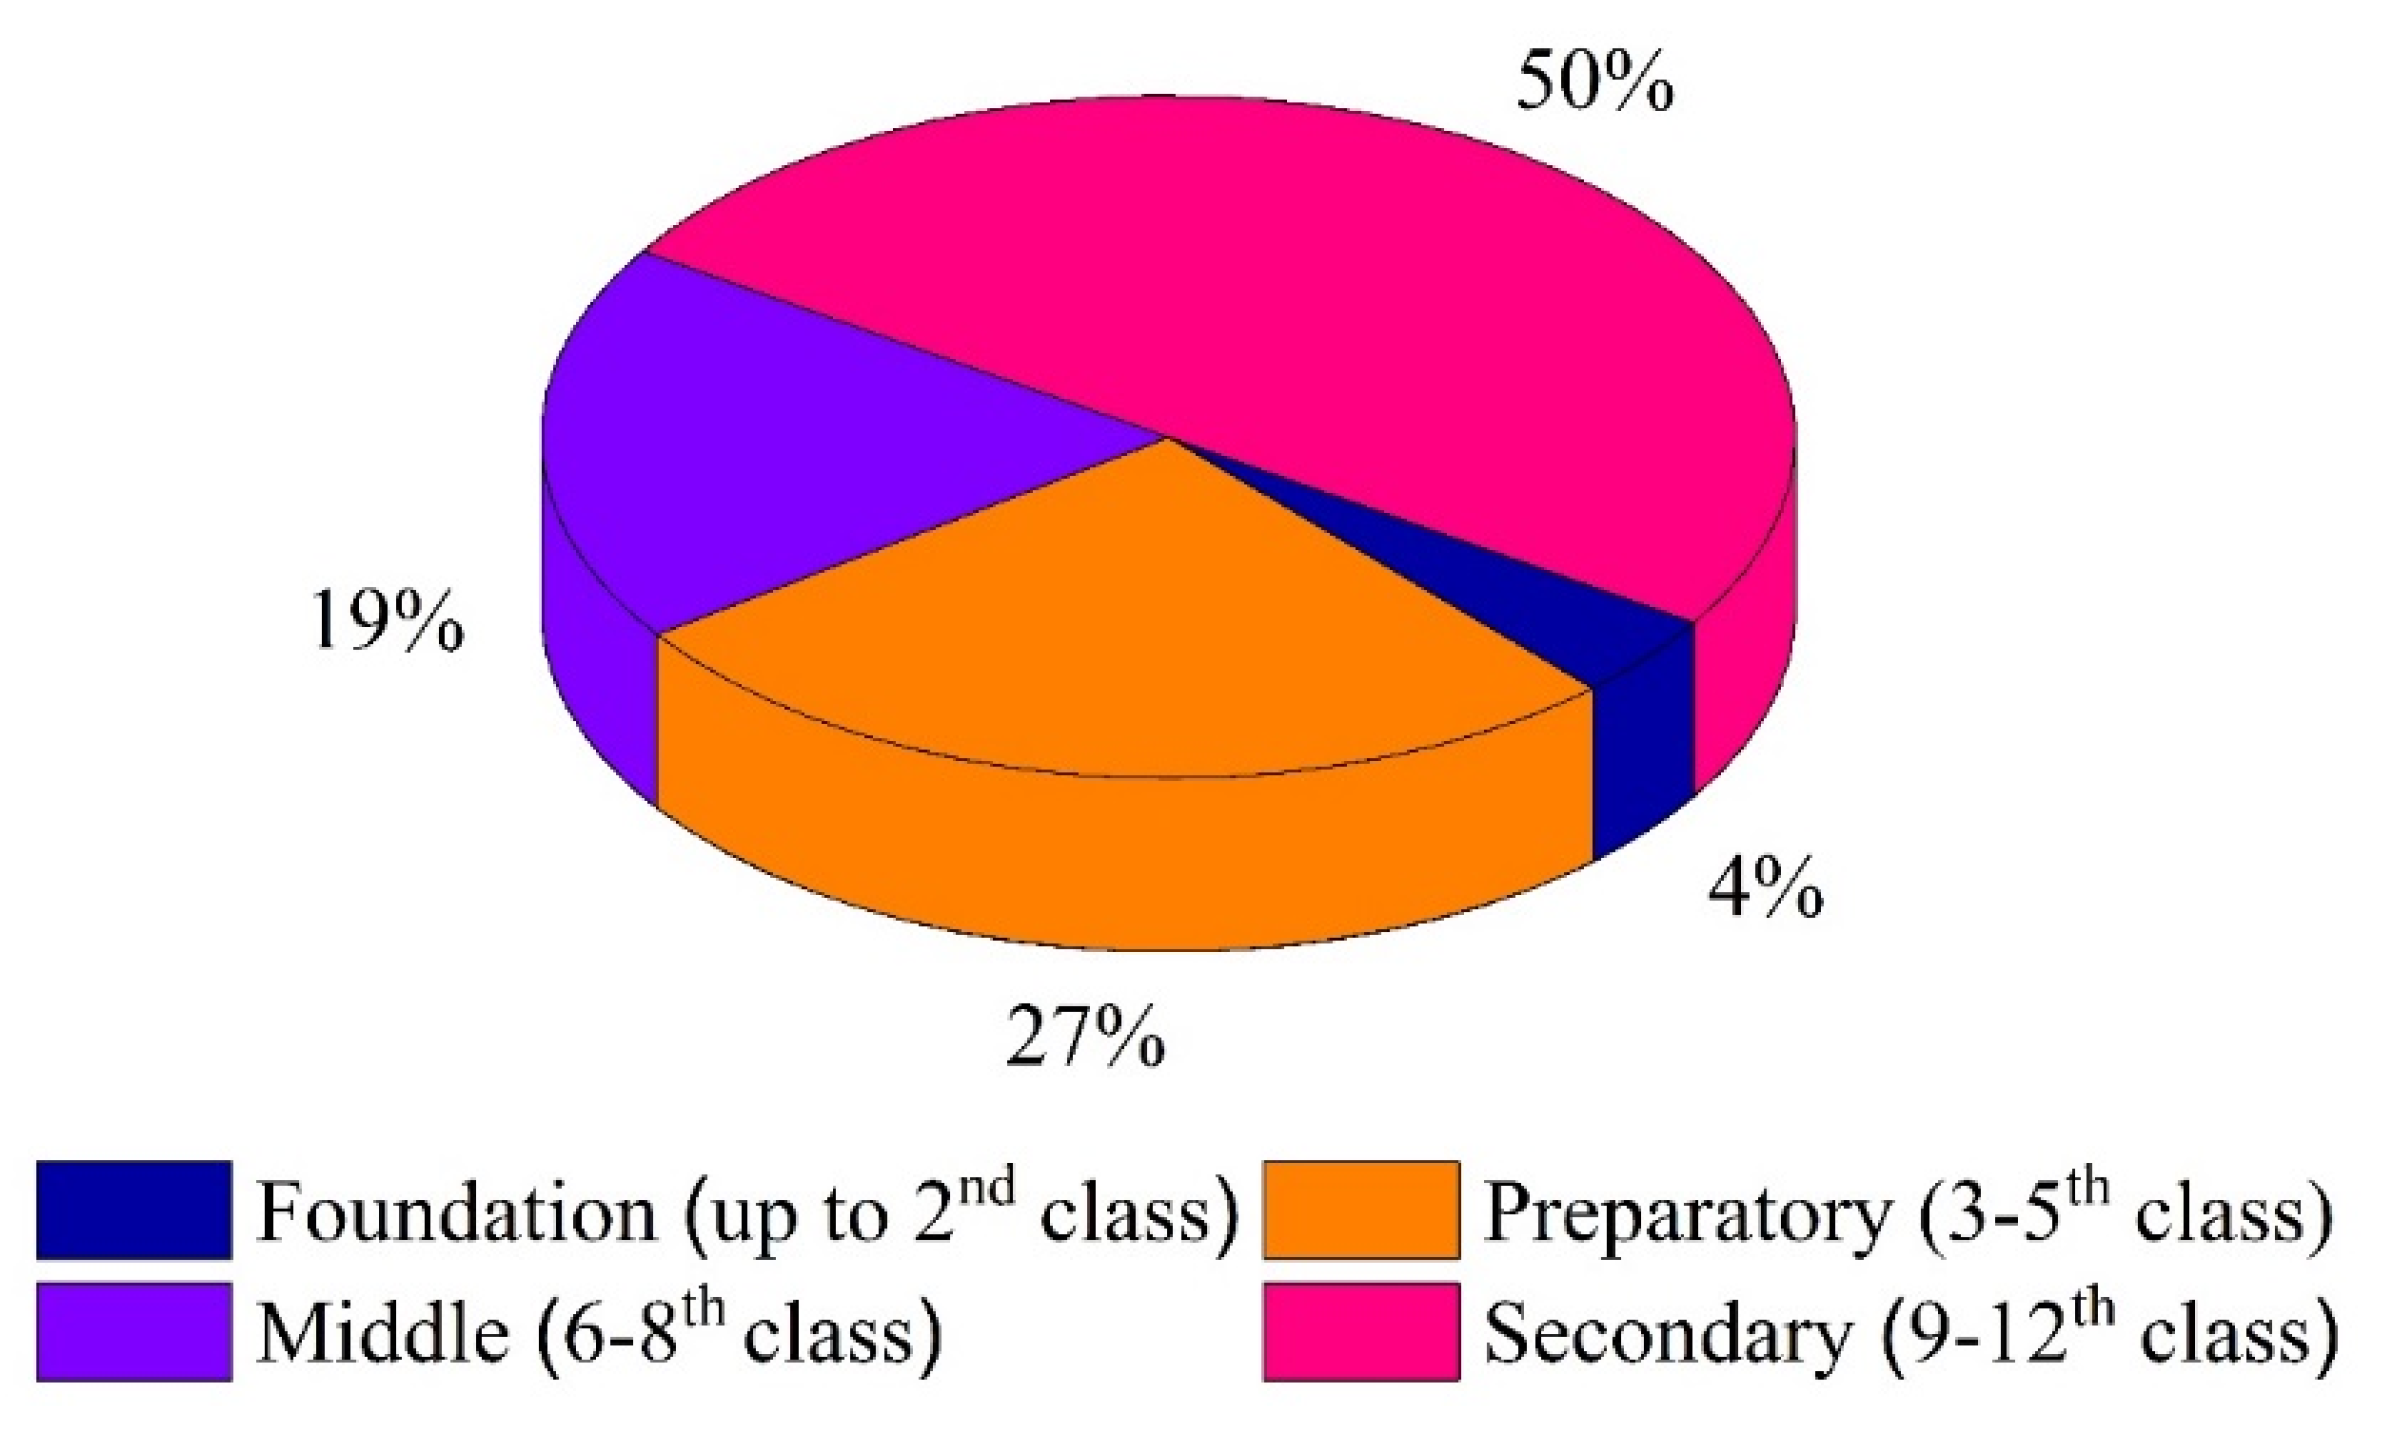
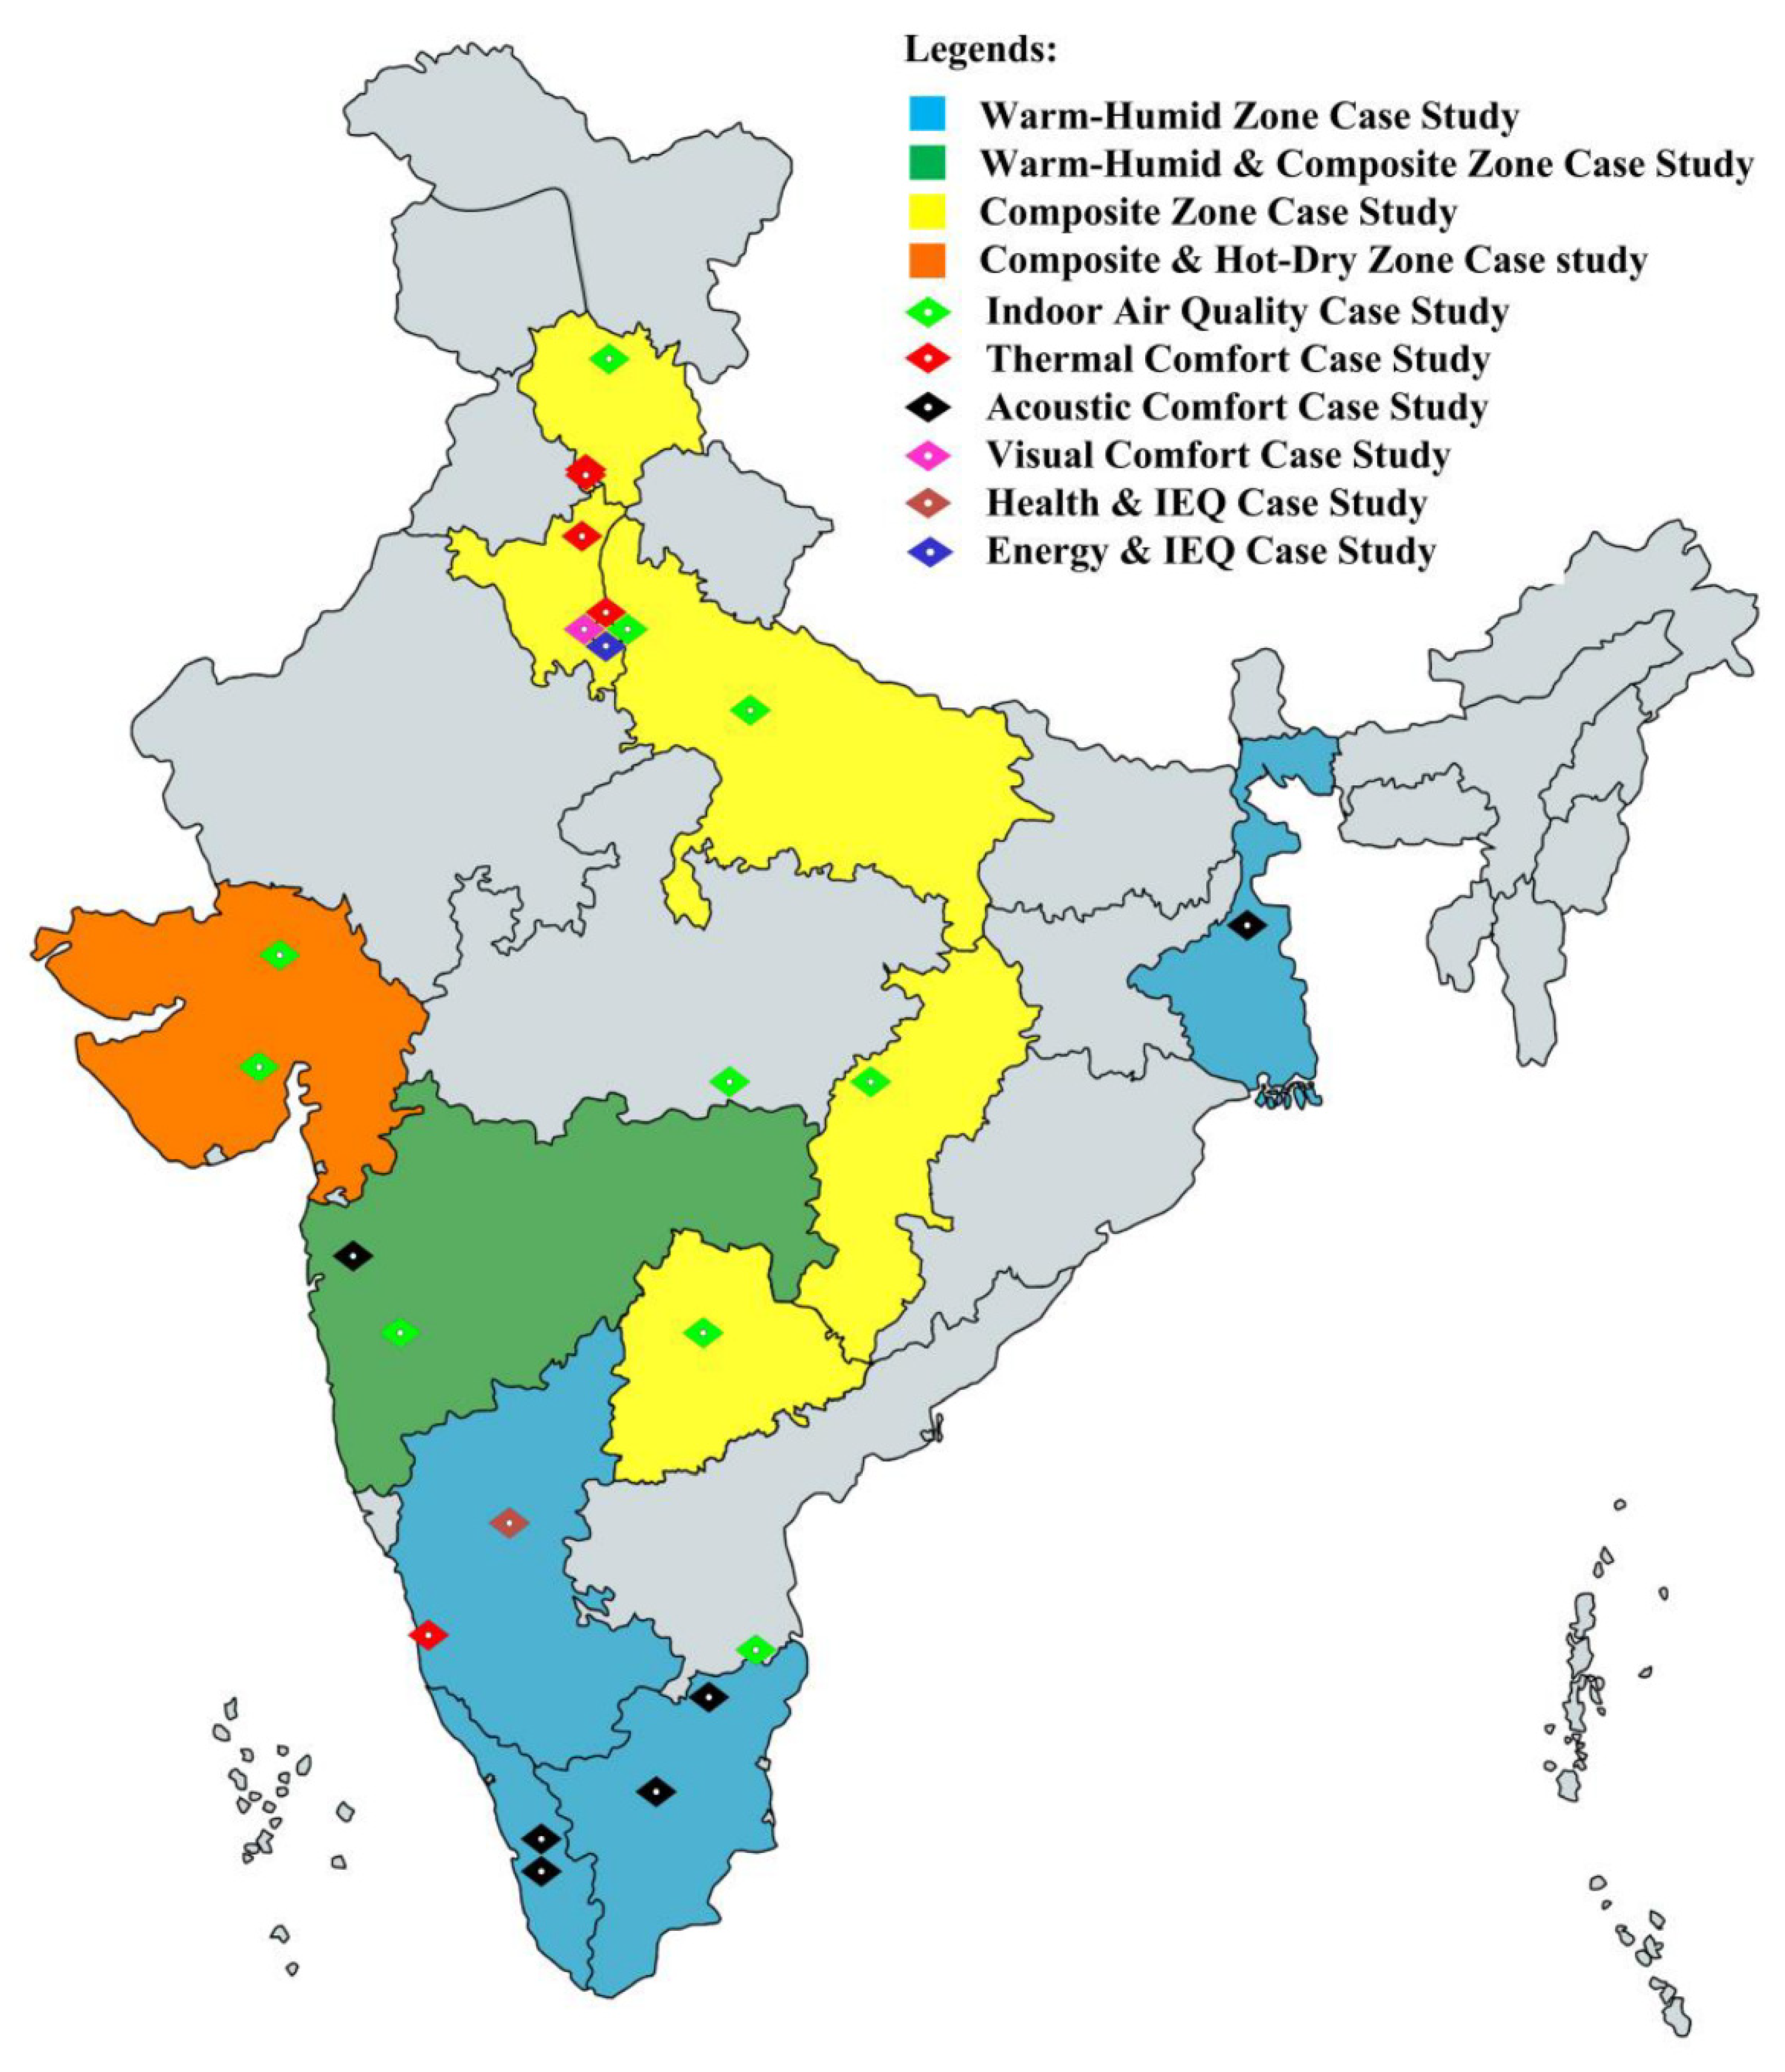
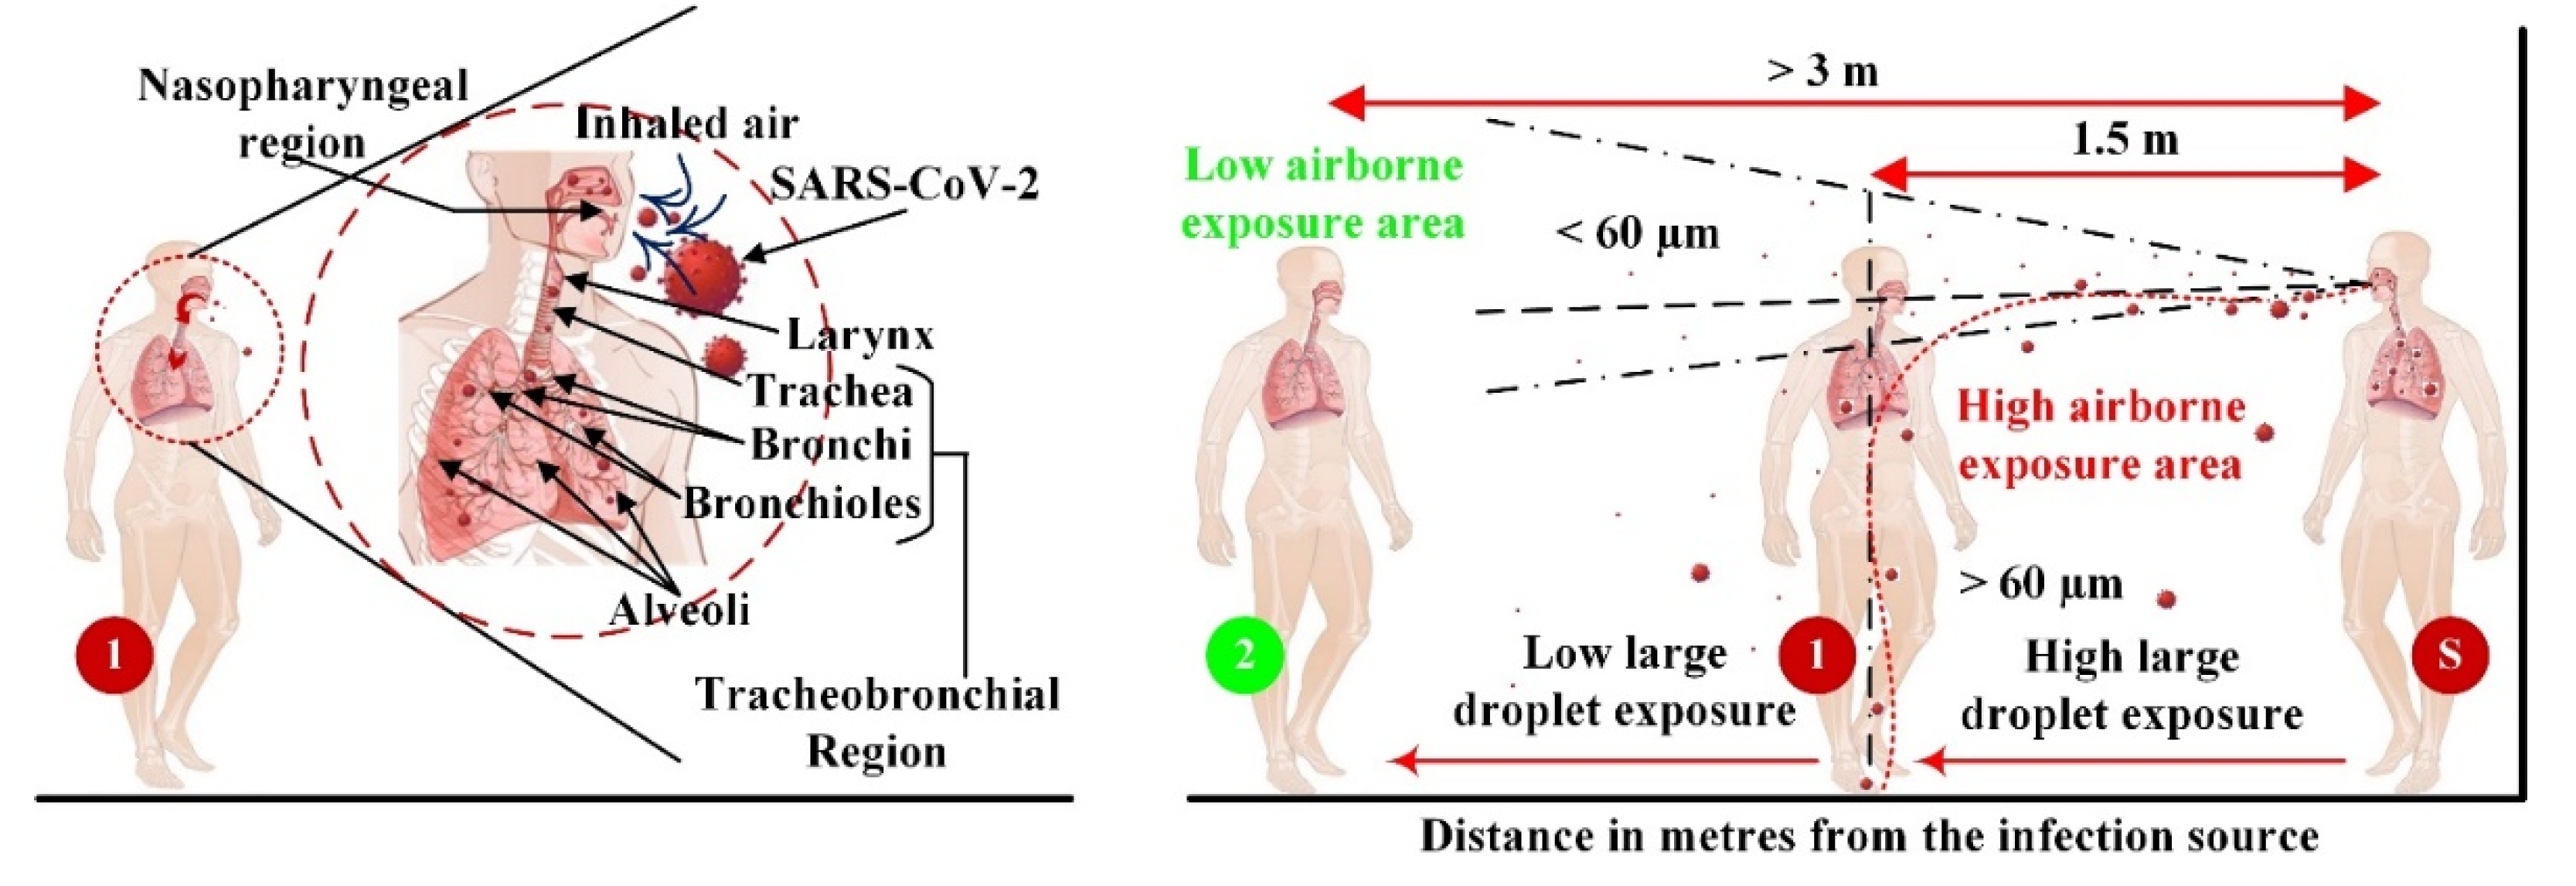
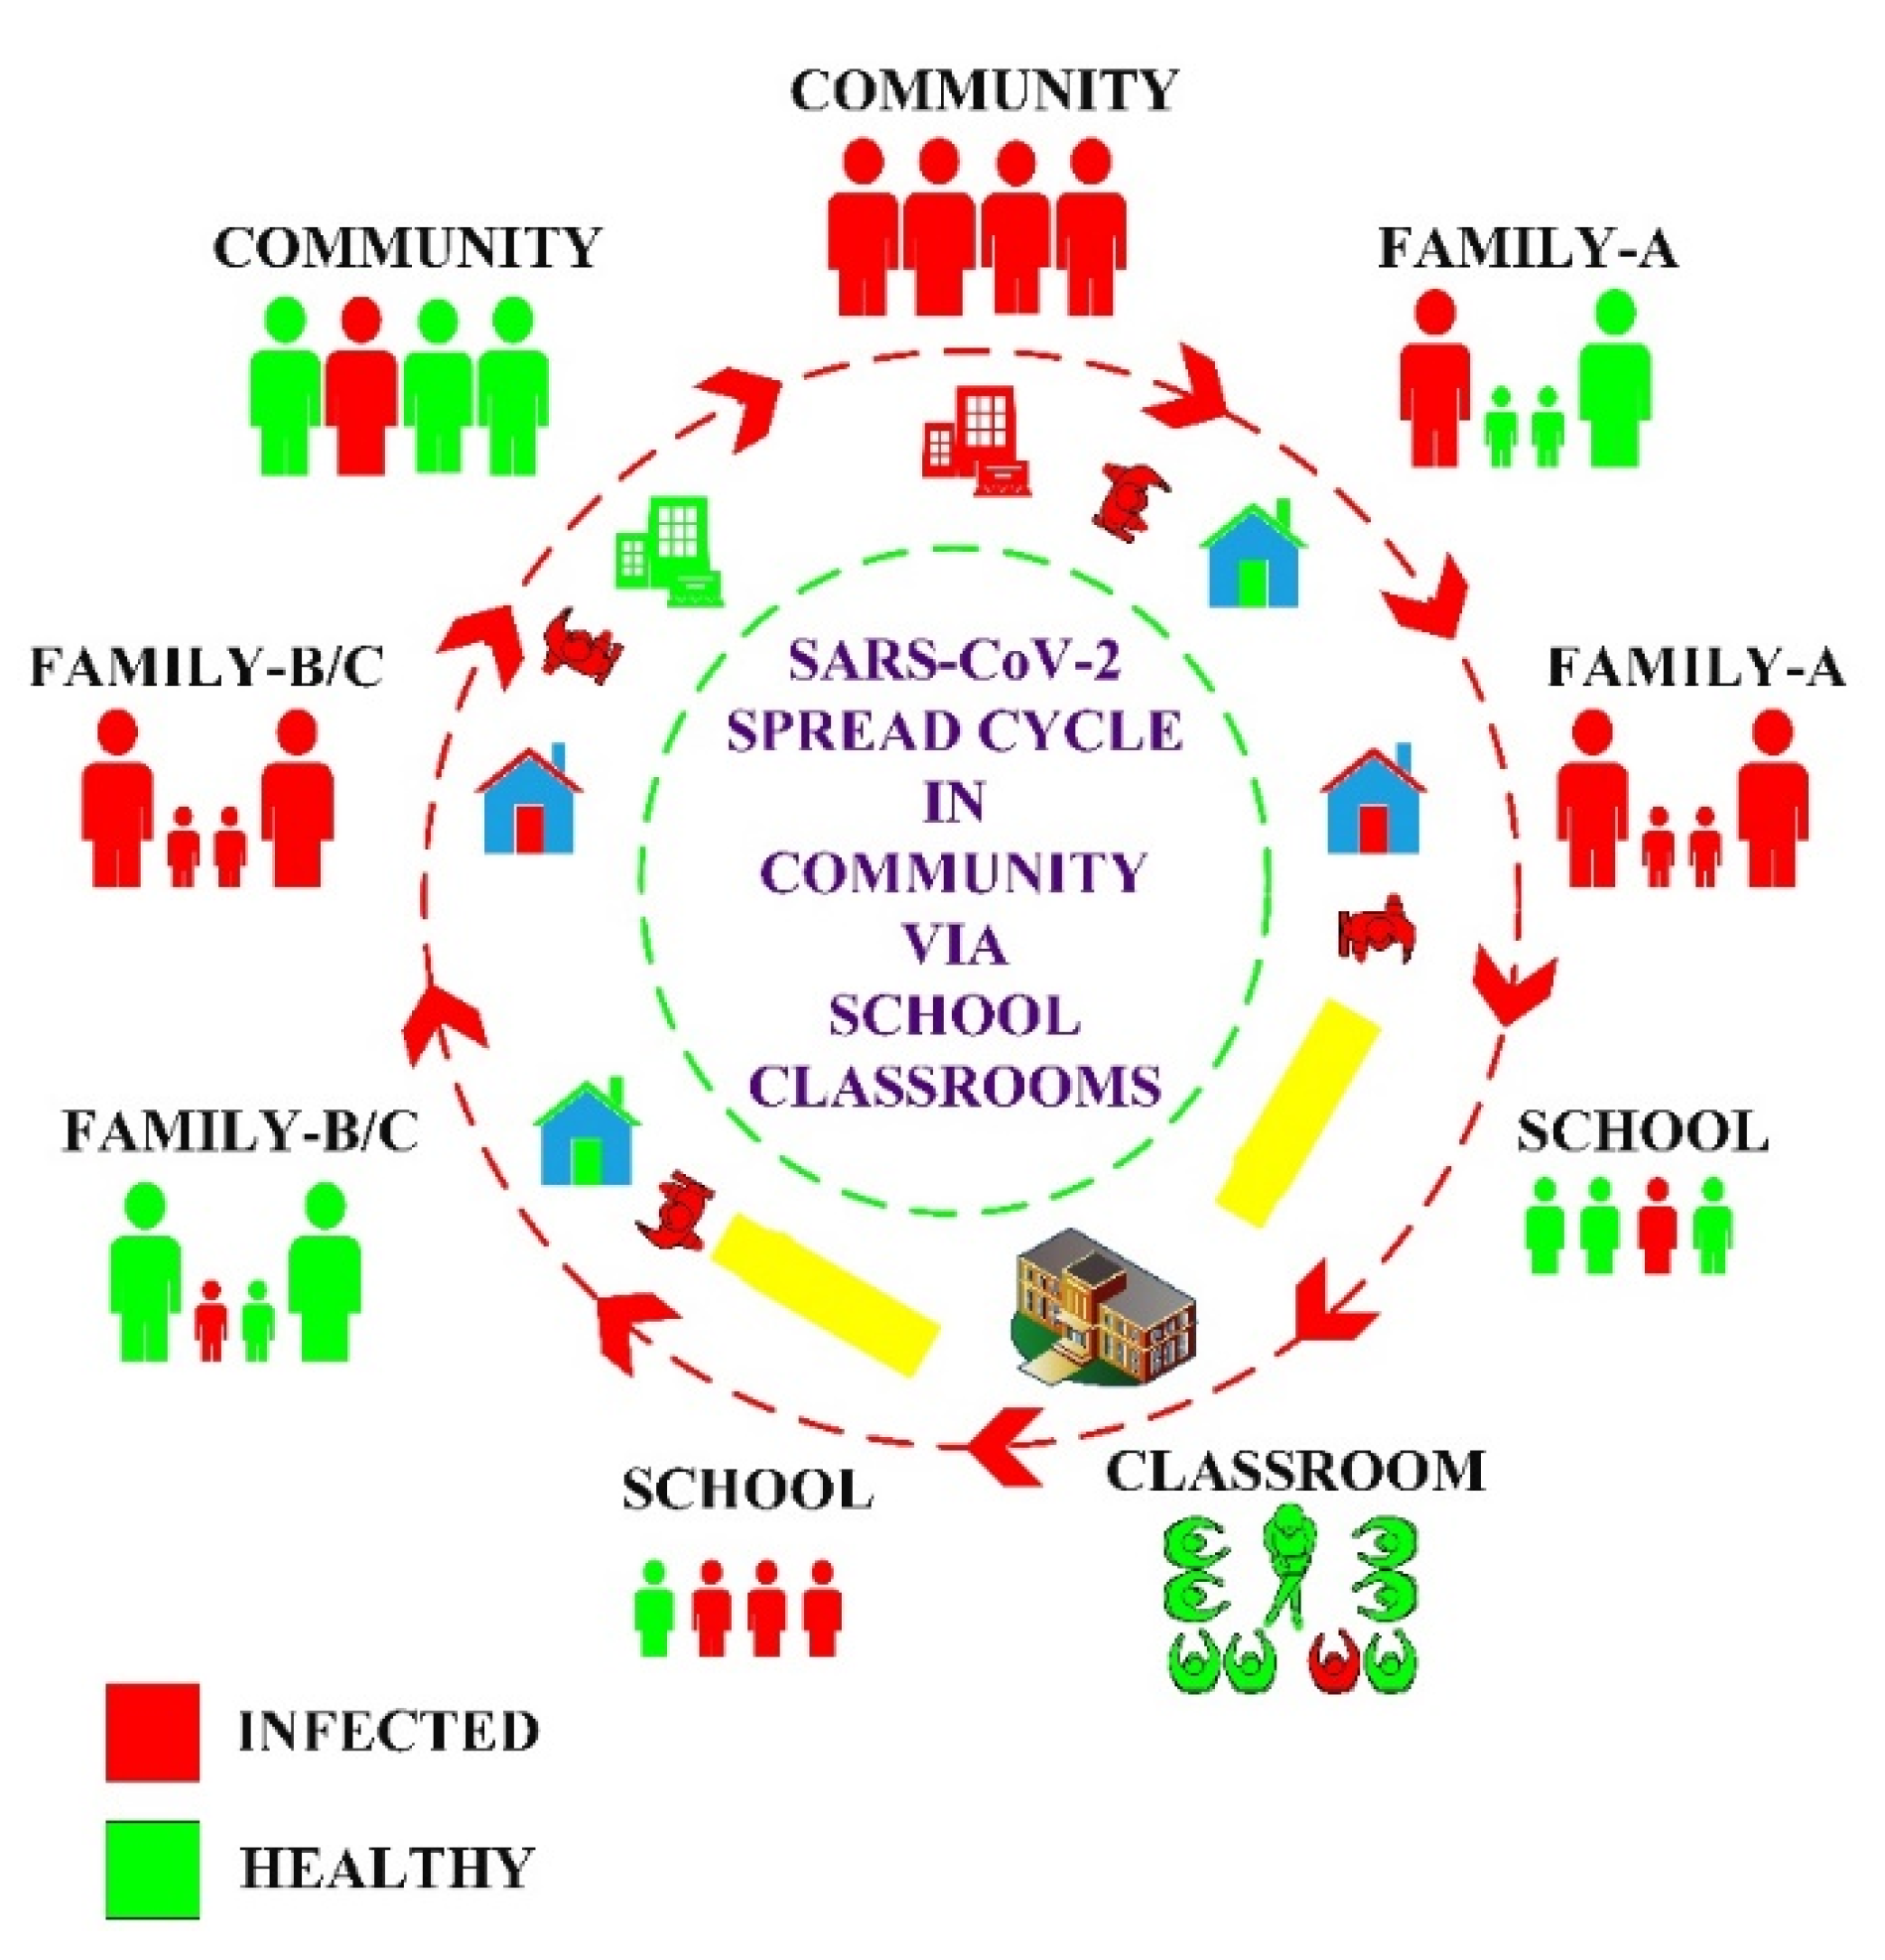
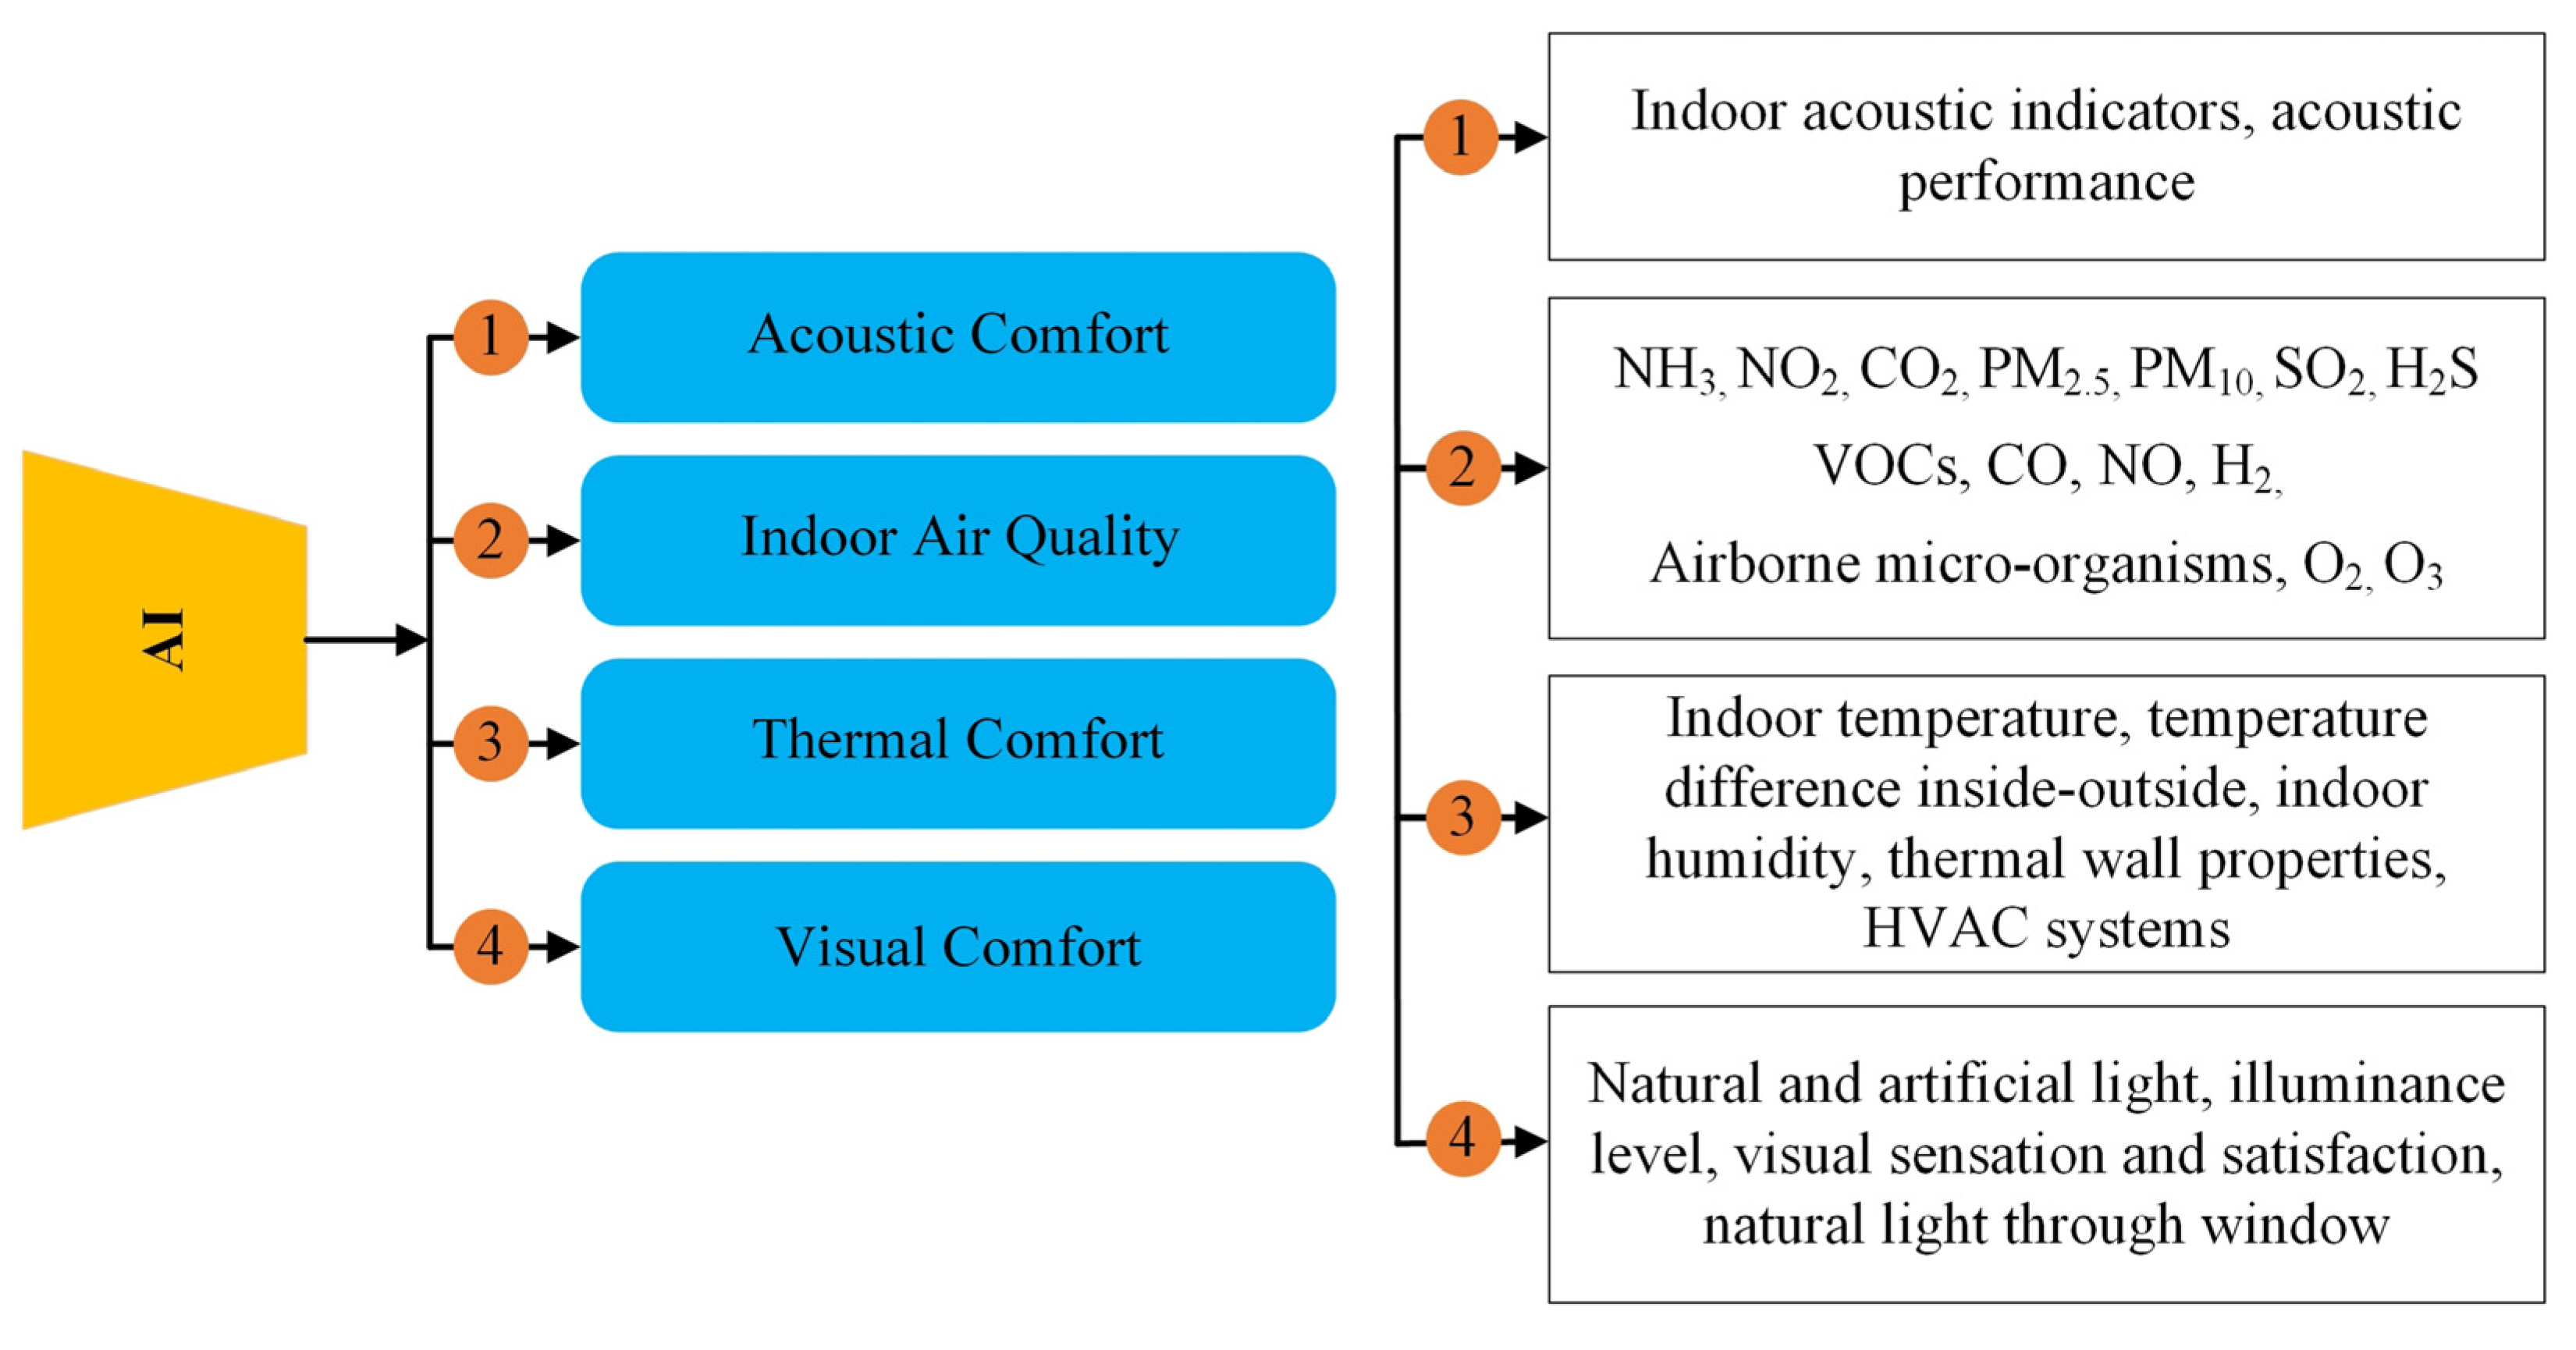
| NBC 2016 [38] | ECBC 2017 [39] | |||||
|---|---|---|---|---|---|---|
| Climatic Zone | Mean of Monthly | Climatic Area | Widow to Wall Ratio | Outer Lux Levels | ||
| Temperature | Relative Humidity | km2 | % | |||
| Hot-Dry | >30 °C | <55% | 545,686 | 16.60 | 20–30% | 10,500 |
| Warm-Humid | >30 °C >25 °C | >55% >75% | 1,160,404 | 35.30 | 30–40% | 9000 |
| Temperate | 25–30 °C | <75% | 9862 | 0.30 | 40% | 9000 |
| Cold | <25 °C | All values | 364,886 | 11.09 | 20–30% | 6800 |
| Composite | When ≥6 months do not fall in any of the above categories | 1,206,426 | 36.70 | 40–50% | 8000 | |
| Standard (Year) [Ref.] | Classroom Specification | Noise Level (dB) | Reverberation Time (s) |
|---|---|---|---|
| WHO Guidelines [155] | General | 35 dB LAeq | 0.6 |
| NBC (2016) [38] | General | 40–45 dBA | 0.6–1.1 |
| ANSI S12.60 (2002) [156] | Volume < 283 m3 | 35 dB LAeq,1h | 0.6 |
| Volume = 283 m3 to 566 m3 | 35 dB LAeq,1h | 0.7 | |
| Volume > 566 m3 | 40 dB LAeq,1h | - | |
| Building Bulletin 93 [157] | Primary School | 35 dB LAeq,30min | <0.6 |
| Secondary School | 35 dB LAeq,30min | <0.8 | |
| Lecture Room (>50 students) | 30 dB LAeq,30min | <1.0 | |
| Hearing Impaired Class | 30 dB LAeq,30min | <0.4 | |
| ISHRAE (2019) [158] | Area < 70 m2 | 40 dBA (max.) | <0.6–<1.0 |
| Area > 70 m2 | 35 dBA (max.) | <0.6–<1.0 | |
| Large Lecture Rooms | 35 dBA (max.) | <0.6–<1.0 | |
| ASHA (1995) [159] | Hearing Impaired Class | 30 to 35 dBA SNR > 15 dB | < 0.4 |
| IS 1950 (1962) [160] | General | 45–50 dB | - |
| BATOD (2001) [161] | Hearing Impaired Class | <35 dB(A) SNR > 20 dB for 125 Hz to 750 Hz and SNR > 15 dB for 750 Hz to 4000 Hz | <0.4 (125 Hz to 4000 Hz) |
| IEQ Parameters | Sub Parameters (Unit) | Lower Limit | Middle Value | Upper Limit | Standard-Year [Reference] |
|---|---|---|---|---|---|
| Indoor Air Quality (IAQ) (including Ventilation) | CO2 (ppm) | Ambient + 350 a | Ambient + 500 b | Ambient + 700 c | ISHRAE-2019 [158] |
| PM2.5 (μg/m3) | <15 a | - | <25 c | ISHRAE-2019 [158] | |
| - | <40{Y} <60 {24 h} | - | NAAQS-2009 [185] | ||
| CO (ppm) | <2 a | - | <9 c | ISHRAE-2019 [158] | |
| - | <2 mg/m3 {8 h} <4 mg/m3 {1 h} | - | NAAQS-2009 [185] | ||
| - | <10 mg/m3 | - | GRIHA-2014 [204] | ||
| TVOC (μg/m3) | <200 a | <400 | <500 c | ISHRAE-2019 [158] | |
| PM10 (μg/m3) | <50 a | - | <100 c | ISHRAE-2019 [158] | |
| - | <60 {Y} <100 {24 h} | - | NAAQS-2009 [185] | ||
| - | <60 {Y} <150 {STL} | - | NBC-2016 [38] | ||
| - | < 20 | - | GRIHA-2014 [204] | ||
| CH2O (μg/m3) | <30 a | - | <100 b | ISHRAE-2019 [158] | |
| SO2 (μg/m3) | <40 a | - | <80 b | ISHRAE-2019 [158] | |
| - | <80 {Y} <400 {STL} | - | NBC-2016 [38] | ||
| - | <50 {Y} <80 {24 h} | - | NAAQS-2009 [185] | ||
| NO2 (μg/m3) | <40 a | - | <80 b | ISHRAE-2019 [158] | |
| - | <200 {Y} <500 {STL} | - | NBC-2016 [38] | ||
| - | <40 {Y} <80 {24 h} | - | NAAQS-2009 [185] | ||
| O3 (μg/m3) | <50 a | - | <100 b | ISHRAE-2019 [158] | |
| - | <60 {24 h} <100 {8 h} <180 {1 h} | - | NAAQS-2009 [185] | ||
| Lead (Pb) (μg/m3) | - | <0.5 {Y} <1 {24 h} | - | NAAQS-2009 [185] | |
| NH3 (μg/m3) | - | <100 {Y} <400 {24 h} | - | NAAQS-2009 [185] | |
| Benzene (μg/m3) | - | 5 {Y} | - | NAAQS-2009 [185] | |
| Arsenic (ng/m3) | - | <6 {Y} | - | NAAQS-2009 [185] | |
| Benzo(a)pyrene (ng/m3) | - | <1 {Y} | - | NAAQS-2009 [185] | |
| Nickel (ng/m3) | - | <20 | - | NAAQS-2009 [185] | |
| Ventilation rate per person (l/s.person) | 6.7 | - | 8.6 | NBC-2016 [38] | |
| Ventilation rate (Cfm/Sqft) | 5.0 | 7.5 | 10.0 | IGBC-2015 [205] | |
| Ventilation (Air Changes per Hours) | - | 5–7 | - | NBC-2016 [38] | |
| - | 3–6 | - | SP-41 1987 [163] | ||
| Acoustic Comfort (AcC) | Indoor Noise Level (dB) | 35 | - | 40 | ISHRAE-2019 [158] |
| 45 | - | 50 | IS 1950–1962 [160] | ||
| 40 | - | 45 | GRIHA-2014 [204] | ||
| 40 | - | 45 | NBC-2016 [38] | ||
| RT (Second) | 0.6 | 0.8 | 1.0 | ISHRAE-2019 [158] | |
| 0.6 | - | 1.1 | NBC-2016 [38] | ||
| Speech Transmission Index | - | 0.5–0.6 | - | ISHRAE-2019 [158] | |
| Thermal Comfort (TC) | Operative Temperature (°C) | 25 | 27.5 | 30 | SP-41 1987 [163] |
| 19 d | 34 d | SP-41 1987 [163] | |||
| - | <33 | - | GRIHA-2014 [204] | ||
| 25 | 27.5 | 30 | NBC-2016 [38] | ||
| 19 d | - | 34 d | NBC-2016 [38] | ||
| 22.0 ± 3.0 | - | 24.5 ± 2.5 | ISHRAE-2019 [158] | ||
| Relative Humidity (%) | 30 | - | 70 | SP-41 1987 [163] | |
| - | <70 | - | GRIHA-2014 [204] | ||
| 30 | - | 70 | ISHRAE-2019 [158] | ||
| Vertical Air Temperature Difference (°C) | - | 4 | - | ISHRAE-2019 [158] | |
| Visual Comfort (VC) | Illuminance (lux) | 150 | 200 | 300 | SP-41 1987 [163] |
| 150 | - | 300 | IS-7942, 1976 [206] | ||
| 150 | - | 300 | IS-8827 1978 [207] | ||
| 150 | - | 300 | IGBC-2015 [205] | ||
| 200 | 300 | 500 | NBC-2016 [38] | ||
| - | 300 | - | GRIHA-2014 [204] | ||
| - | 300 | - | ISHRAE-2019 [158] | ||
| Limiting Glare Index | - | 16 | - | SP-41 1987 [163] | |
| - | 3 | - | NBC-2016 [38] | ||
| Daylight Factor (1DF = 80 lux) | - | 2.5 | - | IGBC-2015 [205] | |
| 1.9 | - | 3.8 | IS-7942, 1976 [206] | ||
| 1.9 | - | 3.8 | SP-41 1987 [163] |
| IEQ Parameter | Climate Typology | Total Studies | |||||
|---|---|---|---|---|---|---|---|
| Hot-Dry | Warm-Humid | Temperate | Cold | Composite | Mixed | ||
| IAQ | 01 | 04 | - | - | 12 | - | 17 |
| AcC | - | 06 | - | - | - | 02 | 08 |
| TC | - | - | - | - | 02 | 04 | 06 |
| VC | - | - | - | - | 02 | - | 02 |
| IEQ | - | 01 | - | - | 01 | 02 | 04 |
| Total | 01 | 11 | - | - | 17 | 08 | 37 |
| Category | Age | Respiratory Rate [Breaths per Minute (bpm)] |
|---|---|---|
| Newborn baby | 0–1 month | 40–60 bpm |
| Infant | 1 month–1 year | 35–40 bpm |
| Toddler | 1–3 years | 25–30 bpm |
| Preschooler | 3–6 years | 21–23 bpm |
| School-age | 6–12 years | 19–21 bpm |
| Adolescent | 12–19 years | 16–18 bpm |
| Author [Ref] | Year | Building Type | Method | TC Parameter | Input/Output | Results |
|---|---|---|---|---|---|---|
| Moon et al. [302] | 2016 | Residential | ANN | Indoor temperature, temperature difference and outdoor temperature | TEMPIN, TEMPOUT, ΔTEMPDIF | R2 = 0.9999 |
| Mba et al. [303] | 2016 | Experimental Building | ANN | Indoor temperature (IT), indoor humidity (IH) | Indoor and outdoor temperature, Sunshine and relative humidity monthly data | R = 0.9850 (IT) R = 0.9853 (IH) |
| Valladares et al. [304] | 2019 | Classroom and Laboratory | Reinforcement Learning | Thermal comfort and indoor air control | Temperature, humidity and CO2, Specifications of air condition unit and ventilation fan | PMV values within range −0.1 to +0.07 and 10% reduction in CO2 values while saving 4–5% energy |
| Zhang et al. [305] | 2021 | Office Building | Fuzzy logic | Indoor temperature and thermal comfort | Indoor air temperature, indoor air relative humidity, outdoor air temperature, outdoor air relative humidity, CO2 concentration, Skin temperature and heart rate | Daily energy consumption = 20.07% (point-based control) Daily energy consumption = 10.73% (feedback-based control) |
| Bienvenido-Huertas et al. [306] | 2020 | Household Building | MLP, RF | Thermal properties of wall | Tint, max(Tint), min(Tint), Text, max(Text), min(Text), q, max)(q), min(q), thickness, time, period | RF Model is good to estimate the periodic thermal variables |
| Gao et al. [307] | 2020 | Normal Building | Deep reinforcement learning (FNN) | Energy efficient thermal comfort | Temperature, Humidity, Radiant temperature, Air Speed, Metabolic rate, Clothing insulation | Improved thermal comfort by 13.6% and reduce energy consumption of HVAC = 4.31% |
| Irshad et al. [308] | 2020 | Office Building | ANN | Predication of thermal comfort with installed AC | Air temperature, relative humidity, globe temperature, wind speed, metabolic rate, and clothing | MSE = 5.1789 |
| Kim [309] | 2020 | Office Building | ANN, DNN | HVAC system optimization for thermal comfort | = zone z at time t is affected by the power inputs, Pt of the HVAC system and the thermal conditions, Et of a multi-zone building during the time from t − τ to t. | NMSEs = 0.9999 |
| Thongkhome & Dejdumrong [310] | 2020 | House Building | ANN | Thermal comfort environmental predication | Temperature and relative humidity | Accuracy = 99.54% |
| Zhou et al. [311] | 2019 | Office Building | Model-Driven learning {K-Neighbors Regression (KNR), Support Vector Regression (SVR), Tree Regression (TR), and Linear Regression (LR)}. | Dynamic thermal comfort | Temperature, air velocity and humidity | PMV model predicting values |
| Rehman et al. [312] | 2020 | Commercial building | Decision Tree, Naïve Bayes, SVM, MLP, and DANN | Personalized comfort | Temperature and humidity | Highest accuracy = 84.35% |
| Luo et al. [313] | 2018 | Normal room | - | Metabolic rate and thermal comfort | Temperature, humidity, BMI, Sex, age pregnancy and menopause status | - |
| Author [Ref] | Year | Building Type | Method | IAQ Parameter | Input/Output | Results |
|---|---|---|---|---|---|---|
| Xie et al. [314] | 2017 | Commercial | ANFIS, BP, MLRM | NH3 | Pit NH3 concentration, Room temperature, Pit temperature, Room humidity, Pit humidity, Pig activities, Pit fan-E speed, Pit fan-W speed, Room fan 14′’, Room fan 20′’, and Pig manure | ANFIS, BP and MLRM results in summer and winter MSE = 0.0047 and 0.002, R2 = 0.6483 and 0.6351; MSE = 0.0137 and 0.0042, R2 = 0.6066 and 0.5543; MSE = 0.0174 and 0.0660, R2 = 0.5957 and 0.702. |
| Challoner et al. [315] | 2015 | Office | ANN | NO2, PM2.5 | Time of day, barometer level pressure (hPa), sea level pressure (hPa), temperature (°C), relative humidity (%), wind speed (knots), wind direction (knots), Pasquill atmospheric stability class, global solar radiation (j. cm2) and outdoor pollutant concentrations | Location 1, 2 and 3: For NO2, R2 = 0.854, 0.870, 0.829; For PM2.5, R2 = 0.711, 0.760, 0.770. |
| Ahn et al. [316] | 2017 | Office | Gated recurrent unit LSTM | PM2.5, CO2, VOCs | CO2, VOC, humidity, temperature, light amount, and fine dust | Prediction Accuracy: GRU = 84.69 LSTM = 70.13 |
| Adeleke et al. [317] | 2017 | Residential | MLP NN | PM2.5 | Indoor PM2.5 concentration | Precision up to 0.86, Sensitivity of up to 0.85. |
| Liu et al. [318] | 2018 | Residential | ANN | CO2, PM2.5, and PM10 | Indoor PM2.5 and PM10 concentration, indoor temperature, relative humidity, indoor CO2 concentration | For PM2.5, R2 = 0.97 For PM10, R2 = 0.91 For Fungi, R2 = 0.68 |
| Loy-Benitez et al. [319] | 2019 | Waiting rooms | Deep RNN | PM2.5, PM10, CO2, NO2, CO, NO | xt (current input) | RMSE = 29.73 µg/m3, MAPE = 29.52% RMSE = 30.99 μg/m3, MAPE = 31.10% |
| Vanus et al. [320] | 2016 | Residential | Decision tree regression method | CO2 | Internal and external temperature, internal RH, date and time | RMSE = 46.25 ppm |
| Ha et al. [321] | 2020 | Office | Extended fractional-order Kalman filter | H2, NH3, ethanol, H2S, toluene, CO, CO2, O2 | CO2, CO, O2, H2, NH3, ethanol, H2S, toluene, temperature, humidity | MSE = 0.8612, 0.39993, 0.7082, 0.5122, 0.6103, 0.6761, 0.4738, 0.4262, 0.3601, 0.3007 |
| Elhariri et al. [322] | 2019 | Office | Gated recurrent unit | CO2 | Humidity, temperature and CO2 | RMSE = 4.0474125 |
| Fang et al. [323] | 2016 | Residential | Machine learning-based non-parametric forecasting | PM2.5, VOC | Humidity, temperature, VOCs, PM2.5 | NRMSD = 7.5% |
| Maag et al. [324] | 2018 | Office and residential | Multiple linear regression, non-linear ANN | O3, CO2, VOC | O3, temperature, VOC | For O3: RMSE = 7.4 ppb, R2 = 0.78 For CO2: RMSE = 8.1 ppb, R2 = 0.88 |
| Schwee et al. [325] | 2019 | Office | Time slicer method, PAD method | CO2 | CO2, temperature | PAD method has more accuracy than time slicer method |
| Xiahou et al. [326] | 2019 | Residential | ARIMA | PM2.5, PM10, CO2, tVOC, formaldehyde | PM2.5, PM10, temperature, CO2, tVOC, formaldehyde | Mean prediction error = 0 The model have high prediction accuracy |
| Author [Ref] | Year | Building Type | Method | VC Parameter | Input/Output | Results |
|---|---|---|---|---|---|---|
| Rodriguez et al. [327] | 2015 | Office | Fuzzy rule base | Natural and artificial Light | Sun position, illuminance level, glare | Maintain visual comfort with decreasing the use of artificial light. |
| Penacchio et al. [328] | 2015 | Residential, commercial, office and industrial | MOGA | Visual discomfort | Spatial structure in scenes from nature, and sensitivity of the human visual system, visual discomfort | R2 = 0.810 |
| Delgarm et al. [329] | 2016 | Office | Multi-Objective Non-Dominated Sorting Genetic Algorithm (NSGA-II) | Visual comfort | Building orientation, Window length, Window width, Overhang tilt angle, Overhang depth | Final optimum configuration leads to 23.8–42.2% decrease in the annual total building energy consumption. |
| Kim et al. [330] | 2016 | Office | GA | Natural light through window-by-window size | Azimuth angle, Outdoor illuminance | GA optimized model saved 11.7% energy. |
| Cen et al. [331] | 2019 | Residential, Office | LR, SVM | Illuminance level | Eye pupil size, illuminance levels, visual sensation and visual satisfaction | Accuracy = 0.7086 for visual sensation, and Accuracy = 0.65467 for visual satisfaction |
| Kar et al. [332] | 2019 | Office | Python-based method | Visual comfort | Consumed energy for maintain comfortable visual environment | 72% reduction in energy consumption with maintaining good visual environment |
| Author [Ref] | Year | Building Type | Method | AcC Parameter | Input/Output | Results |
|---|---|---|---|---|---|---|
| Zhong et al. [333] | 2019 | Institutional Building | ANN, BP, FFN | Acoustic comfort | Temperature, noise, relative humidity and CO2 | R2 = 0.469–0.928 |
| Yeh and Tsay [334] | 2021 | Institutional Building | SVM, RF, GBDT and ANN | Indoor Acoustic Indicators | Details of Ceiling and wall materials | ANN shows good results (Except reverberation time) |
| Khan and Bhattacharjee [335] | 2021 | Normal Building | NSGA-II | Acoustic Performance | Total floor area, climatic zone, number of storeys, and building envelope parameters | Results changes with wall and roof material thickness |
Publisher’s Note: MDPI stays neutral with regard to jurisdictional claims in published maps and institutional affiliations. |
© 2021 by the authors. Licensee MDPI, Basel, Switzerland. This article is an open access article distributed under the terms and conditions of the Creative Commons Attribution (CC BY) license (https://creativecommons.org/licenses/by/4.0/).
Share and Cite
Kapoor, N.R.; Kumar, A.; Alam, T.; Kumar, A.; Kulkarni, K.S.; Blecich, P. A Review on Indoor Environment Quality of Indian School Classrooms. Sustainability 2021, 13, 11855. https://doi.org/10.3390/su132111855
Kapoor NR, Kumar A, Alam T, Kumar A, Kulkarni KS, Blecich P. A Review on Indoor Environment Quality of Indian School Classrooms. Sustainability. 2021; 13(21):11855. https://doi.org/10.3390/su132111855
Chicago/Turabian StyleKapoor, Nishant Raj, Ashok Kumar, Tabish Alam, Anuj Kumar, Kishor S. Kulkarni, and Paolo Blecich. 2021. "A Review on Indoor Environment Quality of Indian School Classrooms" Sustainability 13, no. 21: 11855. https://doi.org/10.3390/su132111855
APA StyleKapoor, N. R., Kumar, A., Alam, T., Kumar, A., Kulkarni, K. S., & Blecich, P. (2021). A Review on Indoor Environment Quality of Indian School Classrooms. Sustainability, 13(21), 11855. https://doi.org/10.3390/su132111855