Abstract
Because of the rapid increase in the depletion rate of conventional energy sources, the energy crisis has become a central problem in the contemporary world. This issue opens the gateway for exploring and developing renewable energy sources to fulfill the exigent energy demand. Solar energy is an abundant source of sustainable energy and hence, nowadays, solar photovoltaic (PV) systems are employed to extract energy from solar irradiation. However, the PV systems need to work at the maximum power point (MPP) to exploit the highest accessible power during varying operating conditions. For this reason, maximum power point tracking (MPPT) algorithms are used to track the optimum power point. Furthermore, the efficient utilization of PV systems is hindered by renowned partial shading conditions (PSC), which generate multiple peaks in the power-voltage characteristic of the PV array. Thus, this article addresses the performance of the newly developed jellyfish search optimization (JSO) strategy in the PV frameworks to follow the global maximum power point (GMPP) under PSC.
1. Introduction
Electrical energy plays a significant role in meeting the world demand for the fundamental components of society and everyday comforts. Nowadays, thermal power plants fulfill the exigent power need. However, an increase in the depletion of fossil fuels, and their harmful effect on the environment, necessitates the development of sustainable energy resources (SERs). SERs have the potential to generate pollution-free electricity. Renewable resources are inexhaustible and naturally disguised in the form of water, biomass, wind, solar, fuel cells, etc. Hence, such sources will be the best substitutes to tackle power crisis issues.
The highest share record of renewable energy, estimated to be 29% of the global energy, was seen in 2020, the year of low electricity demand per the renewable 2021 global status report [1]. Even in 2020, the renewable power generation capacity surpassed the net establishments of both the nuclear and fossil fuel capacities consolidated, although the coronavirus pandemic reduced the electricity need by more than 1.5% yearly. Consequently, a fall of 5.8% in global energy-related carbon dioxide (CO2) emissions were observed, the most significant percentage drop since World War II. Among the renewable power systems, solar photovoltaics (PV) had another record-breaking year (i.e., 2020), adding as much as an estimated 139 GW, for a real anticipation of 760 GW. Thus, in the future, solar energy will be on a boom, considering the present rate of growth.
The selection of electrical-energy-generating systems depends on the viability and proficiency factors. Since solar energy has minimum operational and maintenance expenses, it is predominantly employed for generating electrical energy over other renewable energy sources. The PV frameworks are employed to transform solar energy into electricity. Solar PV plants are primarily utilized for grid-connected and stand-alone frameworks [2].
Although solar energy is widely available in nature as solar irradiance, its extraction using PV systems relies on environmental factors. Since the climatic conditions (i.e., temperature and solar irradiance) vary abruptly, this leads to the fluctuation in the PV system yield [3]. Thus, various technologies, such as the dual-axis solar tracker (DAST) and PV emulators, are utilized and, nowadays, different materials are coated over the primary silicon layers of the solar cells to enhance the efficiency of the PV panels. The dual-axis solar tracker (DAST) helps tilt the PV panels according to the sunlight intensity [4]. The DAST employs LDR sensors that identify the direction of the highest sunlight intensity, and the two servomotors rotate the panel along the horizontal and vertical axes to track the sun movement. The DAST tracking mechanism can be the active type that works using sensors to follow the sun movement. The passive type utilizes the concept of pressure imbalance, and the chronological type employs a fixed-time-supported tracking system. Another technology to solve this issue is MPPT algorithm implementation in PV systems. However, the algorithm count is high nowadays and selecting an algorithm for a specific requirement is problematic. Thus, there comes the importance of reviewing, which gives insight into the selection of the method. Moreover, to check the practical implementation of the MPPT strategies, PV emulators are deployed. Primarily, the PV emulator is a composition of a variable DC supply and a variable resistor, which is connected in series with the former. The fundamental principle of the operation of the PV emulators depends on the MPP theorem, which guides the characteristic P–V curve plotting. This curve illustrates the MPP, and its detection is performed by MPPT strategies that further encourage the PV system to work at that point. In this way, PV emulators aid in the testing and validation of the MPPT methods [5].
Maximum power point tracking (MPPT) strategies are employed to deal with the fluctuating power problem by forcing the PV module to work at the maximum power point (MPP). The MPPT method incorporates the impedance matching strategy between the PV array and the converter. Furthermore, the use of the matching technique increases the efficiency of the PV framework. Still, designing an MPPT technique that optimizes the PV yield and has high efficiency is hard to achieve because of the nonlinear characteristic of the solar cell [6]. Moreover, the efficiency of the PV framework also depends on the internal attributes, such as parallel and series resistance, the diode factor, etc.
Various MPPT techniques have been proposed and executed in recent decades to upgrade the PV yield under different atmospheric circumstances. MPPT algorithms accomplish the primary goal of extracting the maximum power from PV modules by adjusting the duty ratio of the converter employed in the system [7]. The solutions to MPPT problems usually consider five unique techniques, as per [8]: The first technique uses methods that consider the constant parameters, for example, the straight-line dependency of the PV current with the short-circuit current [9], the maximum power point (MPP) voltage independent of temperature, and the linear relation between the open-circuit voltage and the MPP voltage [10]; the second uses methods that involve the trial-and-error process, particularly the conventional perturb and observe (P&O) [10] technique and its modified strategies [11,12]; the third uses measurement and comparison strategies, predominantly the look-up table technique [13]; the fourth uses methods comprised of mathematical computation, such as incremental conductance (INC) [14]; and the last uses soft-computing strategies, for instance, particle swarm optimization (PSO) [15,16], or fuzzy logic controller (FLC) [17].
In general, conventional MPPT techniques rely on linear controllers, such as fractional open-circuit voltage (FOCV), P&O, etc. [18]. However, the linearized control framework produces low yields and has an intrinsic medium dynamic response. Over the past few decades, bio-propelled techniques, for instance, swarm insight (SI) methods [19], have acquired expanded consideration as excellent optimization strategies for providing optimum solutions and tackling complex problems.
The SI strategies involve the aggregate insight conduct of the coordination and decentralized frameworks. For instance, the SI methods include conducts, such as collaborative hauling, social creatures gathering, cooperative herding and sorting, and the nest construction behavior of social insects. Natural systems examples of the SI include bird flocking, ant colonies, animal herding, bee colonies, bacterial growth, fish schooling, microbial intelligence, and hawks hunting. Sectionalization for work activity and self-organization are the fundamental characteristics of the SI algorithms [20]. Self-organization is defined as the competence of a system to advance its representatives into an appropriate structure with no external assistance. Furthermore, the self-organization feature depends on the four central properties of variation and aggregate interactions and negative and positive responses. Predominantly, negative and positive feedbacks are helpful for group adjustment and the enhancement of movement for better results, respectively [21]. The variation features are valuable for stochasticity. Aggregate interactions happen when the group members communicate information between themselves inside the search arena. In comparison, sectionalization for work activity is distinguished as individuals’ concurrent execution of different feasible assignments to reach the goal. Such segmentation helps the swarm to handle complex issues, which include cooperation. Some of the well-known swarm intelligence algorithms are (PSO) [22], the genetic algorithm (GA) [23], ant colony optimization (ACO) [24], evolutionary algorithms (EA) [25], artificial bee colony (ABC) [26], and salp swarm optimization (SSO) [27]. Each algorithm has its own pros and cons respective to a particular issue. Thus, exploring new strategies is crucial for further development in the research domain.
This article gives insight into the validation of the newly developed jellyfish search optimization (JSO) algorithm in the case of the maximum power point tracking of the solar photovoltaic systems as a solution to the partial shading conditions problem in solar PV. JSO is a swarm-insight-driven algorithm that is motivated by the food search strategy of the jellyfish in the ocean [28]. This research work provides a comprehensive discussion on the working of the JSO strategy and pictorially depicts the crucial steps of its operation. Furthermore, a simulation was performed to test the JSO algorithm for varying conditions, such as the static and dynamic irradiance conditions for the PV system. The simulation results suggest that the algorithm tracking speed is fast, in contrast to most common algorithms. Later, a comparative performance analysis of the JSO and the PSO strategies was performed to test its advantages over the latter algorithm by employing the simulation results as evidence.
The research work discussed in this article is structured as follows: Section 2 discusses the PV framework formulation and its modeling and the influence of change in solar irradiance on the output yield of the PV system using I–V and P–V curves representation. Section 3 discusses maximum power point tracking and the partial shading condition (PSC) and its dire impact on the PV arrays. In Section 4, the jellyfish search optimization strategy is comprehensively explained. Section 5 presents the performance of the JSO MPPT technique under partial and uniform irradiance. The comparison results of the JSO and PSO algorithms are depicted in Section 6. Lastly, Section 7 concludes the work by listing the paper’s findings as well as viewpoints about the future scope of this work.
This scientific work was completed after iterative efforts to develop the algorithm’s code, as suggested by the author of the JSO algorithm [28], specifically for the solar PV system. The consecutive attempts led to the successful implementation of the JSO algorithm. The validation process provides the response of the JSO algorithm for the dynamic and static irradiation conditions in the simulation framework. These results and problem solutions, i.e., testing of the new algorithm, are the indicators of the originality of this research work. However, this paper provides the opportunity to enhance the work by executing the JSO algorithm in a real-time environment.
2. PV Framework Formulation
A photovoltaic (PV) cell is the elemental constituent of the PV system. The PV cell is a semiconductor rig that utilizes the photovoltaic reaction to change sunlight into electrical energy. When the photon energy of the daylight incident on the PV module surpasses the energy gap, the emanation of electrons from the PV cell instigates the progression of electrons to create an electric flow.
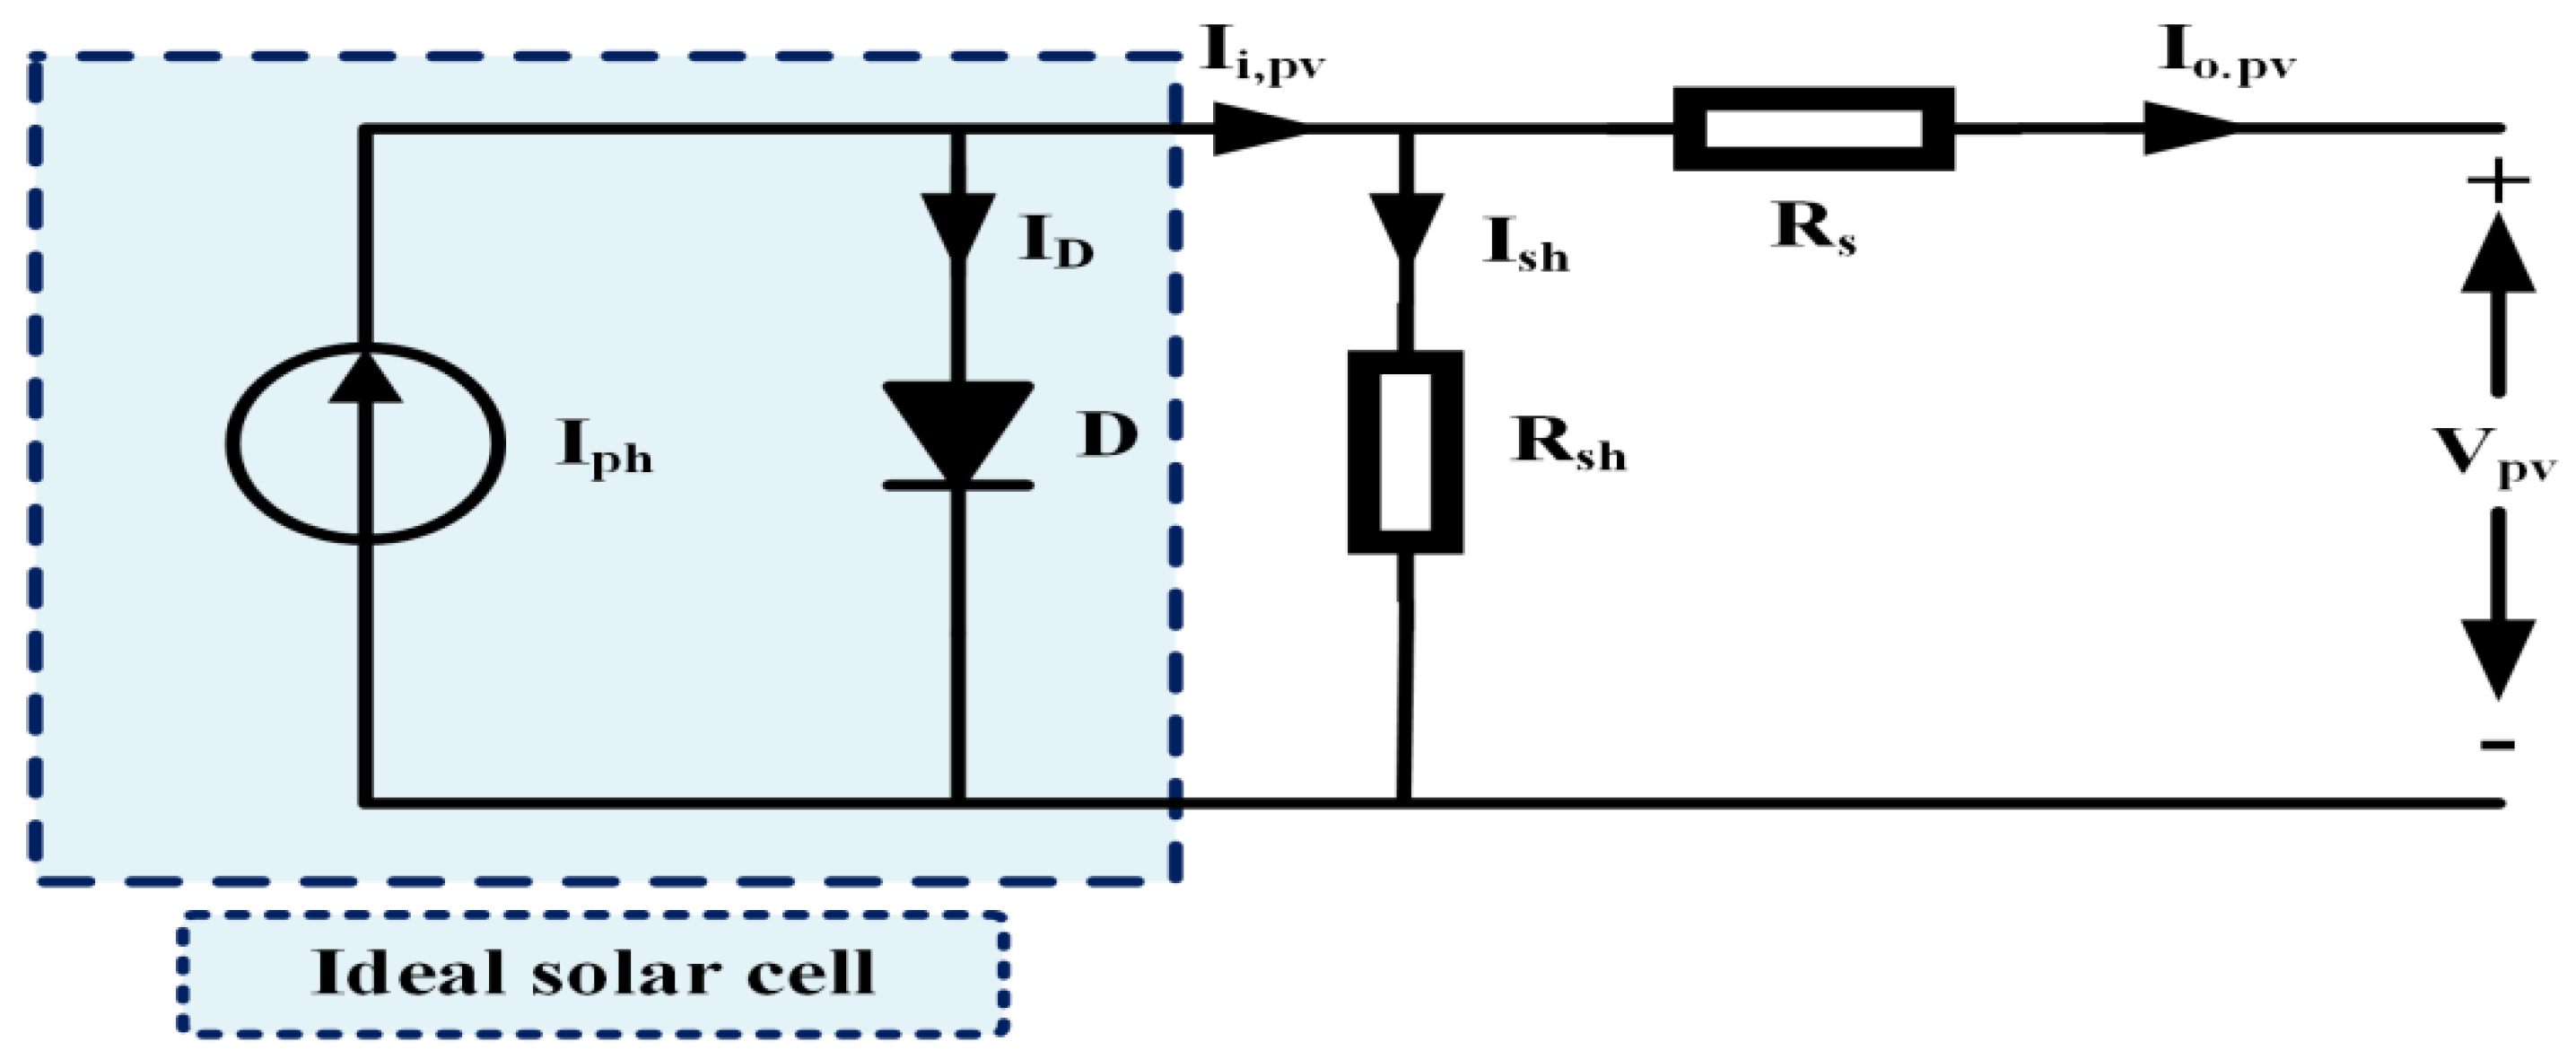
The equivalent model of a solar cell is exhibited in Figure 1. The simplified model is helpful for simulation purposes as it can quickly unfold the solar arrays’ yield, voltage, and current characteristics for various working situations.
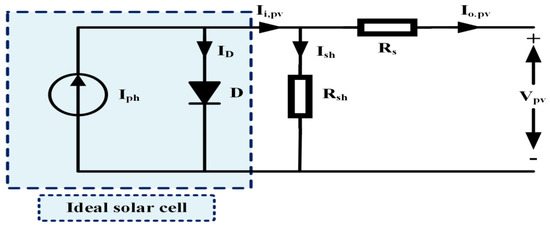
Figure 1.
Single diode model of the solar cell.
In the simplified electrical circuit of a PV cell, ID symbolizes the reverse current in the PV cell. Iph denotes the photon-offered current whose significance relies upon the radiation-collecting expanse of the PV cell, the encompassing temperature, and the brightening power of the striking light rays. Ish indicates the shunt current that is the direct byway of the bypass resistor (Rsh). Furthermore, its production is attributable to the battery edge and the metal extension spillage on the metal electrode. Ii,pv denotes the PV cell current at its input terminal. Rs signifies the series-associated resistor that relies upon the resistivity of the material and the contact. Io,pv stands for the current of the PV cell at its output terminals.
By implementing Kirchhoffs’ current law, the output current, (Io,pv), of the PV cell is often calculated as:
The current from the PV cell, actuated by the solar light, relies upon the operating temperature and solar irradiation level, mathematically represented in Equation (2).
where denotes the short-circuit current of the PV cell at standard temperature conditions (STC); signifies the cell short-circuit current per unit temperature coefficient (A/K); indicates the solar insolation in (W/m2) covering the PV cell facial area; and Tc and Tr are the cell working and reference temperatures, respectively.
Similarly, the reverse saturation current, (Io), varies per the environmental condition and is mathematically computed as:
where signifies the bandgap energy; q represents the electron charge ; A stands for the diode ideality constant; k denotes the Boltzmann constant (1.38 × (10−23) J/K); and T symbolizes the absolute temperature in (K).
The current through the diode is given by utilizing the Shockley equation, per Equation (4).
Here, VT indicates the thermal voltage, and Vpv stands for the output voltage of the solar cell at the load side.
Utilizing Ohm’s law, the current through the shunt resistor is calculated as shown in Equation (5).
Hence, the characteristic equation of a solar cell is depicted as:
where
stands for the reverse saturation current; VT indicates the thermal voltage; represents the count of solar cells connected in series; and and signify the shunt and the series resistance in (Ω), respectively, present in the single diode model of the solar cell.
Characteristic Curves of a Solar Cell
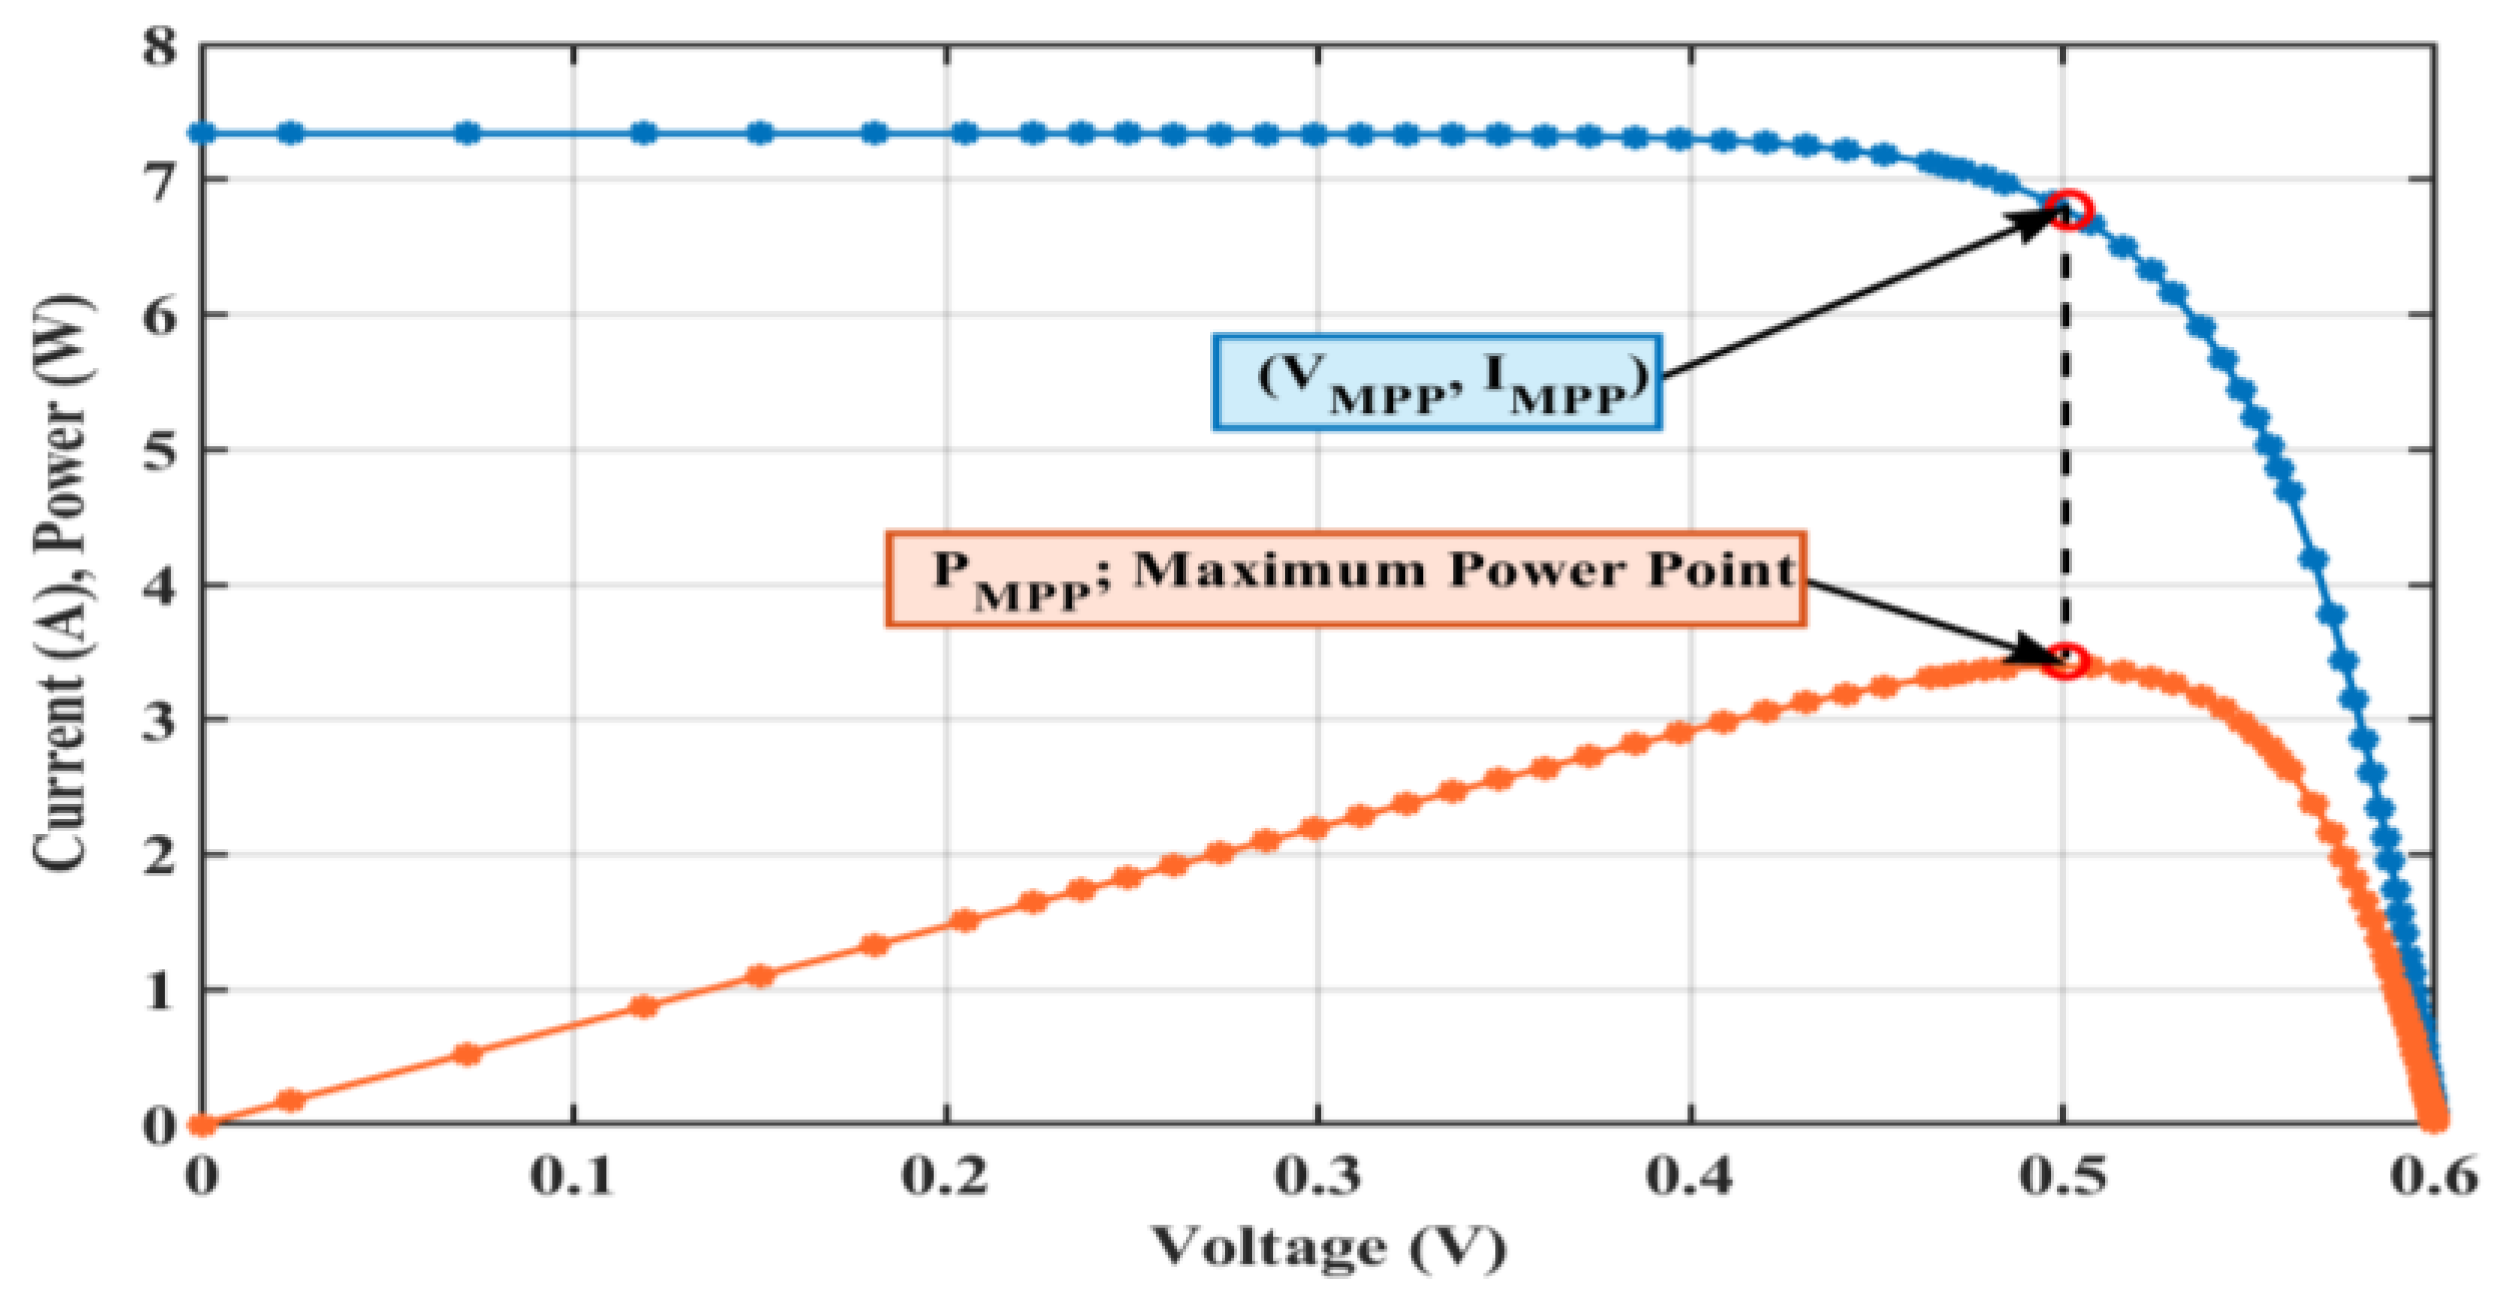
The current flow, in the case of the short-circuit condition of the solar cell, is called a short-circuit current (Isc), while when the electrical network of the solar cell is open-circuited, the optimum voltage available is known as open-circuit (Voc). However, none of the Isc and Voc contributes to the generation of power, although there exists a specific combination of voltage and current that corresponds to the maximum accessible power. The coordinates on the characteristic curve of a solar cell are illustrated in Figure 2.
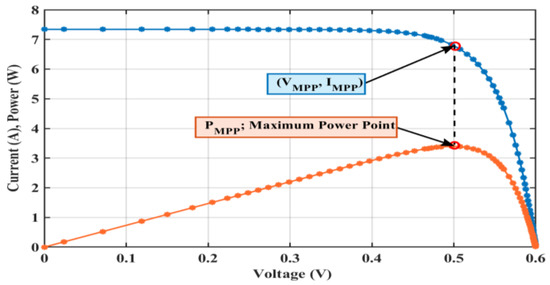
Figure 2.
The characteristic curve of a solar cell.
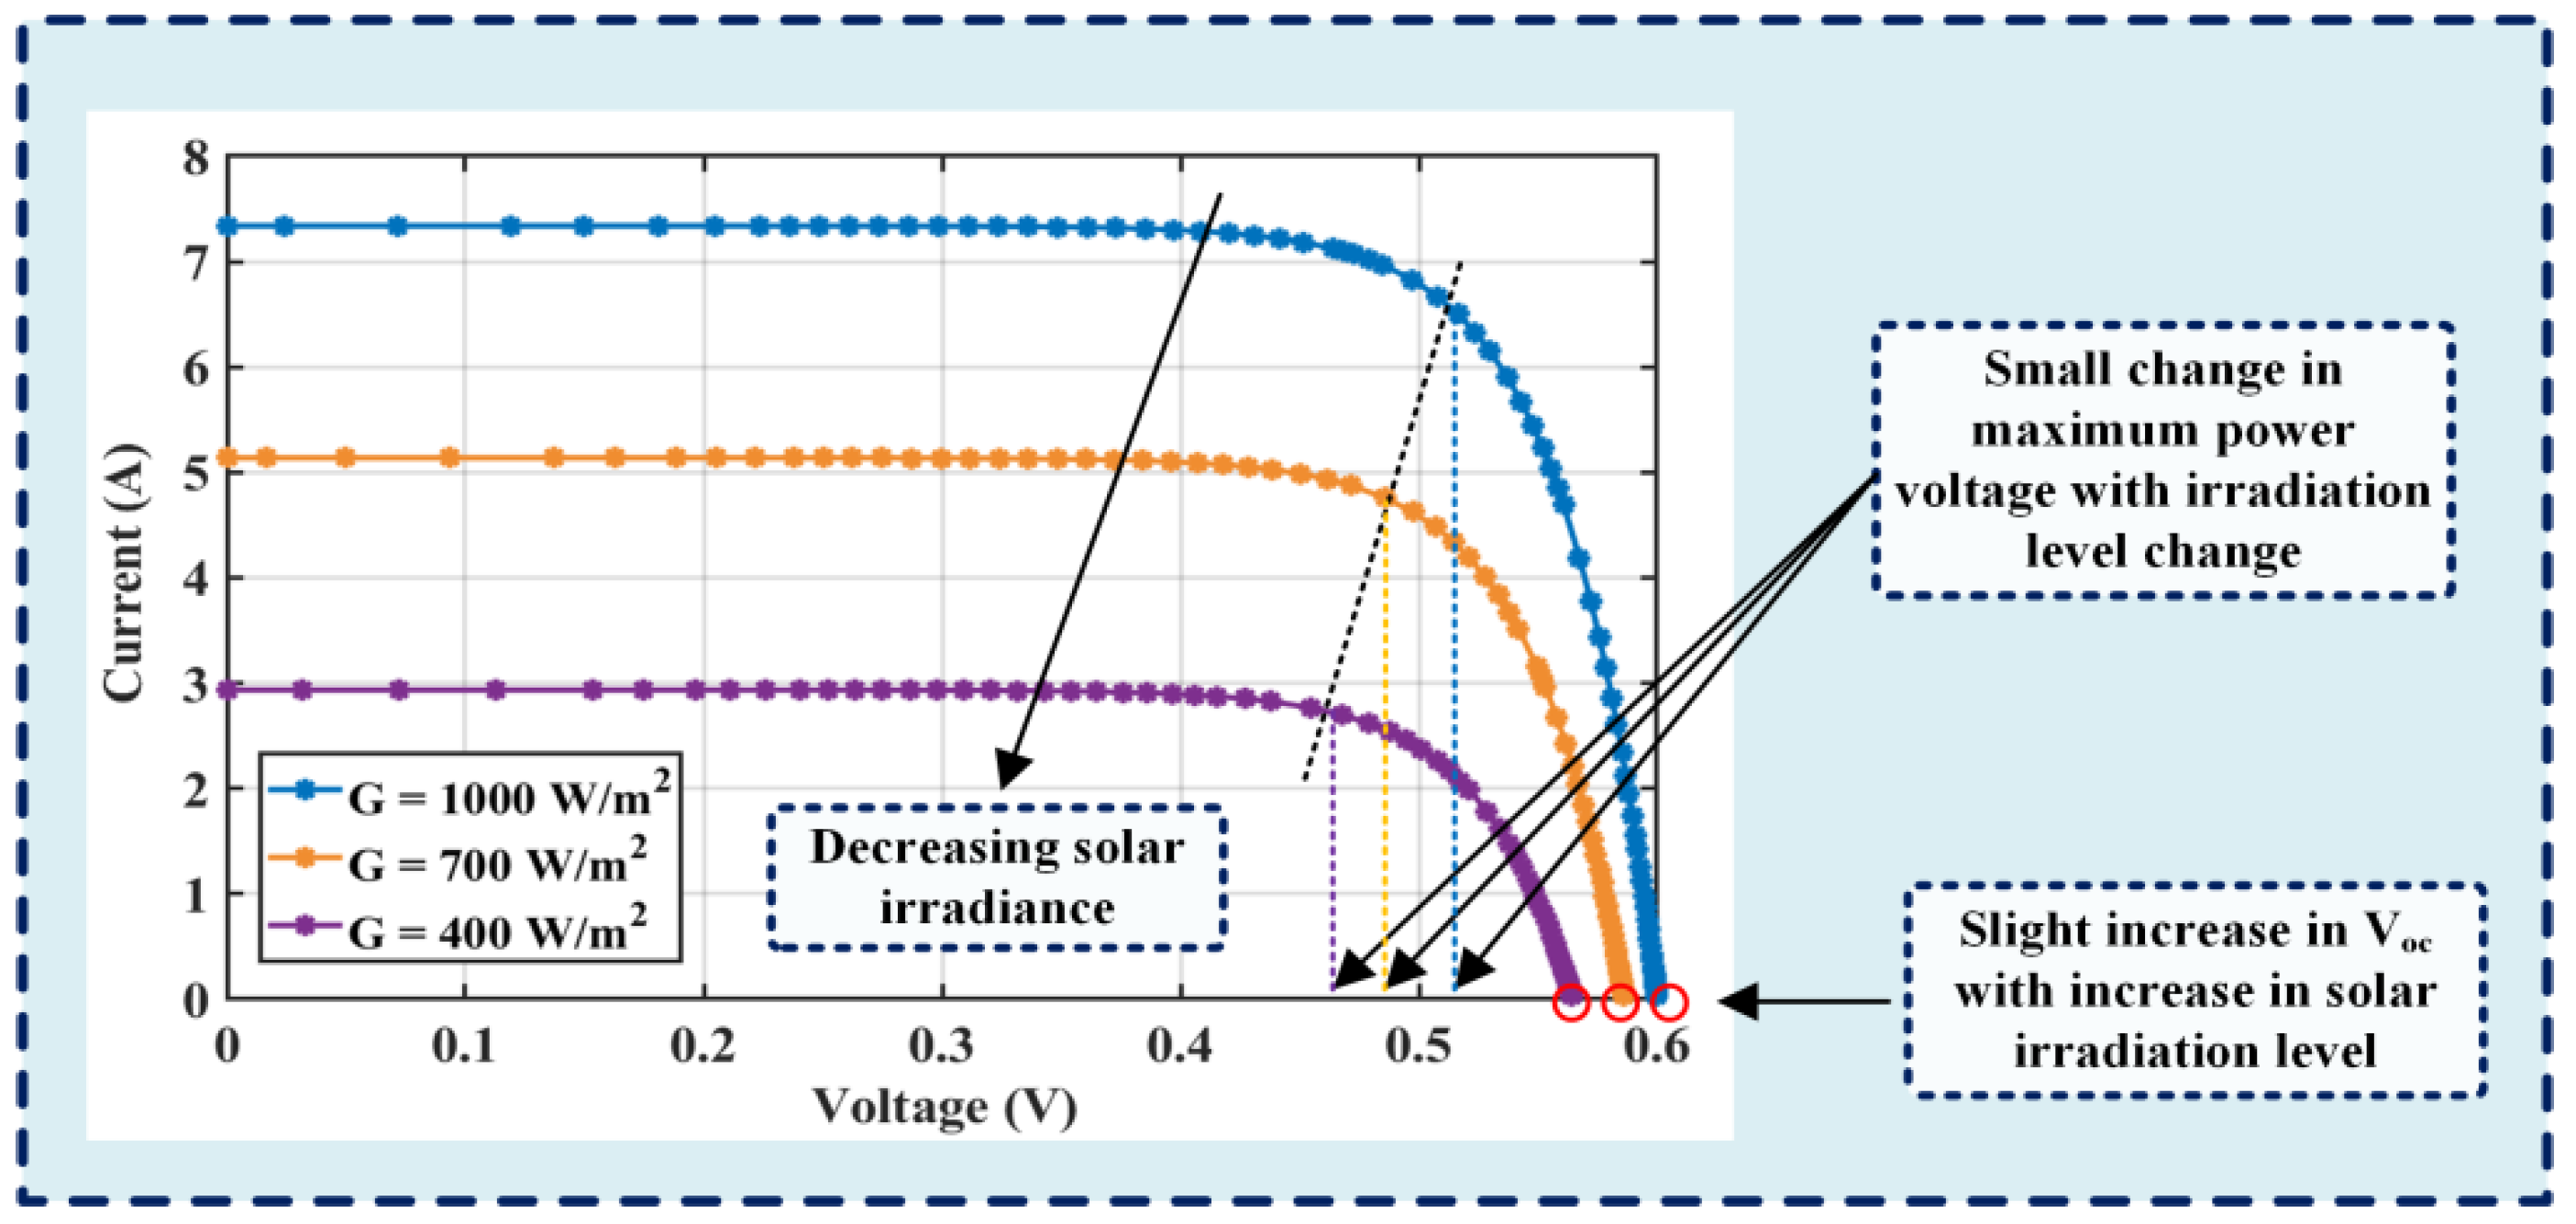
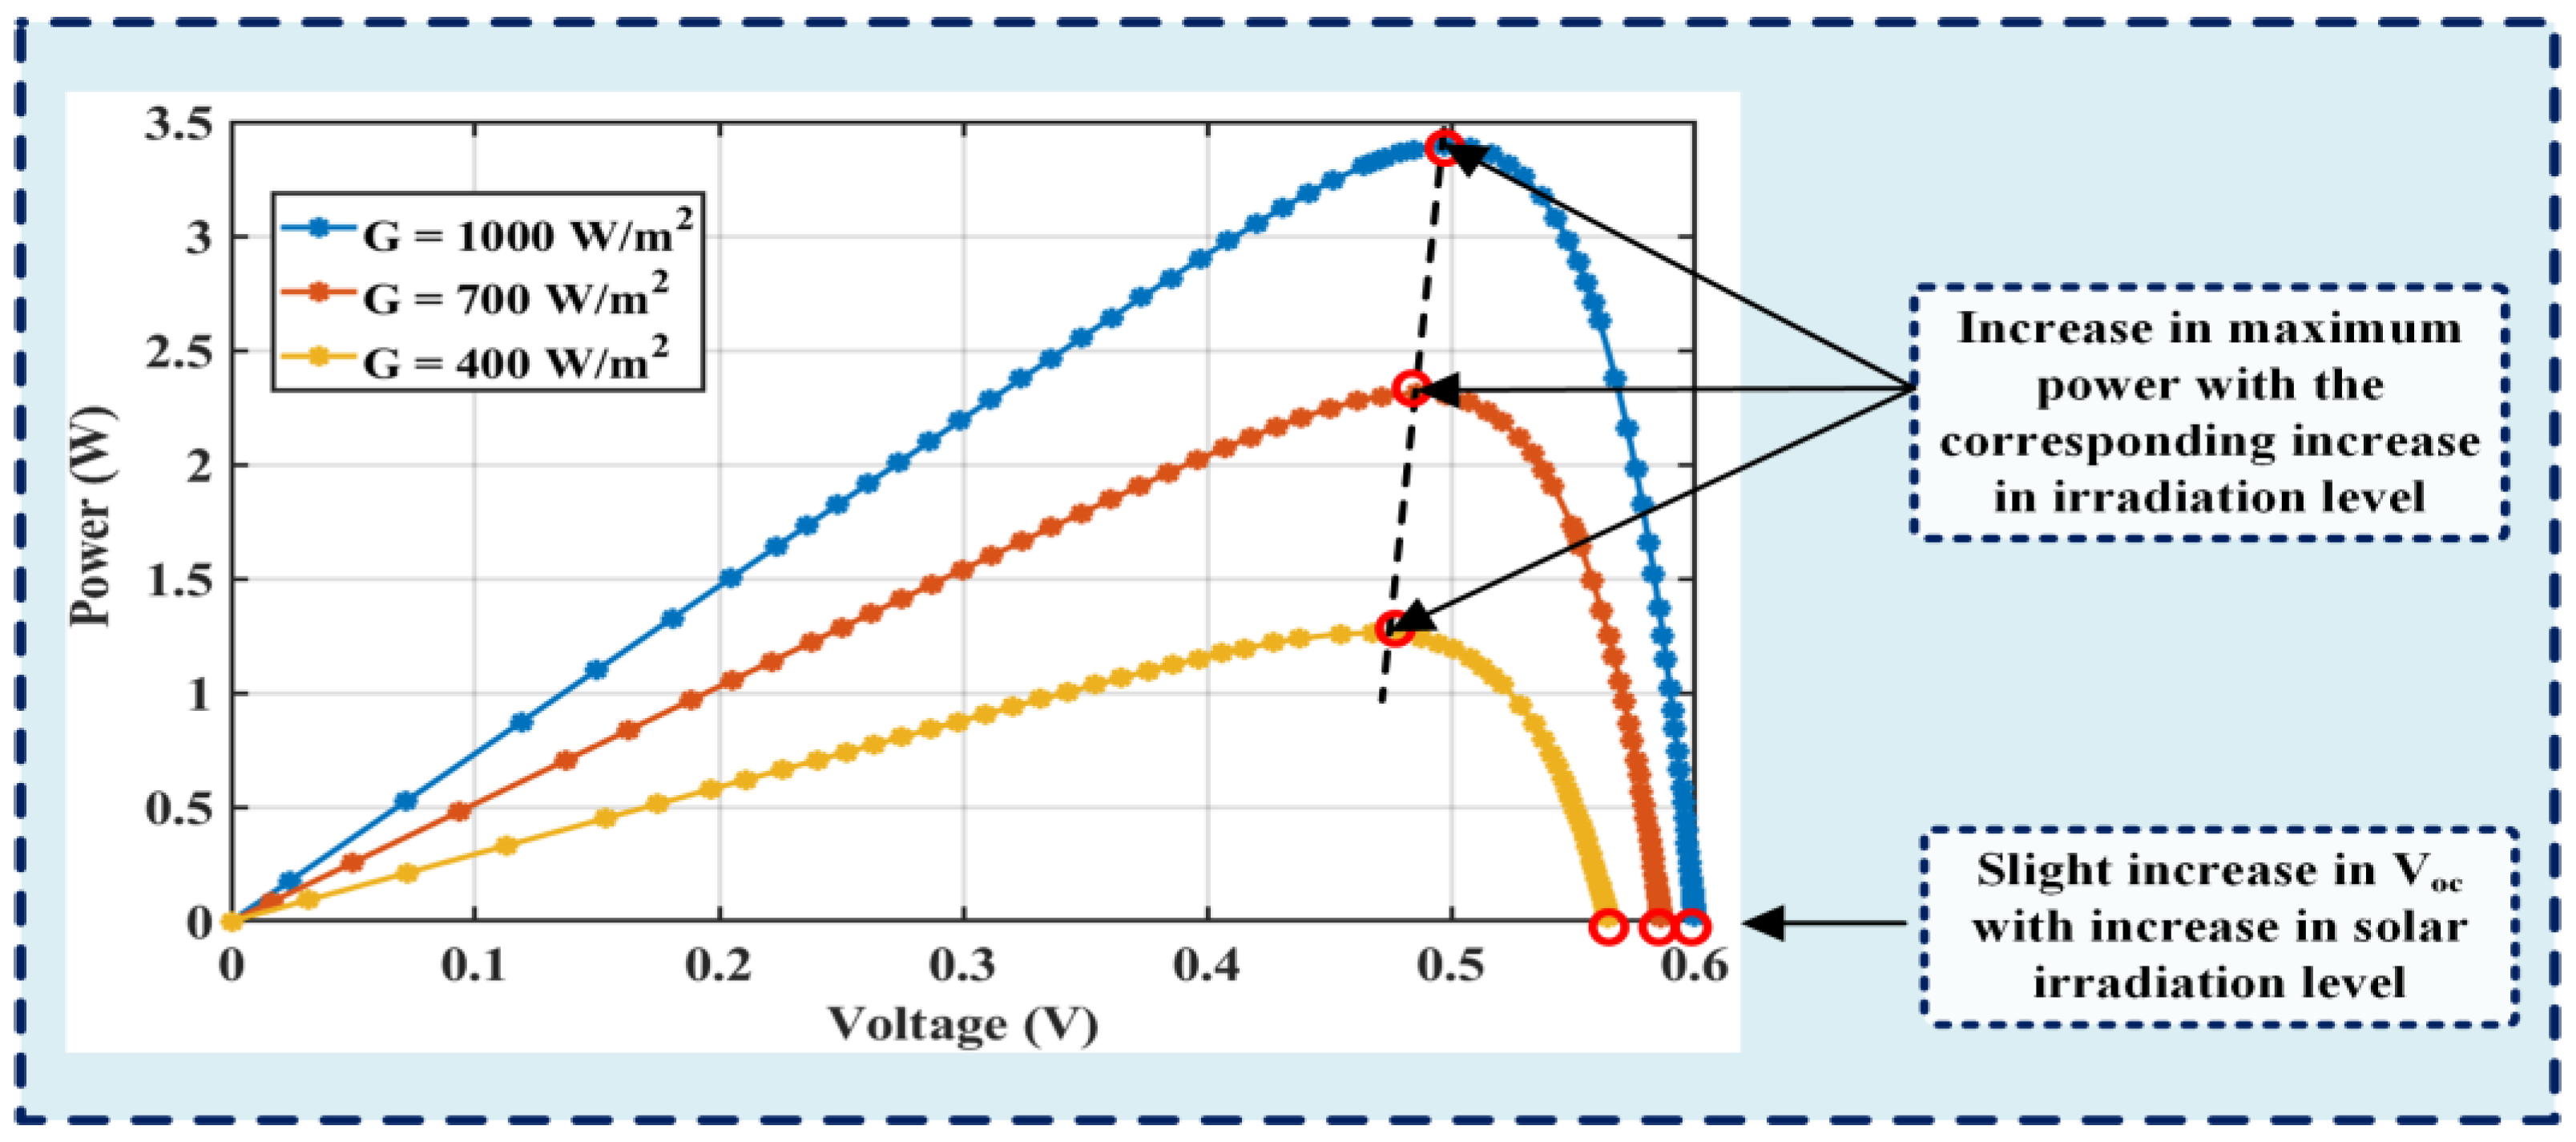
The current-versus-voltage characteristics, and the power-versus-voltage graph of a PV cell, at a constant temperature, per change in the insolation level, are exhibited in Figure 3 and Figure 4, respectively. From Figure 3 and Figure 4, the following conclusions can be made: an increase in the solar irradiance level leads to a small increment in the open-circuit voltage of the PV cell. In contrast, there is a significant increase in the short-circuit current through the PV cell. Hence, the yield power of a PV cell is directly related to the irradiation level at a constant temperature.
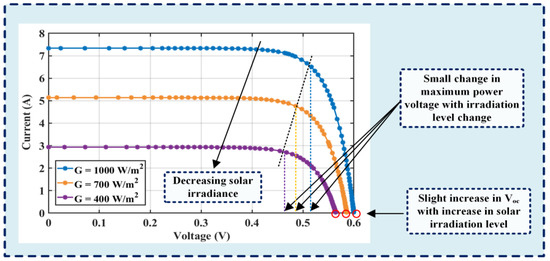
Figure 3.
I–V characteristic curve of a solar cell for change in solar irradiance at a constant temperature.
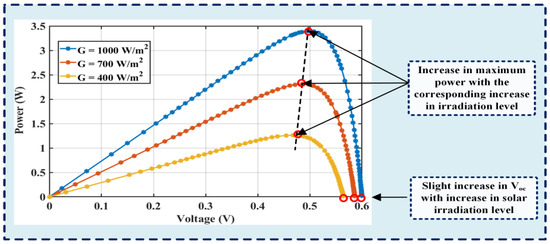
Figure 4.
The P–V characteristic curve of a solar cell for change in solar insolation level at a constant temperature.
3. Maximum Power Point Tracking (MPPT)
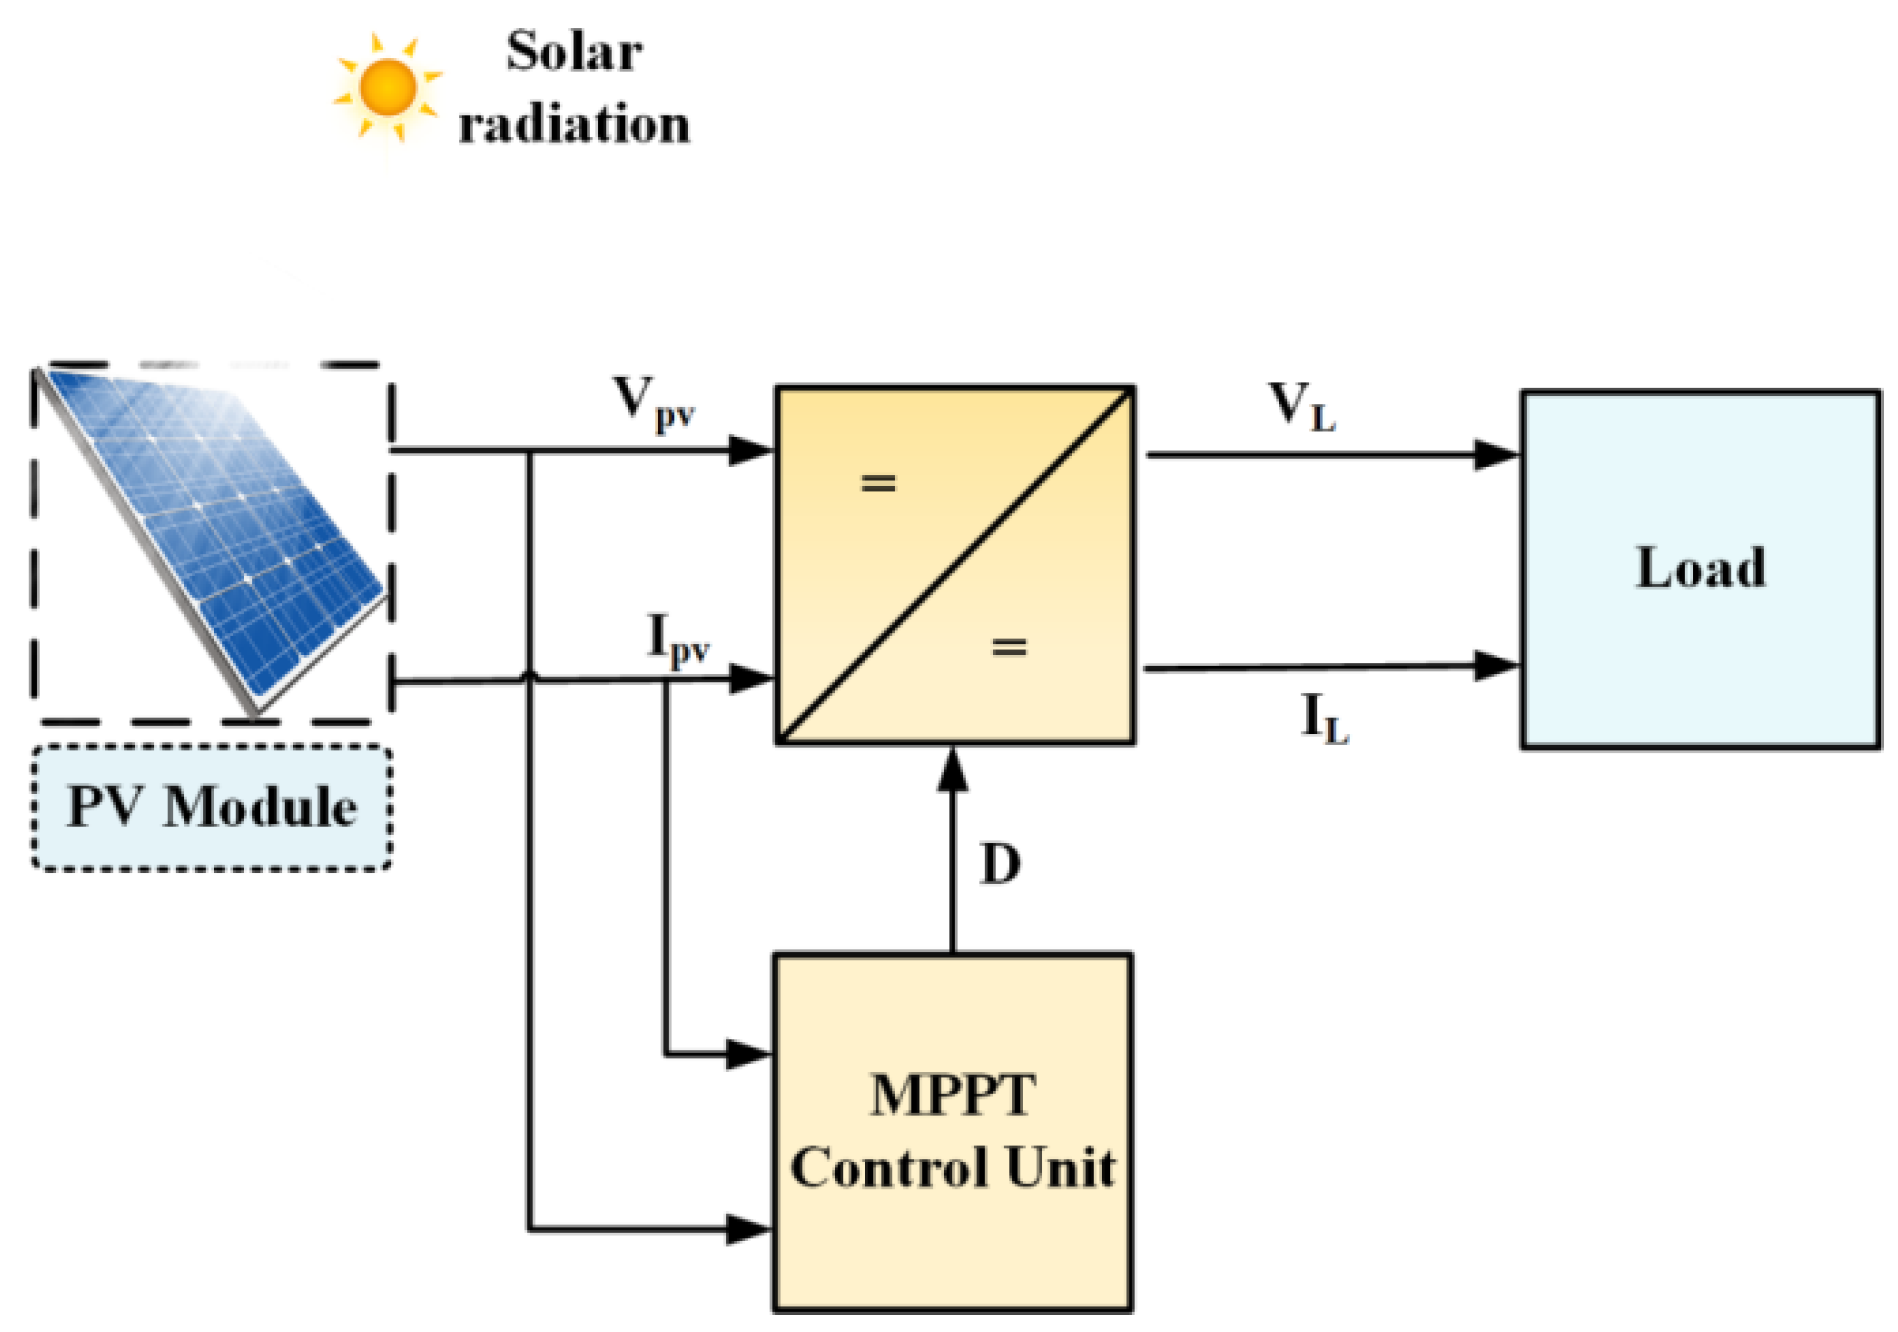
The nonlinear characteristic of the PV array necessitates the use of maximum power point tracking (MPPT) algorithms. MPPT techniques are engaged to assess the maximum feasible yield from the PV module under distinguishing states by examining the output voltage of the PV arrays to the battery voltage [29]. The MPPT algorithm is enforced by employing an electronic DC-to-DC converter that enhances the contest between the battery bank and the PV panel. The high-frequency DC-to-DC converter takes the DC input data of the PV modules and transforms it into a high-frequency AC. Afterward, it switches it to various DC currents and voltages in order to accurately facilitate the solar arrays. The voltage at which a PV system produces a peak yield is known as the maximum power point (MPP). The basic block illustration of the MPPT framework is exhibited in Figure 5.
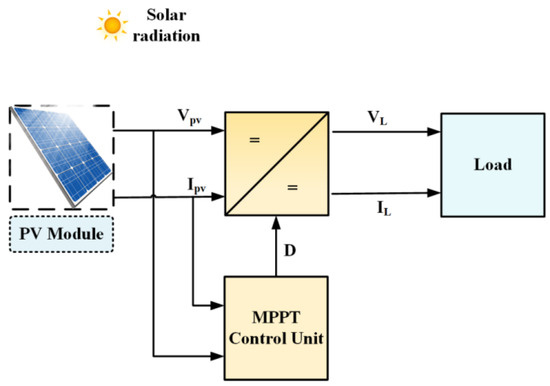
Figure 5.
The block diagram of an MPPT framework.
Partial Shading Conditions (PSC)
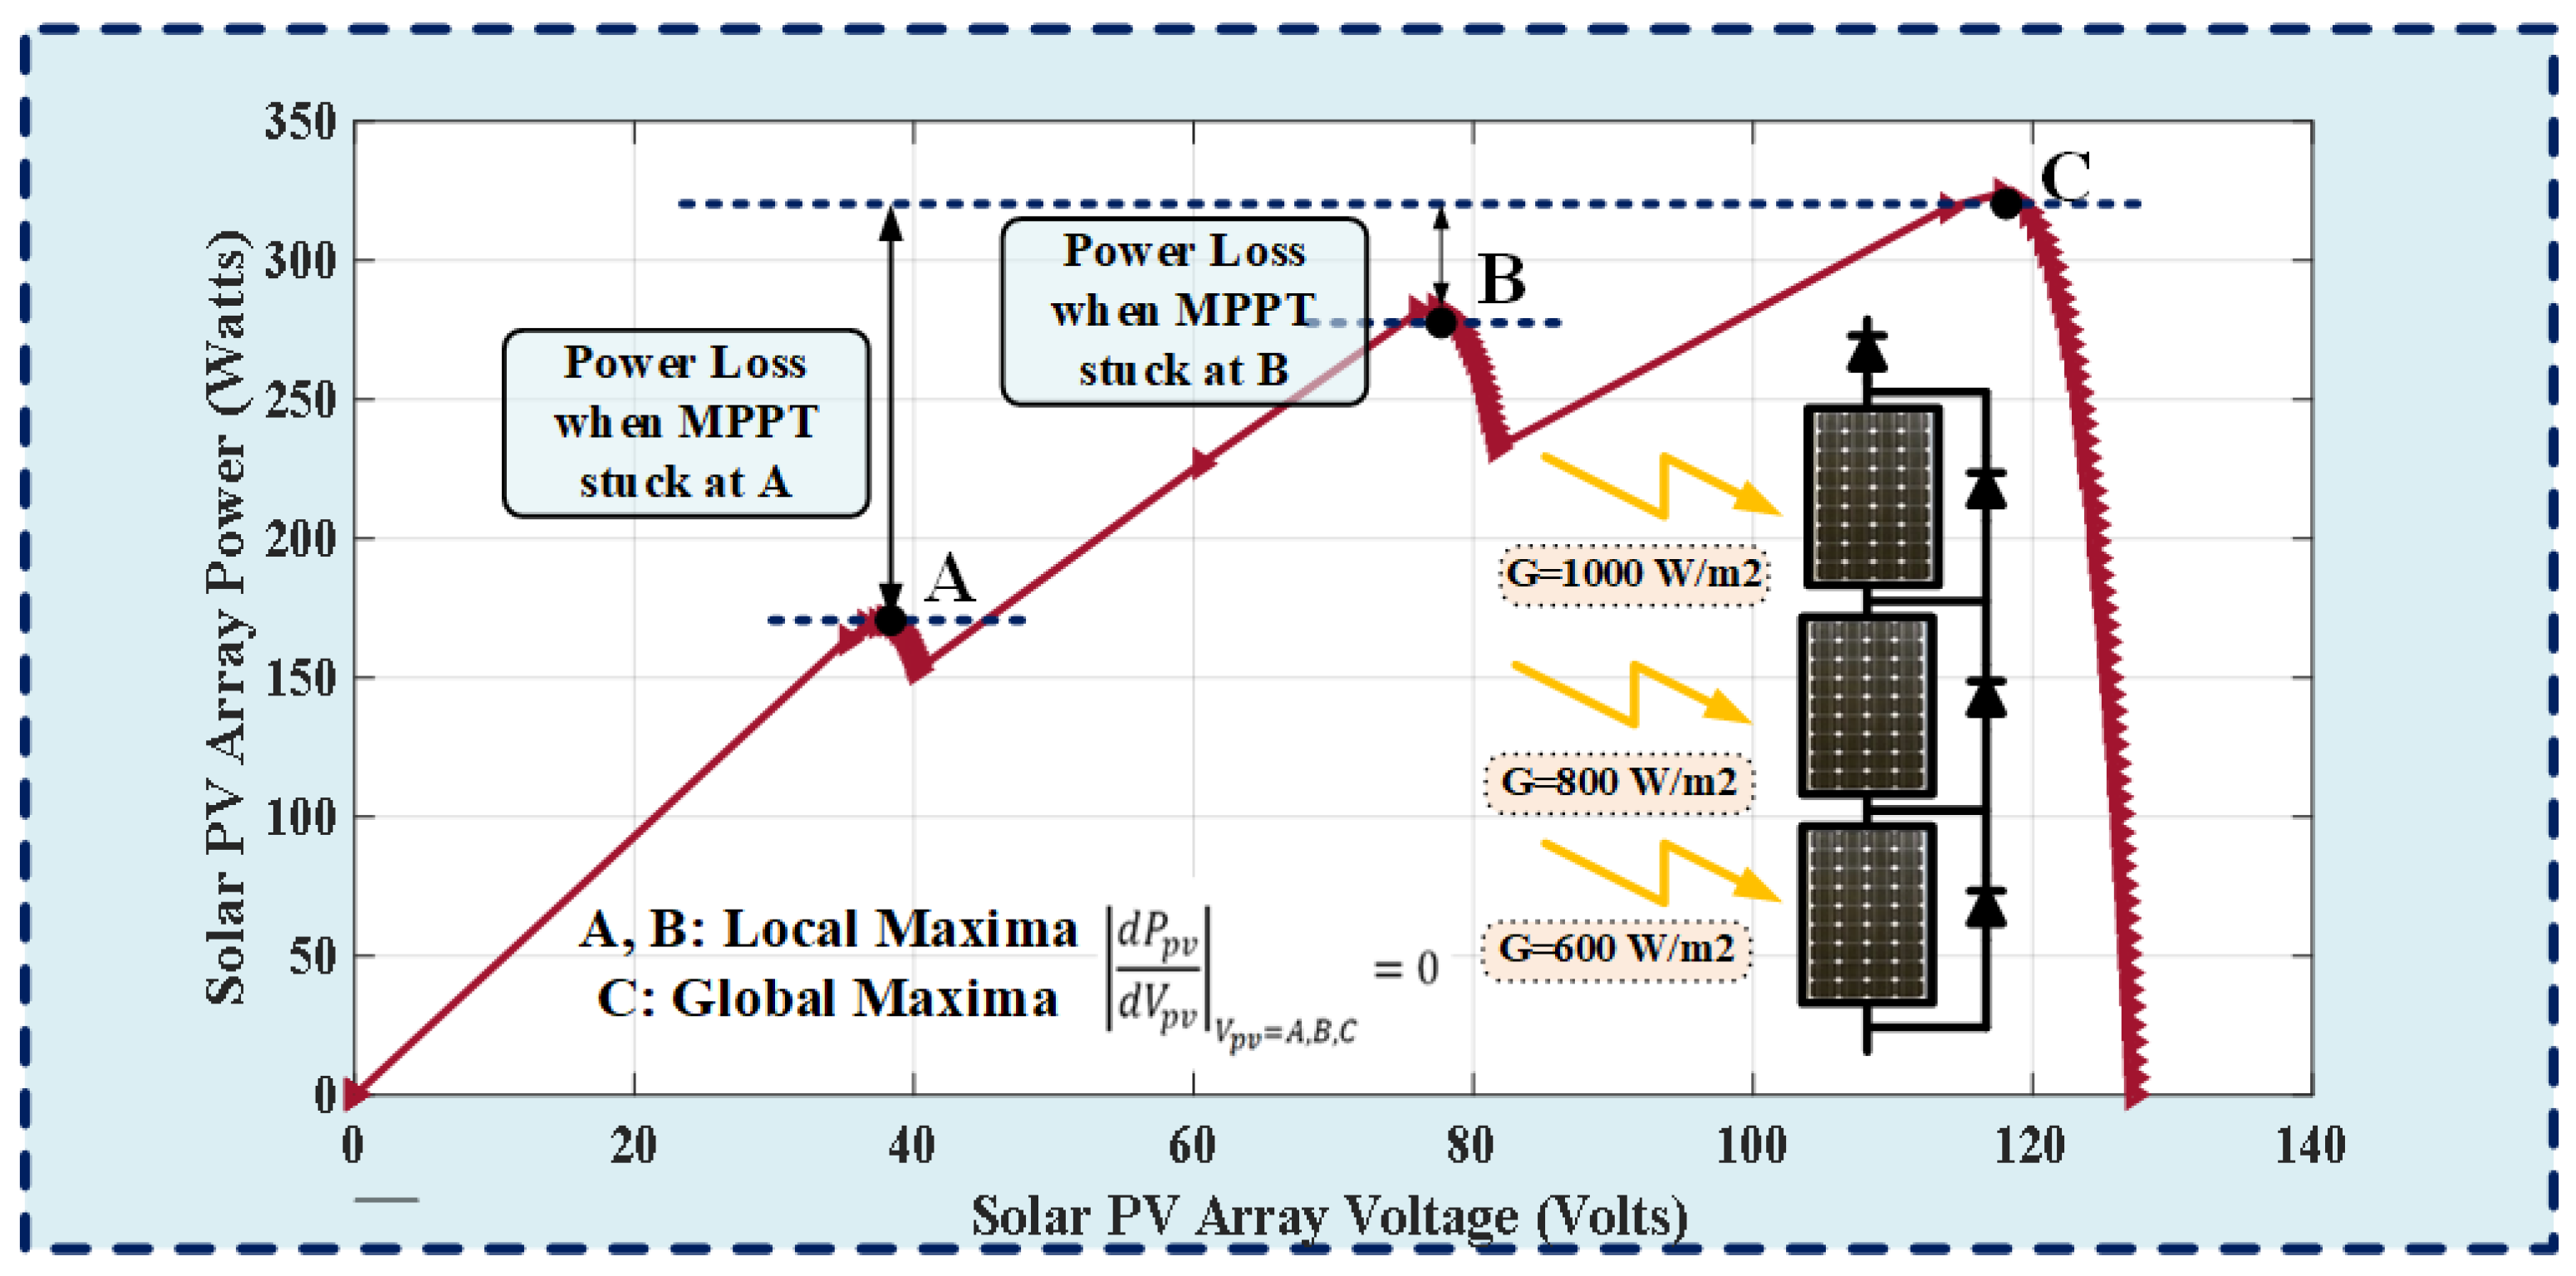
The shading issue arises because of clouds, dust, parts of trees, building structures, etc., causing concealment on the parts of the PV modules. It is regarded as one of the significant consideration factors during the installation of the photovoltaic framework. The shaded modules of the PV array receive less solar insolation than the unconcealed modules during partial shading conditions (PSC). Hence, the concealed PV cells absorb an excessive amount of electric power produced by the unshaded PV cells and, later, dissipate it in the form of heat. The heat generated may harm the shaded cells under specific conditions. Furthermore, PSC lead to the case of numerous peaks in the P–V characteristics of the PV module. Thus, to protect the concealed cells from damage, bypass diodes are employed across the PV modules to relieve the stress on the shaded cells [30].
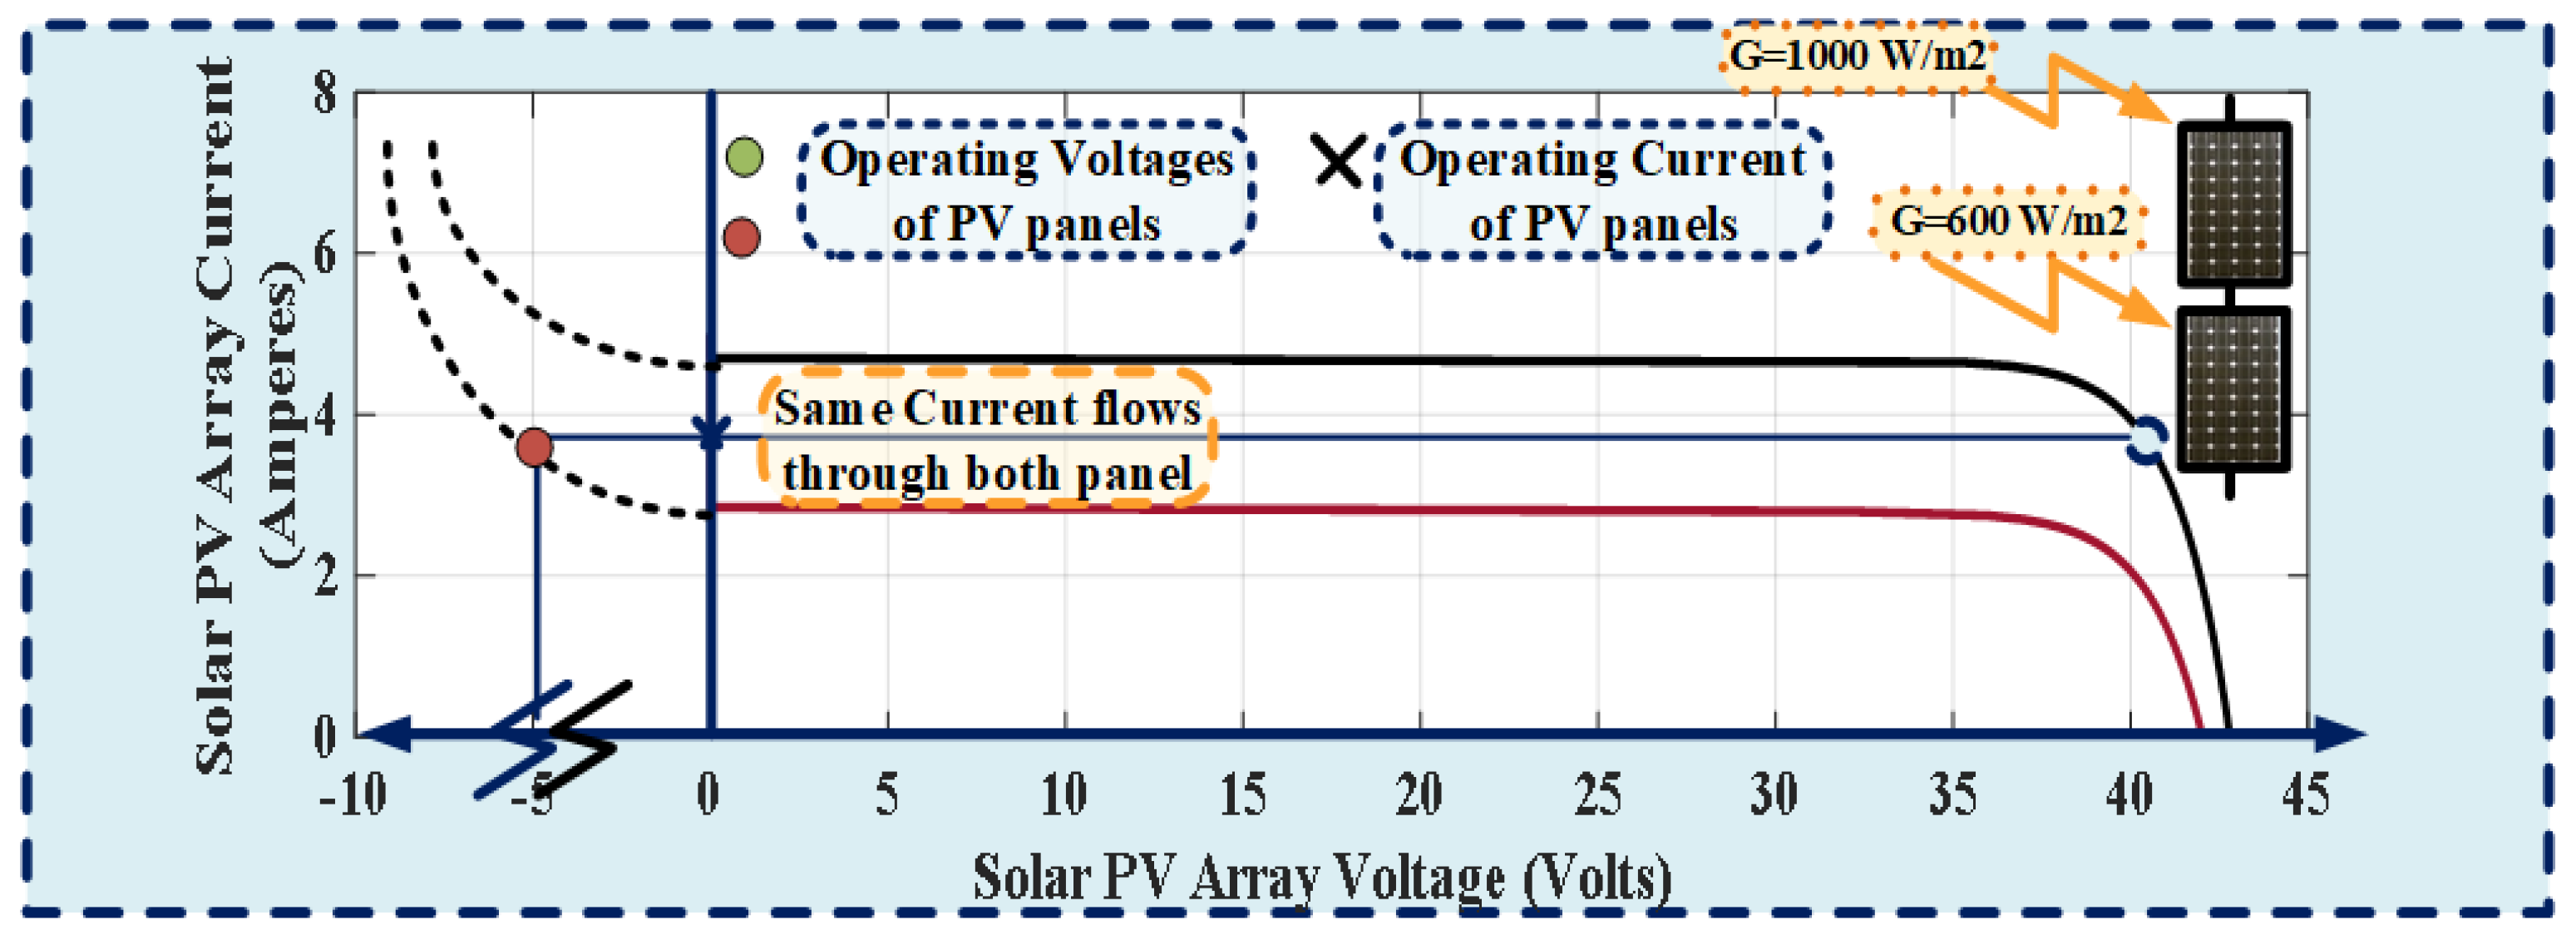
The power-versus-voltage curve and the current-versus-voltage graph of a PV module during PSC are depicted in Figure 6 and Figure 7, respectively. The partial shading operating condition is distinguished by the shading determinant and the count of the concealed modules. Thus, the impact of the uniform and non-uniform shading conditions differs on the conduct of PV panels. The short-circuit current under an even shading situation exhibits a negative linear correlation with percentage shading. Subsequently, the power yield of the PV module likewise diminishes straightly with shading. Nonetheless, the efficiency and fill factor of the PV module remain unaffected by shading [31].
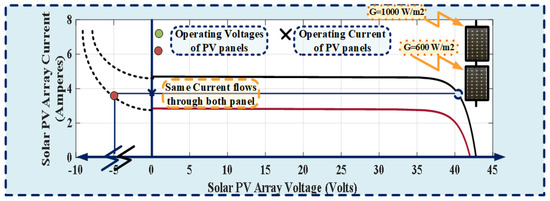
Figure 6.
I–V plot characteristics of a solar cell under the PSC.
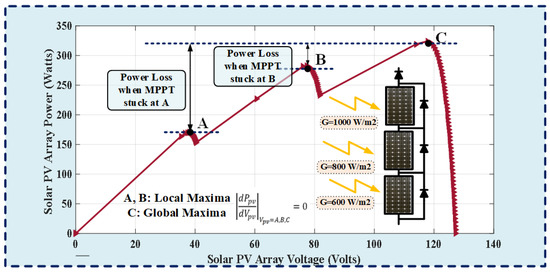
Figure 7.
P–V plot characteristics of a PV cell under the PSC.
4. Jellyfish Search Optimization Method
The jellyfish search optimization (JSO) strategy is a metaheuristic algorithm inspired by the behavior of jellyfish. The JSO was proposed by Chou and Troung in 2021 [28].
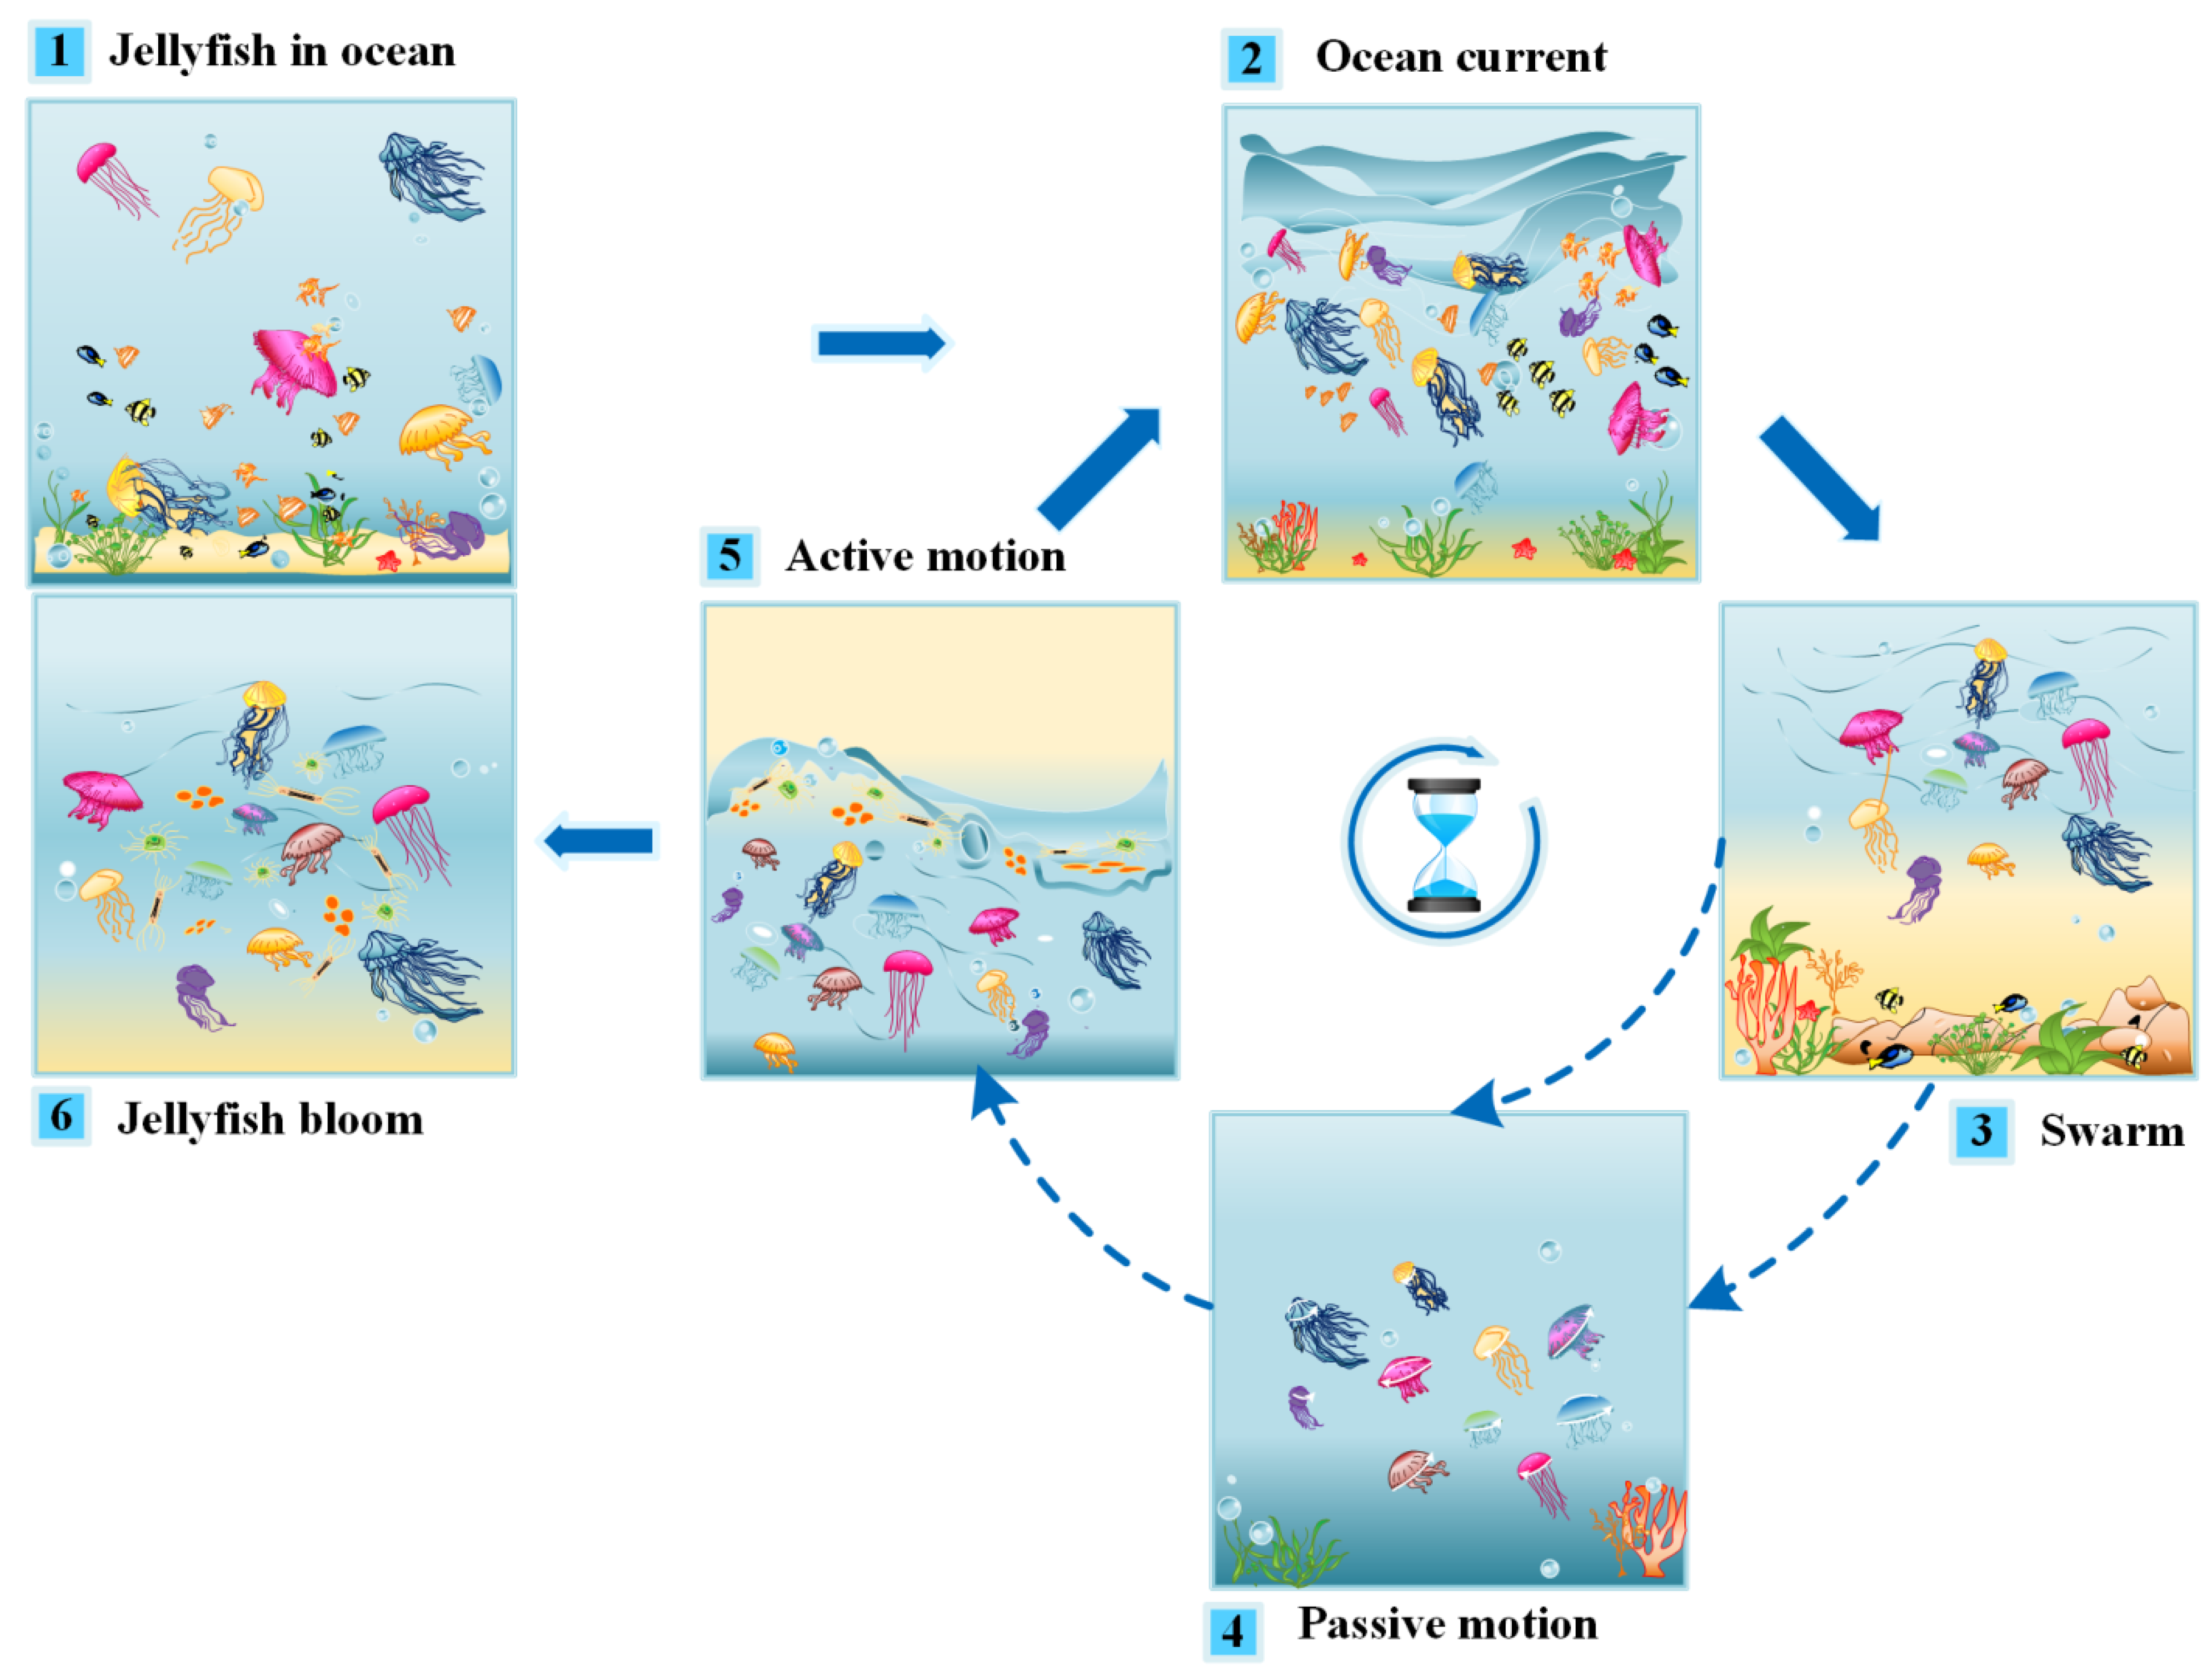
The food search process of jellyfish comprises the following movements:
- The jellyfish’s own movement within the swarm.
- Pursuing the ocean current to develop jellyfish bloom.
- The motions of jellyfish in the ocean are illustrated in Figure 8. The JSO algorithm considers the succeeding idealized principles:
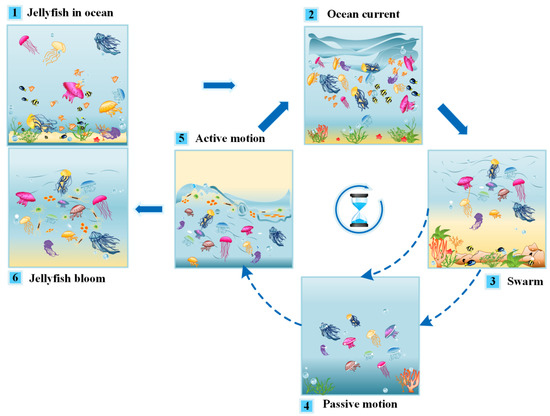 Figure 8. Jellyfish’s conduct in the ocean.
 - The time control procedure administers switching between the two advanced movements of the jellyfish (i.e., the movements inside the swarm and following the ocean flow).
- Jellyfish are more drawn to areas where the accessible amount of food is more significant.
- The measure of food found is controlled by the location and its related target function.
Initially, JSO strategy implementation involves random initialization to distribute the solutions inside the search span of the given issue. Later, each solution is scrutinized, and, thus, the location with the best fitness value is picked as the abundant source of food. From that point onward, the movement of each jellyfish is refreshed either towards the ocean flow or towards advancement inside the swarm per the time control component.
4.1. Ocean Current
Jellyfish are drawn to ocean currents as these hold lots of nutrients. The course of the ocean current () is controlled by averaging the vectors of each jellyfish in the ocean to the jellyfish, which holds the present best location. Mathematically, is computed as:
where signifies the jellyfish having a current-best position in the whole population; N stands for the total count of the jellyfish; indicates the attraction coefficient; indicates the mean position of the jellyfish swarm. Let:
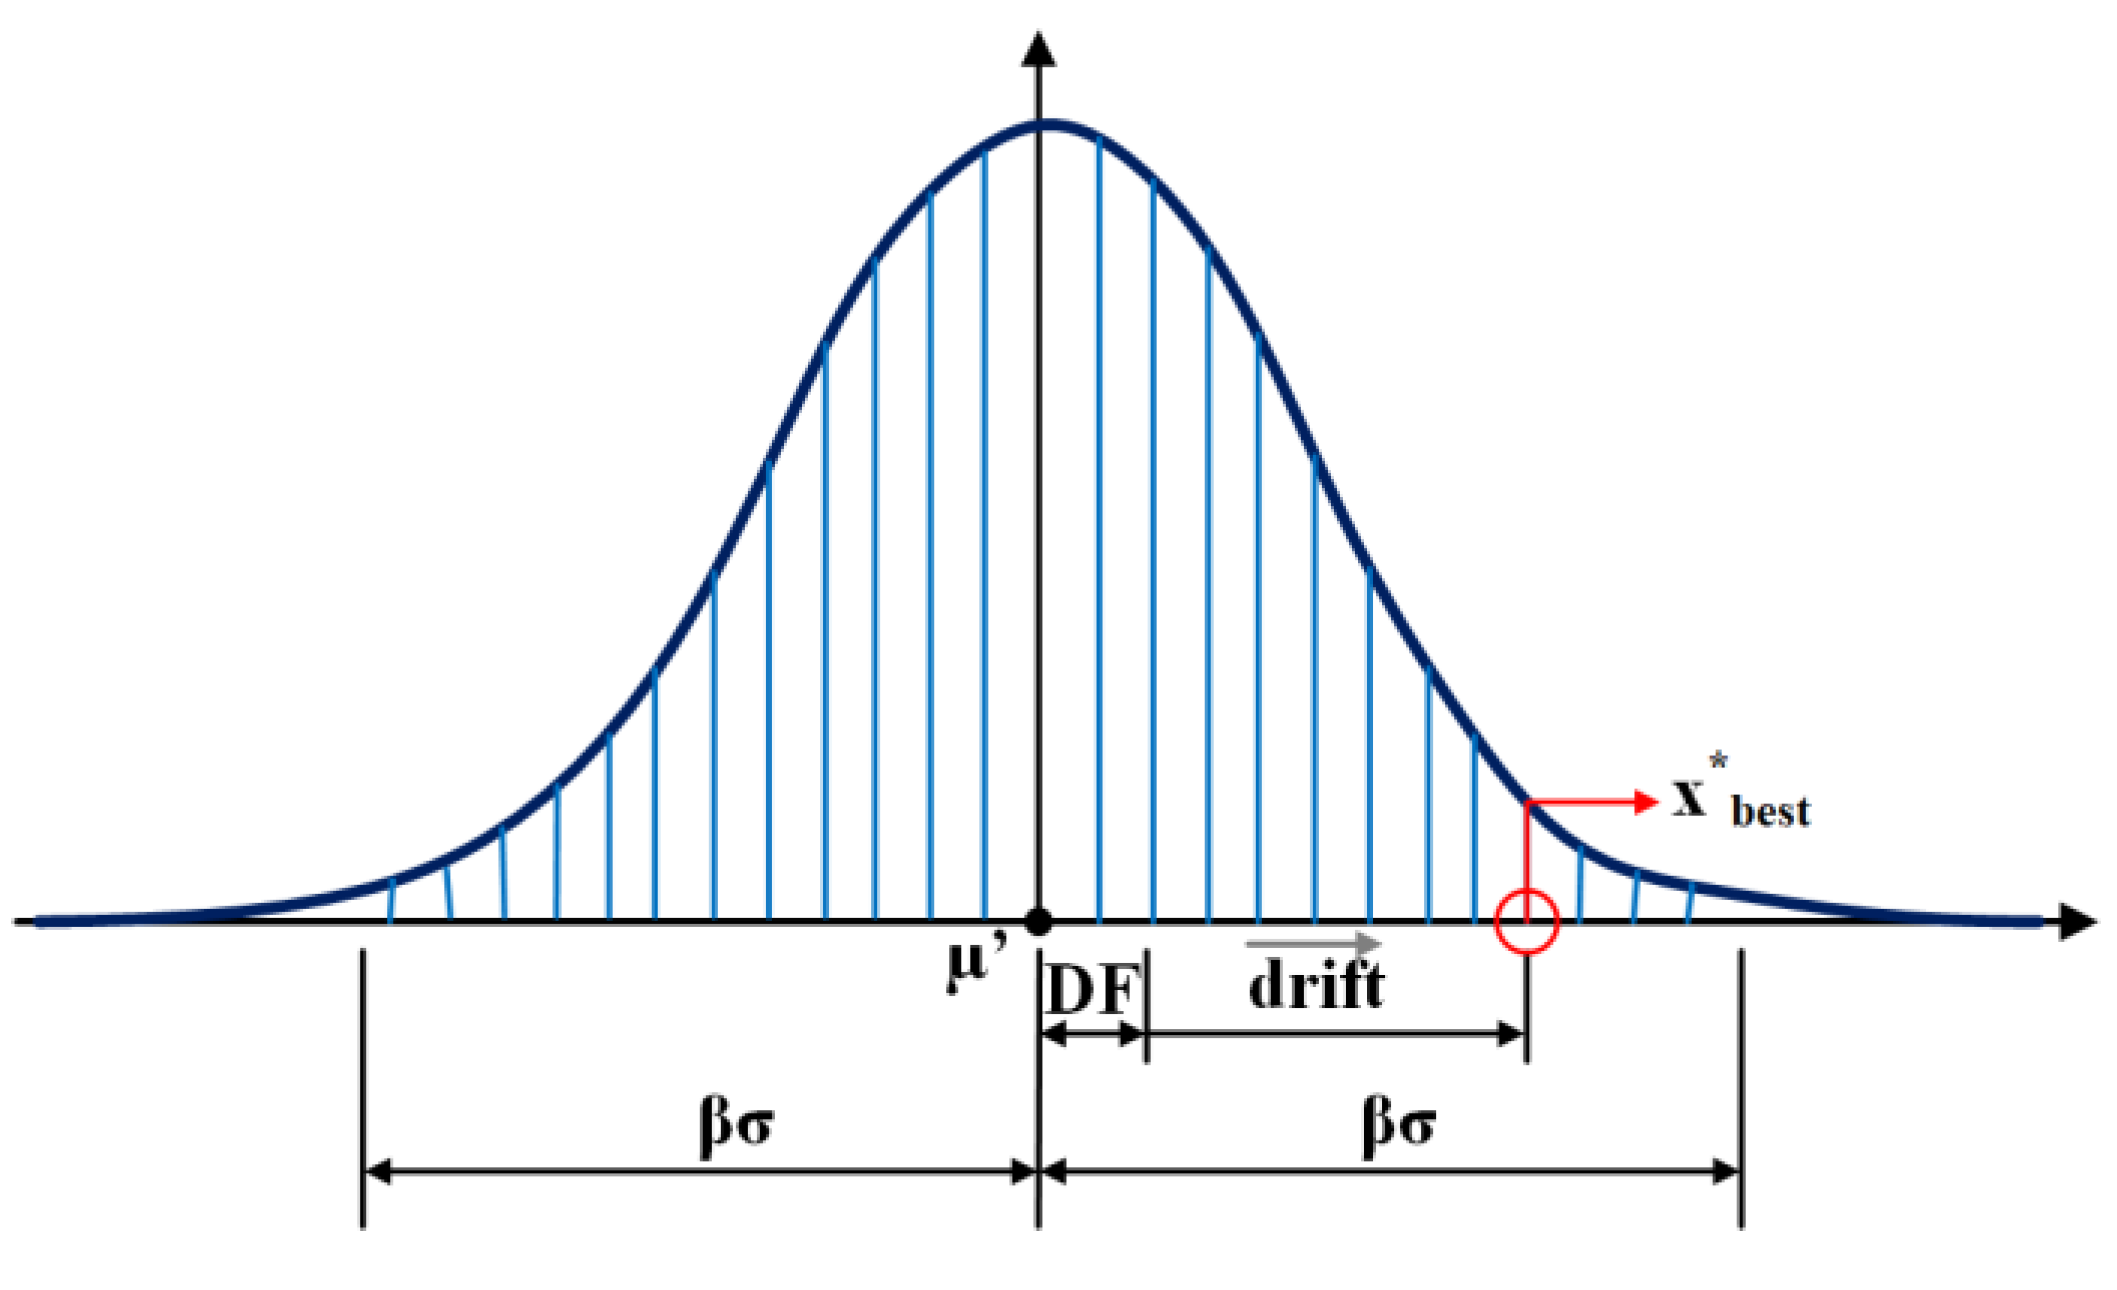
Here, DF represents the difference between the current best location of the jellyfish in the interest and the mean location of the swarm. The author in [28] assumed the standard spatial distribution of the jellyfish in all dimensions, which provides the probability of all jellyfish positions. By this distribution, each jellyfish location lies within the distance of ±βσ. Here, denotes the distribution coefficient, and it is taken as ‘3’ per the analysis given in [22], whereas σ indicates the standard deviation for the considered distribution and can be computed using Equation (11) around the mean location of the swarm, as portrayed in Figure 9. Thus,
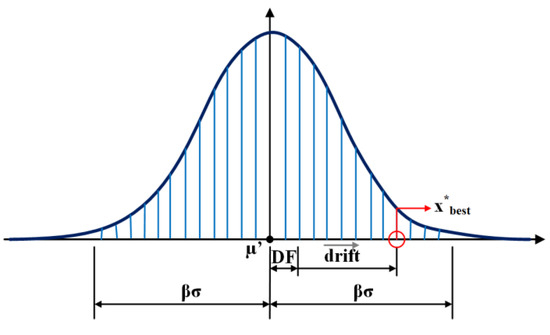
Figure 9.
Spatial distribution of jellyfish in the ocean.
Hence, drift can be mathematically represented as:
Thus, the updated position of each jellyfish is calculated as:
where represents the position of the jellyfish at time,t. Time,t, is equivalent to iteration in the algorithm.
4.2. Jellyfish Swarm
A large mass of jellyfish in the ocean is termed a swarm. In a swarm, jellyfish movement is categorized into active (type B) and passive (type A). Jellyfish exhibit type A (i.e., passive) motion during the formation of the swarm. In this type of motion, the jellyfish move around their own location and subsequently update the position of each jellyfish, per Equation (14). Eventually, the jellyfish simulate the type B movement:
where γ stands for the movement coefficient, which relates to the length of movement around the jellyfish’s position, and γ is taken as (0.1), as per the mathematical examination performed by the author in [28]. and denote the lower and upper bounds in the search zone, respectively.
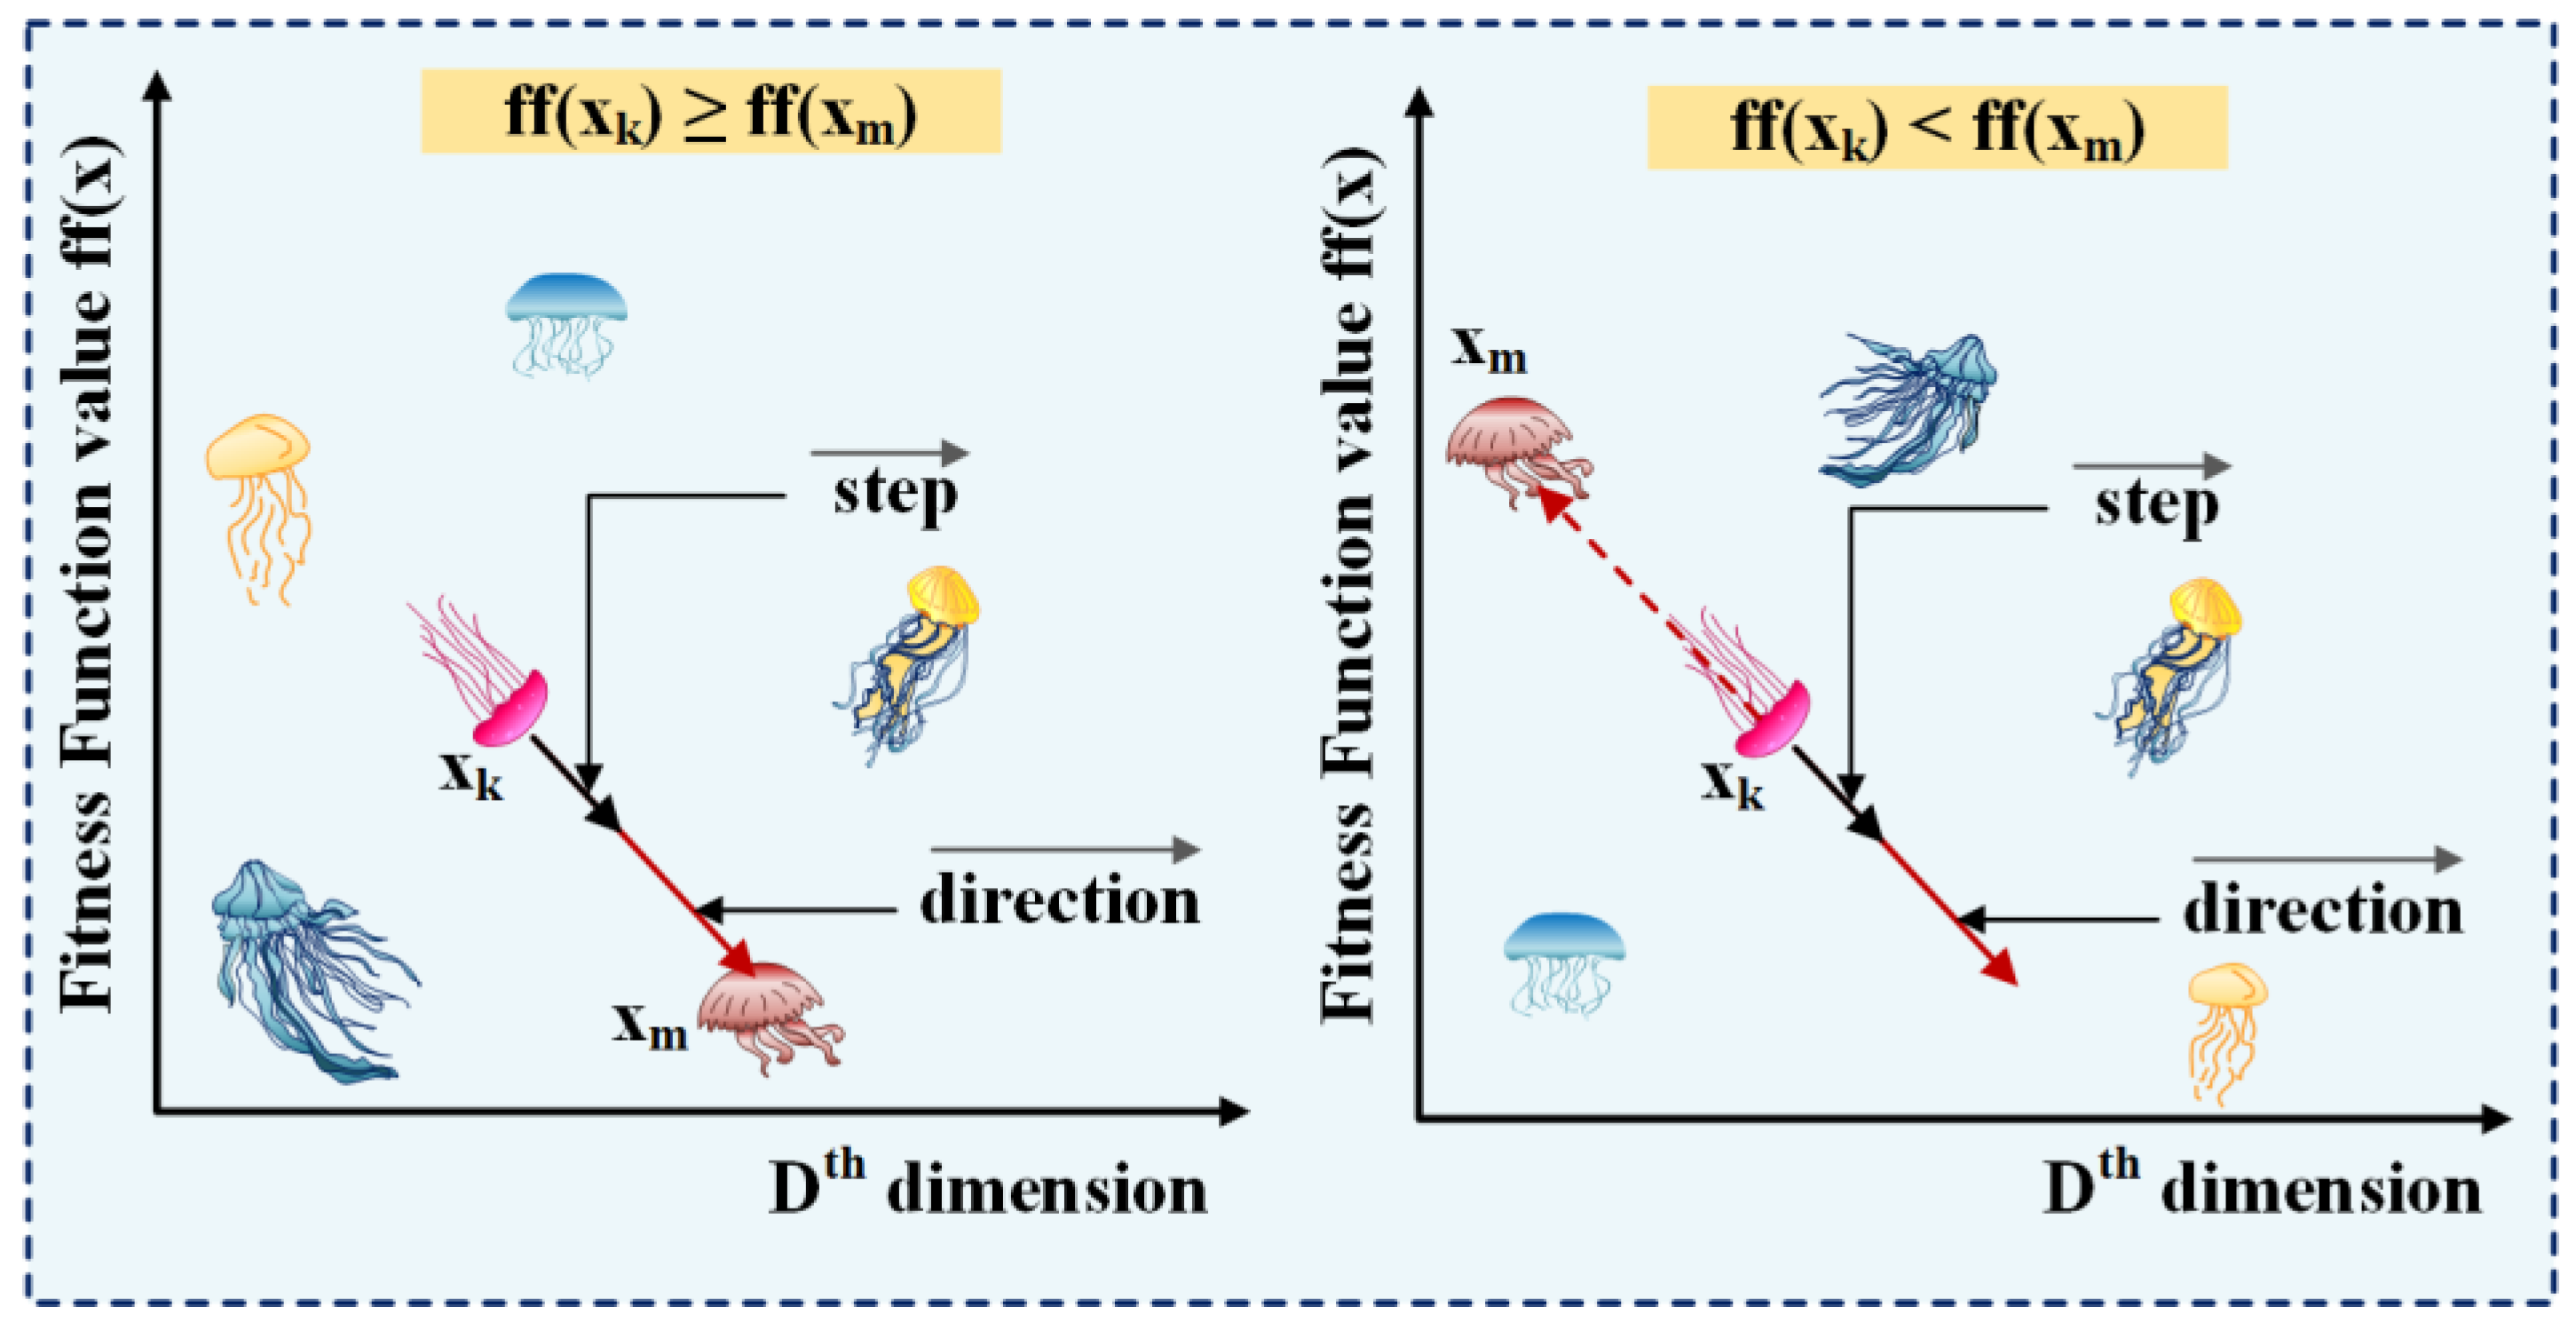
Type B motion involves the random selection of a jellyfish (m) other than the current jellyfish in interest. Afterward, a vector, which decides the jellyfish route, is drawn from the jellyfish (k) in interest to the randomly selected jellyfish (m). The direction of movement is chosen in correspondence to the amount of food present at the jellyfish (m) location. If the quantity of the food present at the jellyfish (m) position exceeds the food present at the position of jellyfish (k), then the latter progresses in the direction of the former, while if the food is less at the mth jellyfish place, then the jellyfish moves away from the former jellyfish. Hence, in this way, each jellyfish steps towards a better solution to discover the best food location in the swarm, as illustrated in Figure 10. The direction of movement and the updated position of a jellyfish is mathematically depicted as per Equations (15) and (18), respectively.
where ‘ff’ represents the fitness function.
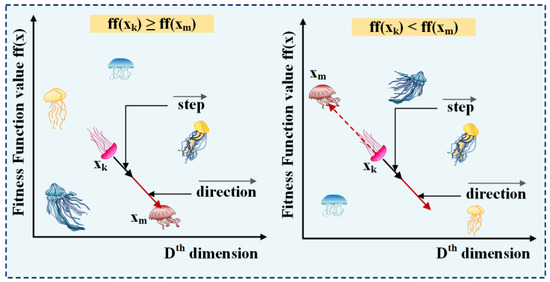
Figure 10.
Jellyfish movement inside the swarm.
Since,
4.3. Time Control Component
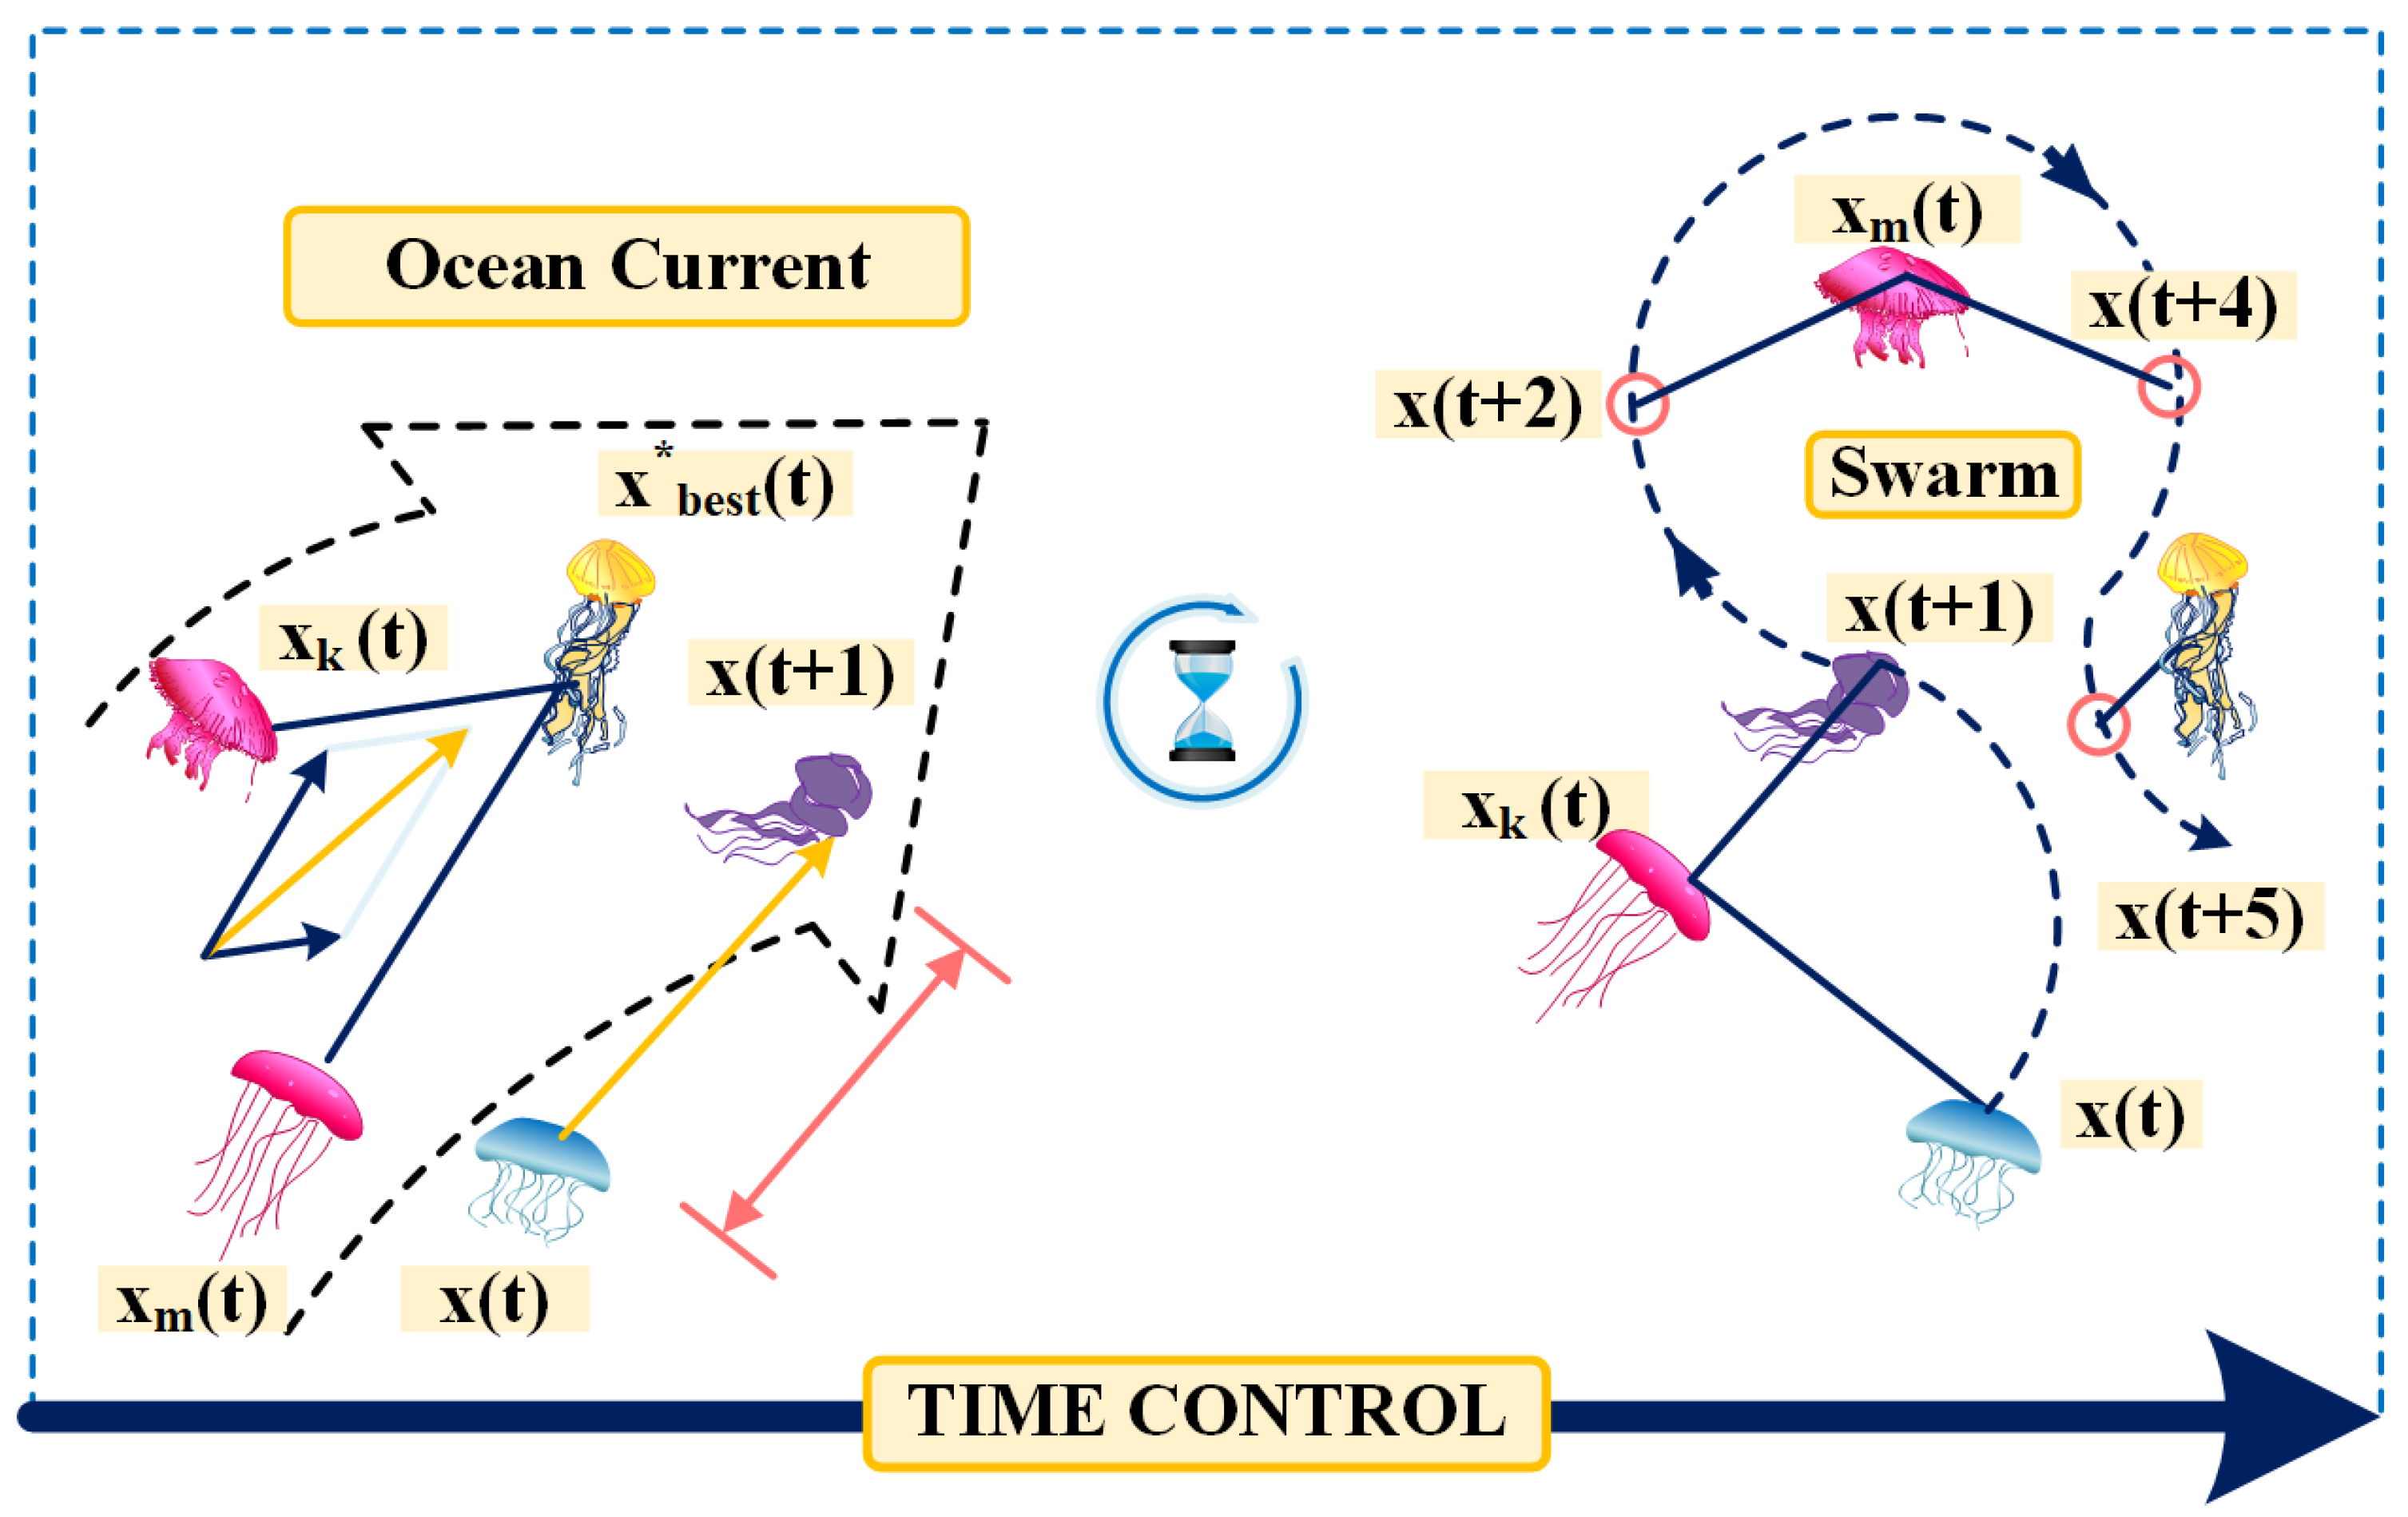
A time control mechanism is employed to determine the type of motion performed by jellyfish [32]. The time component regulates both movements, i.e., the movement of jellyfish within the swarm (i.e., type A and type B motion) and towards the ocean flow [33]. The schematic diagram of the time control mechanism is shown in Figure 11.
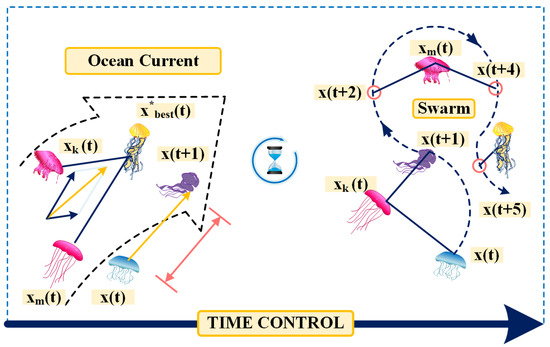
Figure 11.
Time control mechanism followed by jellyfish.
The time control mechanism utilizes a threshold constant, (), and time control function, (), that varies randomly from 0 to 1 to control the movement selection. The time control component is mathematically formulated in Equation (19).
where indicates the maximum iteration count.
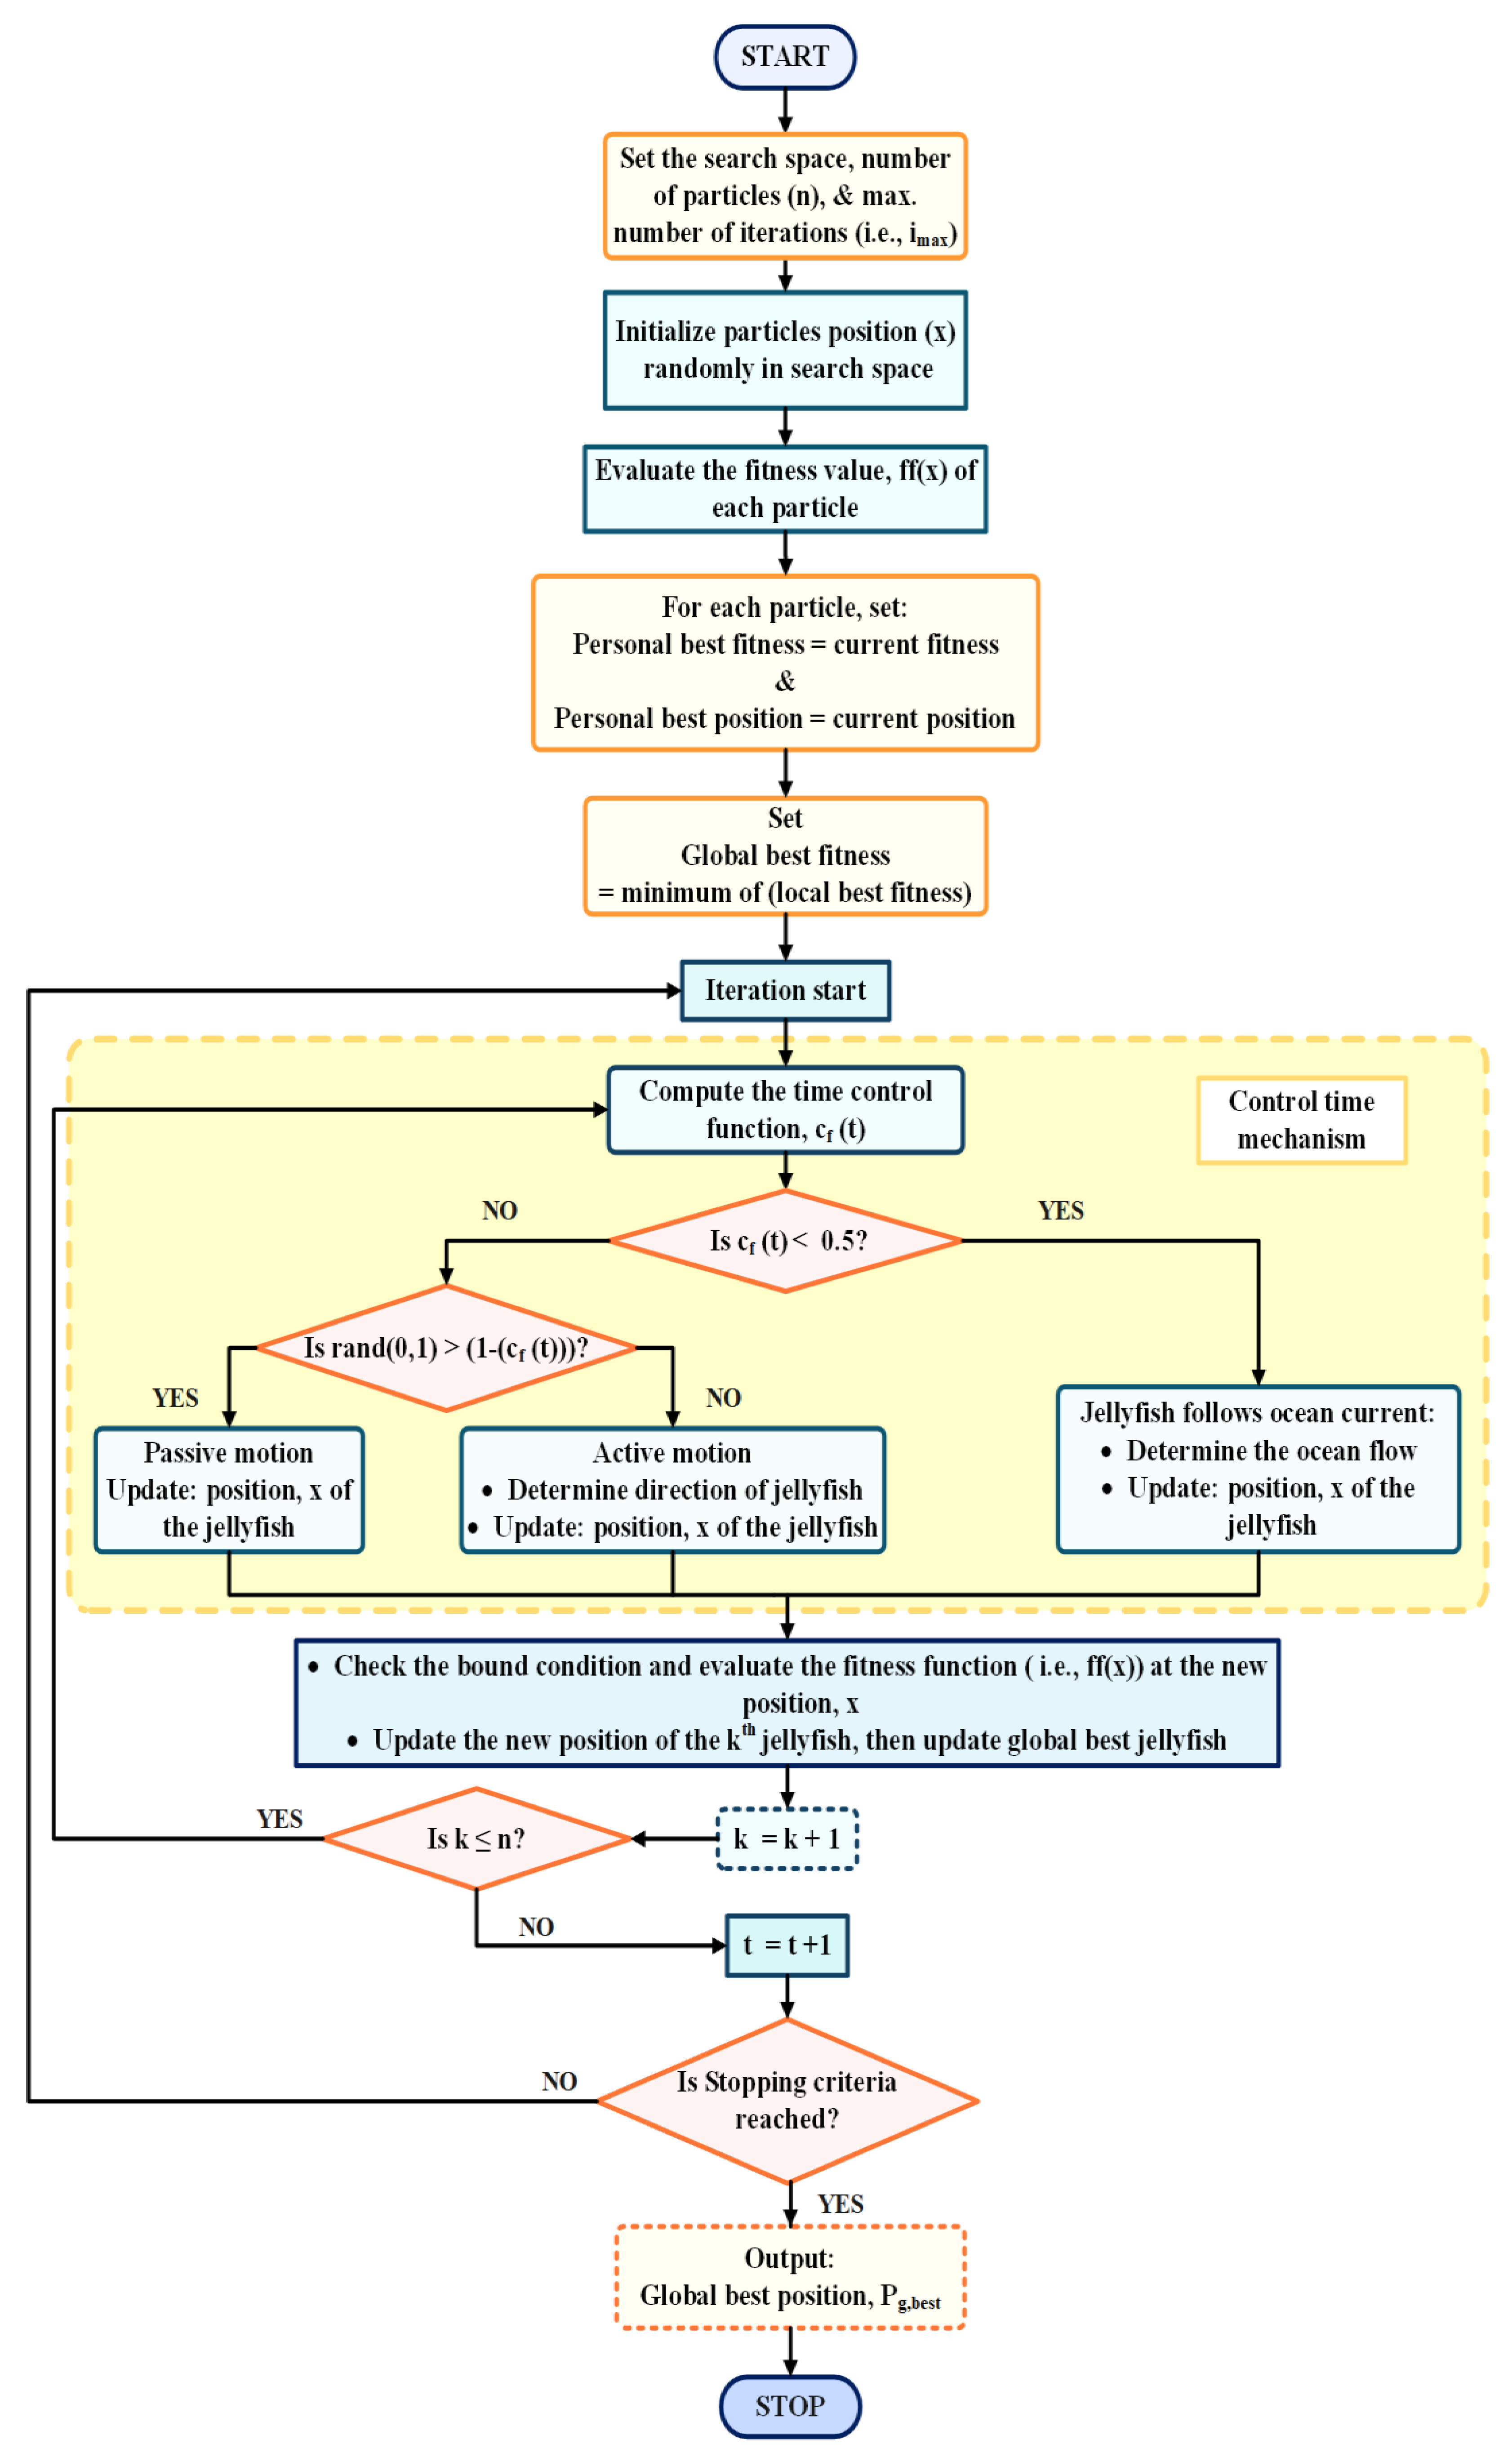
Here, is taken as a mean of zero and one (i.e., 0.5). When the value surpasses the value, then the jellyfish follows the ocean flow; otherwise, the jellyfish progress within the jellyfish bloom. Similarly, a time-controlled pseudo-code, (), is employed to mimic the motion of the jellyfish inside the swarm (i.e., type A and type B motion). Thus, when the () value is lower than rand(0, 1), a jellyfish shows type A movement; otherwise, it shows type B motion. Since, over time, the value of ( rises from zero to one, the likelihood of is higher than that of . For that reason, initially, type A motion is more favored than type B motion. However, as time passes, type B movement is more common than type A. The flowchart of the JSO strategy is illustrated in Figure 12.
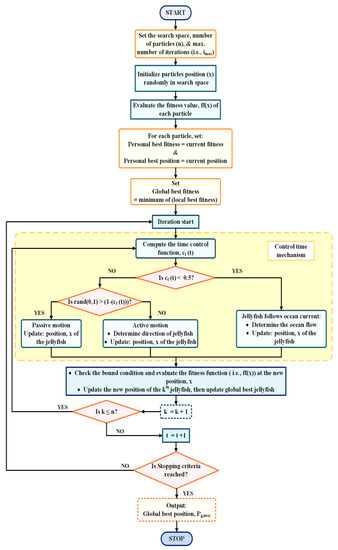
Figure 12.
Flowchart of the JSO strategy.
5. Performance of Jellyfish Search Optimization Algorithm for MPPT
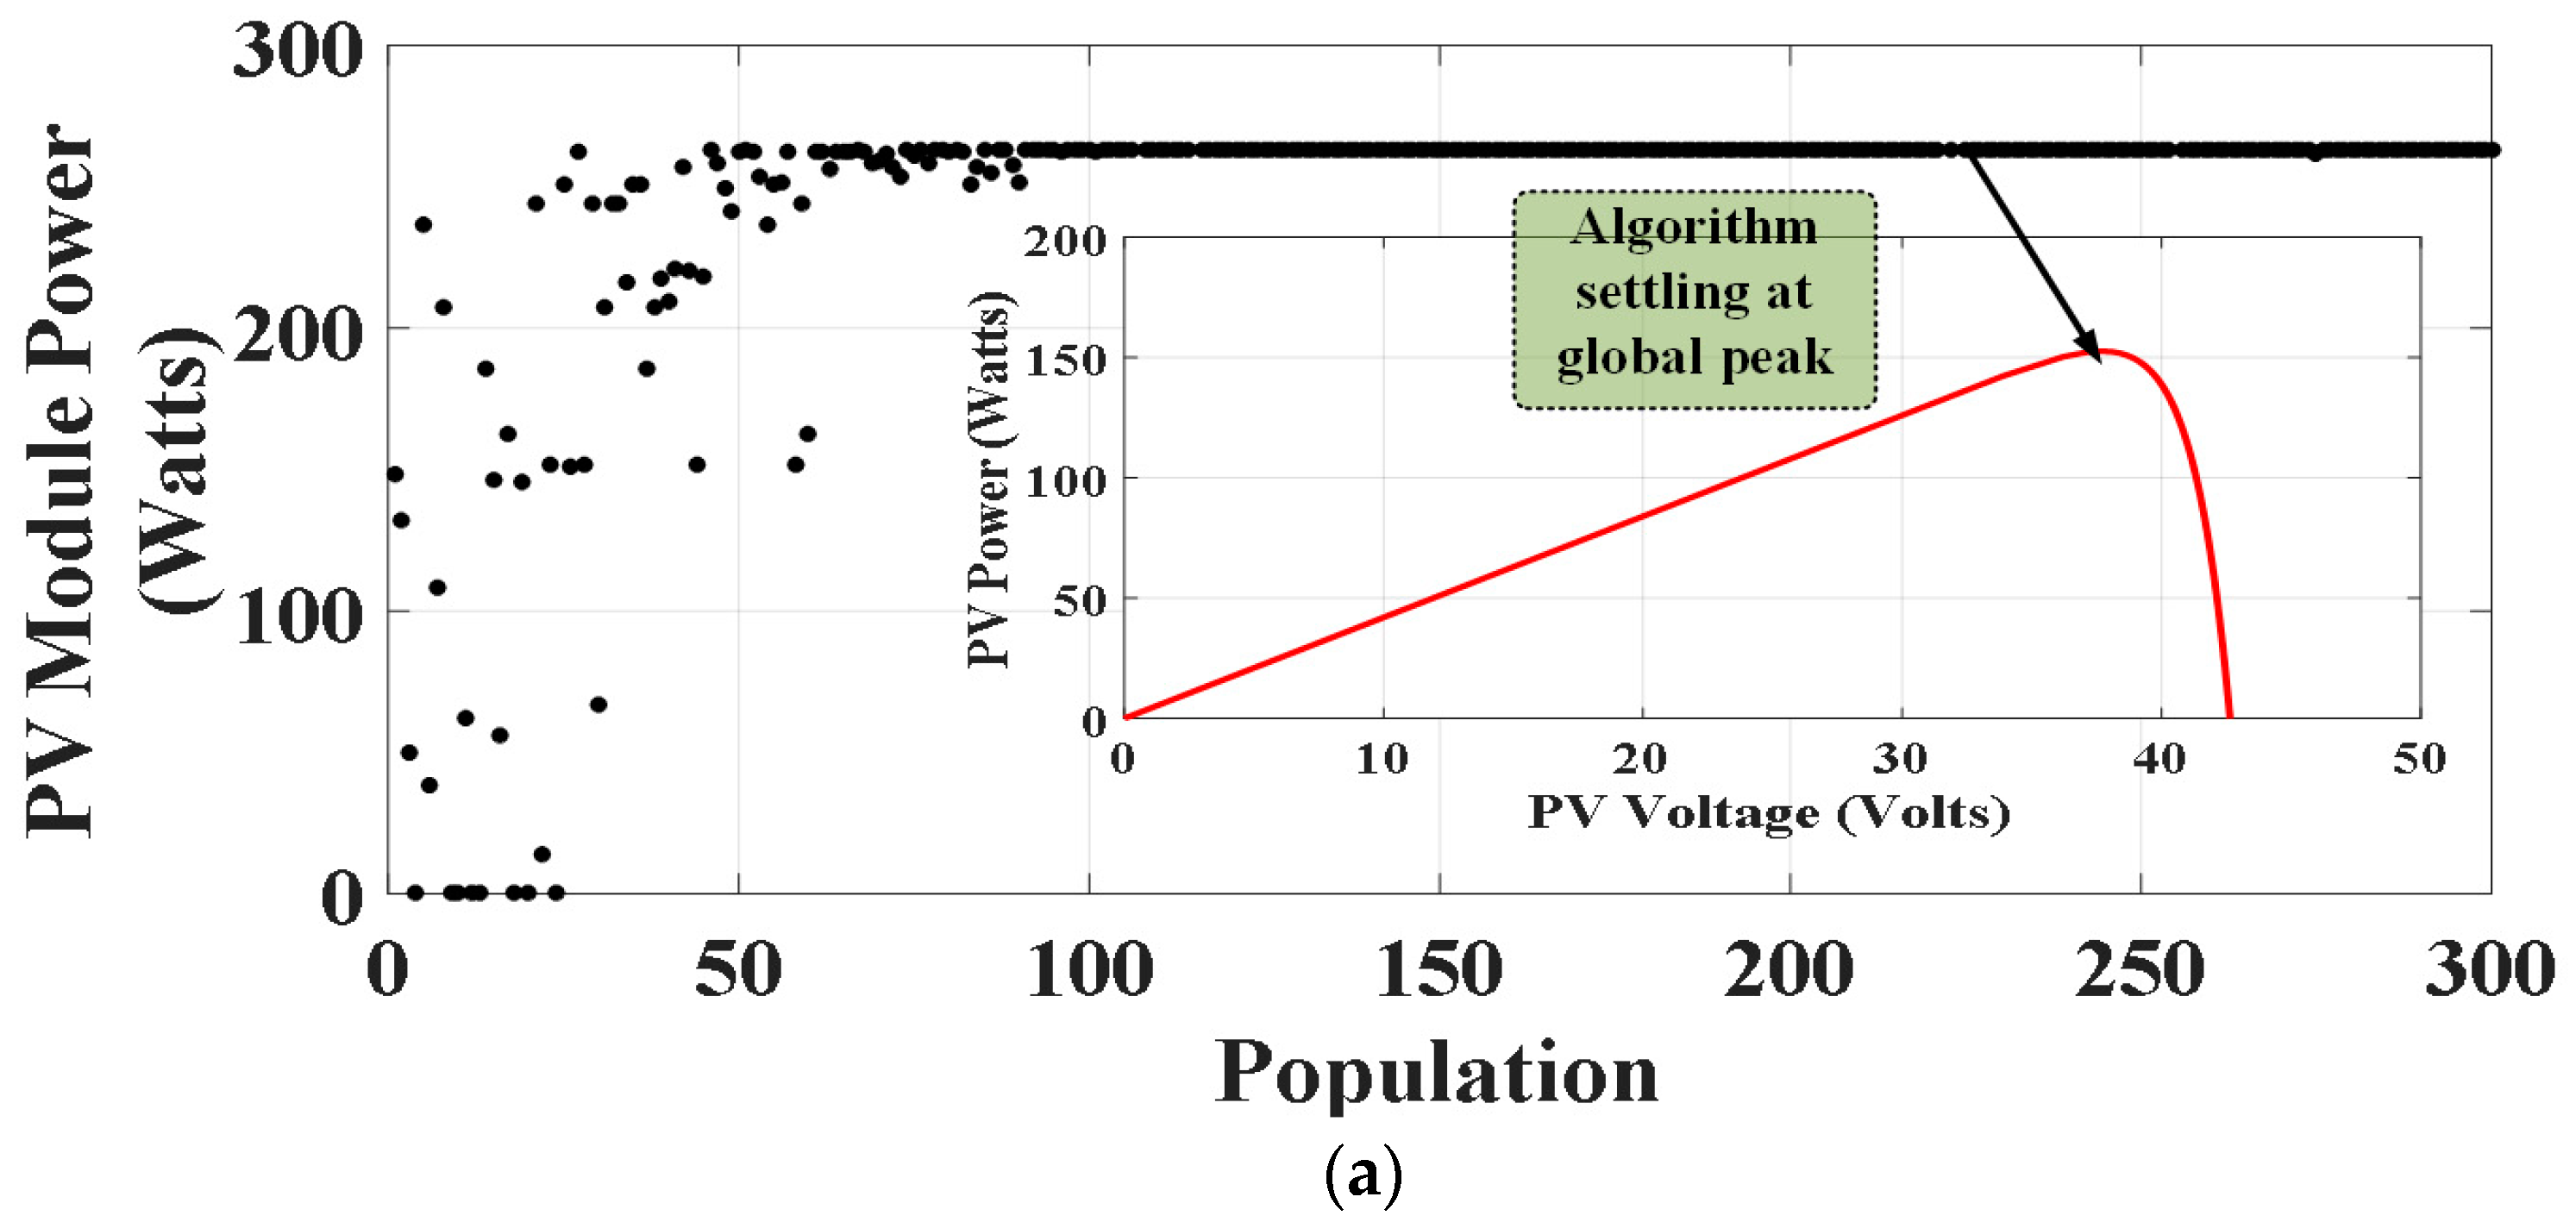
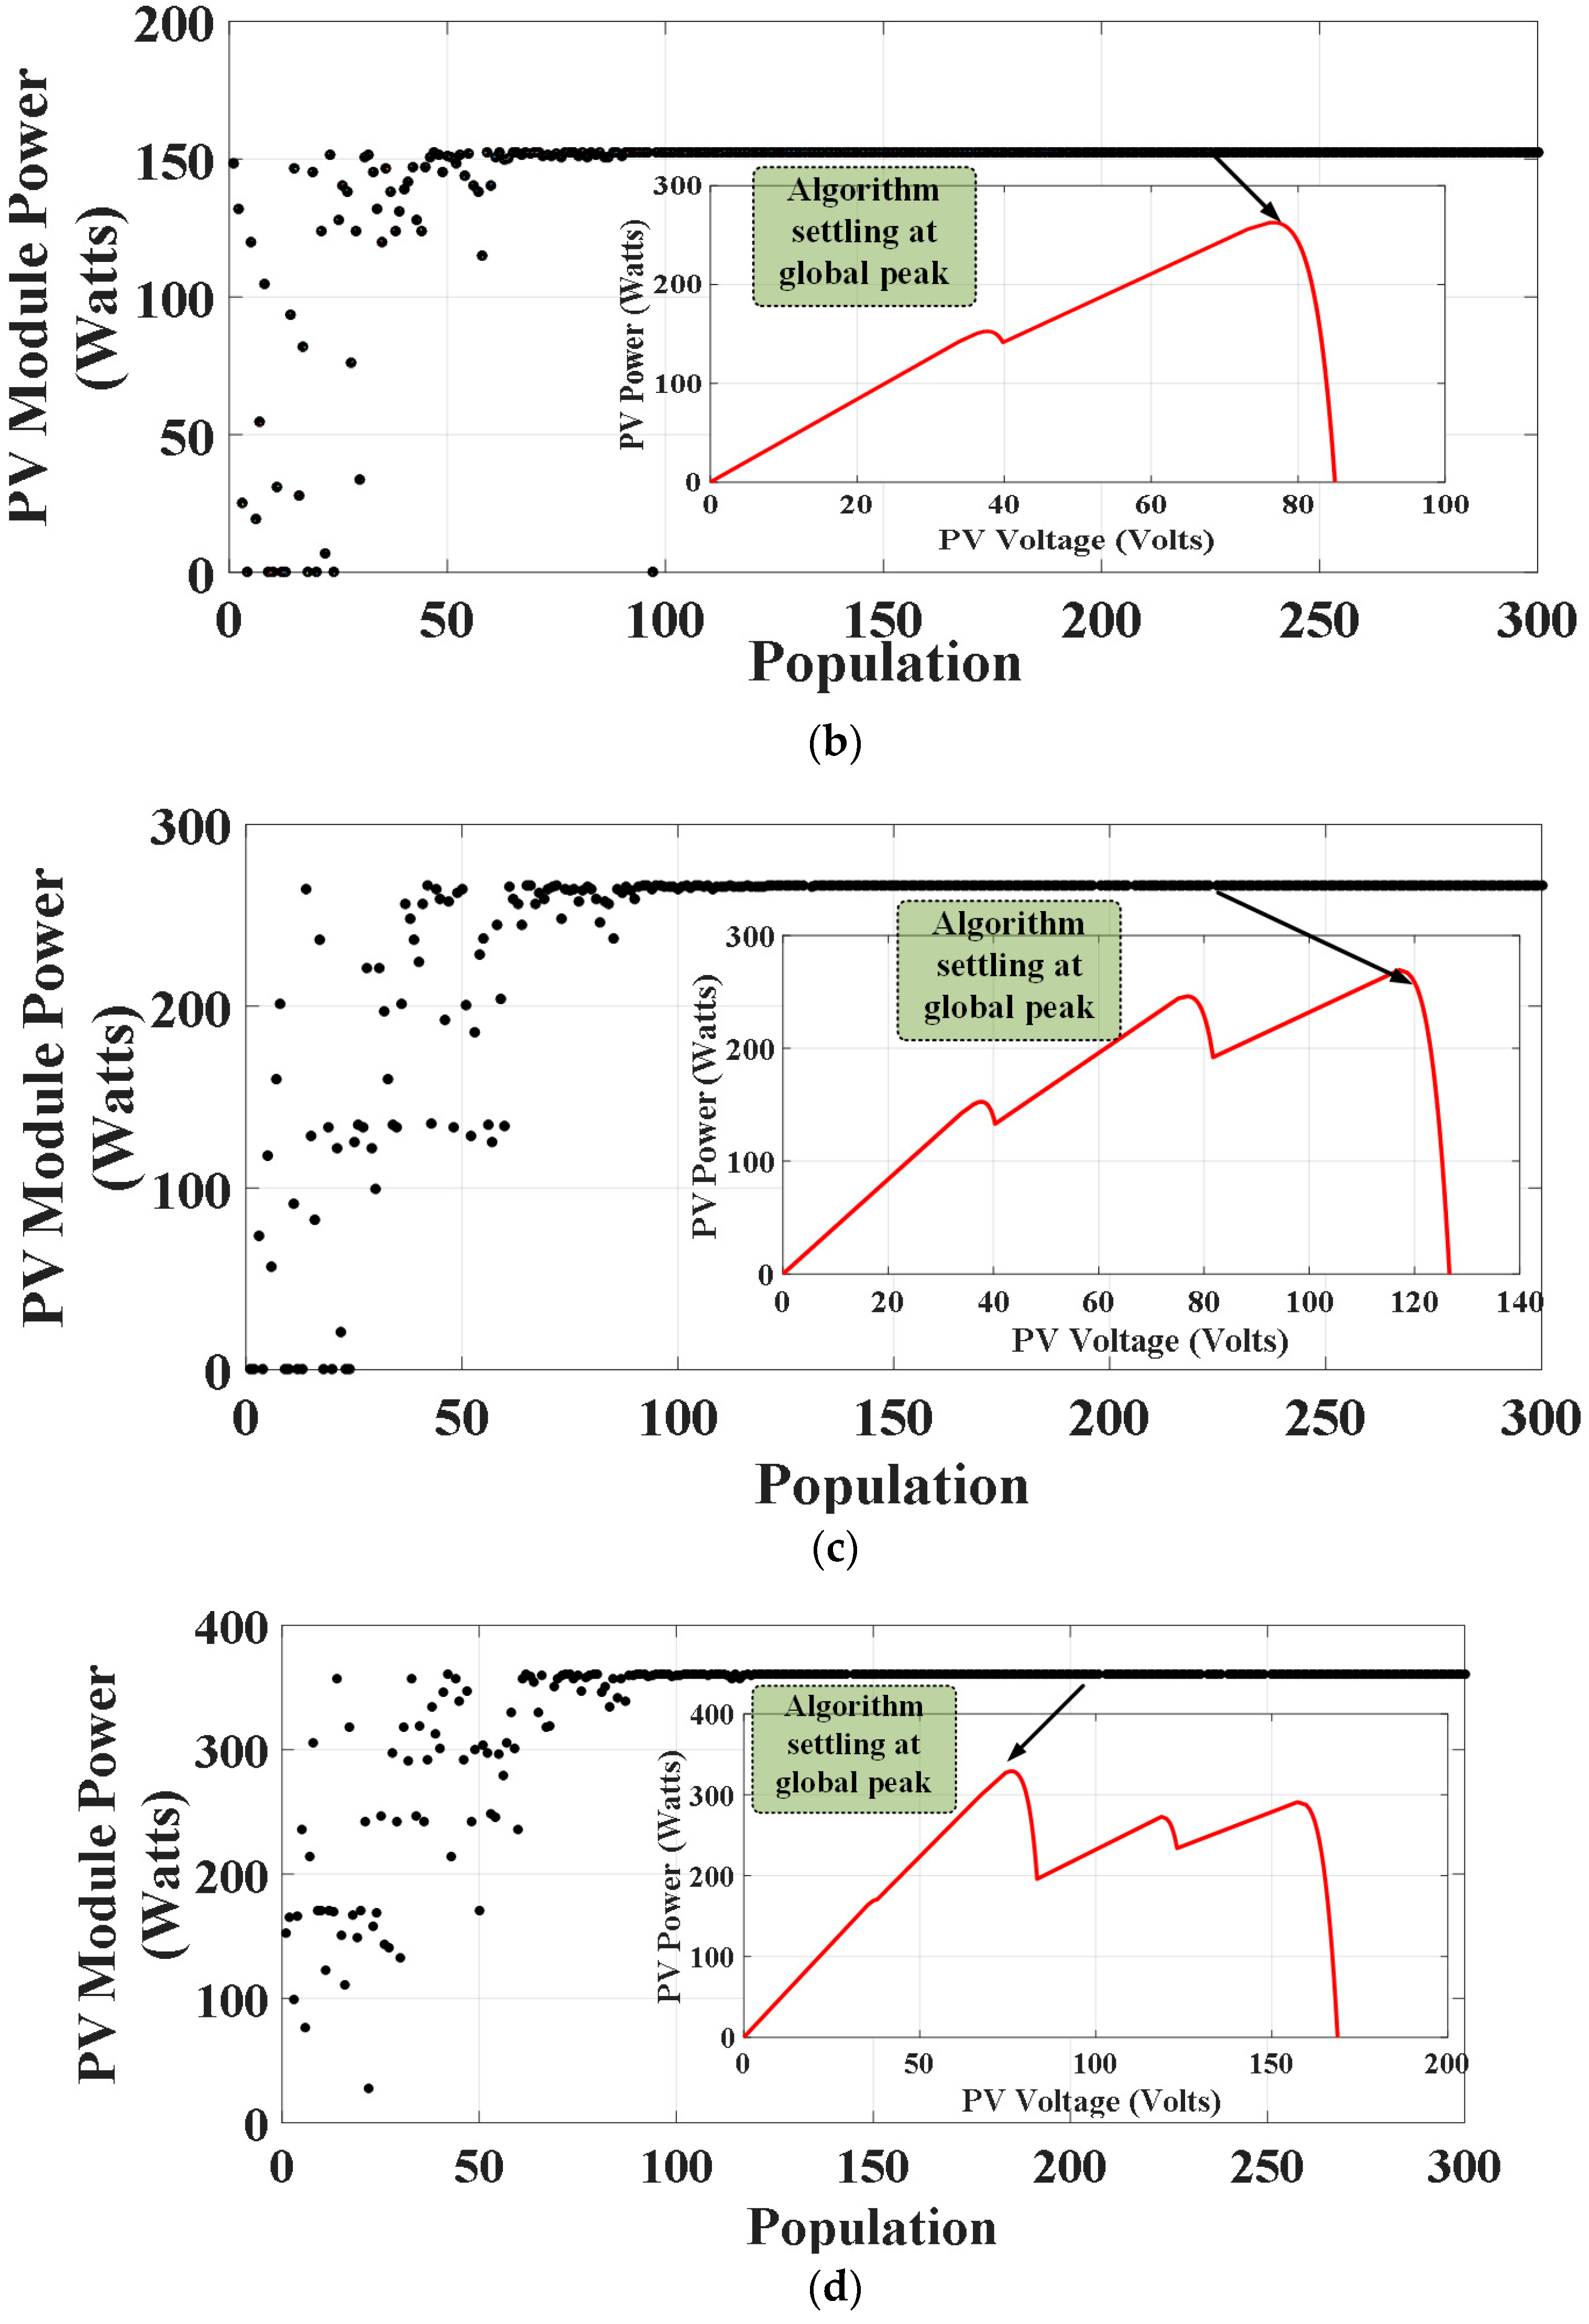
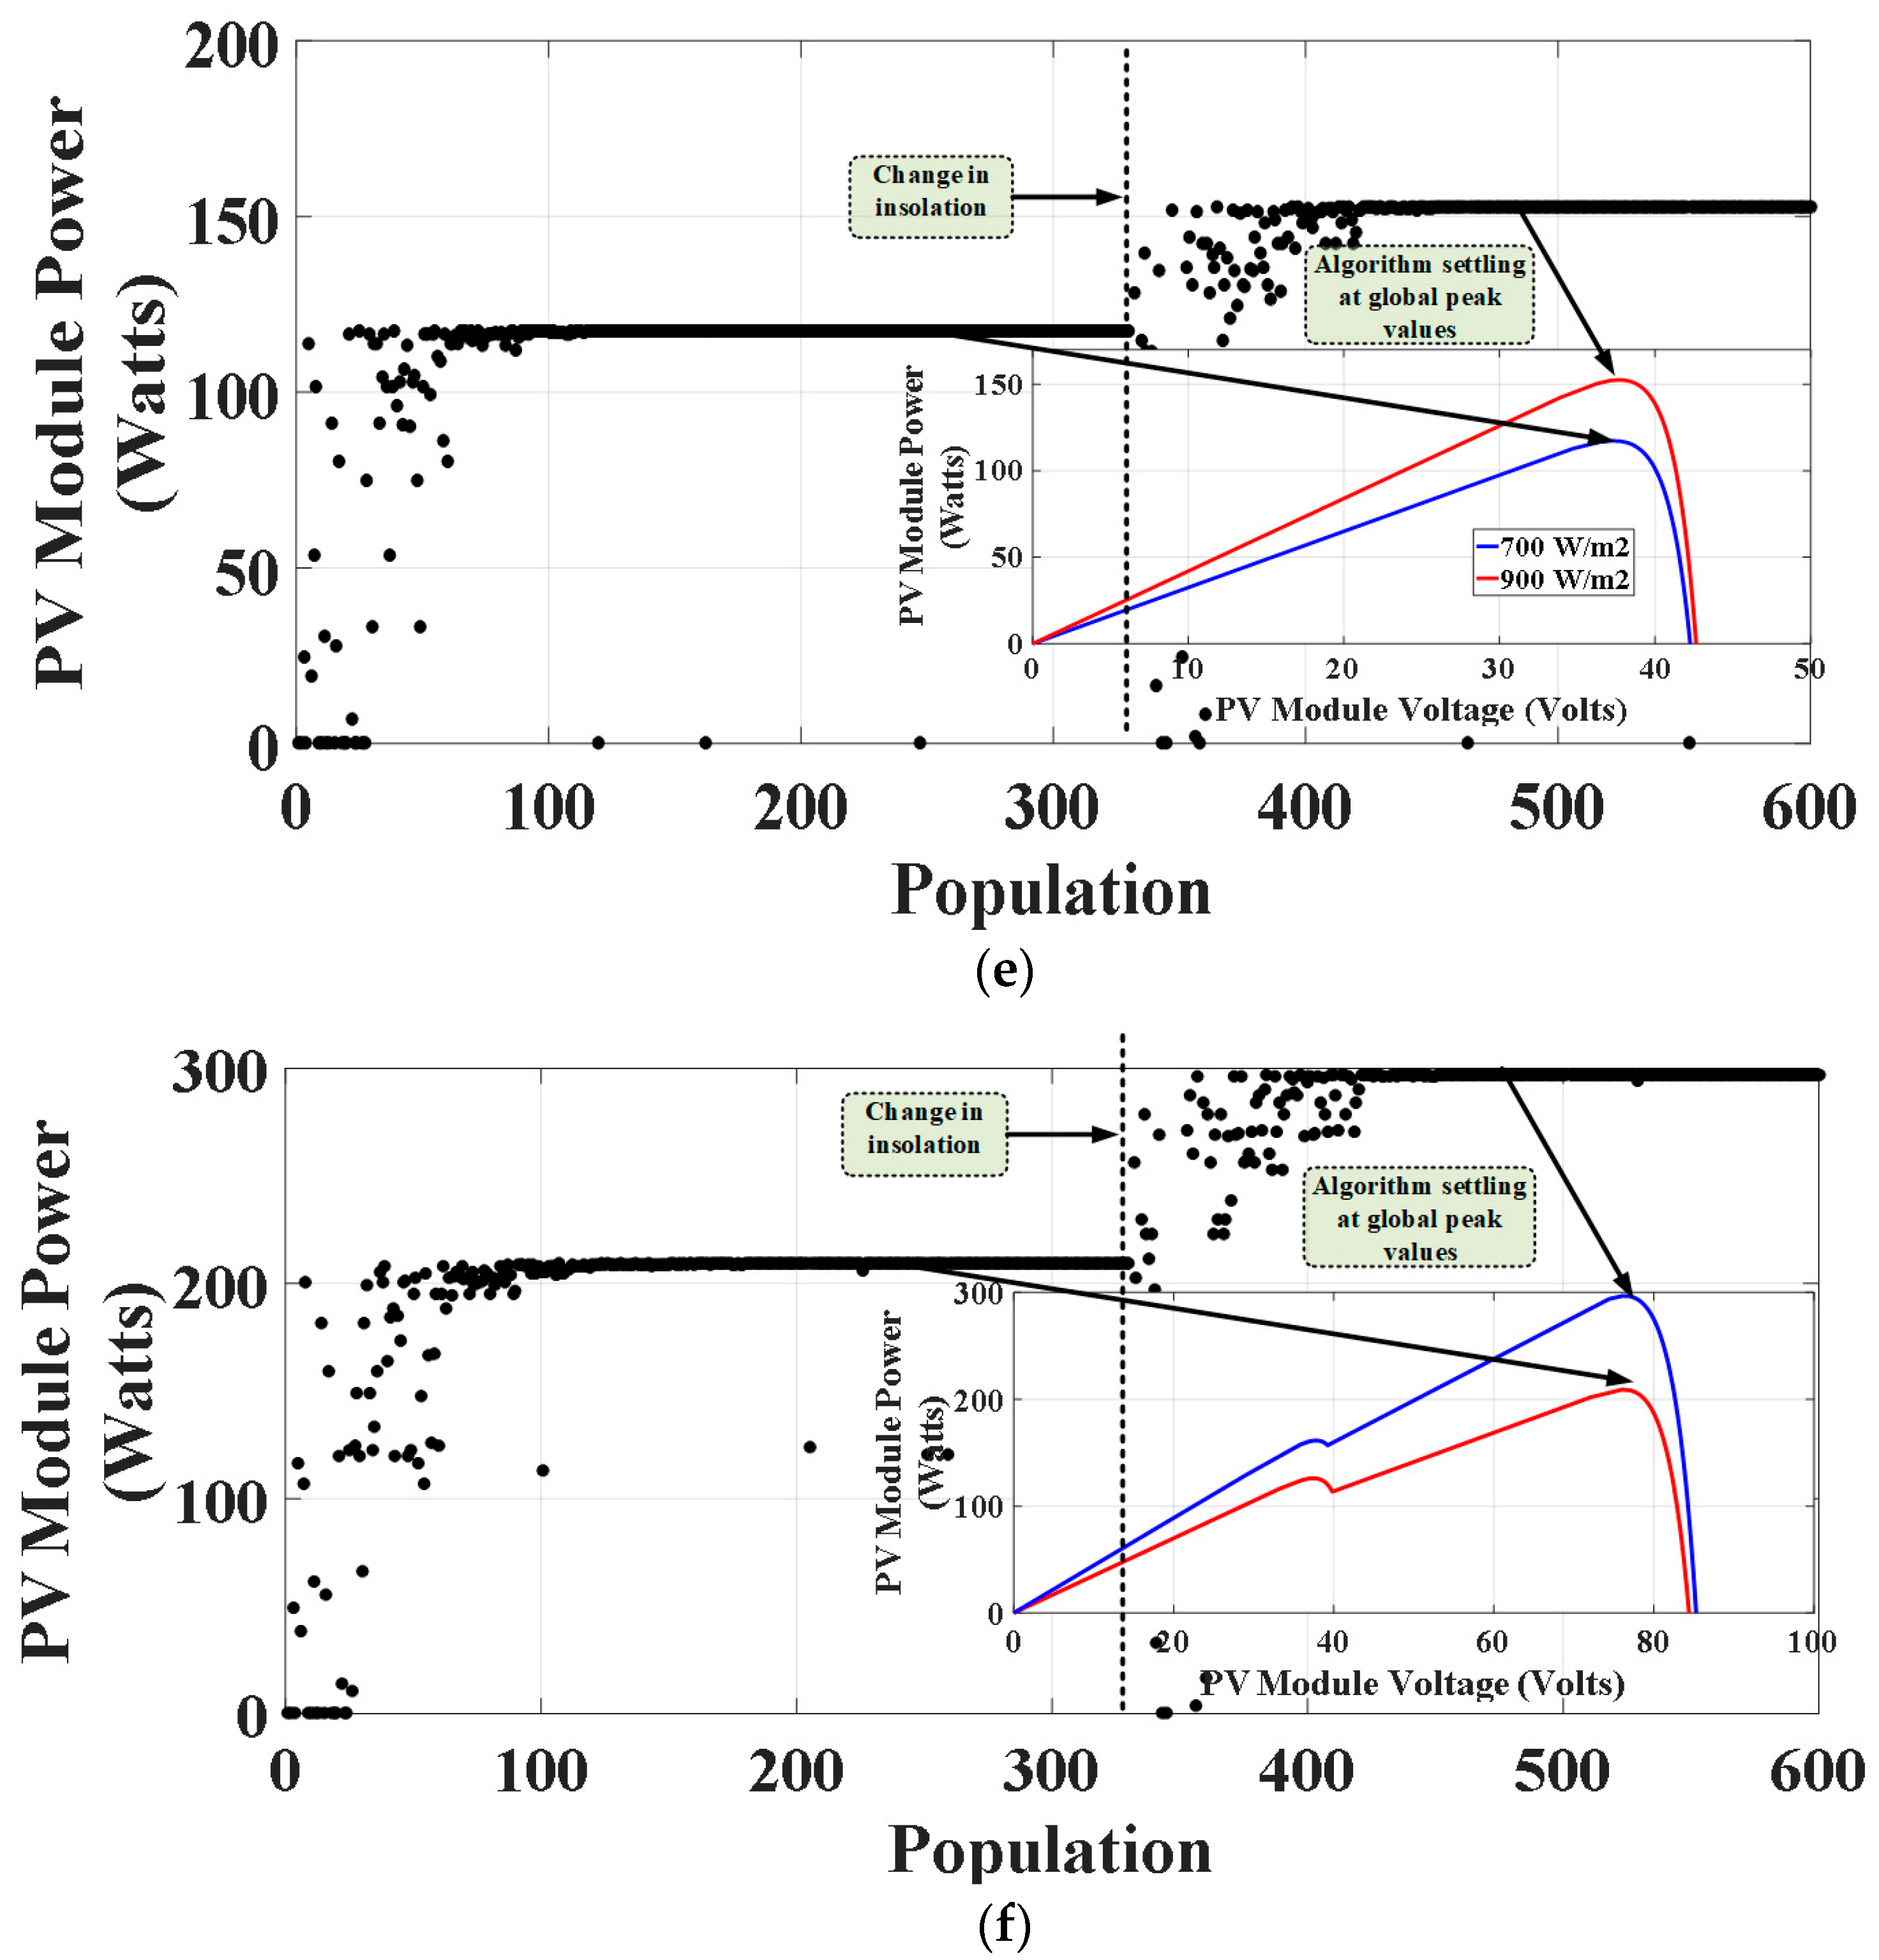
The results obtained on the graph are shown in Figure 13a–f. The fitness of each particle till ten iterations were taken. After around 2–3 iterations, the optimum power of the PV cell is achieved, and all the particles are converged to the maximum optimum value.
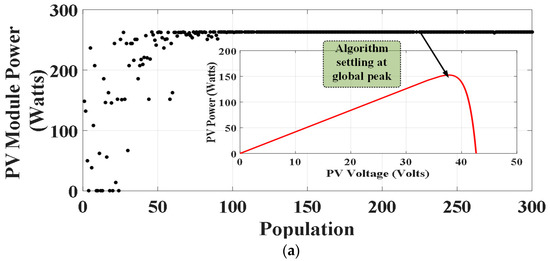
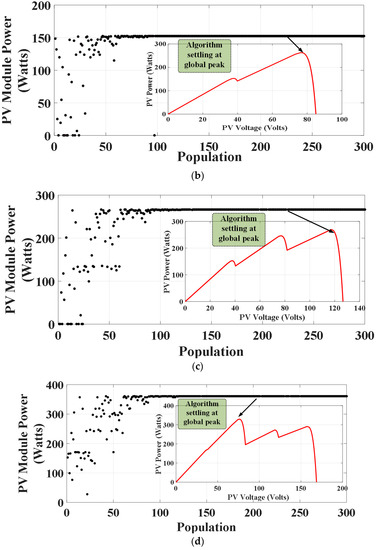
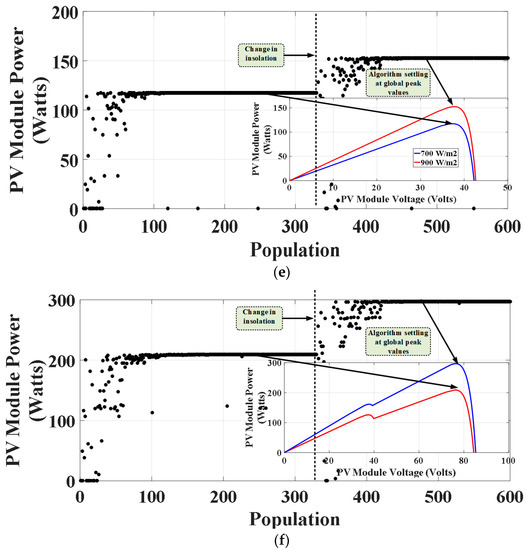
Figure 13.
Performance of the JSO MPPT strategy. (a) A single panel is used with insolation of 900 W/m2. (b) Two PV panels are employed with 1000 and 900 W/m2 of insolation level. (c) For three PV panels, with insolation levels of 1000, 900, 800 W/m2. (d) For four PV panels, each having different insolation level, i.e., 1000, 900, 800, and 700 W/m2. (e) Single panel is utilized with different insolation levels per iterations. (f) For two PV panels with varying insolation levels per iteration.
In Figure 13a, one panel was used with an insolation of 900 W/m2. After two iterations, all the particles converged to a constant value of 152.6 watts.
In Figure 13b, two panels were used, with the insolation on one panel to be 1000 W/m2, and 900 W/m2 on the other. The temperature was kept constant at 25 °C. After 10 iterations, the maximum value was achieved at 314.78 watts. In Figure 13c, three panels were used, with the insolation on one panel to be 1000 W/m2, and on the other two, 900 W/m2 and 800 W/m2, respectively. The temperature was kept constant at 25 °C. After ten iterations, the maximum value was achieved at 427.4 watts.
In Figure 13d four panels were used, with the insolation on one panel to be 1000 W/m2, and on the other three, 900 W/m2, 800 W/m2, and 700 W/m2, respectively. The temperature was kept constant at 25 °C. After ten iterations, the maximum value was achieved at 505.7 watts.
In Figure 13e, the number of panels used is one, and the insolation is varied for different iterations. For an initial seven iterations, the insolation was kept at 700 W/m2. Till three iterations, the fitness of all the particles was plotted, and, after that, the best value was plotted. After the seventh iteration, the insolation was changed to 900 W/m2. Till the eleventh iteration, the fitness value of each particle was plotted and, after that, only the best fitness was plotted. In Figure 13f, the panels used are two, and the insolation is varied for different iterations. For an initial seven iterations, the insolation at panels 1 and 2 was kept at 600 and 700 W/m2, respectively. Till the third iterations, the fitness of all the particles was plotted, and, after that, the best value was plotted. After the seventh iteration, the insolation on panels 1 and 2 was changed to 800 and 900 W/m2, respectively. Till the eleventh iteration, the fitness value of each particle was plotted and, after that, only the best fitness was plotted.
6. Performance Comparison
The simulation was performed by employing MATLAB version 2021 to scrutinize the effectiveness of the JSO strategy in tracking global MPP during PSC conditions. Later, a comparison is made between the JSO and the particle swarm optimization (PSO) method. The characteristics of the PV module utilized in the simulation process are depicted in Table 1.

Table 1.
Design parameters of the PV panel.
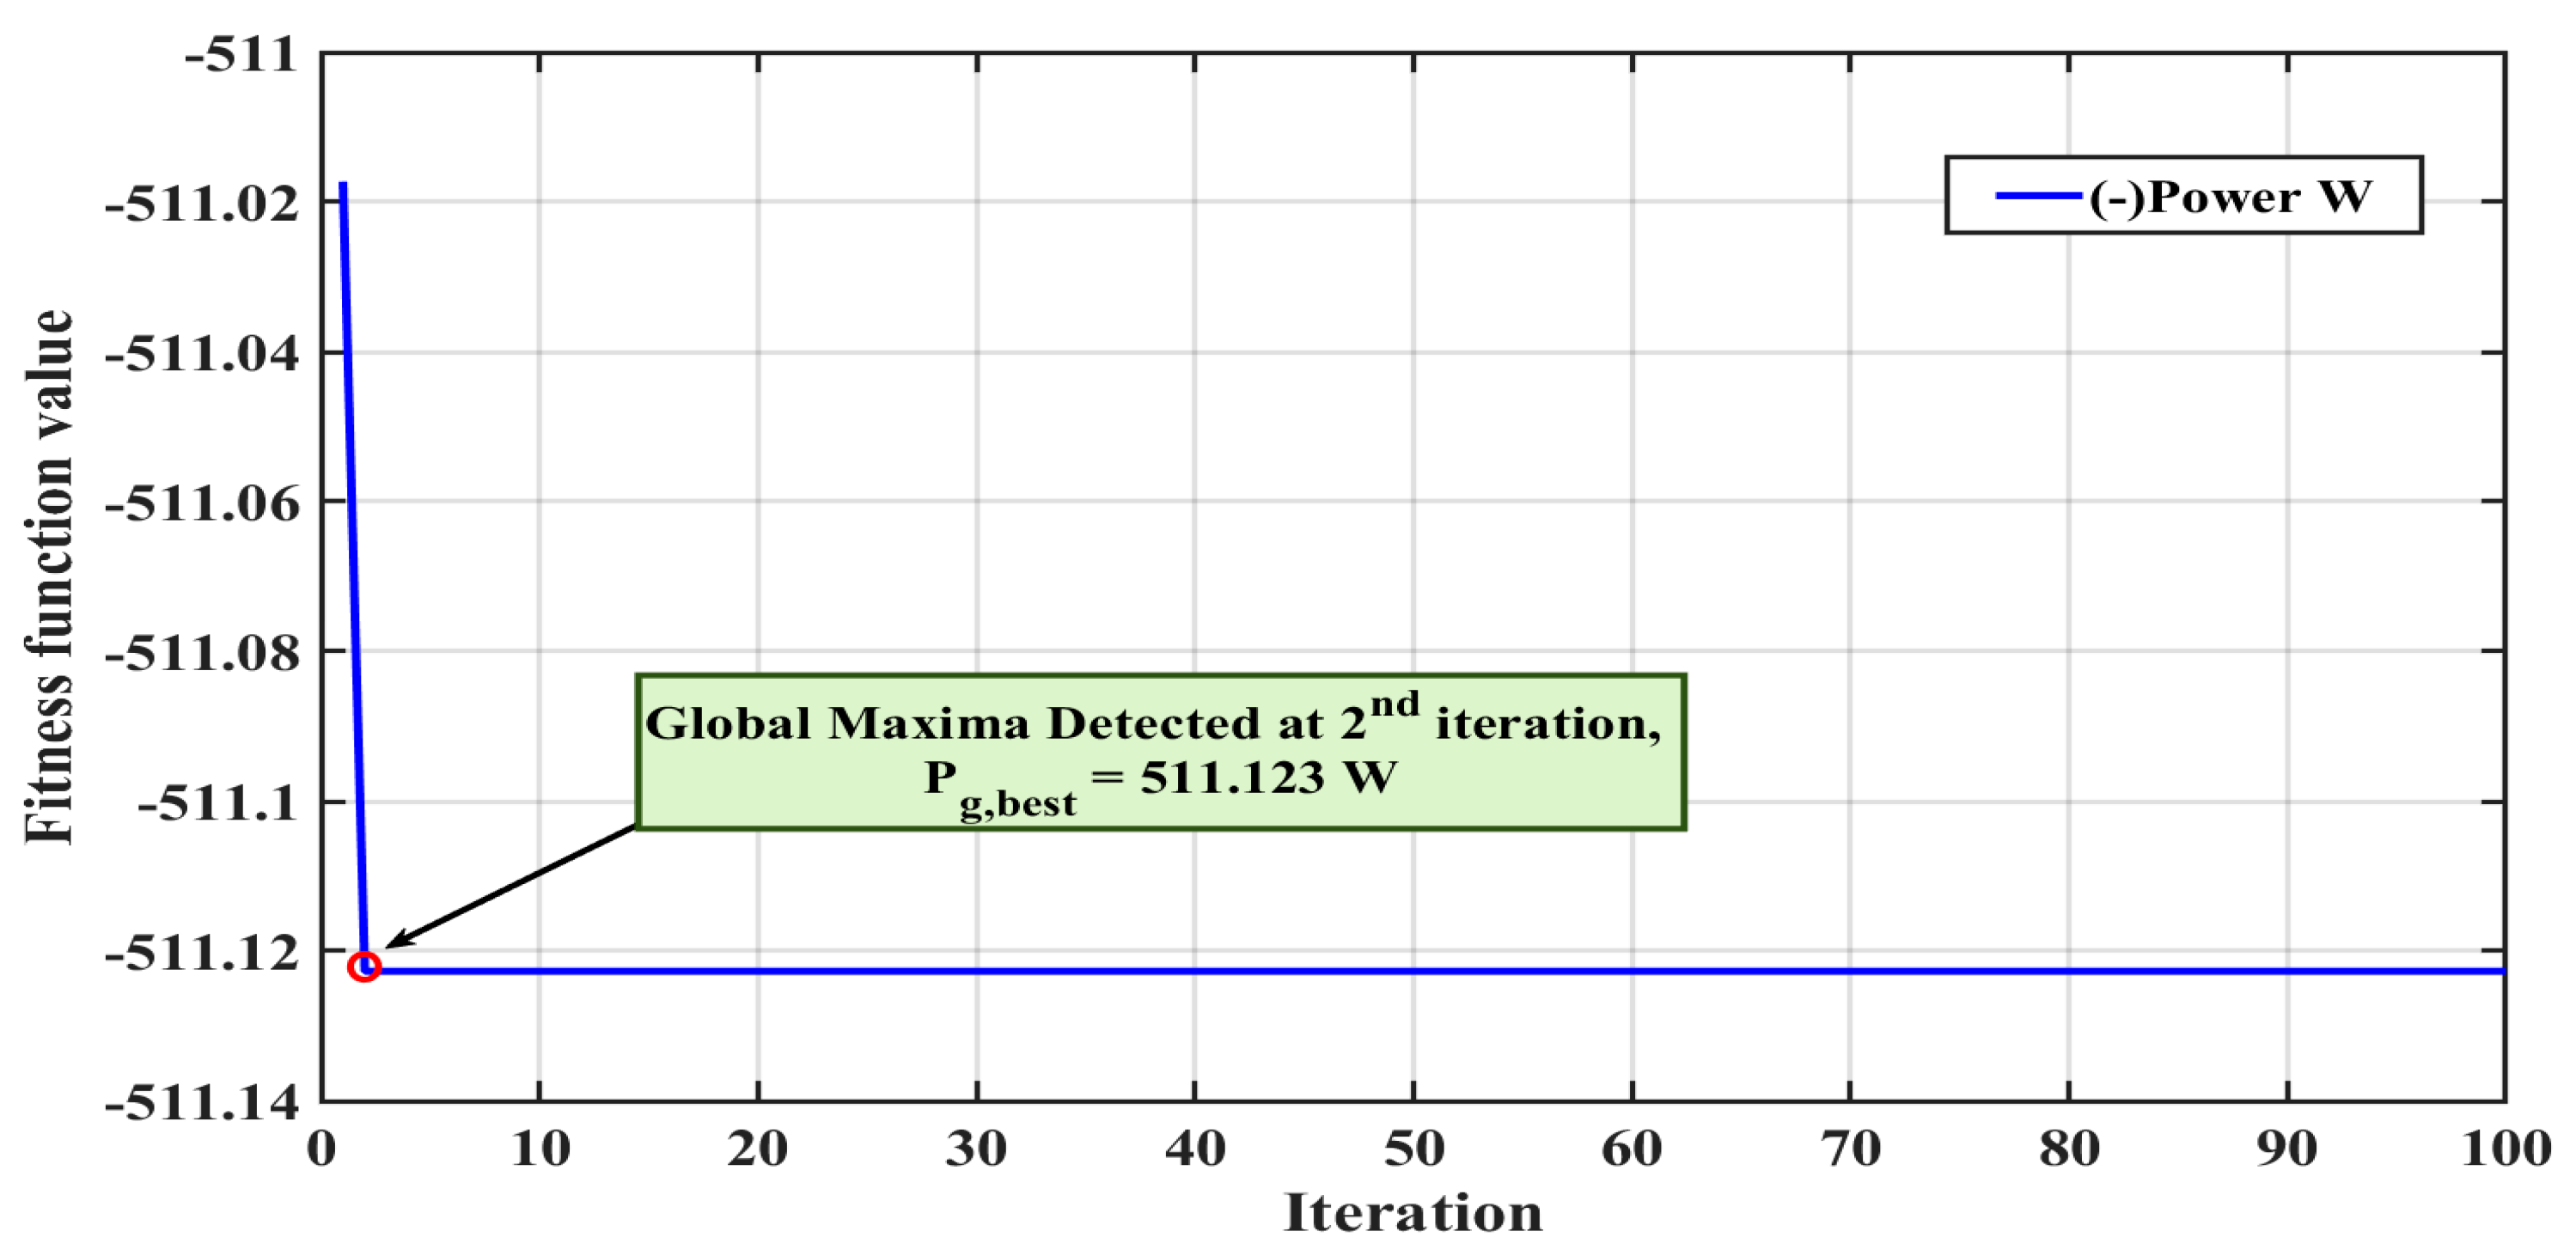
The simulation was performed by setting the maximum iteration count to 100. Additionally, the maximum number of the run was set to 10 to minimize the error. For both the strategies (i.e., JSO and PSO), 100 particles were engaged to trail the PV system’s global maximum power point (GMPP). Additionally, the fitness function, which aims at obtaining the maximum power point for the solar framework, was taken as a negative of the power. This negative representation eases in the optimization process as the maximum power corresponds to the minimum fitness function value.
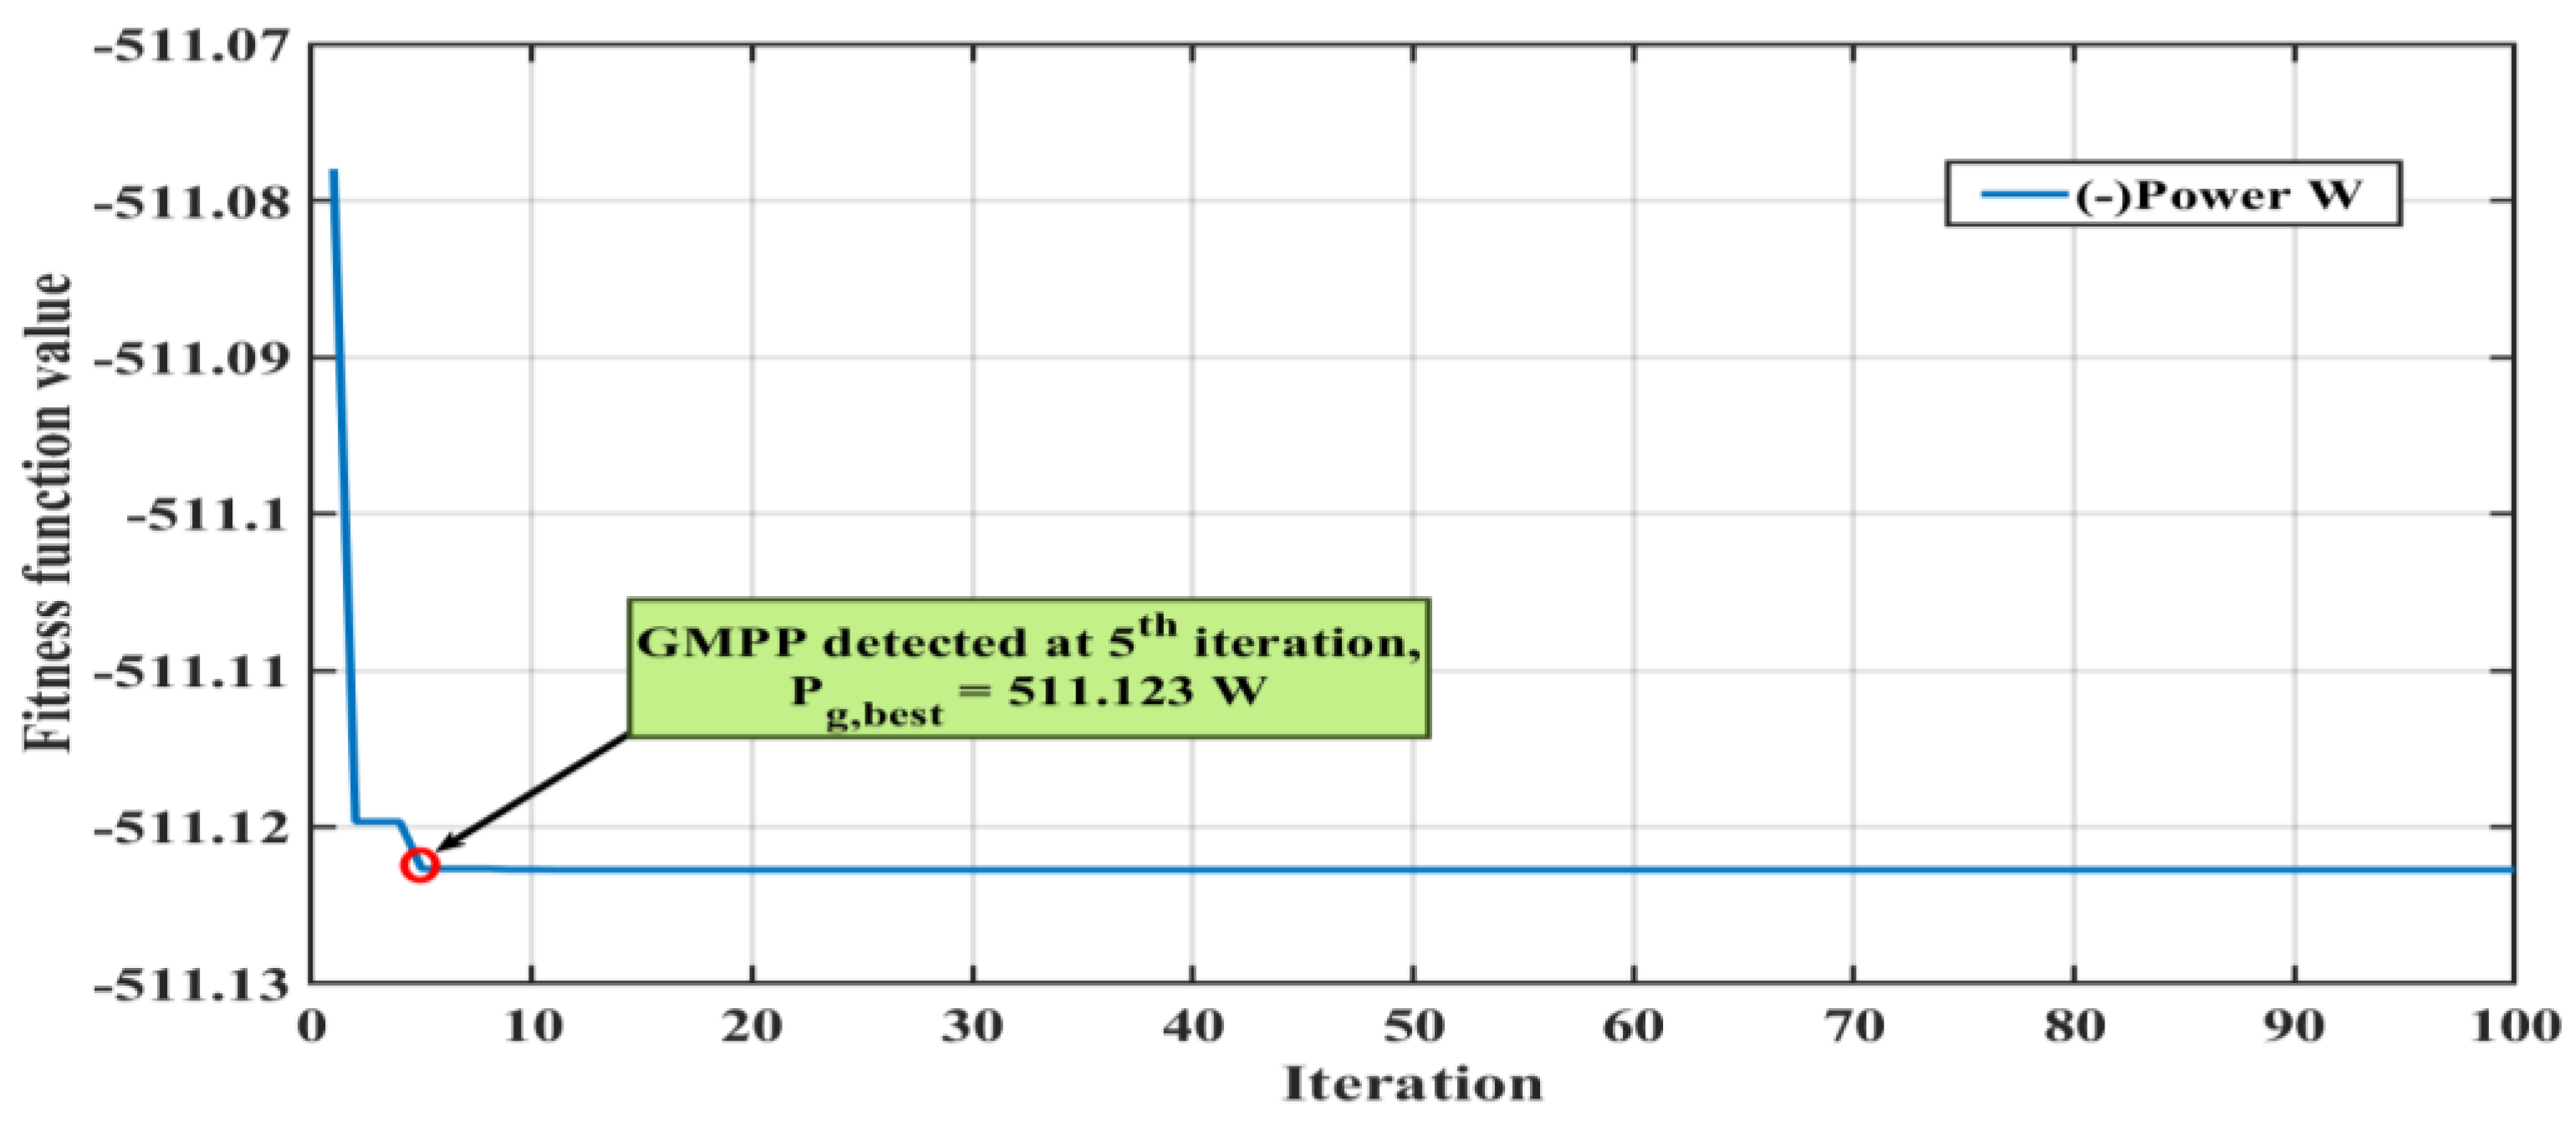
Firstly, the simulation was performed under uniform irradiation conditions, where the insolation level of the three PV panels was set to 1000 W/m2. The results of the simulation for the JSO and PSO strategies are illustrated in Figure 14 and Figure 15, respectively. The oscillations during the start of the simulation settle down when the optimum power point gets tracked. It is clearly evident from the resultant curves that the maximum power followed by both strategies was 511.123 W, while their tracking times differ. The JSO strategy tracked the GMPP in less time than the PSO algorithm, which is approximately less than half of the time spent by the latter method, as illustrated in Table 2. The best run parameter in the table illustrates the best iterative cycle corresponding to the optimal power output. These results suggest that the tracking speed of the JSO is fast, while there is no enhancement in the PV array yield.
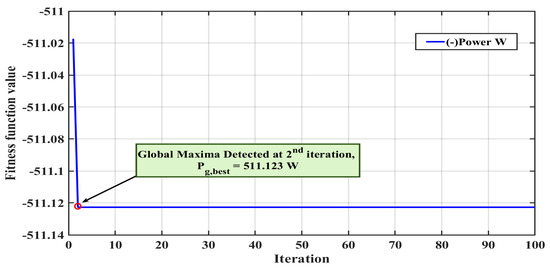
Figure 14.
Fitness function vs. iteration curve during uniform irradiance for the JSO strategy.
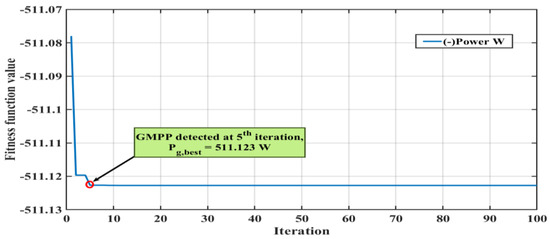
Figure 15.
Fitness function vs. iteration curve during uniform irradiance for the PSO algorithm.

Table 2.
Simulation outcomes of the JSO and the PSO strategies under a uniform irradiance condition of 1000 W/m2.
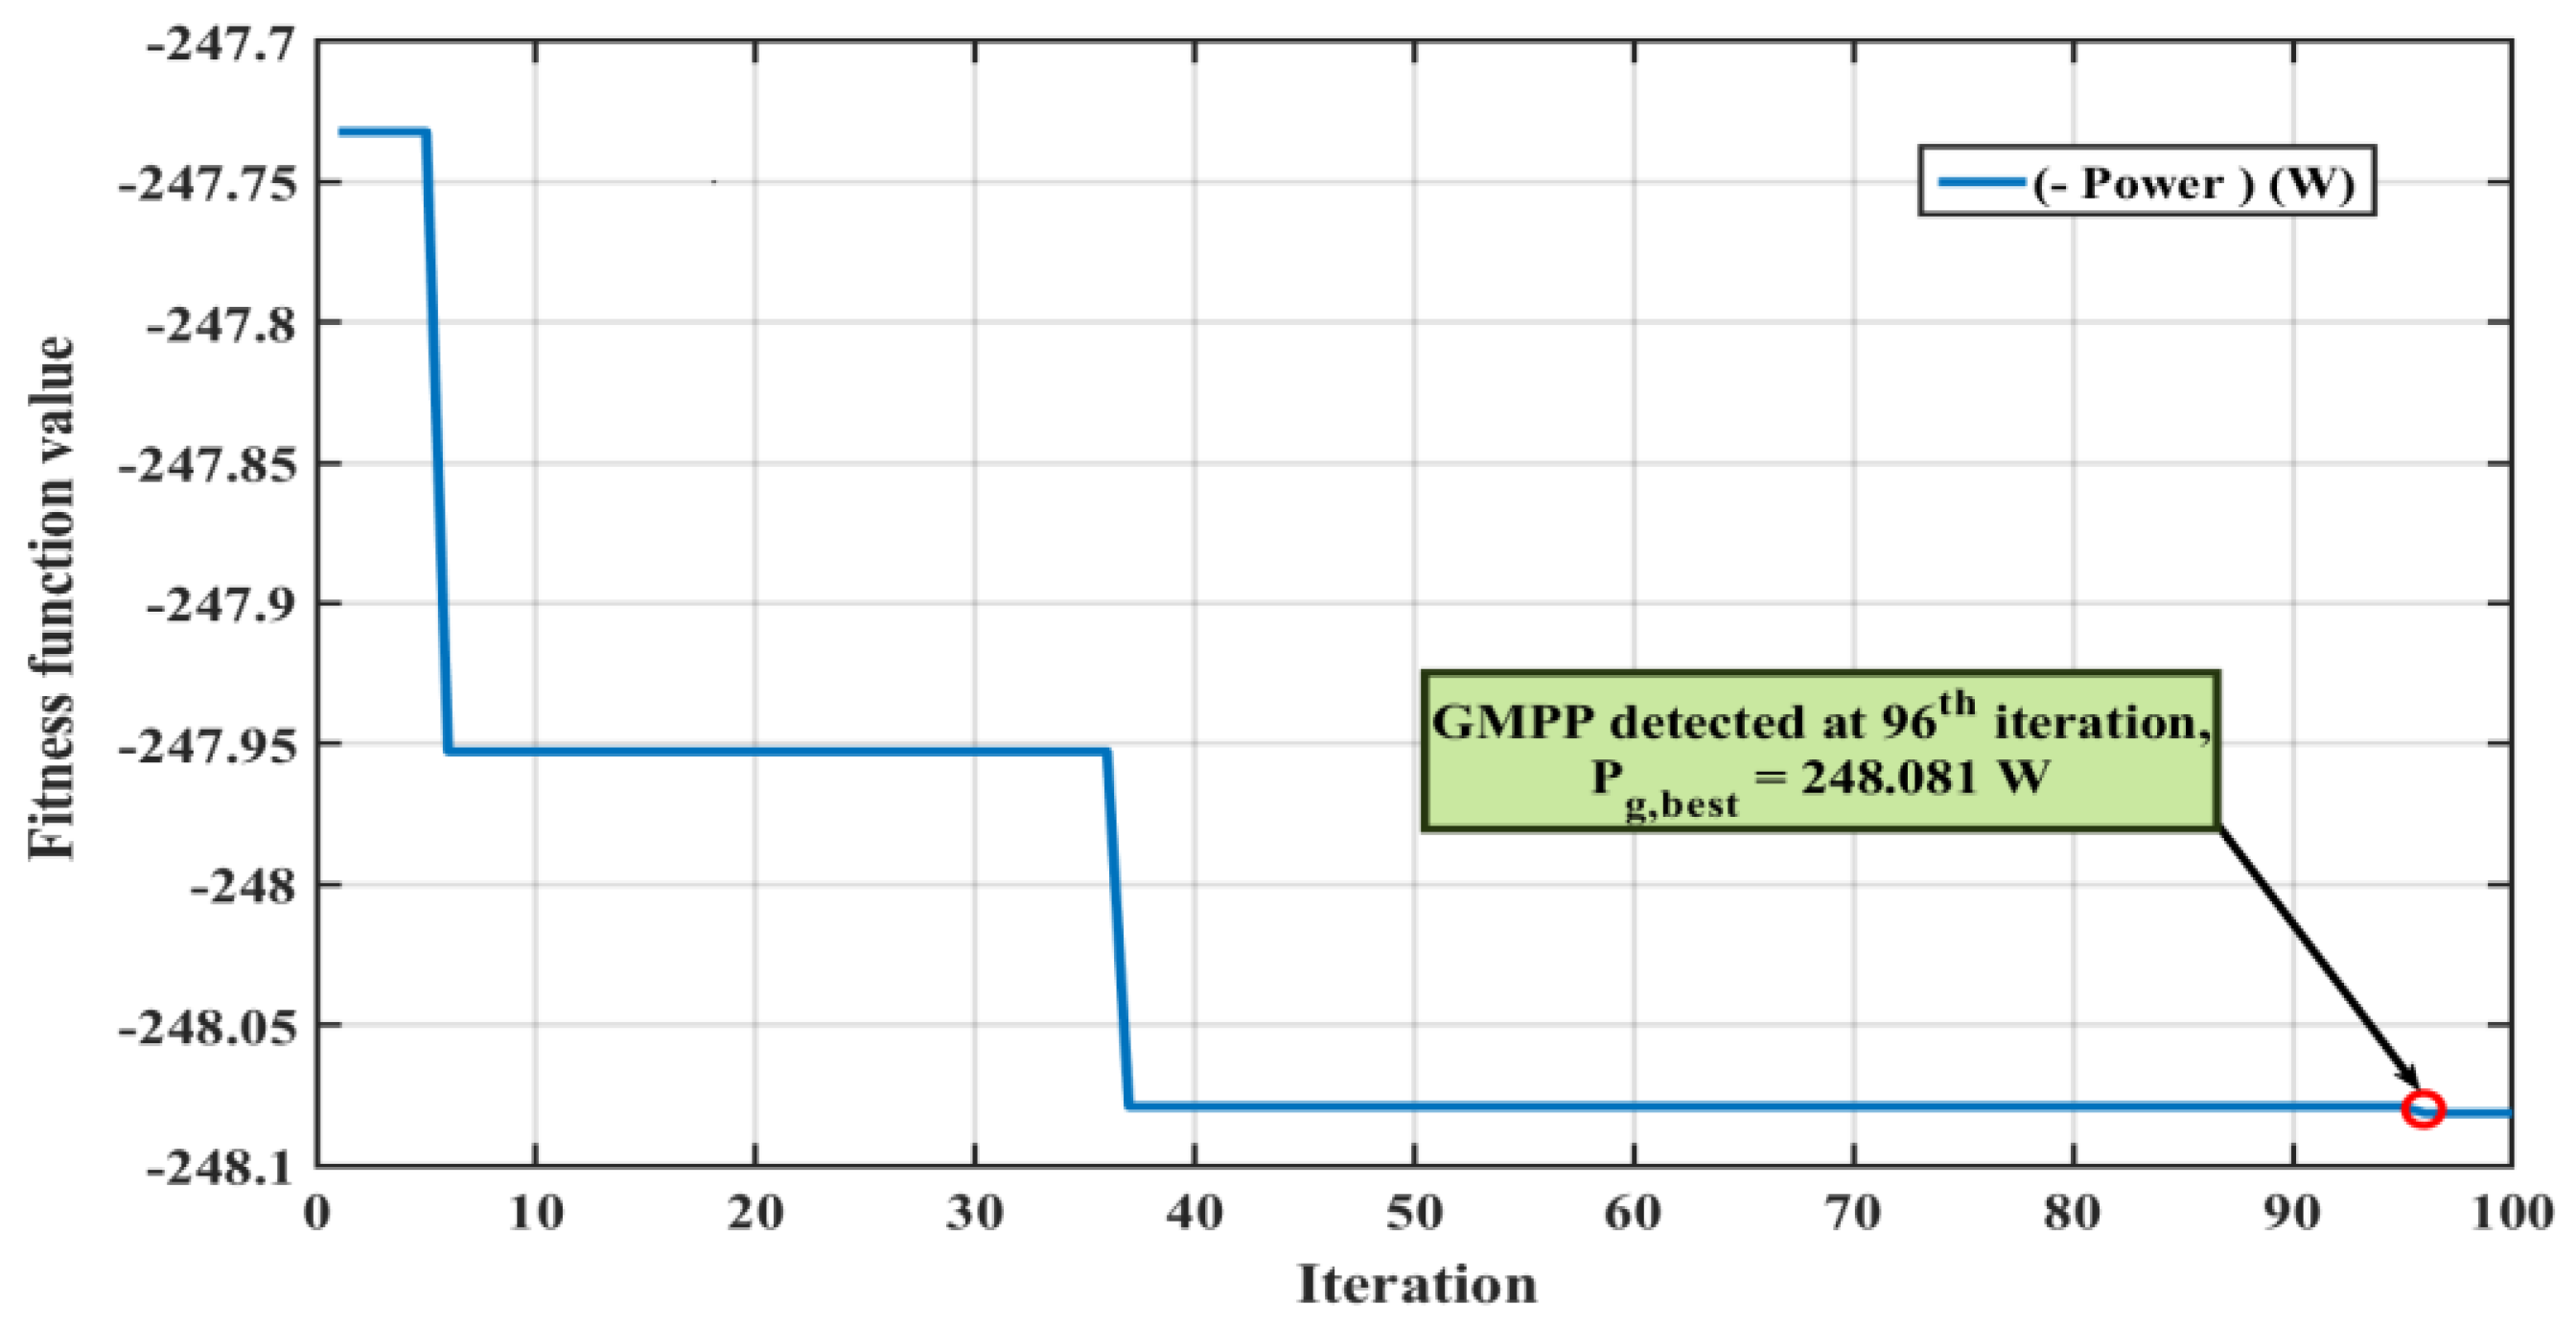
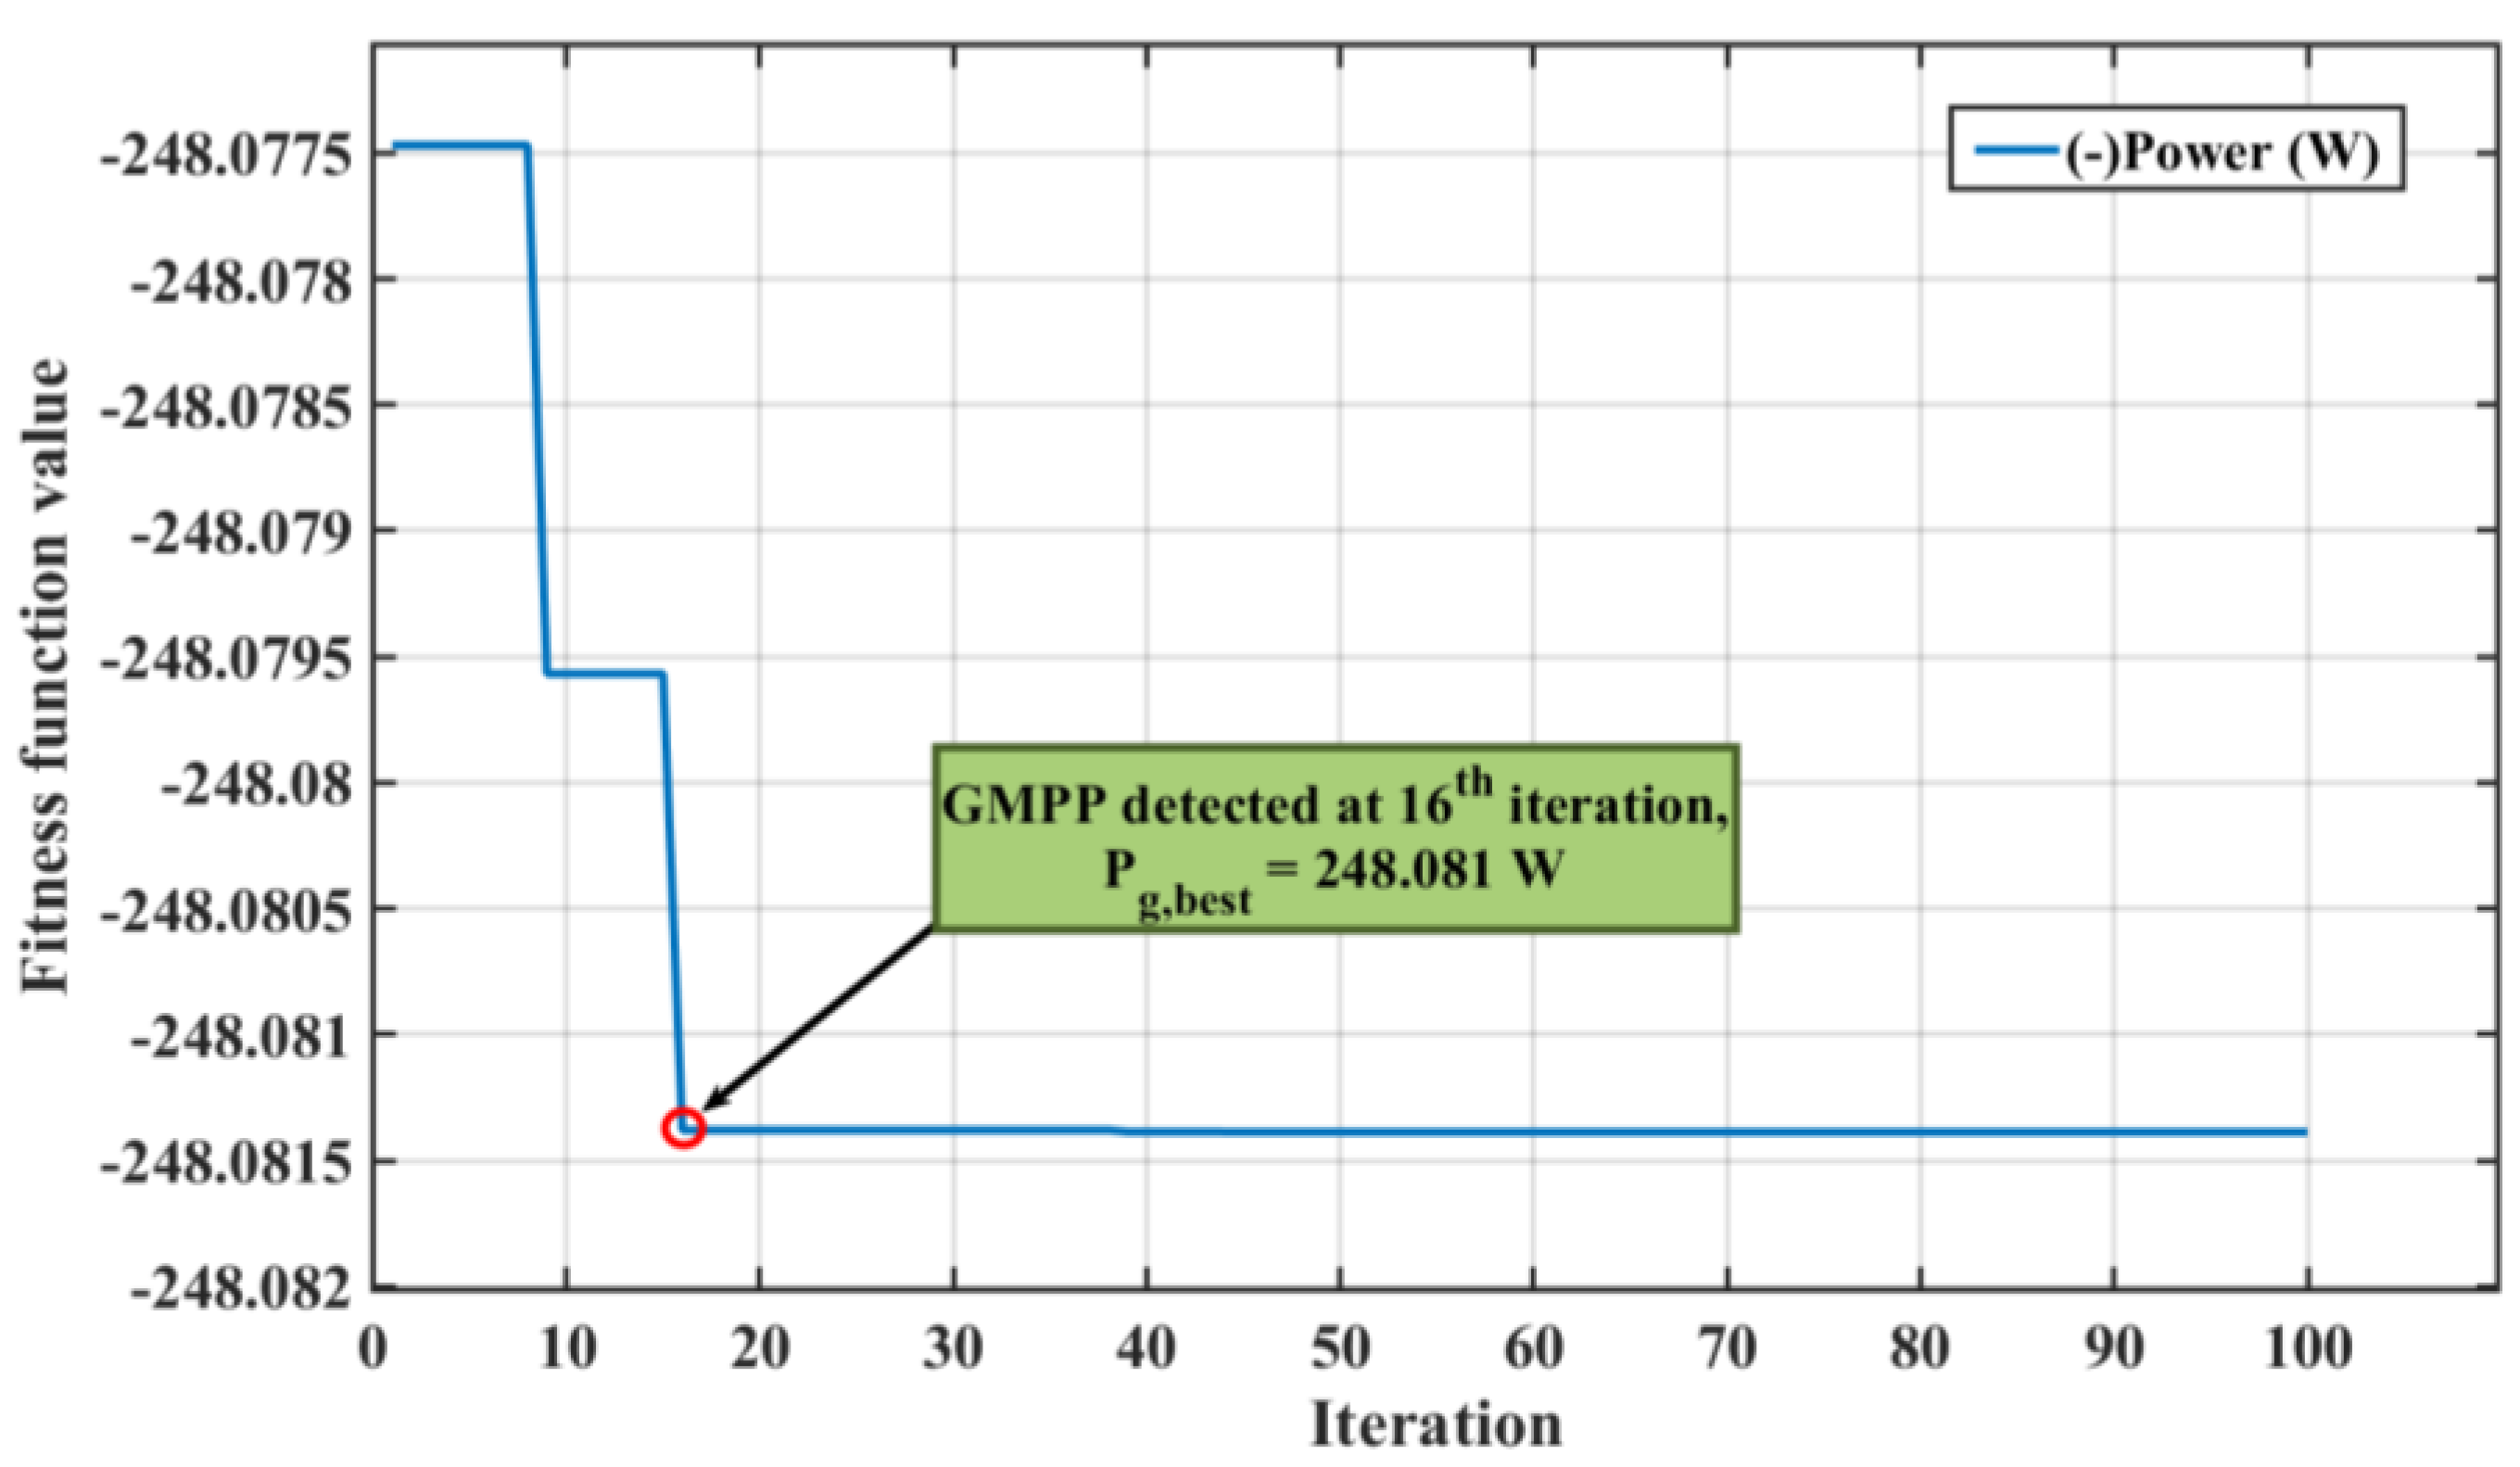
Lastly, the three PV modules mimicked the partial shading circumstances (PSC) by adjusting the insolation level of the panels to 1000, 700, and 400 W/m2. The fitness function versus iteration curves of the JSO and the PSO algorithms are shown in Figure 16 and Figure 17, respectively. Table 3 shows the simulation results for both strategies, suggesting that the newly developed JSO algorithm is roughly two times faster in following the global maxima than the conventional PSO algorithm. However, there is no difference in the maxima located. Hence, the simulation outcomes indicate that the JSO algorithm wins merely in the case of time against the PSO algorithm. Otherwise, the JSO and PSO strategies display approximate results, even in the case of the PSC conditions.
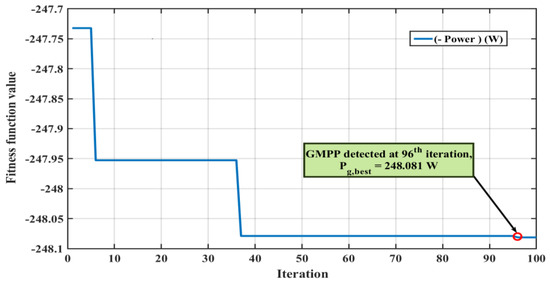
Figure 16.
Fitness function vs. iteration curve under varying irradiance for the JSO algorithm.
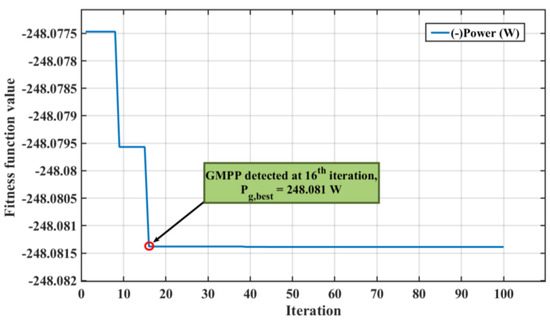
Figure 17.
Fitness function vs. iteration curve under varying irradiance for the PSO algorithm.

Table 3.
Design parameters of the PV panel under non-uniform irradiance conditions, i.e., 1000, 700, 400 W/m2.
These simulation results are the indicators that the JSO algorithm will be more useful where the fast-tracking rate is the primary requirement of the PV frameworks to accomplish a task. Furthermore, a visual representation of the algorithm’s performance helps in assessing its behavior under different environmental conditions. The variable parameters described in the table give insight into the iteration cycles employed for the algorithms to enhance the results. The best run of the JSO strategy is high in contrast with the PSO, again indicating the former method’s fast response. Thus, in sum, the JSO algorithm outperforms the PSO strategy in terms of the convergence speed in both uniform conditions and PSC.
7. Conclusions
This article validated the recently developed jellyfish search optimization strategy. The JSO algorithm was implemented to track the global maximum power point of the PV module in the case of partial shading circumstances. MATLAB software was employed to assess the effectiveness of the algorithm. The simulation results suggest that the JSO method has good tracking speed and accuracy. Moreover, the test results indicate that the JSO strategy follows the GMPP in half of the time taken by the traditional PSO algorithm in both uniform and shaded conditions. In terms of accuracy, both algorithms give the same output.
In the future, the scientific study can be updated in order to obtain more enhanced results:
- i.
- By undergoing hybridization with the other algorithms, such a modification can outweigh the drawbacks of the strategies employed to form new features and result in improving the output yield of the PV systems.
- ii.
- Real-time assessment of the algorithms can be performed in order to obtain the practical validation of the MPPT algorithms, which ignites the need of further study.
- iii.
- The most common hot-spot problem can be taken into account to update this work.
Author Contributions
Conceptualization, A.A. and A.S.; formal analysis, P.V., A.A., M.T. and A.S.; funding acquisition, B.A. and M.T.; investigation, P.V., A.A., M.T., A.S., N.Z. and S.U.; methodology, A.A., M.T. and A.S.; supervision, A.A., and A.S.; writing—original draft, P.V. and A.A.; writing—review & editing, M.T., A.S., B.A., N.Z. and S.U. All authors have read and agreed to the published version of the manuscript.
Funding
This research was funded in part by the Taif University Researchers Supporting Project Number (TURSP-2020/278), Taif University, Taif, Saudi Arabia and, in part, by the collaborative research grant scheme (CRGS) project, Hardware-In-the-Loop (HIL) Lab, Department of Electrical Engineering, Aligarh Muslim University, India, with project numbers CRGS/MOHD TARIQ/01 and CRGS/MOHD TARIQ/02”.
Acknowledgments
The authors also acknowledge the technical support provided by the Hardware-In-the-Loop (HIL) Lab and the Non-Conventional Energy (NCE) Lab, the Department of Electrical Engineering, Aligarh Muslim University, India.
Conflicts of Interest
The authors declare no conflict of interest.
References
- André, T.; Ute Collier, A.B.; Dent, C.; Epp, B.; Gibb, D.; Kumar, C.H.; Joubert, F.; Kamara, R.; Ledanois, N.; Mastny, L.; et al. Renewables 2021 Global Status Report; Mastny, L., Brumer, L., Eds.; REN21 Secretariat: Paris, France, 2021; ISBN 978-3-948393-03-8. [Google Scholar]
- Saravanan, S.; Babu, N.R. Maximum power point tracking algorithms for photovoltaic system—A review. Elsevier Renew. Sustain. Energy Rev. 2016, 57, 192–204. [Google Scholar] [CrossRef]
- Hameed, W.I.; Saleh, A.L.; Sawadi, B.A.; Al-Yasir, Y.I.A.; Abd-Alhameed, R.A. Maximum Power Point Tracking for Photovoltaic System by Using Fuzzy Neural Network. Inventions 2019, 4, 33. [Google Scholar] [CrossRef] [Green Version]
- El Hammoumi, A.; Motahhir, S.; El Ghzizal, A.; Chalh, A.; Derouich, A. A simple and low-cost active dual-axis solar tracker. Energy Sci. Eng. 2018, 6, 607–620. [Google Scholar] [CrossRef] [Green Version]
- Chalh, A.; Motahhir, S.; El Hammoumi, A.; El Ghzizal, A.; Derouich, A. Study of a Low-Cost PV Emulator for Testing MPPT Algorithm Under Fast Irradiation and Temperature Change. Technol. Econ. Smart Grids Sustain. Energy 2018, 3, 11. [Google Scholar] [CrossRef] [Green Version]
- Verma, D.; Nema, S.; Shandilya, A.M.; Dash, S.K. Maximum power point tracking (MPPT) techniques: Recapitulation in solar photovoltaic systems. Renew. Sustain. Energy Rev. 2016, 54, 1018–1034. [Google Scholar] [CrossRef]
- Abdul-Kalaam, R.; Muyeen, S.; Al-Durra, A. Review of maximum power point tracking techniques for photovoltaic system. Global J. Control Eng. Technol. 2016, 2, 8–18. [Google Scholar]
- Karami, N.; Moubayed, N.; Outbib, R. General review and classification of different MPPT Techniques. Renew. Sustain. Energy Rev. 2017, 68, 1–18. [Google Scholar] [CrossRef]
- Masoum, M.; Dehbonei, H.; Fuchs, E. Theoretical and experimental analyses of photovoltaic systems with voltageand current-based maximum power-point tracking. IEEE Trans. Energy Convers. 2002, 17, 514–522. [Google Scholar] [CrossRef] [Green Version]
- Piegari, L.; Rizzo, R. Adaptive perturb and observe algorithm for photovoltaic maximum power point tracking. IET Renew. Power Gener. 2010, 4, 317–328. [Google Scholar] [CrossRef]
- Kamran, M.; Mudassar, M.; Fazal, M.R.; Asghar, M.U.; Bilal, M.; Asghar, R. Implementation of improved Perturb & Observe MPPT technique with confined search space for standalone photovoltaic system. J. King Saud Univ.—Eng. Sci. 2018, 32, 432–441. [Google Scholar] [CrossRef]
- Hua, C.-C.; Chen, Y.-M. Modified perturb and observe MPPT with zero oscillation in steady-state for PV systems under partial shaded conditions. In Proceedings of the 2017 IEEE Conference on Energy Conversion (CENCON), Kuala Lumpur, Malaysia, 30–31 October 2017; pp. 5–9. [Google Scholar] [CrossRef]
- Yamashita, H.; Tamahashi, K.; Michihira, M.; Tsuyoshi, A.; Amako, K.; Park, M. A novel simulation technique of the PV generation system using real weather conditions. In Proceedings of the Power Conversion Conference—Osaka 2002 (Cat.No.02TH8579), Osaka, Japan, 2–5 April 2002; Volume 2, pp. 839–844. [Google Scholar]
- Kumar, M.V.; Mogili, A.R.; Anusha, S.; Kumar, N.A. A New Fuzzy based INC-MPPT Algorithm for Constant Power Generation in PV Systems. Intern. Res. J. Eng. Tech. 2021, 8, 212–217. [Google Scholar]
- Calvinho, G.; Pombo, J.; Mariano, S.; Calado, M.D.R. Design and Implementation of MPPT System Based on PSO Algorithm. In Proceedings of the IEEE International Conference on Intelligent Systems (IS), Funchal, Portugal, 25–27 September 2018; pp. 732–738. [Google Scholar]
- Khazain, M.A.; Hidayat, N.M.; Burhanudin, K.; Abdullah, E. Boost Converter of Maximum Power Point Tracking (MPPT) Using Particle Swarm Optimization (PSO) Method. In Proceedings of the 2021 IEEE 12th Control and System Graduate Research Colloquium (ICSGRC), Shah Alam, Malaysia, 7 August 2021. [Google Scholar]
- Narendiran, S.; Sahoo, S.K.; Das, R.; Sahoo, A.K. Fuzzy logic controller based maximum power point tracking for PV system. In Proceedings of the 2016 3rd IEEE International Conference on Electrical Energy Systems (ICEES), Chennai, India, 17–19 March 2016; pp. 29–34. [Google Scholar]
- Basha, C.H.; Rani, C. Different Conventional and Soft Computing MPPT Techniques for Solar PV Systems with High Step-Up Boost Converters: A Comprehensive Analysis. Energies 2020, 13, 371. [Google Scholar] [CrossRef] [Green Version]
- Lopez-Santos, O.; Garcia, G.; Martinez-Salamero, L.; Giral, R.; Vidal-Idiarte, E.; Merchan-Riveros, M.C.; Moreno-Guzman, Y. Analysis, Design, and Implementation of a Static Conductance-Based MPPT Method. IEEE Trans. Power Electron. 2018, 34, 1960–1979. [Google Scholar] [CrossRef]
- Dhawan, S.; Gupta, R.; Rana, A.; Sharma, S. Various Swarm Optimization Algorithms: Review, Challenges, and Opportunities. In Soft Computing for Intelligent Systems; Marriwala, N., Tripathi, C.C., Jain, S., Mathapathi, S., Eds.; Springer: Singapore, 2021; pp. 291–301. ISBN 978-981-16-1048-6. [Google Scholar]
- Bonabeau, E.; Dorigo, M.; Theraulaz, G. Swarm Intelligence: From Natural to Artificial Systems; Oxford University Press: New York, NY, USA, 1999; Chapter 5; ISBN 9780195131581. [Google Scholar]
- Ab Wahab, M.N.; Nefti-Meziani, S.; Atyabi, A. A Comprehensive Review of Swarm Optimization Algorithms. PLoS ONE 2015, 10, e0122827. [Google Scholar] [CrossRef] [PubMed] [Green Version]
- el Hariza, Z.; Aissaouia, H.; Dianya, M. A Novel PID Using A Genetic Algorithm to Track the Maximum Power Point of the PV System. In Advanced Research in Solar Energy; Kale, S.A., Ed.; Grinrey: Pune, India, 2021; Volume 1, pp. 81–98. ISBN 978-81-948951-7-6. [Google Scholar]
- Sundareswaran, K.; Kinattingal, G.S.; Simon, S.; Nayak, P. MPPT in PV systems using ant colony optimisation with dwindling population. IET Renew. Power Gener. 2020, 14, 1105–1112. [Google Scholar] [CrossRef]
- Slowik, A.; Kwasnicka, H. Evolutionary algorithms and their applications to engineering problems. Neural Comput. Appl. 2020, 32, 12363–12379. [Google Scholar] [CrossRef] [Green Version]
- Gonzalez-Castano, C.; Restrepo, C.; Kouro, S.; Rodriguez, J. MPPT Algorithm Based on Artificial Bee Colony for PV System. IEEE Access 2021, 9, 43121–43133. [Google Scholar] [CrossRef]
- Jamaludin, M.N.I.; Tajuddin, M.F.N.; Ahmed, J.; Azmi, A.; Azmi, S.A.; Ghazali, N.H.; Babu, T.S.; Alhelou, H.H. An Effective Salp Swarm Based MPPT for Photovoltaic Systems Under Dynamic and Partial Shading Conditions. IEEE Access 2021, 9, 34570–34589. [Google Scholar] [CrossRef]
- Chou, J.-S.; Truong, D.-N. A novel metaheuristic optimizer inspired by behavior of jellyfish in ocean. J. Elsevier Appl. Math. Comput. 2020, 389, 125535. [Google Scholar] [CrossRef]
- Ilyas, A.; Ayyub, M.; Khan, M.R.; Husain, M.A.; Jain, A. Hardware Implementation of Perturb and Observe Maximum Power Point Tracking Algorithm for Solar Photovoltaic System. Trans. Electr. Electron. Mater. 2018, 19, 222–229. [Google Scholar] [CrossRef]
- Saadsaoud, M.; Abbasi, H.A.; Kermiche, S.; Ouada, M. Study of Partial Shading Effects on Photovoltaic Arrays with comprehensive Simulator for Global MPPT control. Inter. J. Renew. Energy Res. 2016, 6, 413–420. [Google Scholar]
- Salem, F.; Awadallah, M.A. Detection and assessment of partial shading in photovoltaic arrays. J. Electr. Syst. Inf. Technol. 2016, 3, 23–32. [Google Scholar] [CrossRef] [Green Version]
- Fossette, S.; Putman, N.F.; Lohmann, K.J.; Marsh, R.; Hays, G.; Hays, G. A biologist’s guide to assessing ocean currents: A review. Mar. Ecol. Prog. Ser. 2012, 457, 285–301. [Google Scholar] [CrossRef] [Green Version]
- Abdel-Basset, M.; Mohamed, R.; Chakrabortty, R.K.; Ryan, M.J.; El-Fergany, A. An Improved Artificial Jellyfish Search Optimizer for Parameter Identification of Photovoltaic Models. Energies 2021, 14, 1867. [Google Scholar] [CrossRef]
Publisher’s Note: MDPI stays neutral with regard to jurisdictional claims in published maps and institutional affiliations. |
© 2021 by the authors. Licensee MDPI, Basel, Switzerland. This article is an open access article distributed under the terms and conditions of the Creative Commons Attribution (CC BY) license (https://creativecommons.org/licenses/by/4.0/).

