Article

Progress after the 2015 Nepal Earthquake: Evidence from Two Household Surveys in One of the Hardest-Hit Mountain Villages

by
Jeet Bahadur Sapkota
1,*,
Kyosuke Kurita
2 and
Pramila Neupane
3
1
School of International Studies, Kwansei Gakuin University, Nishinomiya 662-8501, Japan
2
School of Economics, Kwansei Gakuin University, Nishinomiya 662-8501, Japan
3
University Education Center, Gunma University, Maebashi 371-8510, Japan
*
Author to whom correspondence should be addressed.
Sustainability 2021, 13(21), 11677; https://doi.org/10.3390/su132111677
Submission received: 28 August 2021 / Revised: 25 September 2021 / Accepted: 12 October 2021 / Published: 22 October 2021

Abstract

:
Nepal was hit by a 7.8 magnitude earthquake on 25 April 2015, followed by numerous aftershocks, including a 6.8 magnitude earthquake on 26 April and a 7.2 magnitude earthquake on 12 May. Using two household surveys of a panel of 377 households conducted in February 2016 and March 2020 in one of the hardest-hit mountain villages, we found that most of the households recovered well, having better housing, increased income, improved awareness about disaster risk, and better infrastructure facilities than before the earthquake. Notably, the poverty headcount index reduced by 16% from 2016 to 2020, and more than 90% of the households reconstructed into earthquake-resistant houses with financial and technical support, mainly, from the government. The village has increased the quality and length of rural roads; there is also wider coverage of clean water supply and better functioning school buildings and hospitals. Similarly, the subjective well-being of the people, gauged using the Oxford Happiness Questionnaire (OHQ), has also increased. These aspects combined indicate improved community resilience and the sustainable development of the village. However, the progress differs significantly across gender, caste/ethnic as well as income groups, which calls for inclusive reconstruction and recovery policies as well as disaster risk reduction (DRR) frameworks at a local level to contribute to community resilience and sustainable mountain development.

1. Introduction

Nepal, one of the 47 least developed countries (LDCs) as well as one of the 32 lands locked developing countries (LLDCs) in South Asia [1,2], was hit by a 7.8 magnitude earthquake at 11:56 on Saturday 25 April 2015, followed by a series of strong aftershocks, such as earthquakes of 6.8 and 7.2 magnitudes on 26 April and 12 May, respectively [3]. Since then, numerous scholarly studies have been conducted to explore various aspects of the disaster and its impacts on different sectors of the economy [4,5,6], livelihood of people [5,7], and environment [8], among others. Despite national as well as international attention, and scholarly interest in the 2015 Nepal earthquake, there is limited exploration of its well-being impact at the household level, particularly in mountainous rural areas. Using the primary data collected through two rounds of household surveys in February 2016 and March 2020, this study records the progress of both the objective and subjective well-being of people in one of the hardest-hit rural mountain communities, the Ramche village of the Sindhupalchok District. The results of this study would be useful for policymakers and donor communities to mobilize their resources for disaster risk reduction (DRR) at a local level, boosting community resilience in rural areas for sustainable mountain development and focusing their efforts on the neediest and most disadvantaged socioeconomic groups.
Disaster impacts disproportionately and recovery is harder to weaker groups of people as well as less developed areas due to the limited coping capability and physical resources [9,10,11]. However, disaster research is focused more on developed countries and advanced areas within countries [10,12]. While a better understanding of the well-being and social capital impacts of natural disasters at a local level is instrumental in building a resilient society to natural hazards [13], effective management of disaster risks, which is essential to embrace a sustainable community [14], are lacking in less developed and more vulnerable rural mountainous areas. Therefore, exploring disaster impacts in hard-to-reach rural mountain communities contributes to effective disaster risk governance and the implementation of the Sendai Framework for Disaster Risk Reduction 2015–2030, which is the global policy framework to protect development gains from the risk of disaster [15].
On the one hand, natural disasters cause tangible economic losses together with increased intangible emotional problems to individuals [16,17]. On the other hand, they also bring positive changes in people’s selves and lives, leading to a post-traumatic growth of resilience [18,19,20], such as feelings of social unity and optimism [21]. For instance, Townshend et al. [22] showed a consistent significant positive correlation between cohesion and resilience in four Canadian rural communities that experienced disasters and evacuation. Similarly, using semi-structured interviews and close-ended questionnaires, Silver and Grek-Martin [21] examined the impacts of the F3 tornado that struck Goderich, Ontario, Canada on 21 August 2011, and found that strong feelings of social cohesion and optimism of the participants persisted well beyond the short-term “honeymoon phase” predicted by the literature. Such positive outcomes resulted from their shared experiences during and after the disaster. As the Sendai Framework for DRR stipulates the new paradigm of “building back better” [15], disasters can provide opportunities for building better private and public infrastructures, and upgrading local socioeconomic structures that contribute to the sustainable development of the affected areas. Immediately after the 2015 Nepal earthquake, more than 33 countries sent rescue teams and dozens of international humanitarian organizations provided various forms of assistance, spending over USD2 billion within a few weeks of the earthquakes (i.e., about one-fifth of the governmental budget of Nepal in the fiscal year 2016/17) and pledged USD 4.4 billion for reconstruction, which is about one-third of 2016/2017 national Gross Domestic Product [23,24]. Even though it is difficult to estimate the amount of private contributions, it could be much larger than that of the donor agencies for a number of reasons. For instance, the Nepali migrant and diaspora population living abroad played a significant role in collecting and mobilizing funds [25]. Similarly, an unprecedented amount of private support was also mobilized through crowd-sourced funding and other personal channels, which is shown by the top 8th Google search term in 2015 being “how can I donate to the Nepal earthquake”, which had over 85 million searches [26]. Murton [27] and Paudel and Le Billon [28] argued that post-earthquake reconstruction shifted Nepal’s development paradigm to a large-scale, infrastructure-based sustainable economic growth. Moreover, a considerable amount of humanitarian aid, NGO-led post-disaster livelihood programs [29,30], increased microfinance activities, savings and credit institutions [31], and increased remittances for daily living of the poor and vulnerable [23,25,32] have collectively created a considerable opportunity for the desired outcome, particularly among the hardest-hit rural communities. Therefore, we expect significant progress in well-being in the hardest-hit mountain areas with households as well as public infrastructure and enhanced community resilience following the “building back better” paradigm.
Moreover, in the context of limited micro-level studies of disaster impact on hard-to-reach rural mountain communities, which are focused on households and communities, this study provides a unique case centered in Nepal, assessing the impact of a major earthquake on human well-being in a rural mountain village. Due to its unstable geography and climatic conditions, Nepal is also one of the 20 most disaster-prone countries in the world, where more than 80% of the population is at risk of natural hazards [33], but possesses minimal capacity to cope with disasters. Thus, understanding such tangible and intangible impacts induced by devastating natural disasters is useful to streamline development interventions towards the sustainable development of vulnerable communities in disaster-prone locations, especially rural hills and mountains [34].

2. The 2015 Nepal Earthquake and the Study Area

2.1. The 2015 Nepal Earthquake
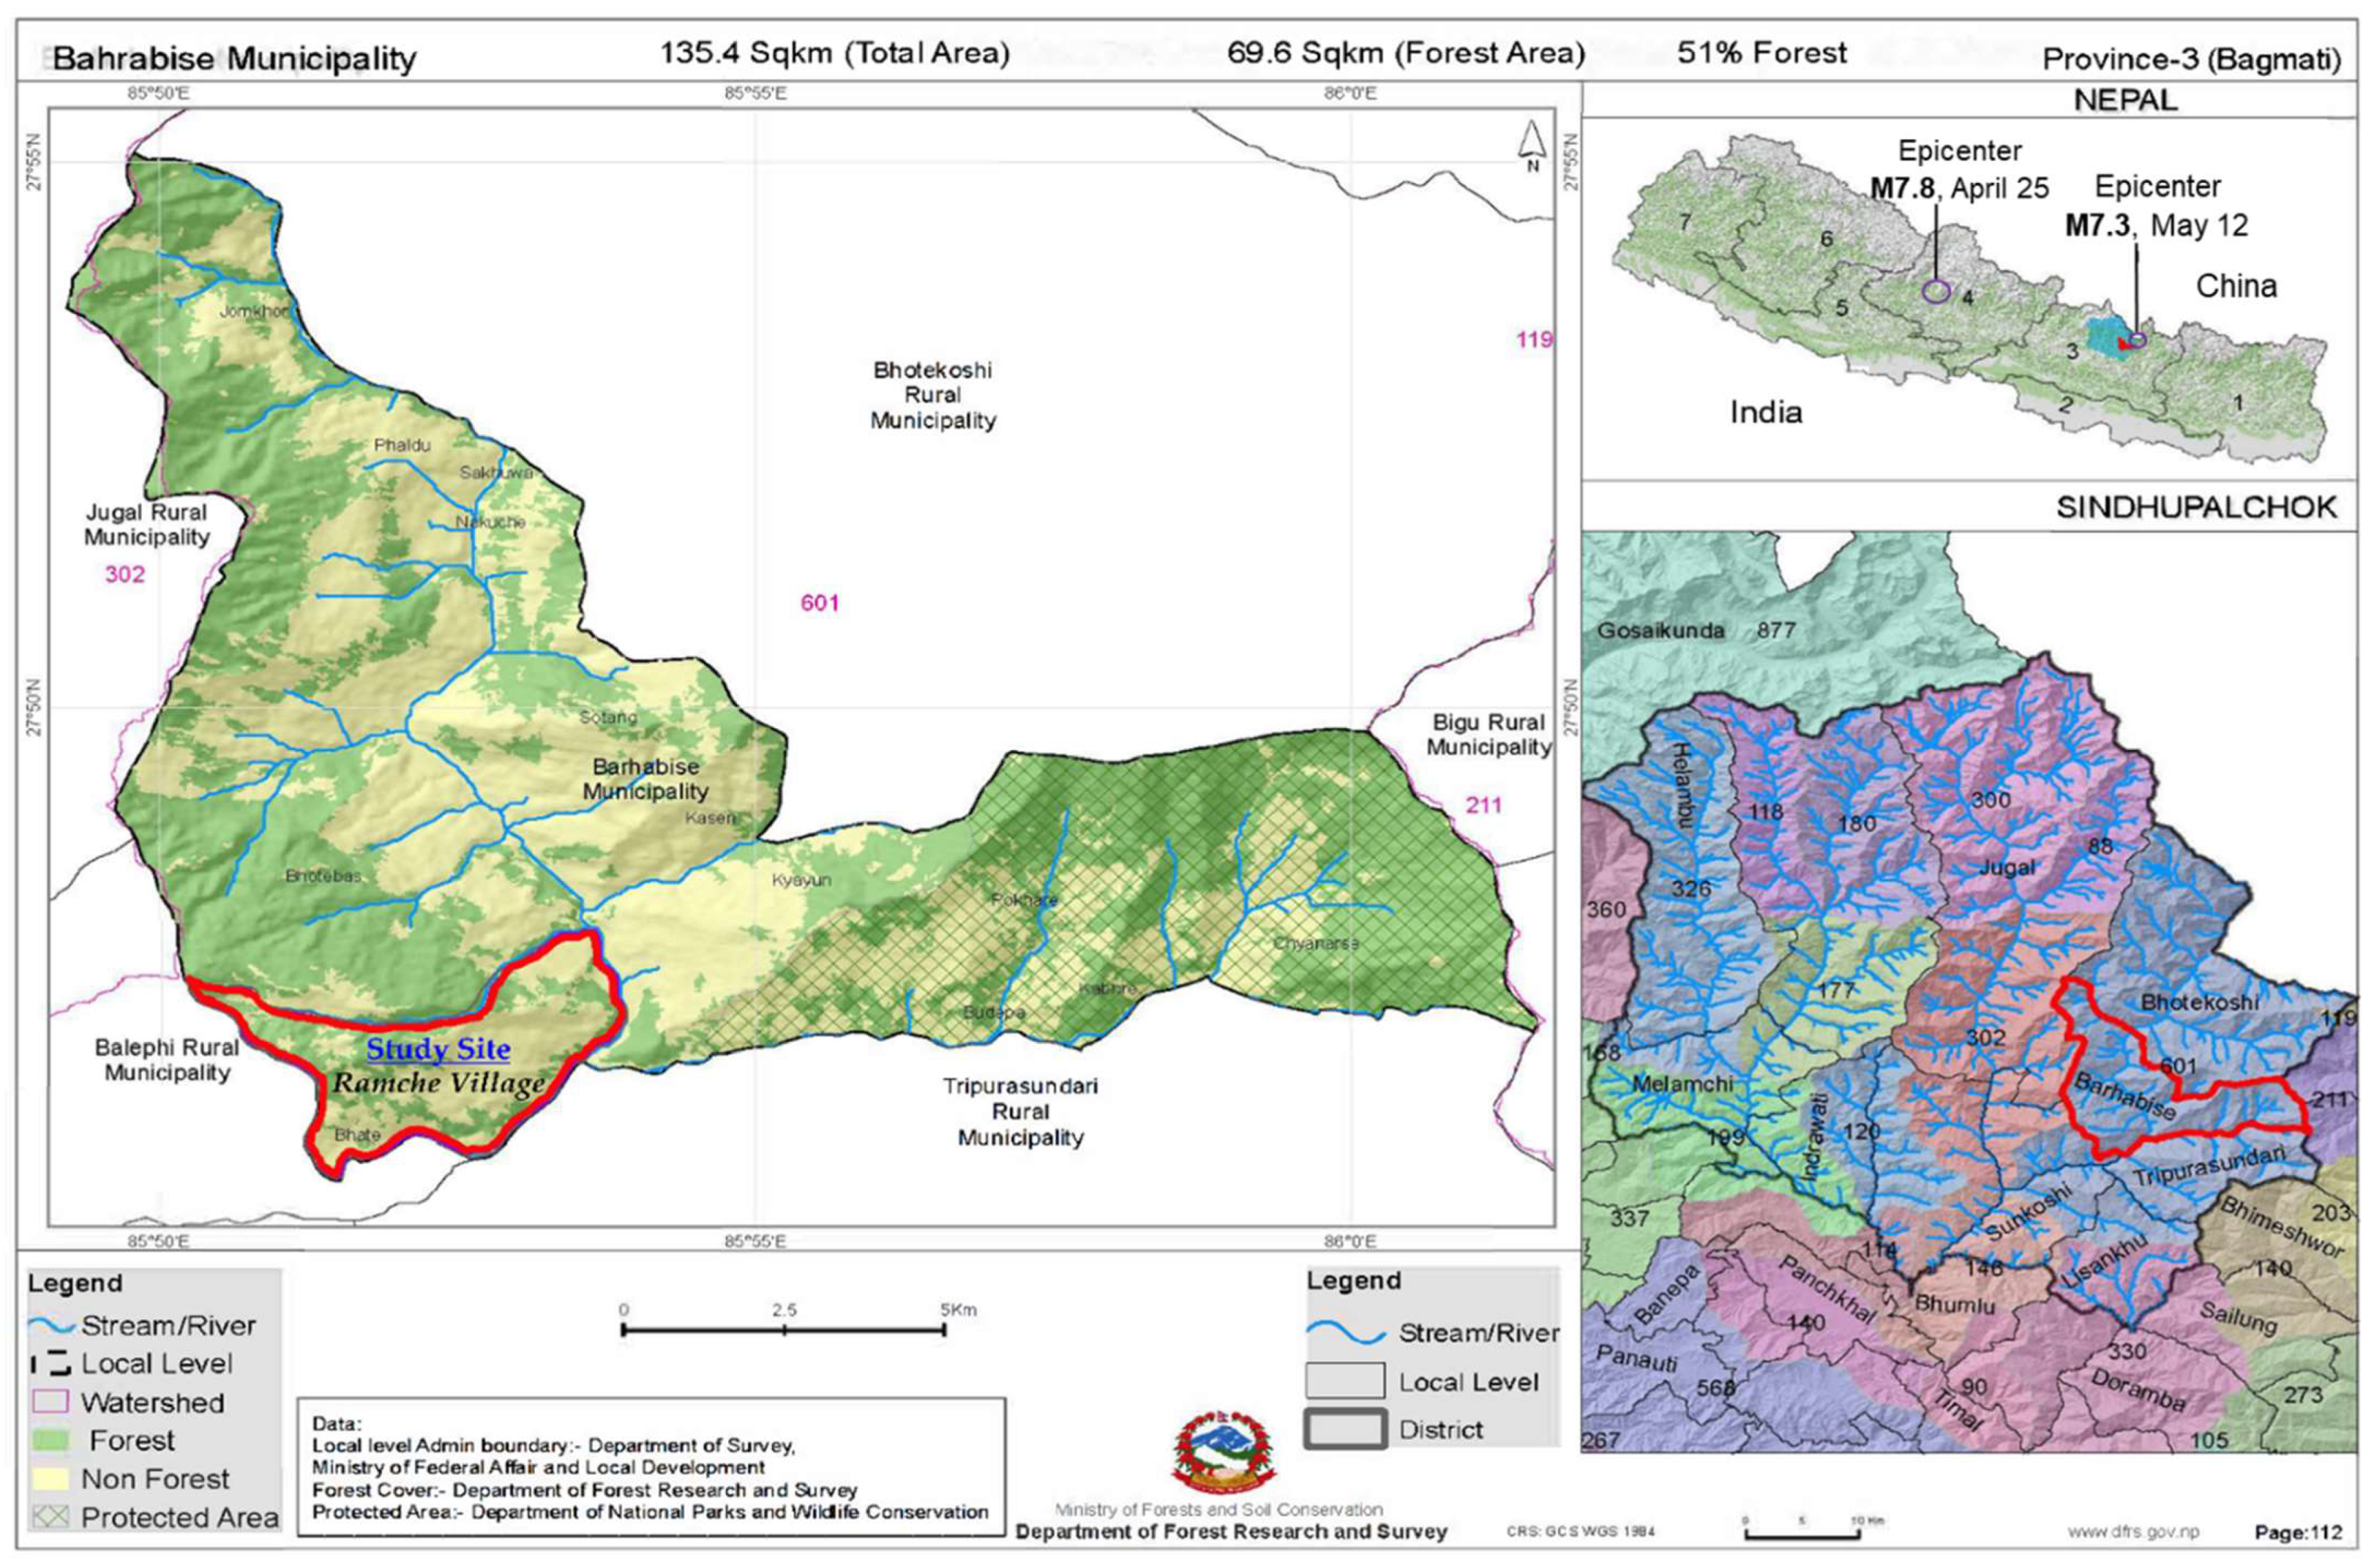
Nepal ranks 11th in relative vulnerability to earthquakes globally, as its entire territory lies in a high seismic hazard zone of the Himalayas. Nepal has experienced 19 earthquakes with considerably high impacts since 1255, the year when a historically significant earthquake was reported [35]. The 2015 Nepal earthquake was the latest after the largest 8.0 magnitude event, known as the 1934 Nepal-Bihar earthquake.
The epicenter of the 2015 Nepal earthquake was at Barpak village of Gorkha District. Over 400 aftershocks with a magnitude greater than 4.0 have been recorded since then. The latest updates show that this resulted in at least 8790 people being killed, 22,300 being injured, and approximately two million inhabitants displaced in Nepal [3,36]. Moreover, the earthquake and its aftershocks greatly affected the neighboring countries. For instance, at least 78 people were killed and 560 were injured in India, at least 25 people were killed and 383 injured in China, and 4 people were killed and 200 injured in Bangladesh. This tragic natural disaster destroyed or damaged about 1,000,000 private houses and 5278 public buildings, while the total economic damage and loss was estimated at around USD 7 billion [36].

2.2. The Study Area

Ramche village was chosen as the study area due to its huge geographical and cultural diversity. Figure 1 shows the location of the study site, which lies in Ward no. 9 of the Bahrabise Municipality of Sindhupalchok district. According to the National Reconstruction Authority (NRA), Sindhupalchok is one of the 33 districts to be most affected by the 2015 Nepal earthquake, incurring the highest recorded casualties of 4999 deaths (56.9% of the total deaths due to the incident). Similarly, 2955 people were injured, 156,929 houses were destroyed or damaged (nearly 96.8% of the total houses), and about 88% of the population in Sindhupalchok were displaced during the peak emergency period [36].
The study area is located in the central-northern part of Nepal, just 21 km from the border of Tibet, China. The altitudes of the village area of 39.3 square kilometers range from 800 m to 2900 m above sea level. The socio-cultural and economic diversity of the municipality is also very high. According to the data collected by the municipal office in 2018, 2890 people were living in 928 households and most of them were dependent on subsistence agriculture. There were over 10 caste/ethnic groups that practice five different religions and speak nine different languages. The NRA data shows that the earthquake killed 259 people, injured 183 people, and destroyed or damaged 11,467 houses in Bahrabise Municipality, whereas it killed 17 people, injured 53 people, and destroyed or damaged 910 houses in Ramche village [36].
In 2016, when the survey was conducted, a Village Development Committee (VDC) was the smallest administrative unit in Nepal. However, under the new Constitution of Nepal that was promulgated in 2015, the new local governance system came into effect in 2017, which granted huge authority and numerous responsibilities to the local governments. Since then, Ramche village is now in Ward no. 9 of Bahrabise Municipality. Figure 2 shows the new administrative structure of the Nepalese government. After the significant increase in geographical size and autonomy under the new constitution, local government bodies were restructured into 481 rural municipalities, 246 municipalities, 11 sub-metropolitan cities, and six metropolitan cities across the 77 districts in Nepal. Owing to the increase in responsibilities and resources of the local governments by the new mandate, they played central roles in immediate earthquake response, recovery, and reconstruction.

3. Materials and Methods

3.1. Sampling, Questionnaire, and Data Collection

Out of 399 randomly selected households in the first round of the survey in February 2016, only 337 households could be accessed for the second round in March 2020. Among the 62 inaccessible households, some already migrated from the village, some were not in the village temporarily, and some refused to participate in the second round. However, to ensure that our panel data was more useful, we tried to replace these sample households with other households having similar socioeconomic characteristics from the same neighborhood. The replacing households were selected based on the gender of the household head, caste/ethnicity, and household income, given that our objective was to assess the progress across gender, caste/ethnicity, and household income. As a result, 46 new households replaced the absent samples, and the remaining 16 could not be replaced due to the unavailability of suitable replacements. Therefore, this study used the panel data of 383 households, and we argue that the errors caused by the replacement were not significant.
Table 1 shows the sample distribution by sociodemographic characteristics. Since our respondents were household heads, 29% of the sample containing female respondents was remarkably high for a highly patriarchal society such as rural Nepal. It is, however, largely because of the increasing rural-urban and international migration of rural men [38]. While 60% of respondents were below 50 years old, 20% were 50–60 years old, and the remaining 20% were above 60. Concerning religion, 71% of the respondents were Hindus and 23% Buddhists. The sample was also highly diverse in terms of caste and ethnicity.
We used the third Nepal Living Standard Survey (NLSS) questionnaire to assess the objective well-being of the households [39]. The survey questionnaire was distributed in the local language, Nepali. All the questions were read and explained one by one to each of the respondents. Their answers were instantly noted on the questionnaire by the enumerator. The questionnaire was 18 pages long and, hence, was not suitable to be published as a part of the paper. However, both the Nepali and the English-translated versions of the questionnaire are available upon request. The questionnaire was designed to collect information on demography, access to infrastructure, household income and consumption, health and education, and perception of public services. The income data included the agricultural production from their own land or rented land as well as monetary income, if any. Similarly, the consumption data included the consumption of the household, considering all the monetary expenditures. Regarding agricultural income and expenditures, the respondents were asked about the quantity of agricultural production and consumption of their own land, from shared cropping, and other means, if any. Then, the income and expenditure were converted into monetary value using the local market price of each item.
A subset of the questionnaire related to the impact of the earthquake and their responses and recovery was included. This section of the questionnaire was modified for the second round of the survey. Particularly, we redesigned this section of the questionnaire based on Lin, Wang, and Liu [40] in order to assess the perception of recovery for the affected household. The respondents were asked about their perception of recovery, house recovery condition, family recovery power, and reconstruction investment. The questions related to “disasters in general” were also asked in a separate section to assess respondents’ perception of other natural disasters such as landslides and flooding, which affect the village more frequently than an earthquake. Similarly, OHQ was used to assess subjective well-being. The questionnaire is further explained in the subsequent sub-sections.

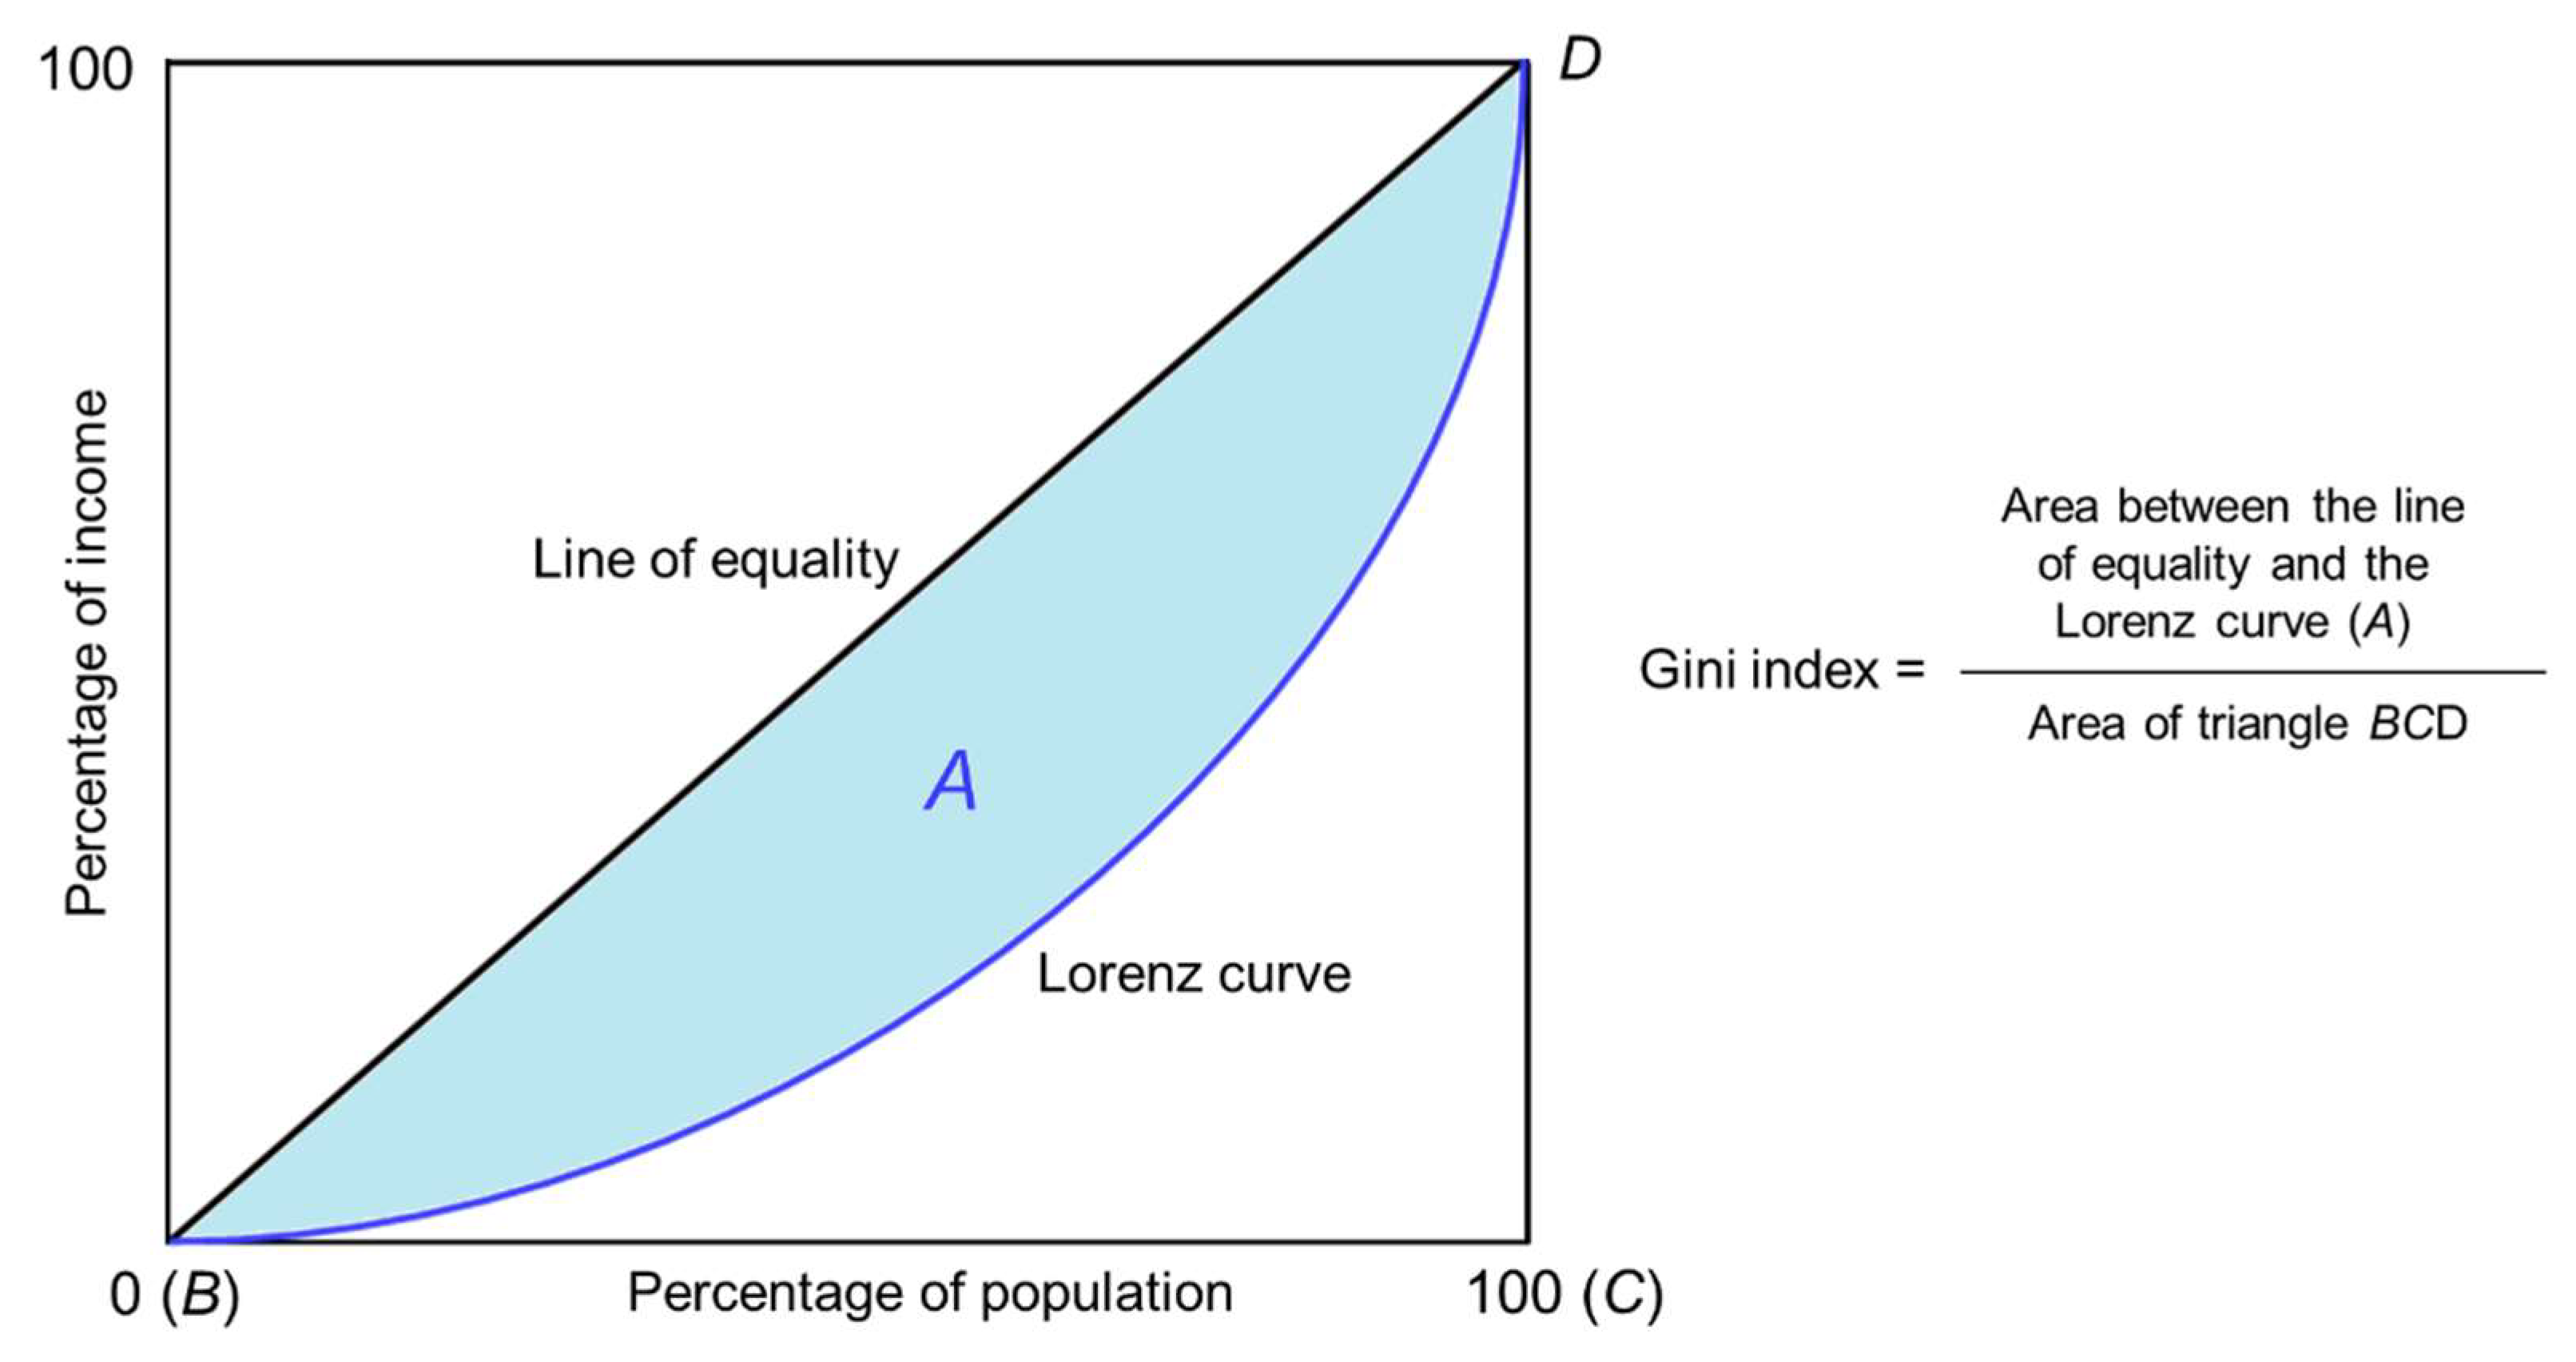
3.2. Measuring Poverty and Inequality

We followed the CBS [29] to find out the poverty headcount rates and the inequality measure, as it provides the latest official data related to the national poverty line. In the third round of the NLSS, the official nationally representative comprehensive household survey, the national poverty line of NPR 19,261 was applied as the cut-off to the consumption data for calculating the percentage of poor households in the region. Thus, households with per capita consumption below the national poverty line were considered poor. We used this poverty line of NPR 19,261 (USD166) [41] adjusted with annual inflation to find out the poverty headcount index for 2016 and 2020.
To calculate the poverty headcount index in 2016 (P2016), first, we calculated the average consumption per person based on the household survey and determined the number of poor households with an income less than NPR 19,261 per person (N2016). If the total number of sample households is denoted by N, the poverty headcount index in 2016 is calculated using the following equation:
P2016 = (N2016/N) × 100%
Similarly, we used the Gini index introduced by Gini [42] to measure income inequality across households. According to the OECD (n.d.), “the Gini index measures the extent to which the distribution of income (or, in some cases, consumption expenditure) among individuals or households within an economy deviates from a perfectly equal distribution.” Inequality on the Gini scale ranges from zero, when the distribution of income or consumption is perfectly equal, to one, when all the income or consumption goes to a single household.
To calculate the Gini index, we used the Lorenz curve as shown in Figure 3. The Lorenz curve displays the proportion of total income against a certain proportion of the respondents. If everyone has the same income or consumption, the Lorenz curve becomes a perfect 45-degree straight line, or BD in the figure, also known as the line of equality. If household income becomes more unequally distributed, the Lorenz curve moves further away from the line of equality and the area between the curve and the 45-degree line increases. Thus, the Gini index is equal to the area between the line of equality and the Lorenz curve (i.e., shaded area A) divided by the area of triangle BCD.
The household survey data were processed in Stata software to calculate the poverty headcount index and the Gini index.

3.3. Assessing Subjective Well-Being—Happiness

Stieglitz, Sen, and Fitoussi [43] argued that assessment of both objective and subjective aspects of human well-being is important, as each of them complements development studies. However, the effects of natural disasters on subjective well-being, such as increased fear and anxiety, are indirect and much more difficult to assess. Subjective well-being and happiness are interchangeably used terms, and this study has used the OHQ to assess the subjective well-being of the respondents. The OHQ is used widely in various settings, such as rural and urban areas and developing and developed countries [44,45,46,47]. As the survey was conducted in the Nepali language, the OHQ was translated into Nepali, which might have caused some discrepancies in the meaning of the statements. However, we believe that discrepancy was not significant and the OHQ could reliably capture the subjective well-being of the respondents.
Another limitation of assessing subjective well-being is that individuals might feel inhibited to show their unhappiness, and this inhibition might differ systematically among groups. For instance, the so-called “upper” caste group might be less likely to admit to being unhappy than the so-called “lower” group. To address this problem, we invested some time to create a favorable environment where respondents would feel comfortable to talk openly. The enumerators were also trained to crosscheck the respondents’ answers by asking questions with different wording and changing the context of the questions. Thus, we believe that such bias did not affect our results significantly.
Based on the original Oxford Happiness Inventory (OHI) developed by Argyle, Martin, and Crossland [48], Hills and Argyle [49] developed the OHQ in 2002, which is a widely used scale to assess personal happiness. The OHQ consists of 29 questions concerning sociability, sense of control, physical fitness, positive cognition, mental alertness, self-esteem, cheerfulness, optimism, empathy, feelings, life satisfaction, and life evaluations to account for the current level of happiness [49,50]. The questions were structured as statements, which could be answered using a six-point Likert scale, with ‘1’ being “most unhappy” and ‘6’ being the ‘happiest” (for details, see [49]). The respondents were asked to listen to each of the statements (questions) carefully, as some statements were phrased positively and others negatively. To calculate the overall happiness score of each respondent, first, the score of each of the negatively phrased statements was reversed. For example, one was changed to six, two was changed to five, and four was changed to three. Finally, summing up the scores for all 29 questions and dividing the total by 29, the overall happiness scores for each respondent were calculated. The chance to obtain the highest possible score, six, and the lowest possible score, one, is rare. Many studies show that people are somewhat happy on average [48,49,50,51]. Thus, most people might register the average score, which is around four. Table 2 shows a brief interpretation of the happiness score. People recording a score higher than 3.5 are considered happy as it is the exact numerical average of the possible answer.

4. Results

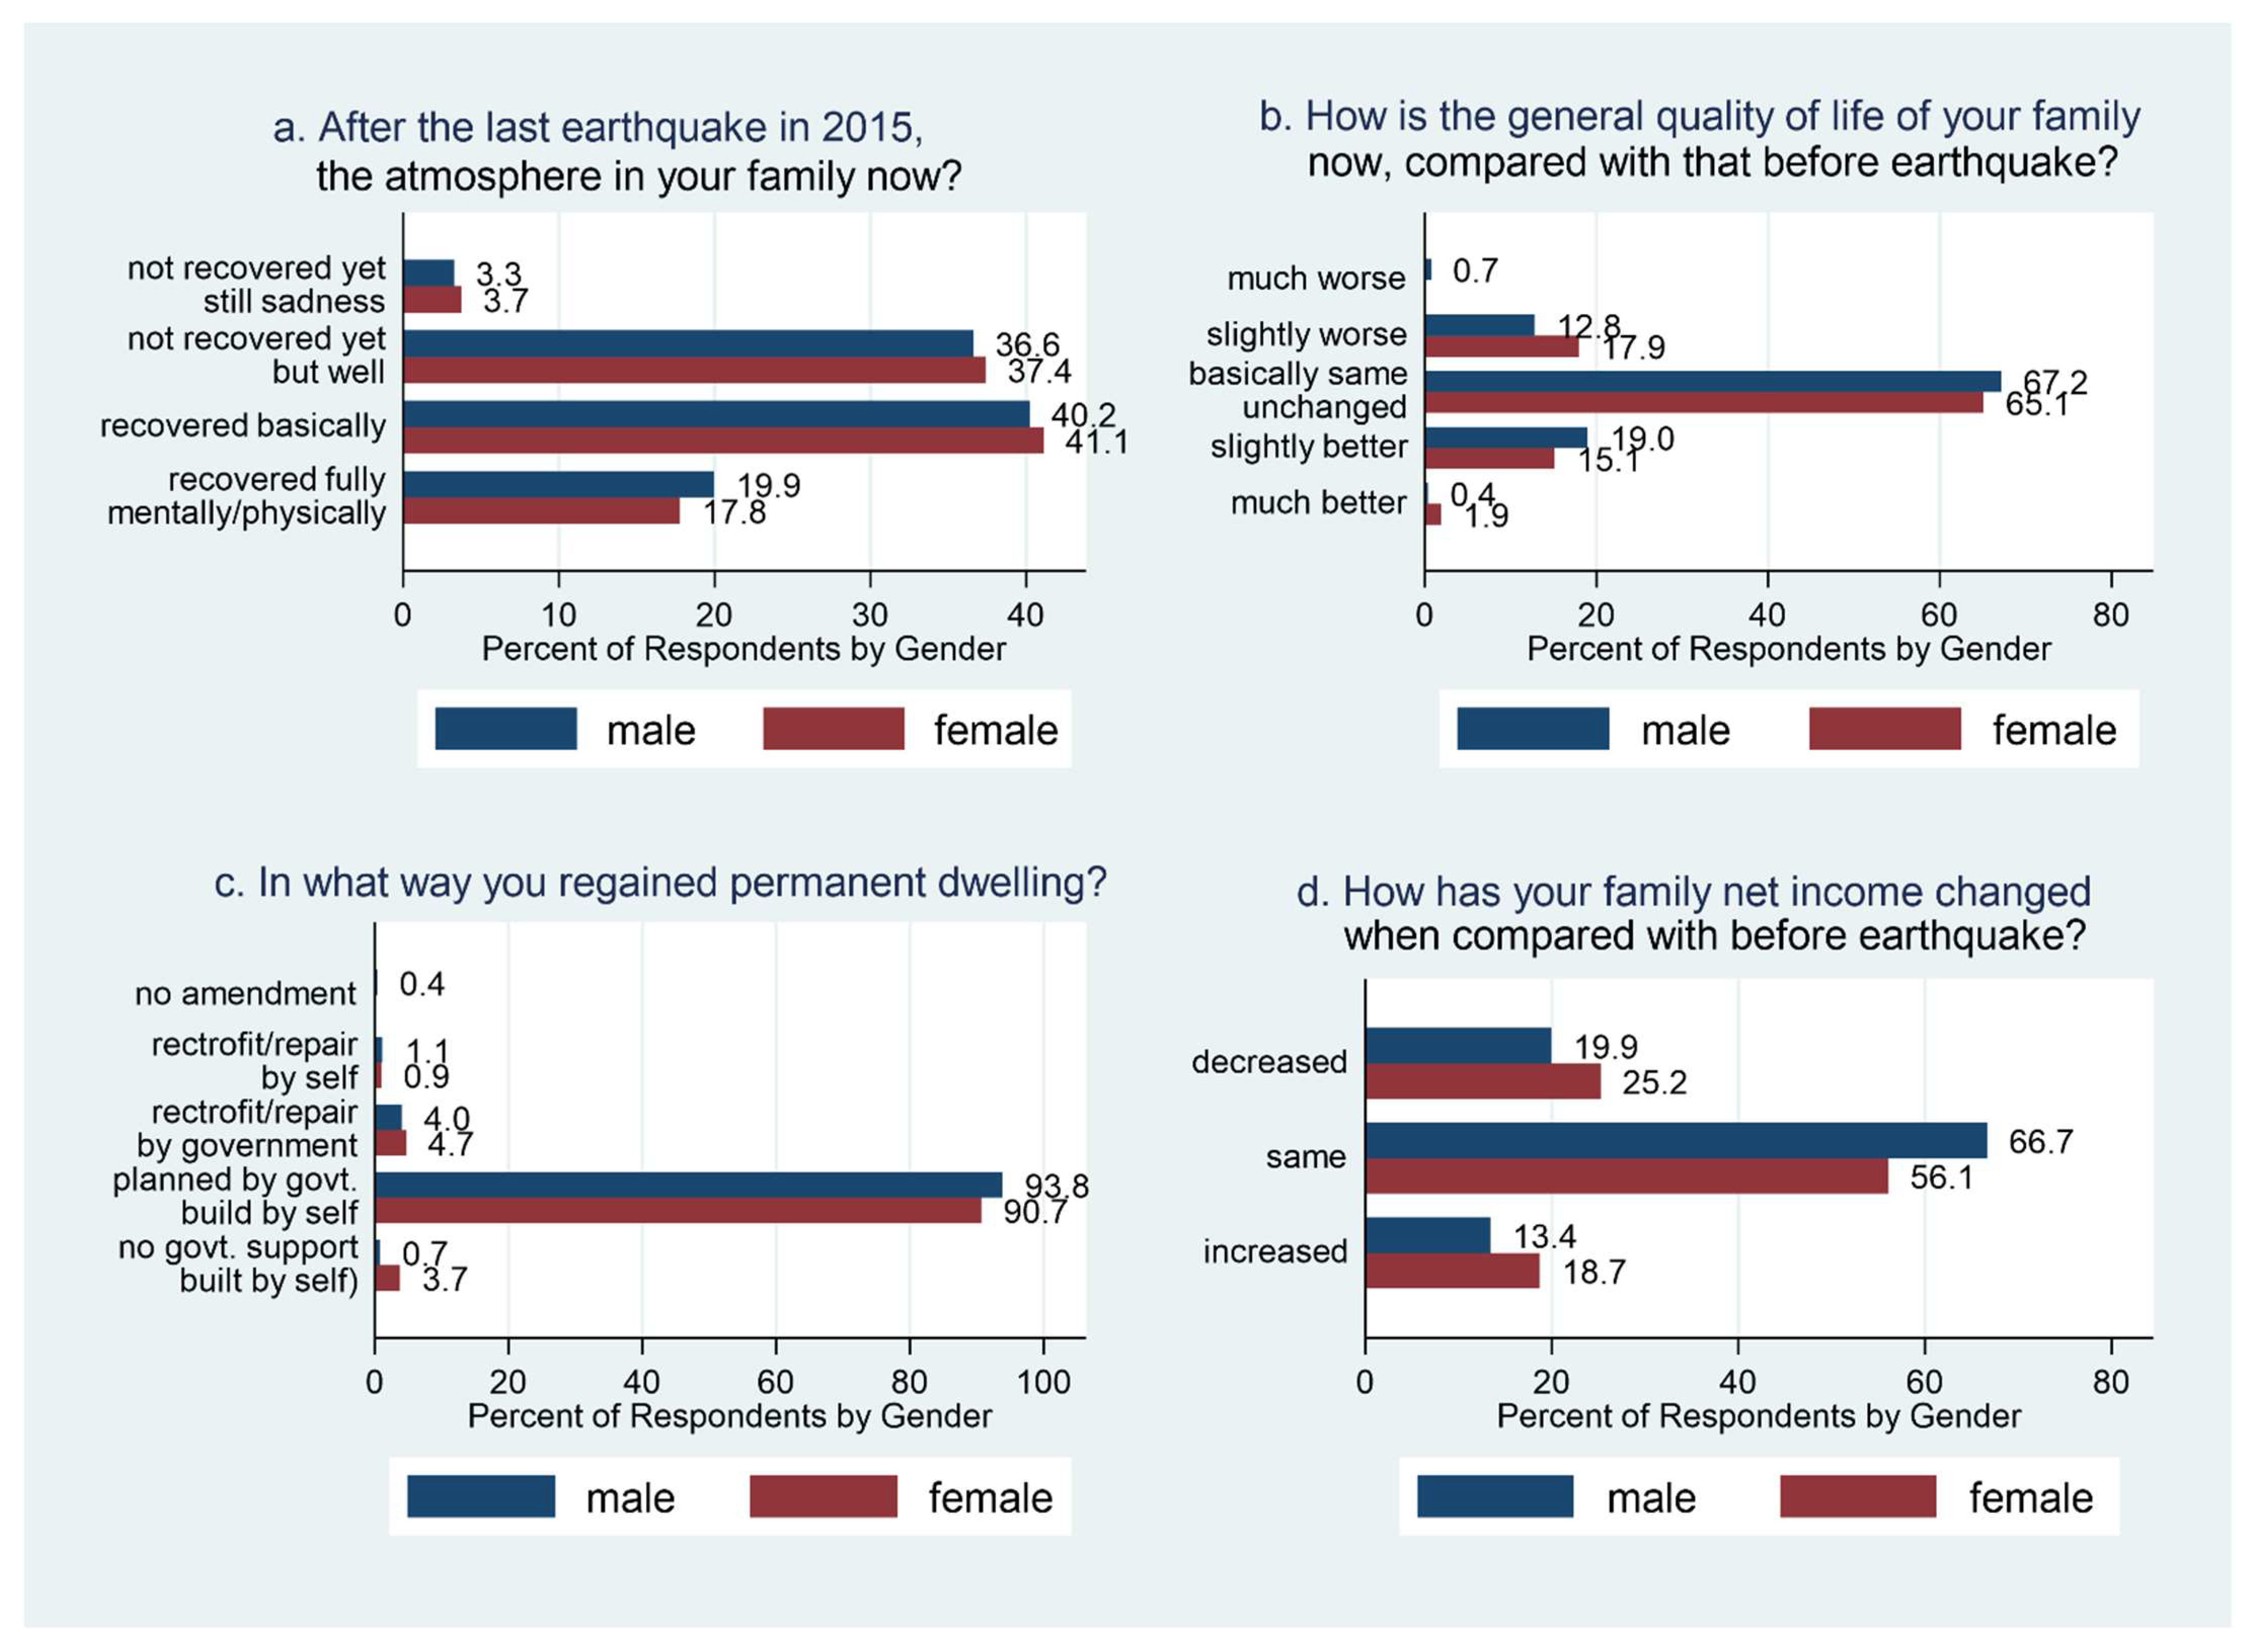
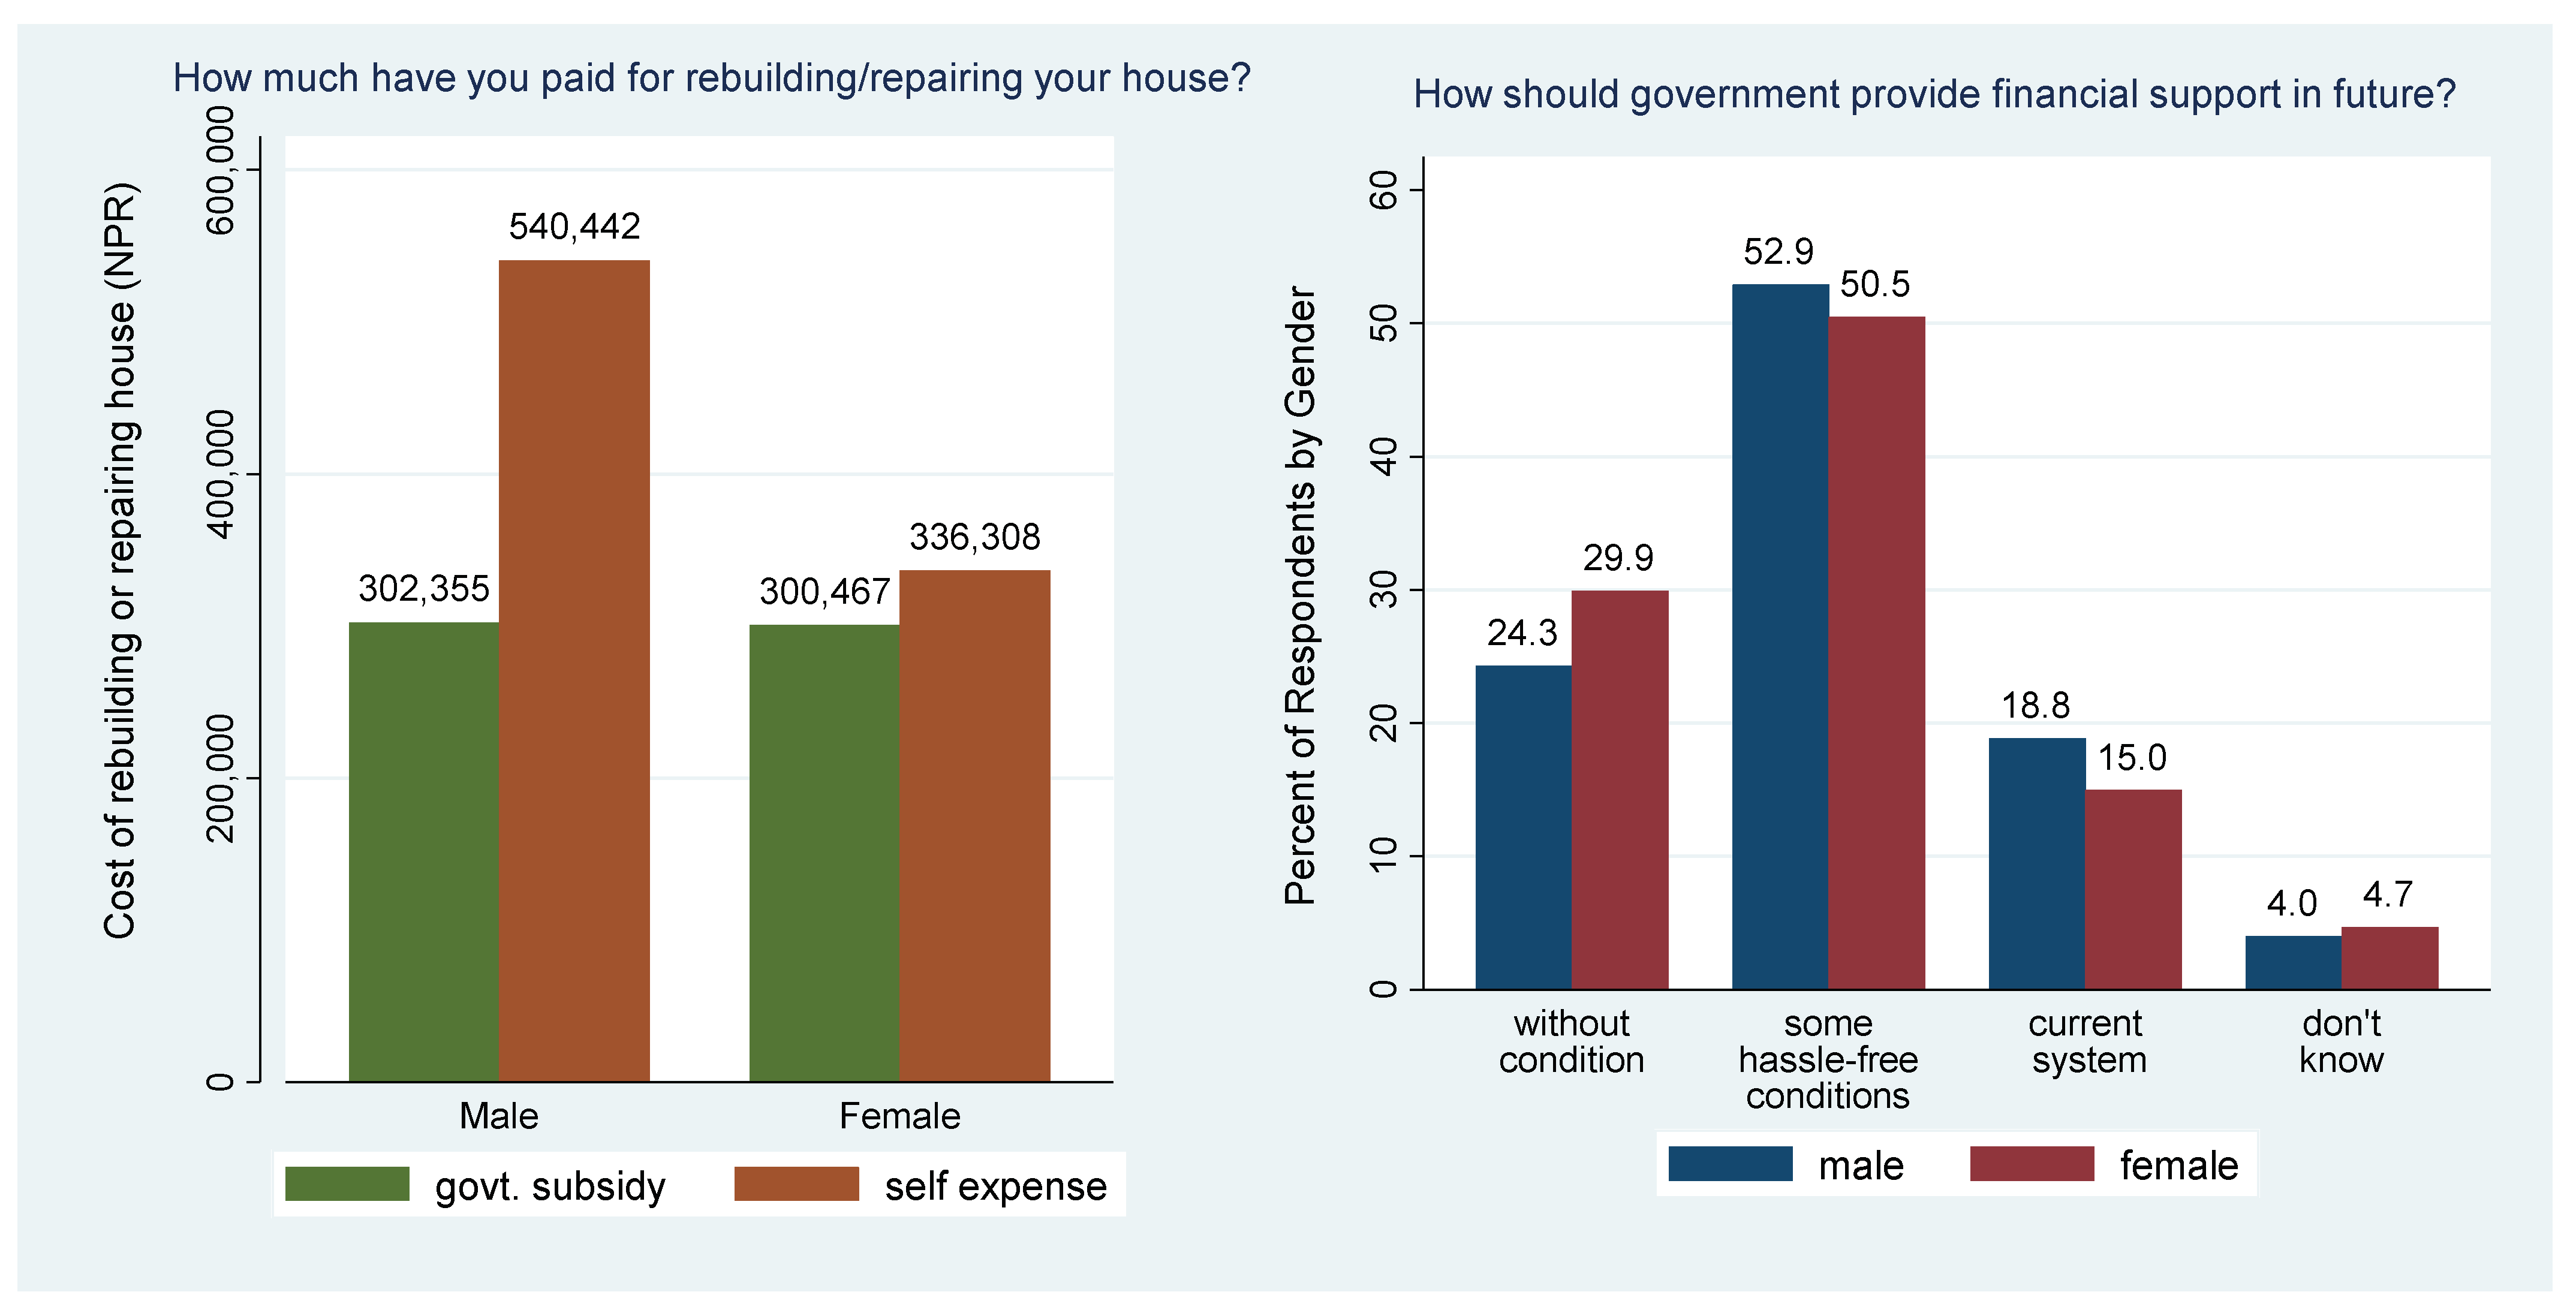
4.1. Reconstruction and Recovery Up to March 2020

Figure 4 shows the perception of recovery, the situation of reconstruction of family houses, and their income by gender in March 2020. The respondents were asked, “After the last earthquake in 2015, how is the atmosphere in your family now?” and the result is shown in Figure 4a. While 3.3% male and 3.7% female respondents said, “not recovered yet, still in sadness,” 40.2% male and 41.1% female respondents remarked that they were “recovered basically” and 19.9% male and 17.8% female respondents said “recovered fully, mentally as well as physically.”
Figure 4b shows the result for the question, “How is the general quality of life of your family now, compared with that of before the earthquake?” Notably, the vast majority of the respondents, both male (67.2%) and female (65.1%), answered: “basically same, unchanged.” More interestingly, 19% male and 15.1% female respondents believed that their family has a slightly better quality of life after the earthquake than before. Nearly 2% of female respondents found themselves in an even “much better” situation. Nevertheless, 12.8% male and 17.9% female respondents reported that their family’s quality of life is still slightly worse than before the earthquake.
Similarly, Figure 4c shows that over 90% of the respondents built their new permanent dwellings following the government’s plan. Only less than 5% of the respondents were using their existing dwellings after they were retrofitted or repaired by the government. Notably, 3.7% of female-headed households in the sample built their house without acquiring a government subsidy.
Regarding the changes in family income, Figure 4d shows that the majority of the respondents, 66.7% male and 56.1% female, reported the same income as they did before the earthquake. While 19.9% male and 25.2% female respondents said their income decreased as compared to before, 13.4% male and 8.7% female respondents reported that their income have increased.
Figure 5 shows the level of reconstruction investment (left side) and respondents’ perception of government subsidy (right side). The government subsidy to reconstruct a family house was set at a maximum of NPR 300,000 per house, which was provided to the families in three installments after fulfilling certain conditions. There was also a provision for a conditional loan with interest for house reconstruction. While government subsidy was about NPR 300,000 for both male and female respondents, self expenses were much higher for male respondents. The disaggregated data revealed that self expenses for reconstructing the house for a Dalit were the lowest (NPR 247,333) among the caste/ethnic groups.
Most of the respondents were not satisfied with the government process of providing financial support. While only 18.8% male and 15% female respondents said they preferred the current system, more than half of the respondents said that “some hassle-free conditions” for providing a subsidy are needed instead of the current troublesome conditions. About 24.3% male and 29.9% female respondents said no condition is necessary to provide support during such tragic disasters. Notably, the families that lost their houses got NPR 50,000 at first without much hassle, but they needed to acquire approval from the government’s technical staff and local government officer after fulfilling certain level of construction in accordance with the prescribed house design to acquire the second installment of NPR 100,000 and the final installment of NPR 150,000.

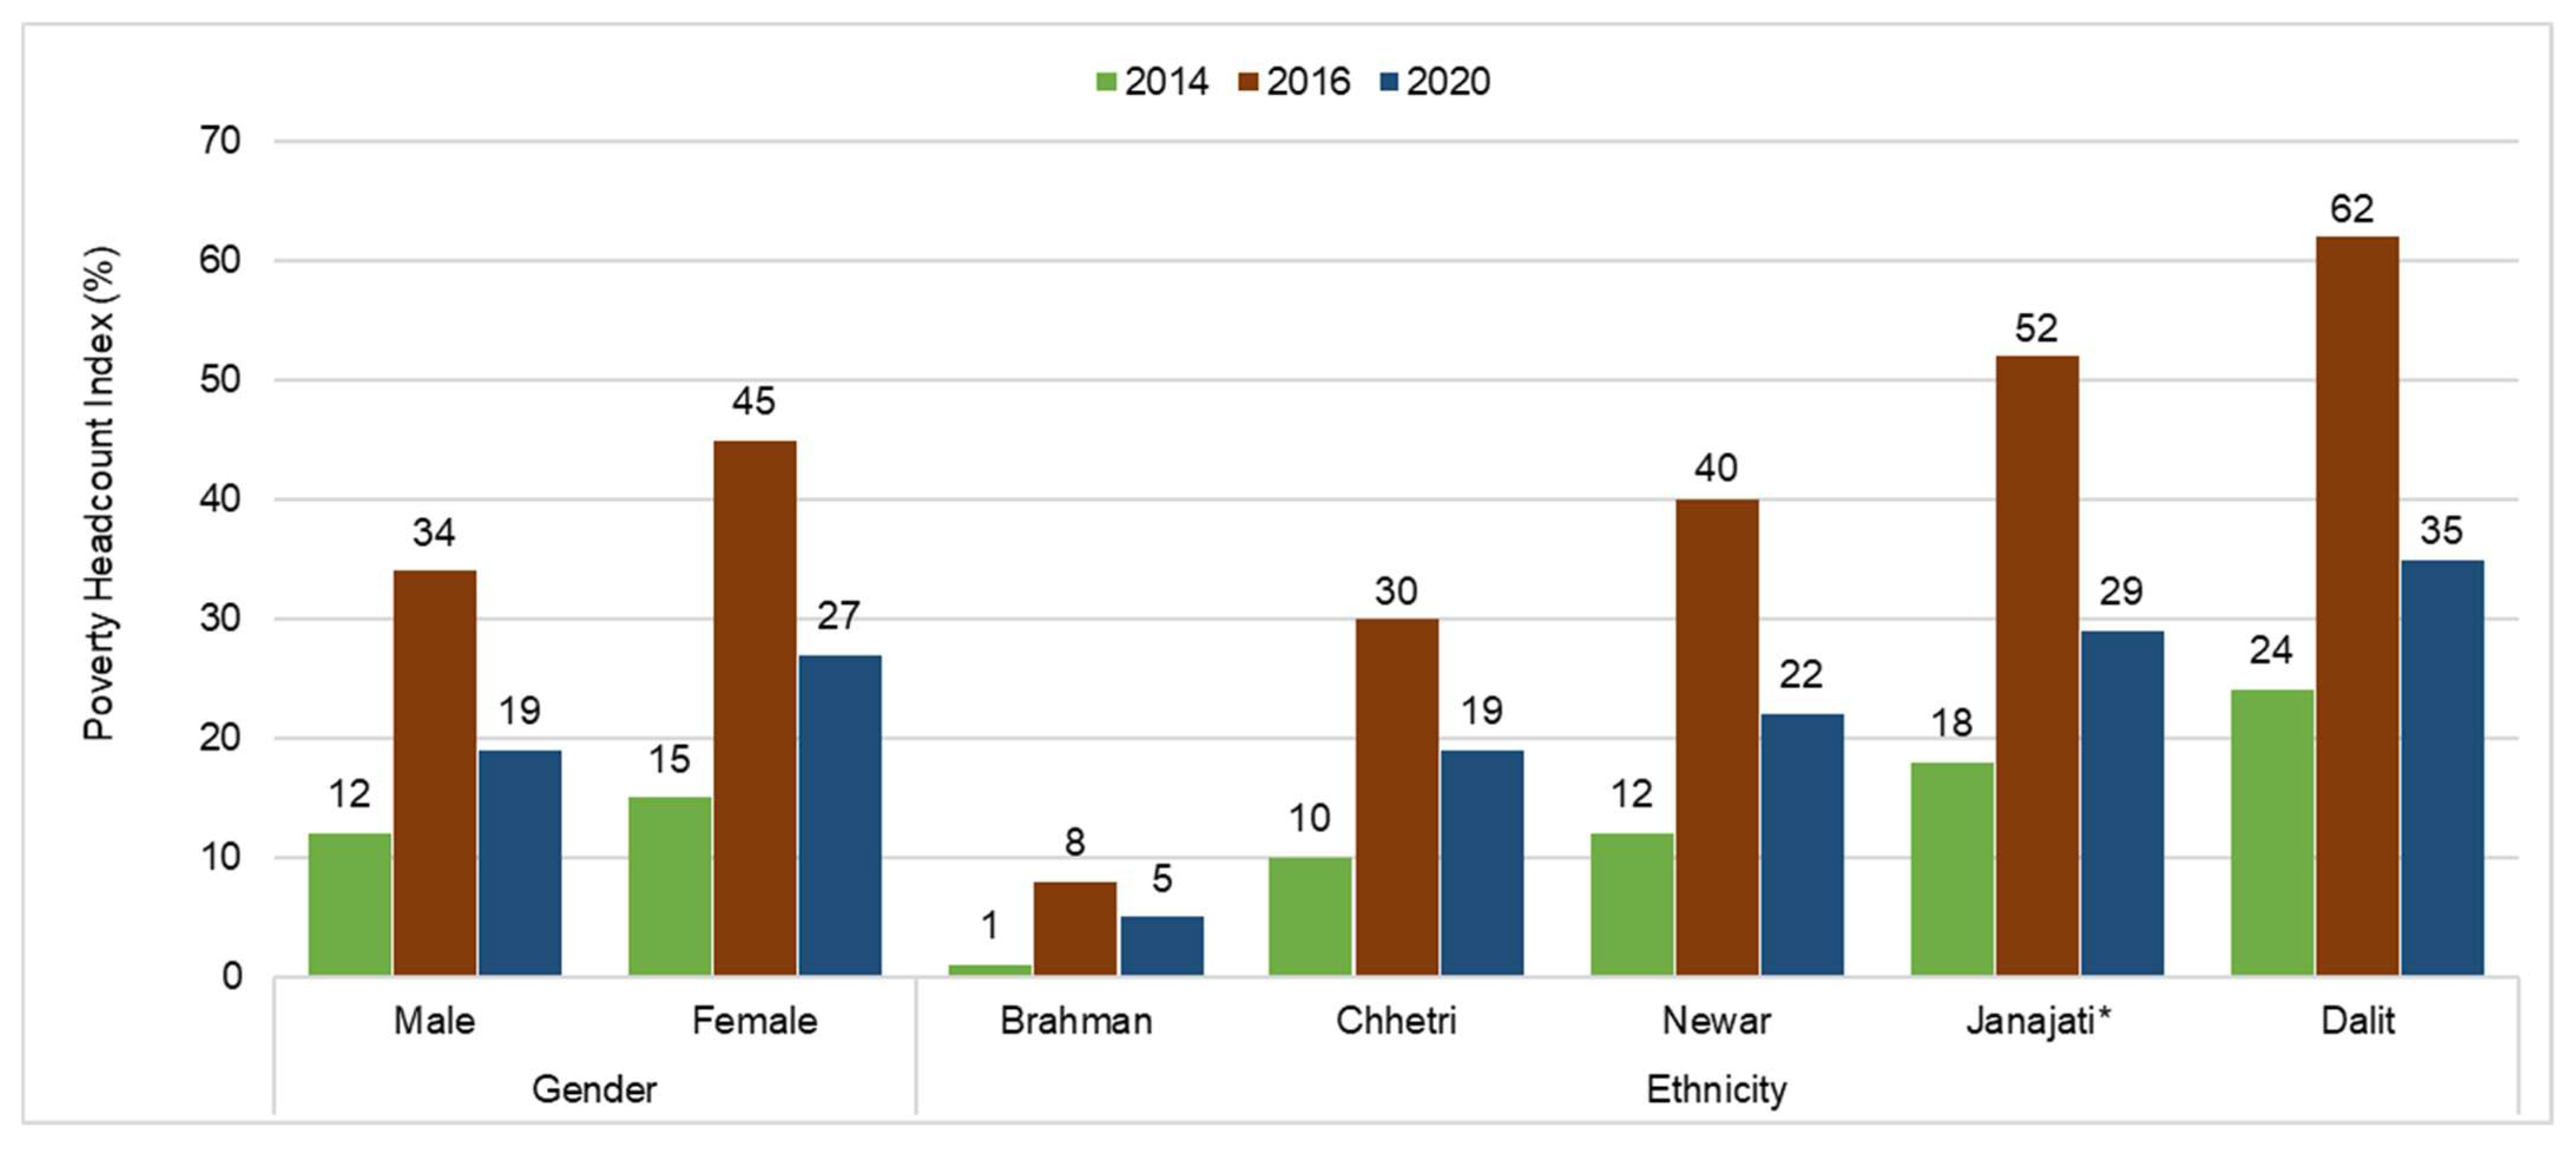
4.2. Poverty and Inequality before and after the Earthquake and in 2020

Figure 6 shows the percentage of the population living below the national poverty line (poverty headcount index) and income inequality measured by the Gini index of the village in 2014, 2016, and 2020. The poverty and inequality figures for 2014 were obtained from the previous study conducted in the same village by Sapkota [38]. Out of the 100 households from three villages in Sindhupalchok District, he included 40 households from the four wards out of the nine wards of Ramche village, i.e., the current research site. Following the similar household survey method and using the same national poverty line as in this study, he found that 13% of the village population were below the national poverty line and had a Gini index score of 0.47. Therefore, despite using a smaller sample size and coverage areas than this research, the previous study provided a reliable benchmark for assessing the impacts of the earthquake on poverty and inequality. The bar diagram in Figure 6 shows that 13% of the population were living below the poverty line one year before the earthquake in 2014, which reached 37% in 2016 mainly due to the earthquake. The poverty rate declined to 21% in 2020.
The line diagram in Figure 5 shows that the income inequality of the village measured by the Gini index increased from 0.47 in 2014 to 0.48 in 2016. However, the income inequality of the village remained unchanged from 2016 to 2020.
Figure 7 shows the disaggregated result of poverty rate by gender and ethnicity. The poverty headcount index of female-headed households was higher at 15%, 45%, and 27% than male-headed households that were at 12%, 34%, and 19% in all the three survey years, 2014, 2016, and 2020, respectively.
The right side of Figure 7 shows a significant gap in the poverty rate among caste/ethnic groups. The poverty headcount index remained the lowest in all the three survey years for the so-called highest caste/ethnic group, Brahman, at 1% in 2014, 8% in 2016, and 5% in 2020. The poverty rates for all three years were recorded higher for so-called lower caste/ethnic groups as per the Hindu caste system. For example, while the poverty headcount index of the second-highest caste/ethnic group, Chhetri, was 10% in 2014, 30% in 2016, and 19% in 2020; the indexes of the lowest caste/ethnic group, Dalit, were 24% in 2014, 62% in 2016, and 35% in 2020. The poverty rate of Newar and Janajati was in between Chhetri and Dalit households in all the three survey years.

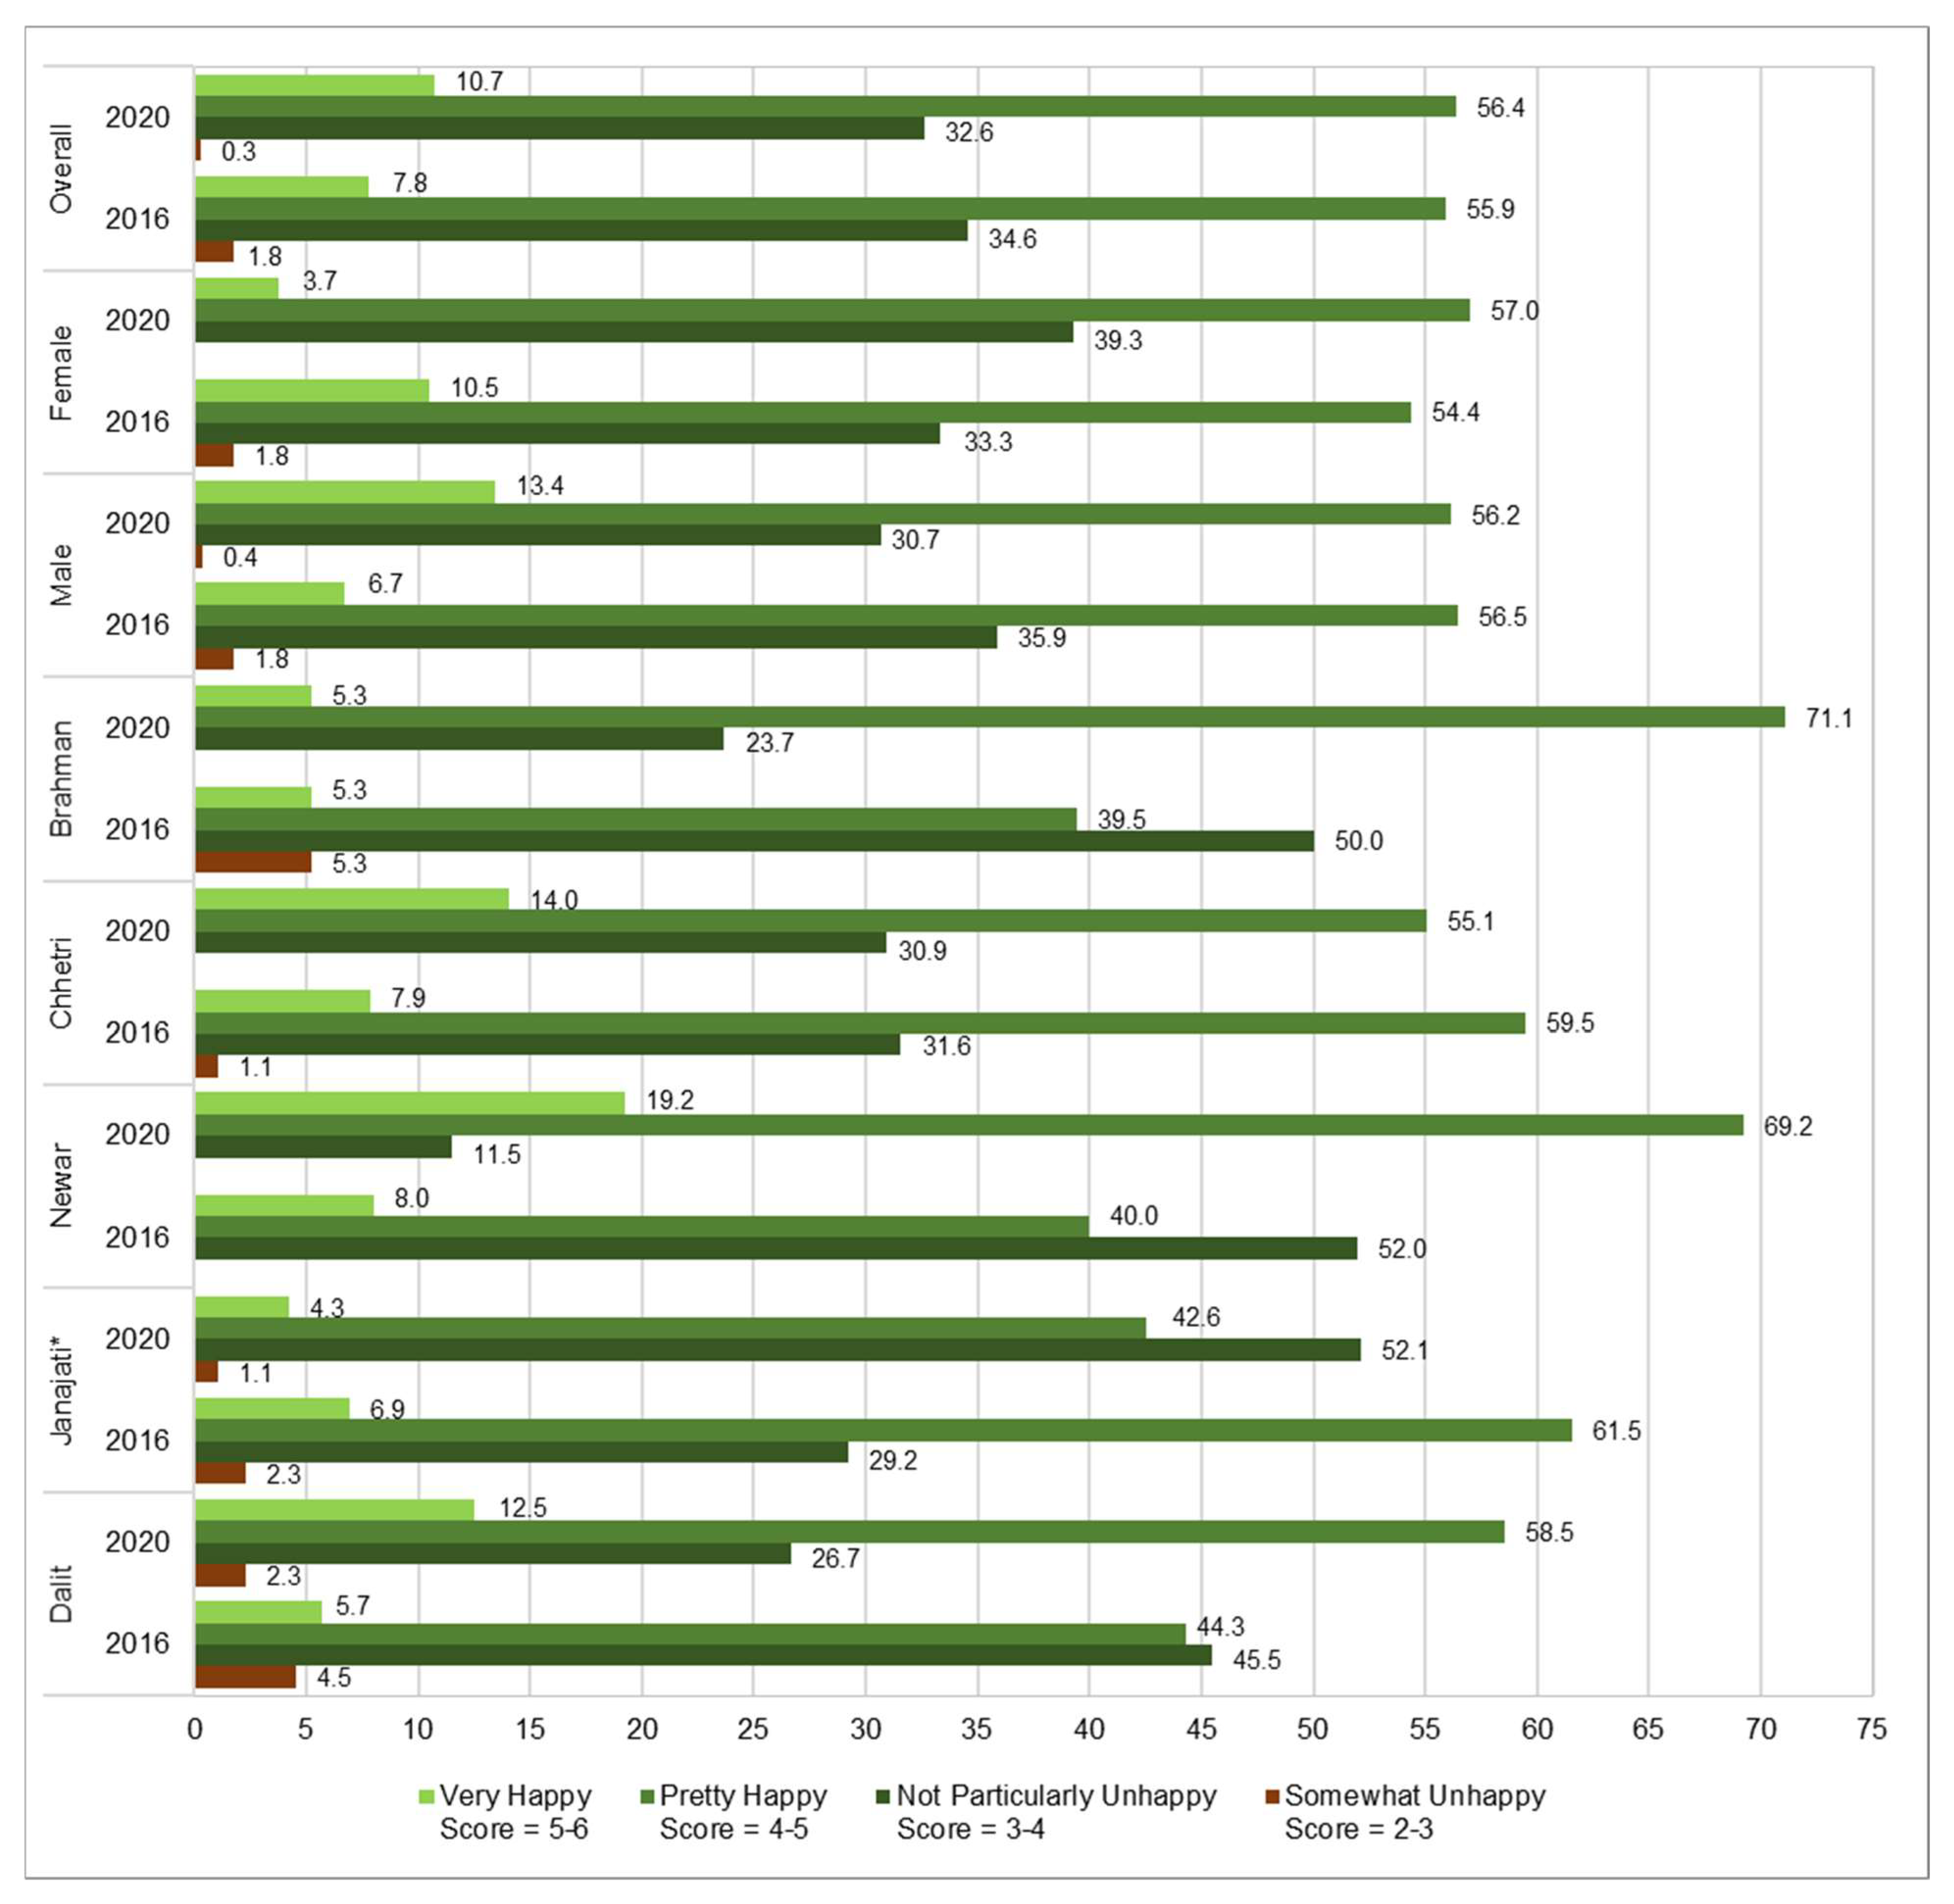
4.3. Subjective Well-Being or Happiness in 2016 and 2020

The happiness scores of the respondents measured by the OHQ are shown in Figure 8. As expected, both the percentage of “very happy” and “pretty happy” respondents increased from 7.8% to 10.7% and 55.9% to 56.4% from 2016 to 2020, respectively. While “not particularly unhappy” respondents decreased from 34.6% to 32.4%, “somewhat unhappy” respondents decreased from 1.8% to 0.3% during the same period.
The result shows huge variations in subjective well-being progress across gender and caste/ethnic groups. For instance, while the proportion of “very happy” and “pretty happy” female respondents were dropped from 64.9% to 60.7% from 2016 to 2020 and the proportion of male respondents increased from 63.1% to 69.6% during the same period. Notably, while the proportion of “very happy” male respondents doubled to 13.4%, that of female respondents dropped nearly by one-fourth from 2016 to 2020. Nevertheless, “somewhat unhappy” respondents were declined to 0% for females and 0.4% for males from 1.8% for both genders during the same period.
Among the cast/ethnic groups, the highest proportion of “very happy” and “pretty happy” was found for Newar at 88.4% in 2020 from 48% in 2016, followed by Brahman at 76.4% from 44.8%, Dalit at 71% from 50%, and Chhetri at 69.1% from 67.4% during the same period. However, the proportion of “very happy” and “pretty happy” Janajati dropped to 45.9% in 2020 from 67.4% in 2016. Notably, while none of the Newar respondents were unhappy in both survey years, none of the Brahman and Chhetri respondents were found to be unhappy in 2020.

5. Discussion

Despite the limited financial and knowledge resources in one of the LDCs as well as LLDCs in the Himalayan Mountain region [7] and many critical concerns regarding the recovery and reconstruction raised after the 2015 Nepal earthquake [4,6,52], we found that most of the households had recovered well in five years after the earthquake. Most of the respondents have better earthquake-resistant housing mainly financed by the government and increased awareness of disaster risks and resilience. It provides the opportunity for local authorities and stakeholders to design real-time surveillance systems based on big data and the Internet for dissemination of the critical information and mobilization of various resources, including human resources, soon after an earthquake and other disasters struck the community [53,54]. In addition, the field observations in 2016 and 2020 revealed that the village has increased the quality and quantity of infrastructure facilities. Similar results were discovered in other hardest-hit mountain villages. For instance, using survey data conducted in 2018 with affected people and professionals working on recovery, Platt, Gautam, and Rupakhety [55] found that the economy recovered in three years, and 90% of people were back in their homes. Moreover, a significant proportion of the population not only recovered well from the earthquake but also improved their overall quality of life, which are in line with the positive impacts of natural disaster in the longer term found in existing literature [56,57]. In the case of Nepal, the decentralized administrative structure with newly elected local to central governments under the new Constitution of Nepal in 2015 [58], the community-led owner-driven reconstruction, social inclusion and participation [59,60], and the donor community played crucial roles in these achievements [24,61].
However, specific supports are still needed for a considerable proportion of the population, as they got left behind in the recovery process. Over 3% of the population that has not recovered yet and is still in sadness is mainly from socioeconomically disadvantaged groups, such as women, lower caste/ethnic groups, and low-income households. More than 12% male and nearly 18% female respondents also reported that the quality of life of their families is slightly worse than before the earthquake. Furthermore, Dalit respondents received less subsidy although there were no discriminatory treatments based on caste/ethnicity, and gender was another dimension, which indicates the need for some form of positive treatment of the poor and weaker groups by letting them fully participate in the recovery and reconstruction process. Other studies also revealed the disproportionately higher impacts of disasters on women and vulnerable groups and emphasized the need for inclusive reconstruction and recovery policies [11,62]. Thus, identifying such lagging households and designing and implementing some supplement-targeted programs is of urgent necessity for inclusive recovery and boosting the resilience of the poor and vulnerable groups.
The provision of subsidies and other supports matter significantly to deliver optimum outcomes from the limited resources available, especially for the less developed countries such as Nepal. As most of the respondents felt some hassles in receiving the reconstruction subsidy and expressed the desire for a hassle-free procedure in the future, we argue that the recovery and reconstruction could have been much faster just by improving the support mechanism. Solutions [63] also explored the post-earthquake policies, including the reconstruction policy of cash grants, and argued that the actual cost of rebuilding was increased due to the various problems in the grant system and reconstruction policy. Thus, policymakers and other stakeholders should note this fact and design efficient support systems for disaster preparedness, recovery, and resilience.
Since the remotest community in the village and the poorest quantile population lost almost everything they had [44], poverty eradication, the number one target of the United Nations’ Sustainable Development Goals (SDGs) [62], in such areas becomes more challenging. Even though the proportion of the village population under the national poverty line declined by 16% during the two survey periods, the poverty rate was still much higher in 2020 than that before the earthquake. Moreover, the earthquake-induced inequality remained unchanged during the two survey periods. Even worse, the gender and caste/ethnic gaps in the poverty rate were increased posing more challenging obstacles for social inclusion, justice, and fairness to the poor population. Clearly, poor households not only need special support for building resilience against disasters but also targeted programs for income generation and asset building. Further study is needed to account for the current situation and its policy implication during and after the pandemic.
In general, people were found to be happier in 2020 than in 2016, indicating their increased mental and behavioral resilience capability due to them becoming more accustomed to difficult situations. It also indicates their growing household income and a greater feeling of ownership and participation in a democratic process in the highly decentralized local governance under the new Constitution of Nepal 2015. However, further study is essential to establish such impacts systematically.
Even though subjective well-being increased from 2016 to 2020 in general, a deterioration for female and Janajati respondents signals the necessity of further research to determine the real causes and possible solutions to this problem. Despite the improvements in objective well-being, why did these two groups of the population remain less happy than before? The disaster recovery and reconstruction program might have overlooked the gender inclusion aspect in addressing the local condition. Similarly, the Janajati consist of many endogenous groups and their characteristics might differ significantly in different parts of the country. The finding indicates that the government program could not benefit them equally. However, it is interesting to trace significant progress in the subjective well-being of Dalits, the so-called “lowest” caste group. Particularly, many NGOs have highly emphasized the needs of this marginalized group from the very beginning, which might have contributed significantly to this positive outcome. Similarly, the subjective well-being progress of Newar was also significantly high. Even though Newar belongs to the Janajati group, most of them are engaged in business activities in Nepal and have the highest level of average income and human development [64]. They might have gained far more from the soaring economic activities including reconstruction after the earthquake. It is also natural to find a significant improvement in the subjective well-being of Brahman and Chhetri, as they are the first and second top caste groups in the Hindu caste hierarchy in Nepal. Consequently, these groups have higher political and administrative representation in the country [65].
Even though the unprecedented economic setback in the disaster-hit rural mountain village by the earthquake caused economic losses in more than nine folds of the average household’s annual income, resulting in nearly three folds of the poverty headcount index [38], the progress of reconstruction, recovery, and people’s objective, as well as subjective well-being, implies the growing disaster resilience of the mountain community in Nepal. Nevertheless, the progress differs significantly across gender, caste/ethnic, and income groups, which call for more inclusive reconstruction, recovery, and DRR frameworks that contribute to community resilience and sustainable development of the mountain region.
Moreover, the progress after the earthquake revealed in this study indicates that the decentralized governance structure formed under the new Constitution of Nepal 2015 is functioning well to some extent. The new constitution completely restructured the country by replacing the centralized constitutional monarchy with the decentralized federal system that provides enormous autonomy to local governments, thereby conferring them with significant power through some legislative, judicial, and executive functions [37,66]. As it is beyond the scope of this study, we suggest further study to explore the role of the decentralized governance structure, particularly the role of stronger local government and other stakeholders, in DRR and building resilient mountain communities that ultimately contribute to sustainable mountain development in Nepal and beyond.
This study has several limitations. First, while conducting the first round of the household survey, it covered only one VDC, which used to be the smallest administrative unit of Nepal. However, due to the newly restructured local governance system, the village already became Ward no. 9 of Bahrabise Municipality in the second round of the household survey. Therefore, the findings are not fully representative of even one complete administrative unit, which means all results are not generalizable to the other municipalities. However, we believe that most of the findings and arguments are relevant to other mountain communities with similar characteristics both in and outside Nepal. The second limitation is related to the panel data. We replaced 62 absent households with new ones with similar attributes, as explained in Section 3.1. Even though they were not perfect, the replacing households were not much different from the previous sample, which, we believe, did not significantly affect the results. Finally, the use of the OHQ in the post-disaster context has some limitations since this tool was not designed for such situations. Hence, the researchers modified some statements to fit the post-disaster local context. For instance, the original statement “I feel able to take anything on” is revised to “Despite having suffered from the earthquake, I feel able to take anything on.” Such modification led us to contextualize the questionnaire to match the local conditions. Therefore, the OHQ-based assessment of this study reliably captured the subjective well-being of the respondents.

Author Contributions

Conceptualization, methodology, software, formal analysis, data curation, project administration, and writing—original draft preparation, J.B.S.; validation and funding acquisition, J.B.S. and K.K.; investigation, resources, visualization, funding acquisition, and writing—review and editing, J.B.S. and P.N. All authors have read and agreed to the published version of the manuscript.

Funding

This research was funded by “JSPS Grant-in-Aid for Scientific Research (KAKENHI), Type C, grant number 15K03412,” “KAKENHI, Early-Career Scientists, Grant number 19K14118” and “Kwansei Gakuin University Disaster Reconstruction Research Institute Joint Research Project 2019.”

Institutional Review Board Statement

Not applicable.

Informed Consent Statement

Not applicable.

Data Availability Statement

The data presented in this study are available upon request from the first corresponding author and are not publicly available to ensure the privacy of the participants.

Acknowledgments

The authors would like to thank all the respondents of Ramche village who took the time to take part in this research. We also thank the Mayor, Deputy Mayor and Ward number 9 President and the officials of Bahrabise Municipality for their generous support. Furthermore, we thank the participants of the 33rd Annual Conference of Japanese Association for South Asian Studies for their useful advice to improve this paper. Last but not least, we thank the anonymous reviewers of this paper for their constructive comments.

Conflicts of Interest

The authors declare no conflict of interest.

References

  1. UN-OHRLLS (The United Nations Office of the High Representative for the Least Developed Countries, Landlocked Developing Countries and the Small Island Developing States). About the Landlocked Developing Countries (LLDCs). Available online: http://unohrlls.org/about-lldcs/ (accessed on 21 July 2021).
  2. UN-OHRLLS. About the Least Developed Countries (LLDCs). Available online: http://unohrlls.org/about-ldcs/ (accessed on 21 July 2021).
  3. Adhikari, B.; Mishra, S.R.; Raut, S. Rebuilding earthquake struck Nepal through community engagement. Front. Public Health 2016, 4, 121. [Google Scholar] [CrossRef] [Green Version]
  4. Hall, M.L.; Lee, A.C.K.; Cartwright, C.; Maharatta, S.; Karki, J.; Simkhada, P. The 2015 Nepal earthquake disaster: Lessons learned one year on. Public Health 2017, 145, 39–44. [Google Scholar] [CrossRef]
  5. Gauchan, D.; Joshi, B.K.; Ghimire, K.H. Impact of 2015 earthquake on economy, agriculture and agrobiodiversity in Nepal. Rebuilding Local Seed System of Native Crops in Earthquake Affected Areas in Nepal. In Proceedings of the National Sharingshop, NAGRC, BI and Crop Trust, Kathmandu, Nepal, 18 December 2017. [Google Scholar]
  6. Chatterjee, R.; Okazaki, K. Risk Governance and the Role of the Informal Sector in Disaster Recovery: The Case of 2015 Nepal Earthquake. In International Expert Forum: Mainstreaming Resilience and Disaster Risk Reduction in Education; Springer: Singapore, 2017; pp. 53–69. [Google Scholar] [CrossRef]
  7. He, L.; Aitchison, J.C.; Hussey, K.; Wei, Y.; Lo, A. Accumulation of vulnerabilities in the aftermath of the 2015 Nepal earthquake: Household displacement, livelihood changes and recovery challenges. Int. J. Disaster Risk Reduct. 2018, 31, 68–75. [Google Scholar] [CrossRef]
  8. Valagussa, A.; Frattini, P.; Crosta, G.B.; Valbuzzi, E.; Gambini, S. Regional landslide susceptibility analysis following the 2015 Nepal Earthquake. In Workshop on World Landslide Forum; Springer: Cham, Switzerland, 2017; pp. 1035–1042. [Google Scholar] [CrossRef]
  9. Kellenberg, D.K.; Mobarak, A.M. Does rising income increase or decrease damage risk from natural disasters? J. Urban. Econ. 2007, 63, 788–802. [Google Scholar] [CrossRef]
  10. Cutter, S.L.; Ash, K.D.; Emrich, C.T. Urban–rural differences in disaster resilience. Ann. Am. Assoc. Geogr. 2016, 106, 1236–1252. [Google Scholar] [CrossRef]
  11. Cutter, S.L. The forgotten casualties redux: Women, children, and disaster risk. Glob. Environ. Chang. 2017, 42, 117–121. [Google Scholar] [CrossRef]
  12. Shen, S.; Cheng, C.; Yang, J.; Yang, S. Visualized analysis of developing trends and hot topics in natural disaster research. PLoS ONE 2018, 13, e0191250. [Google Scholar] [CrossRef]
  13. Tapsell, S.; McCarthy, S.; Faulkner, H.; Alexander, M.; Steinführer, A.; Kuhlicke, C.; Brown, C.; Walker, G.; Pellizzoni, L.; Scolobig, A.; et al. Social Vulnerability to Natural Hazards; CapHaz-Net WP4 Report; Flood Hazard Research Centre—FHRC, Middlesex University: London, UK, 2010. [Google Scholar]
  14. Cutter, S.L. Building disaster resilience: Steps toward sustainability. Chall. Sustain. 2013, 1, 72–79. [Google Scholar] [CrossRef] [Green Version]
  15. Aitsi-Selmi, A.; Egawa, S.; Sasaki, H.; Wannous, C.; Murray, V. The Sendai framework for disaster risk reduction: Renewing the global commitment to people’s resilience, health, and well-being. Int. J. Disaster Risk Sci. 2015, 6, 164–176. [Google Scholar] [CrossRef] [Green Version]
  16. Evans, G.W.; Kantrowitz, E. Socioeconomic status and health: The potential role of environmental risk exposure. Annu. Rev. Public Health 2002, 23, 303–331. [Google Scholar] [CrossRef] [Green Version]
  17. Martin, U. Health after disaster: A perspective of psychological/health reactions to disaster. Cogent. Psychol. 2015, 2, 1053741. [Google Scholar] [CrossRef]
  18. Tedeschi, R.; Calhoun, L. Trauma and Transformation: Growing in the Aftermath of Suffering; Sage: Thousand Oaks, CA, USA, 1995; ISBN 978-0803952577. [Google Scholar]
  19. Joseph, S.; Williams, R. Understanding posttraumatic stress: Theory, reflections, context, and future. Behav. Cogn. Psychother. 2005, 33, 423–441. [Google Scholar] [CrossRef]
  20. Hefferon, K.; Grealy, M.; Mutrie, N. Post-traumatic growth and life threatening physical illness: A systematic review of the qualitative literature. Br. J. Health Psychol. 2009, 14, 343–378. [Google Scholar] [CrossRef] [PubMed] [Green Version]
  21. Silver, A.; Grek-Martin, J. Now we understand what community really means: Reconceptualizing the role of sense of place in the disaster recovery process. J. Environ. Psychol. 2015, 42, 32–41. [Google Scholar] [CrossRef]
  22. Townshend, I.; Awosoga, O.; Kulig, J.; Fan, H. Social cohesion and resilience across communities that have experienced a disaster. Nat. Hazards 2015, 76, 913–938. [Google Scholar] [CrossRef]
  23. Regmi, K.D. The political economy of 2015 Nepal earthquake: Some critical reflections. Asian Geogr. 2016, 33, 77–96. [Google Scholar] [CrossRef]
  24. Chand, B. Disaster relief as a political tool: Analysing Indian and Chinese responses after the Nepal earthquakes. Strateg. Anal. 2017, 41, 535–545. [Google Scholar] [CrossRef]
  25. Shivakoti, R. When disaster hits home: Diaspora engagement after disasters. Migr. Dev. 2019, 8, 338–354. [Google Scholar] [CrossRef]
  26. Kelly, H. What We Googled in 2015. CNN. 16 December 2015. Available online: https://money.cnn.com/2015/12/16/technology/google-2015-top-searches/index.html (accessed on 15 August 2021).
  27. Murton, G. Border Corridors: Mobility, Containment, and Infrastructures of Development between Nepal and China. Ph.D. Thesis, University of Colorado at Boulder, Boulder, CO, USA, 2017. [Google Scholar]
  28. Paudel, D.; Le Billon, P. Geo-logics of power: Disaster capitalism, Himalayan materialities, and the geopolitical economy of reconstruction in post-earthquake Nepal. Geopolitics 2018, 25, 838–866. [Google Scholar] [CrossRef]
  29. Hillig, Z.; Connell, J. Social capital in a crisis: NGO responses to the 2015 Nepalese earthquakes. Asia Pac. Viewp. 2018, 59, 309–322. [Google Scholar] [CrossRef]
  30. Singh, J.B.; Sah, J.; Dhungel, S. An assessment of livelihoods program in earthquake affected areas of Nuwakot district, Nepal. Prog. Disaster Sci. 2021, 10, 100154. [Google Scholar] [CrossRef]
  31. Dhakal, N.H.; Simkhada, N.R.; Ozaki, M. Microfinance for Disaster Recovery: Lessons from the 2015 Nepal Earthquake. ADB South Asia Working Paper Series, No. 65. 2019. Available online: http://hdl.handle.net/11540/10202 (accessed on 15 August 2021).
  32. Tachibana, T.; Goto, R.; Sakurai, T.; Rayamajhi, S.; Adhikari, A.; Dow, W.H. Do remittances alleviate negative impacts of disaster on mental health? A case of the 2015 Nepal earthquake. Soc. Sci. Med. 2019, 238, 112460. [Google Scholar] [CrossRef] [PubMed]
  33. MoHA (Ministry of Home Affairs). Nepal Disaster Report, 2017; Ministry of Home Affairs: Kathmandu, Nepal, 2017.
  34. Imperiale, A.J.; Vanclay, F. Experiencing local community resilience in action: Learning from post-disaster communities. J. Rural Stud. 2016, 47, 204–219. [Google Scholar] [CrossRef]
  35. Wesnousky, S.G.; Kumahara, Y.; Chamlagain, D.; Pierce, I.K.; Karki, A.; Gautam, D. Geological observations on large earthquakes along the Himalayan frontal fault near Kathmandu, Nepal. Earth Planet. Sci. Lett. 2017, 457, 366–375. [Google Scholar] [CrossRef] [Green Version]
  36. National Reconstruction Authority (NRA). Annual Progress Report 2019–20; NRA, Government of Nepal: Kathmandu, Nepal, 2020.
  37. GoN (Government of Nepal). Constitution of Nepal 2015; Constituent Assembly: Kathmandu, Nepal, 2016.
  38. Adhikari, J.; Hobley, M. Everyone is leaving. Who will sow our fields? The livelihood effects on women of male migration from Khotang and Udaypur districts, Nepal, to the gulf countries and Malaysia. HIMALAYA J. Assoc. Nepal Himal. Stud. 2015, 35, 11–23. Available online: https://digitalcommons.macalester.edu/himalaya/vol35/iss1/7/ (accessed on 24 July 2021).
  39. CBS (Central Bureau of Statistics). Nepal Living Standard Survey 2010/11: Statistical Report; CBS: Kathmandu, Nepal, 2011; Volume I.
  40. Lin, L.; Wang, Y.; Liu, T. Perception of recovery of households affected by 2008 Wenchuan earthquake: A structural equation model. PLoS ONE 2017, 12, e0183631. [Google Scholar] [CrossRef] [PubMed] [Green Version]
  41. Nepal Rastra Bank. Foreign Exchange Rates for February 26, 2021. Available online: https://www.nrb.org.np/forex (accessed on 26 February 2021).
  42. Gini, C. Measurement of Inequality of Incomes. Econ. J. 1921, 31, 124–126. [Google Scholar] [CrossRef]
  43. Stieglitz, J.; Sen, A.; Fitoussi, J.P. Report by the Commission on the Measurement of Economic and Social Progress; OECD: Paris, France, 2009; Available online: https://ec.europa.eu/eurostat/documents/8131721/8131772/Stiglitz-Sen-Fitoussi-Commission-report.pdf (accessed on 7 July 2021).
  44. Sapkota, J.B. Access to infrastructure and human well-being: Evidence from rural Nepal. Dev. Pract. 2018, 28, 182–194. [Google Scholar] [CrossRef]
  45. Sapkota, J.B. Human well-being after 2015 Nepal earthquake: Micro-evidence from one of the hardest hit rural villages. Int. J. Sust. Dev. 2018, 21, 54–74. [Google Scholar] [CrossRef]
  46. Sapkota, J.B.; Neupane, P. The Academic Impacts of 2015 Nepal Earthquake: Evidence from Two Secondary Schools in Sindhupalchok District. Educ. Sci. 2021, 11, 371. [Google Scholar] [CrossRef]
  47. Baltaci, Ö. The Predictive Relationships between the Social Media Addiction and Social Anxiety, Loneliness, and Happiness. Int. J. Progress. Educ. 2019, 15, 73–82. [Google Scholar] [CrossRef]
  48. Argyle, M.; Martin, M.; Crossland, J. Happiness as a function of personality and social encounters. In Recent Advances in Social Psychology: An International Perspective; Forgas, J.P., Innes, J.M., Eds.; Elsevier: Amsterdam, The Netherlands, 1989. [Google Scholar]
  49. Hills, P.; Argyle, M. The Oxford Happiness Questionnaire: A compact scale for the measurement of psychological well-being. Pers. Individ. Differ. 2002, 33, 1073–1082. [Google Scholar] [CrossRef]
  50. Hills, P.; Argyle, M. Positive moods derived from leisure and their relationship to happiness and personality. Pers. Individ. Differ. 1998, 25, 523–535. [Google Scholar] [CrossRef]
  51. Wright, S. Meaning and Happiness: Oxford Happiness Questionnaire. Available online: http://www.meaningandhappiness.com/oxford-happiness-questionnaire/214/ (accessed on 15 June 2021).
  52. Sharma, K.; Kc, A.; Subedi, M.; Pokharel, B. Challenges for reconstruction after Mw 7.8 Gorkha earthquake: A study on a devastated area of Nepal. Geomat. Nat. Hazards Risk 2018, 9, 760–790. [Google Scholar] [CrossRef] [Green Version]
  53. Gizzi, F.T.; Kam, J.; Porrini, D. Time windows of opportunities to fight earthquake under-insurance: Evidence from Google Trends. Hum. Soc. Sci Commun. 2020, 7, 61. [Google Scholar] [CrossRef]
  54. Tan, Y.J.; Maharjan, R. What googling trends tell us about public interest in earthquakes. Seism. Res. Lett. 2018, 89, 653–657. [Google Scholar] [CrossRef]
  55. Platt, S.; Gautam, D.; Rupakhety, R. Speed and quality of recovery after the Gorkha Earthquake 2015 Nepal. Int. J. Disaster Risk Reduct. 2020, 50, 101689. [Google Scholar] [CrossRef]
  56. Sivakumar, M.V. Impacts of Natural Disasters in Agriculture, Rangeland and Forestry: An Overview. In Natural Disasters and Extreme Events in Agriculture; Sivakumar, M.V., Motha, R.P., Das, H.P., Eds.; Springer: Berlin, Germany, 2005. [Google Scholar]
  57. Calo-Blanco, A.; Kovářík, J.; Mengel, F.; Romero, J.G. Natural disasters and indicators of social cohesion. PLoS ONE 2017, 12, e0176885. [Google Scholar] [CrossRef] [Green Version]
  58. Chaudhary, D. The decentralization, devolution and local governance practices in Nepal: The emerging challenges and concerns. J. Pol. Sci. 2019, 19, 43–64. [Google Scholar] [CrossRef] [Green Version]
  59. Crawford, G.; Morrison, C. Community-led reconstruction, social inclusion and participation in post-earthquake Nepal. Dev. Policy Rev. 2021, 39, 548–568. [Google Scholar] [CrossRef]
  60. Rawal, V.; Bothara, J.; Pradhan, P.; Narasimhan, R.; Singh, V. Inclusion of the poor and vulnerable: Learning from post-earthquake housing reconstruction in Nepal. Prog. Disaster Sci. 2021, 10, 100162. [Google Scholar] [CrossRef]
  61. Paudel, D.; Rankin, K.; Le Billon, P. Lucrative Disaster: Financialization, Accumulation and Postearthquake Reconstruction in Nepal. Econ. Geogr. 2020, 96, 137–160. [Google Scholar] [CrossRef]
  62. Costanza, R.; Fioramonti, L.; Kubiszewski, I. The UN Sustainable Development Goals and the dynamics of well-being. Front. Ecol. Environ. 2016, 14, 59. [Google Scholar] [CrossRef] [Green Version]
  63. Solutions, D. Lessons learned from post-earthquake policy in Nepal. In Guidance for Further Housing, Land and Property Disaster and Reconstruction from Law and Policy Reform; Displacement Solutions: Geneva, Switzerland, 2019. [Google Scholar]
  64. GoN (Government of Nepal). Nepal Human Development Report 2020: Beyond Graduation: Productive Transformation and Prosperity; National Planning Commission: Kathmandu, Nepal, 2020.
  65. Neupane, P. Barriers to Education and School Attainment--Evidence from Secondary Schools in Rural Nepal. Int. Educ. Stud. 2017, 10, 68–83. [Google Scholar] [CrossRef] [Green Version]
  66. Hutt, M. Before the dust settled: Is Nepal’s 2015 settlement a seismic constitution? Confl. Secur. Dev. 2020, 20, 379–400. [Google Scholar] [CrossRef]
Figure 1. The location of the study site, Ramche Village in Bahrabise Municipality, Sindhupalchok, Nepal. Source: The original map is taken from the Department of Forest Research and Survey, Nepal via a data portal (2018). Available online: https://nepalindata.com/resource/local-resource-map—barhabise-municipality/ (Accessed on 24 January 2021).
Sustainability 13 11677 g001
Figure 2. The administrative structure under the Constitution of Nepal 2015. Notes: * Local bodies include six metropolitan and 11 sub-metropolitan cities, 276 municipalities, and 460 rural municipalities. Source: Created by Authors based on Part 5 of the constitution [37].
Sustainability 13 11677 g002
Figure 3. Lorenz curve and Gini index. Source: The authors.
Sustainability 13 11677 g003
Figure 4. Perception of recovery, housing, and income conditions in 2020, five years after the earthquake by gender. (a) = Respondents’ perception about the recovery atmosphere in their family; (b) = Respondents’ perception about the quality of life in their family; (c) = Ways of regaining permanent dwellings by the respondents; (d) = Comparing the income of respondents before and after the 2015 earthquake. Source: The authors.
Sustainability 13 11677 g004
Figure 5. Reconstruction investments and respondents’ views on financial support in the future. Source: The authors.
Sustainability 13 11677 g005
Figure 6. Poverty and inequality, 2014–2016–2020. Notes and source: While the data for 2014 are taken from Sapkota [48], the indexes for 2016 and 2020 are calculated based on the survey data of the panel households collected by the authors.
Sustainability 13 11677 g006
Figure 7. Poverty headcount index by gender and ethnicity, 2014–2016–2020. Notes and source: While the data for 2014 are taken from Sapkota [38], the indexes for 2016 and 2020 are calculated based on the survey data of the panel households collected by the authors; * Janajati excluding Newar.
Sustainability 13 11677 g007
Figure 8. Subjective well-being, the happiness of respondents, 2016–2020. Note: * Janajati excluding Newar. There were no respondents with scores of exactly 4 and 6.
Sustainability 13 11677 g008
Table 1. Sample distribution by socio-demographic characteristics; Sample size = 383.
VariablesCategoriesPercentVariablesCategoriesPercent
AgeUp to 39 yrs32GenderMale71
40–49 yrs28 Female29
50–59 yrs20Caste/EthnicityBrahman 10
60 yrs and older20Chhetri 47
ReligionHindu 71Newar 6
Buddhist23Janajati *33
Kirat3Dalit4
Others3
Notes: yrs = Years; Janajati * = Janajati excluding Newar; Total may not be 100 due to rounding.
Table 2. The interpretation of the happiness score from the OHQ.
ScoreMeaningBrief Interpretation and Advice
1–1.9Not happyRespondents in this group are probably seeing their situation as worse than it really is. They might be in depression.
2–2.9Somewhat unhappyThe respondents in this group may need counseling.
3–3.9Not particularly happy or unhappyA score of 3.5 is the exact numerical average of the range of the possible answer, 1–6. Respondents in this group can improve their happiness level significantly with some mental exercise.*
4Somewhat happy or moderately happySatisfied. The average person’s score remains around 4.
4.1–4.9Rather happy; pretty happyRespondents in this group are happy.
5–5.9Very happySuch respondents are more likely to have better health and better relationships and achieve life goals.
6Too happyThis is not a likely score.
Notes: The interpretation is slightly revised to match the current context. * Mental exercise, such as learning to play a musical instrument, playing a crossword puzzle game and similar activities, reading interesting books, can boost brain power, ability, and concentration. As any person in this group was not suffering from any acute mental health problem, the effect of mental exercise can be significant. Source: [51].
Publisher’s Note: MDPI stays neutral with regard to jurisdictional claims in published maps and institutional affiliations.

