Article

Carbon Footprint of Honey in Different Beekeeping Systems

1
Centro Ricerche Produzioni Animali—CRPA S.p.A, Viale Timavo 43/2, 42121 Reggio Emilia, Italy
2
CREA Research Centre for Agriculture and Environment, Via Di Saliceto 80, 40128 Bologna, Italy
*
Author to whom correspondence should be addressed.
Sustainability 2021, 13(19), 11063; https://doi.org/10.3390/su131911063
Submission received: 10 June 2021 / Revised: 30 September 2021 / Accepted: 4 October 2021 / Published: 7 October 2021

Abstract

:
Life Cycle Assessment (LCA) has been increasingly used for the improvement of the environmental performance of products and services, including agro-food chains. Pollination by honeybees can be regarded as one of the functions of an apicultural system and is of utmost importance for both natural ecosystems and agriculture. Furthermore, the beekeeping chain can represent an instrument for the protection and conservation of honeybee diversity when local subspecies are used. The Carbon Footprint of honey evaluates greenhouse gas emissions throughout the Life Cycle Assessment—more specifically, emissions of carbon dioxide, nitrous oxide, and methane. To this aim, data from beekeeping farms were collected, including data on annual honey production, other hive products, the geographical locations of the apiaries, processing plants, technologies used, and fuel and energy consumption. Based on the ISO 14040 method for the use of Life Cycle Assessment, the Carbon Footprints that were calculated for honey ranged from 1.40 to 2.20 kg CO2e/kg of honey for migratory beekeeping and from 0.380 to 0.48 kg CO2e/kg of honey for non-migratory beekeeping. The movements for the management of migratory beehives (on average, 44 km/hive for farm 1, 32 km/hive for farm 2, and 13 km/hive for farm 3) represented the main impact in migratory beekeeping systems, and they were quantified as 1.234, 1.113, and 0.68 CO2e/kg of honey. However, electricity represented the main impact of systems without migratory practices.

1. Introduction

The Life Cycle Assessment (LCA) has been identified by the European Commission as the only method that is able to quantify the environmental loads of products and processes from a holistic perspective [1]. In the last few decades, LCAs have been applied to a wide variety of processes. In particular, this methodology became very popular for environmental assessments of food supply chains.
Concerning some of the most important agri-food production in Italy, Gilson et al. [2] suggested that the impact of milk production ranges from 1.18 to 1.51 kg CO2e, whilst each kilogram (kg) of fresh tomatoes produced emits 2.28 kg of CO2 equivalent [3]. According to other authors, organic cropping systems displayed, on average, 67.49 kg CO2e/t for marketable fresh tomatoes vs. 55.16 kg CO2e/t in conventional cropping systems [4].
Among honey substitutes, Wallen et al. [5] estimated that 4.18 kg CO2e is emitted to produce 1 kg of sweeteners, including sugar, honey, and treacle. In particular, LCA studies focused on sugar estimated a variable Carbon Footprint range from 0.45 to 6.31 kg CO2e/kg of sugar depending on the technologies applied and the type of cultivation [6,7]. However, in the literature, there have been only a few LCAs implemented in apiculture [8,9].
Beekeeping is a fundamental activity for both human and environmental existence: It provides food products and ecosystem services through pollination. Bee products (honey, nectar, beeswax, etc.) are considered to have a great range of benefits for human health [9,10], but beekeeping also ensures the presence of many crops and wild plants through pollination [11,12,13].
Despite their importance, the numbers of bees have been drastically reduced today due to Land-Use Change (LUC) [14,15], use of pesticides [16], and the spread of parasitic infections [13].
Consequently, in the last few decades, beekeeping has changed. Compared to the past, beekeepers have to check their hives more often and provide the bees with a larger amount of supplementary food and treatments to contrast the current threats [17,18].
Beekeeping management practices may differ in several features. Simone-Finstrom et al. [19] divided hive management into migratory and stationary systems, whereas Pocol et al. [20] considered migratory, stationary, and mixed ones.
These different beekeeping practices typically differ in honey yield, distances between apiaries, food administration, and number of treatments.
Therefore, the general process of honey production and the required input are very different in the two types of beekeeping farms [21,22].
In the literature, Life Cycle Assessments (LCAs) are usually focused on honey production or ecosystem services. Kendal et al. [21] evaluated the impact of honey production in the US and estimated it to be 0.67 to 0.92 kg CO2 equivalent/kg of processed honey, but Mujica et al. [22] estimated that the Carbon Footprint of honey in Argentina was 2.5 ± 0.17 kg CO2e/kg of honey. Arzoumanidis et al. [9] carried out an LCA analysis of 1 kg of honey while considering the pollination service, whilst Sillman et al. [14] also considered drone broods and pollen for their usage as a protein source and healthy food product, respectively, in their LCA analysis. Several studies regarding the economic aspects or the biodiversity impacts [23,24,25] of the honey chain have been performed; however, there are still few LCA analyses on honey production, and almost none of these can compare the impacts according to the different types of beekeeping.
Kendal et al. [21] calculated greenhouse gas (GHG) emissions in the range of 0.4 for backyard beekeepers to 1.4 kg CO2e/kg of honey for commercial beekeepers, but the data for the backyard beekeepers were not considered. To our knowledge, the environmental impacts of different types of honey have not been evaluated yet.
The aim of this study was to identify the different carbon emission sources in honey production systems while also examining the different honey types. The resulting main impact factors with respect to beekeeping systems can be useful in identifying mitigation strategies.

2. Materials and Methods
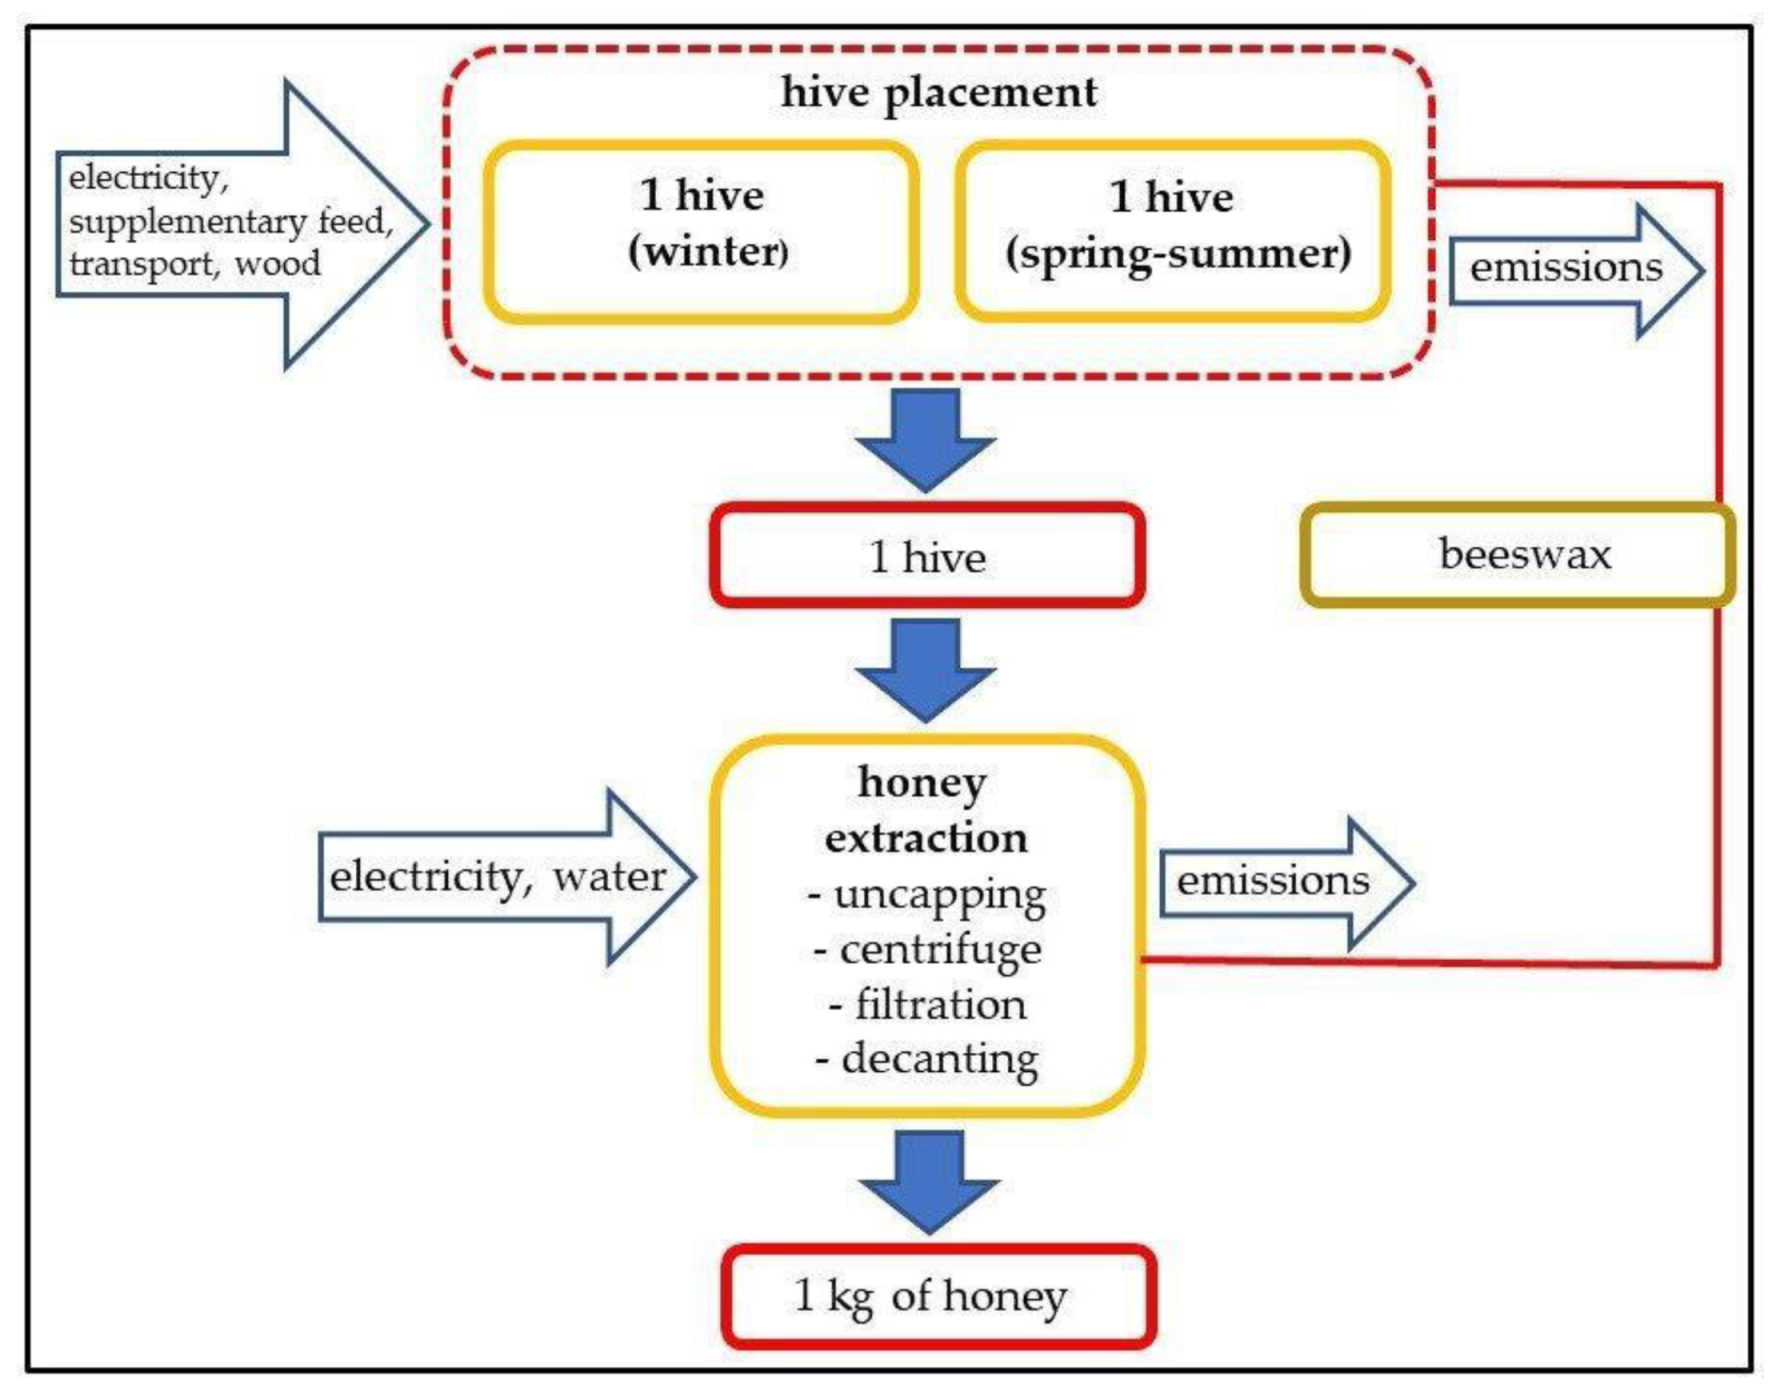
The LCA analysis presented here was performed with the aid of the openLCA software and by following the ISO 14040 and 14044 international standards [26].

2.1. Goal and Scope

The main objective of this study was to estimate the Carbon Footprint (CF) of the honey produced in migratory (Ms) and non-migratory (NMs) beekeeping systems, which differ in their hive management. Migratory beekeeping, which is sometimes called “nomadic beekeeping”, entails that beekeepers move their beehives in specific seasons and places after prevailing blossoms, such as black locust, sweet chestnut, or rapeseed, or for pollination services—for example, for almonds, berries, or apples [19].
This practice is common in North America and Australia for pollination services [17,19], but it is also widespread in Europe in order to obtain specific types of honey that are linked to certain plants and, at the same time, increase the yield [18]. The second aim was to quantify the CF of each type of honey in the three farms.
The expression “Carbon Footprint (CF)” refers to the measurement of carbon dioxide emissions that are directly and indirectly caused by an activity or are accumulated over the life cycle of a product [27]. In particular, the direct emissions are those mainly caused by the production process, while the indirect emissions are related to the energy consumption or other product flows [22]. According to these emissions, the functional unit was defined as kg CO2e/kg of honey, for which carbon dioxide (CO2), methane (CH4+), and nitrous oxide (N2O) emissions were calculated. This represents the measurement unit to which all inputs and outputs are related and, therefore, the impact of the production system [1]. A flowchart used to describe the life cycle of honey production is illustrated in Figure 1.
The system boundaries include the initial stage of beehive placement and the final stage of honey extraction for the production of 1 kg of honey. Taking into account the differences in hive management within one year of production, it was decided to divide the “hive placement” process between the spring–summer and winter periods; the spring–summer season represents the honey production phase, whereas the winter season is a non-production period in which the main aim is to preserve the honeybees. Consequently, the inputs needed for winter and summer hive management are different. In the honey extraction stage, we included all of the final processes for obtaining honey, such as the uncapping of honeycombs, super centrifugation, filtration, and decanting of raw honey.

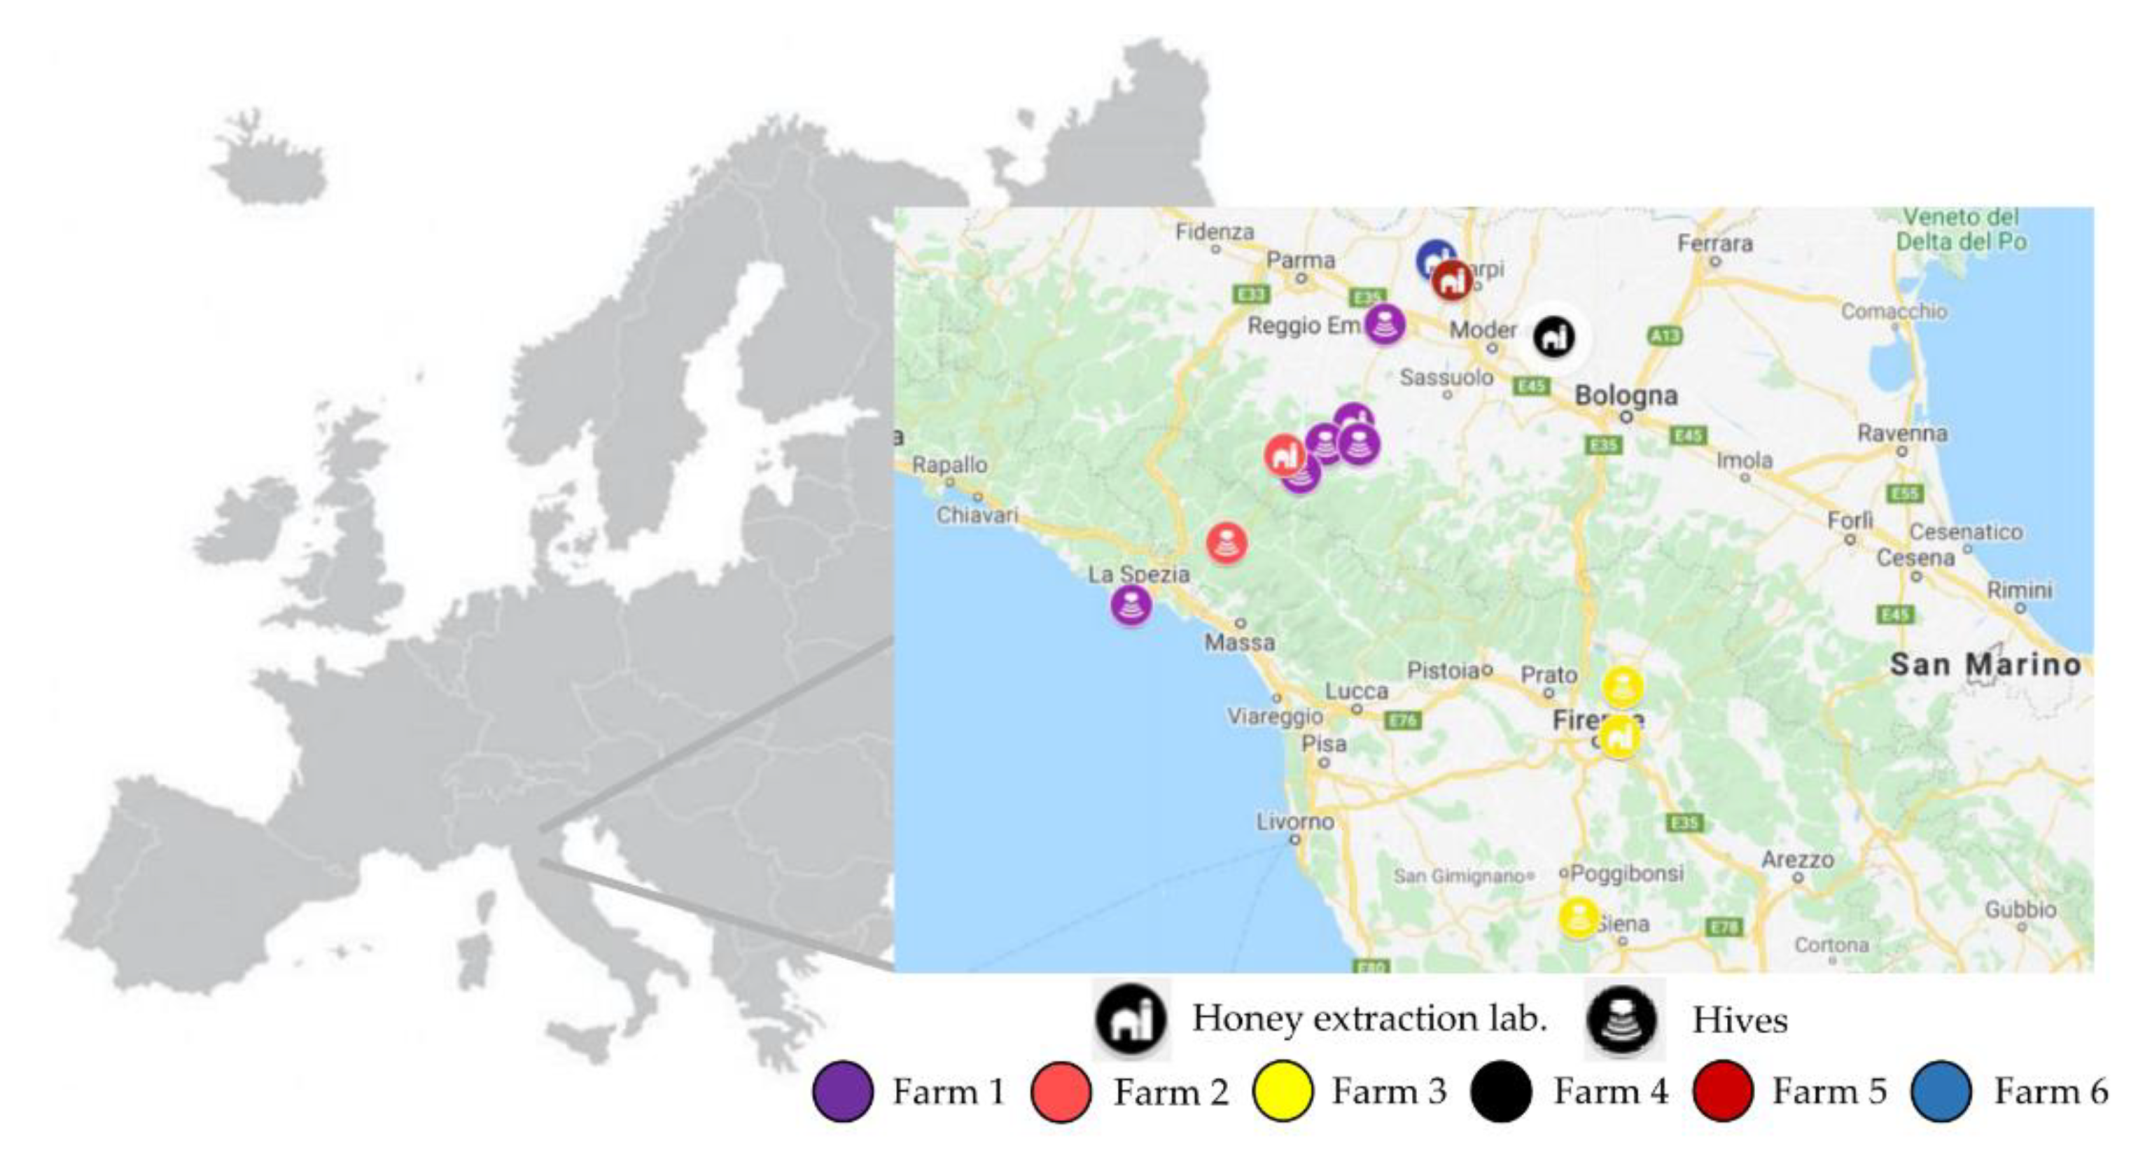
2.2. The Beekeeping Farms

The test sample consisted of six beekeeping farms situated in the Italian provinces of Bologna, Florence, and Reggio Emilia—farm 1: 44°27′ N 10°31′ E, farm 2: 44°25′ N 10°16′ E, farm 3: 43°78′ N 11°32′ E, farm 4: 44°66′ N 11°33′ E, farm 5: 44°81′ N 10°80′ E, and farm 6: 44°50’ N 10°45′ E. These farms were selected for this study because they represented different beekeeping systems in terms of hive management and input. Their main characteristics are reported in Table 1.
Farm 1, farm 2, and farm 3 represented a migratory system (Ms) due to the transportation of variable portions of their hives. In particular, during the year of the analysis, a total of 12,400 kilometers were travelled by farm 1 due to the transportation of 79% of the beehives, 5200 km were travelled by farm 2 for transportation of 16% of the beehives, and 4160 km were travelled by farm 3 for transportation of 34% of the beehives. Farm 4, farm 5, and farm 6 were stationary beekeeping systems (NMs) because they did not practice any kind of migratory beekeeping at all. The farms analyzed here also differed in the amounts of supplemental feeding; however, note that this feature is not representative of a beekeeping system, but it is due to farm management. In regard to co-products, beeswax was produced by each farm, and it was recycled for foundation molds. Royal jelly and propolis were produced by farm 1, and they were sold in the local store. Honeycomb was another co-product, which accounted for 30% of the revenues of farm 5. Farms 1–5 were considered commercial beekeepers because beekeeping represented their primary income; only farm 6 was a hobbyist beekeeper. The farms’ characteristics and beekeeping operations are shown in Figure 2.
The transported apiaries used to obtain honey from specific blossoms were located, on average, 120, 70, and 36 km away from farms 1, 2, and 3, respectively. Farm 1 transported their hives to five different locations, farm 2 transported to another one, and farm 3 transported to two different sites. Farms 1 and 3 moved their hives to the designated sites during the production phase (spring–summer season), whereas in the non-production phase (autumn–winter season), they collected the beehives in a warehouse. As result of this management, medication and feeding control trips were concentrated in the summer months, while in the winter season, the only kilometers needed were those related to the hive placement. However, farm 2 did not recover their beehives, so its kilometers were equally travelled in winter and in summer.
The honey yield, types, and co-products were affected by beekeeping management.

2.3. Life Cycle Inventory (LCI)

The primary LCI data were collected on-site at the six-beekeeping farms, and they referred to 2020. The secondary data, e.g., data related to emission factors and the reference system, were gathered from OpenLCA and EcoInvent 2.2 database. First, the specific information on the apiculture sector was mainly gathered from a direct dialogue with beekeepers, as well as from other studies. Questionnaires were then drawn up and submitted to the farms. The survey scheme illustrated in Table 2 includes all of the information about hive construction, such as wood and paint for the hive structures, as well as other beekeeping gear. The other data were related to hive management, such as bee-specific medicines and supplemental feeding. These inputs depended on the season and the farm management. Supplemental feeding was especially necessary in winter, when natural bee foods, nectar, and pollen were not available, and the honey stored in the hive was inadequate [21]; however, variable amounts of food could be distributed to provide “stimulating” nutrition after the winter period. The feed and medication were different in terms of quantity and composition among the farms analyzed here, so we used the specific formulas reported by the beekeepers. The names and brands of bee treatment products were obtained from the beekeeper surveys, and we obtained LCI data for the major chemical components of these products according to their chemical classes. One medical ingredient, oxalic acid, was not found in the Ecoinvent software database. Consequently, according to Kendal et al. [28], we decided to use the Formic Acid Ecoinvent flow, as it represents a component that is similar to oxalic acid. In the transportation category, we evaluated both seasonal beehive placement and medication and feeding control trips. Therefore, the specific information on the hive route was precisely collected from the beekeeper surveys. This information included the season in which the transportation took place, the travel frequency, the mileage, and the vehicle type. Some electricity was also required for the management of hives in the winter months in order to maintain the frames in cold refrigerators to prevent damage from wax moths.
The next step in the life cycle of honey is that in which the beekeepers bring the beehives back to the honey laboratory for the extraction process. In this phase, the main input is the energy consumption of the equipment; in addition, a small amount of water is consumed for the cleaning of the machines. The questionnaires asked the beekeepers to declare water and electricity use as it was indicated on their facilities’ utility bills. Thus, for the electricity use, we also considered lighting and climate control. The energy input in the software was introduced as a low voltage from the Italian national grid. Water usage was measured by using the European grid without Switzerland. Other primary inputs, such as the necessary gloves, lab coats, and uniforms, were included in the analysis. For a complete list of total inputs and outputs that were taken into account in the LCI phase, the reader is referred to Table 2.

2.4. Allocation

The allocation of environmental burdens among co-products can significantly influence the results of an LCA study, and thus, the selection of an allocation procedure is critical [21]. The allocation can be performed based on physical relations (e.g., mass) or economic ones according to the ISO standard [29]. Tillman [30] suggested that allocation should preferably be conducted based on “physical relationships,” such as mass or energy content, or, as a last resort, based on other measures, such as economic values. In this study, the co-products analyzed were beeswax, honeycombs, propolis, and royal jelly, which were all distinguishable based on their physical properties. Accordingly, a physical relation between honey and the co-products was identified, and mass allocation was performed on them.

2.5. Life Cycle Inventory Assessment (LCIA)

An LCIA was carried out by using the IPCC 2013 method, which was performed with the openLCA software for the Climate Change (CC) impact category. The IPCC 2013 method analyzes the characterization factors for climate change with a time frame of 20 or 100 years (Table 3). A time horizon of 100 years (GWP100) was used in this study.
The indicator used to quantify the contribution to Climate Change (CC) was the Global Warming Potential (GWP), which was calculated by considering both the ability of greenhouse gases to absorb infrared radiation and the time of persistence of the gas in the atmosphere. The quantity and persistence of the potential greenhouse gases in the atmosphere were quantified and then compared to those of CO2, for which the conventional GWP value is 1 by definition. The greenhouse gases’ quantities are normally expressed in kg CO2 equivalent (kg CO2e) through a standardization operation based on global warming potentials.
The IPCC 2013 method evaluates the direct Global Warming Potential and it does not take into account the water vapor and atmospheric ozone, which persist in the atmosphere for a short period of time [31].

3. Results

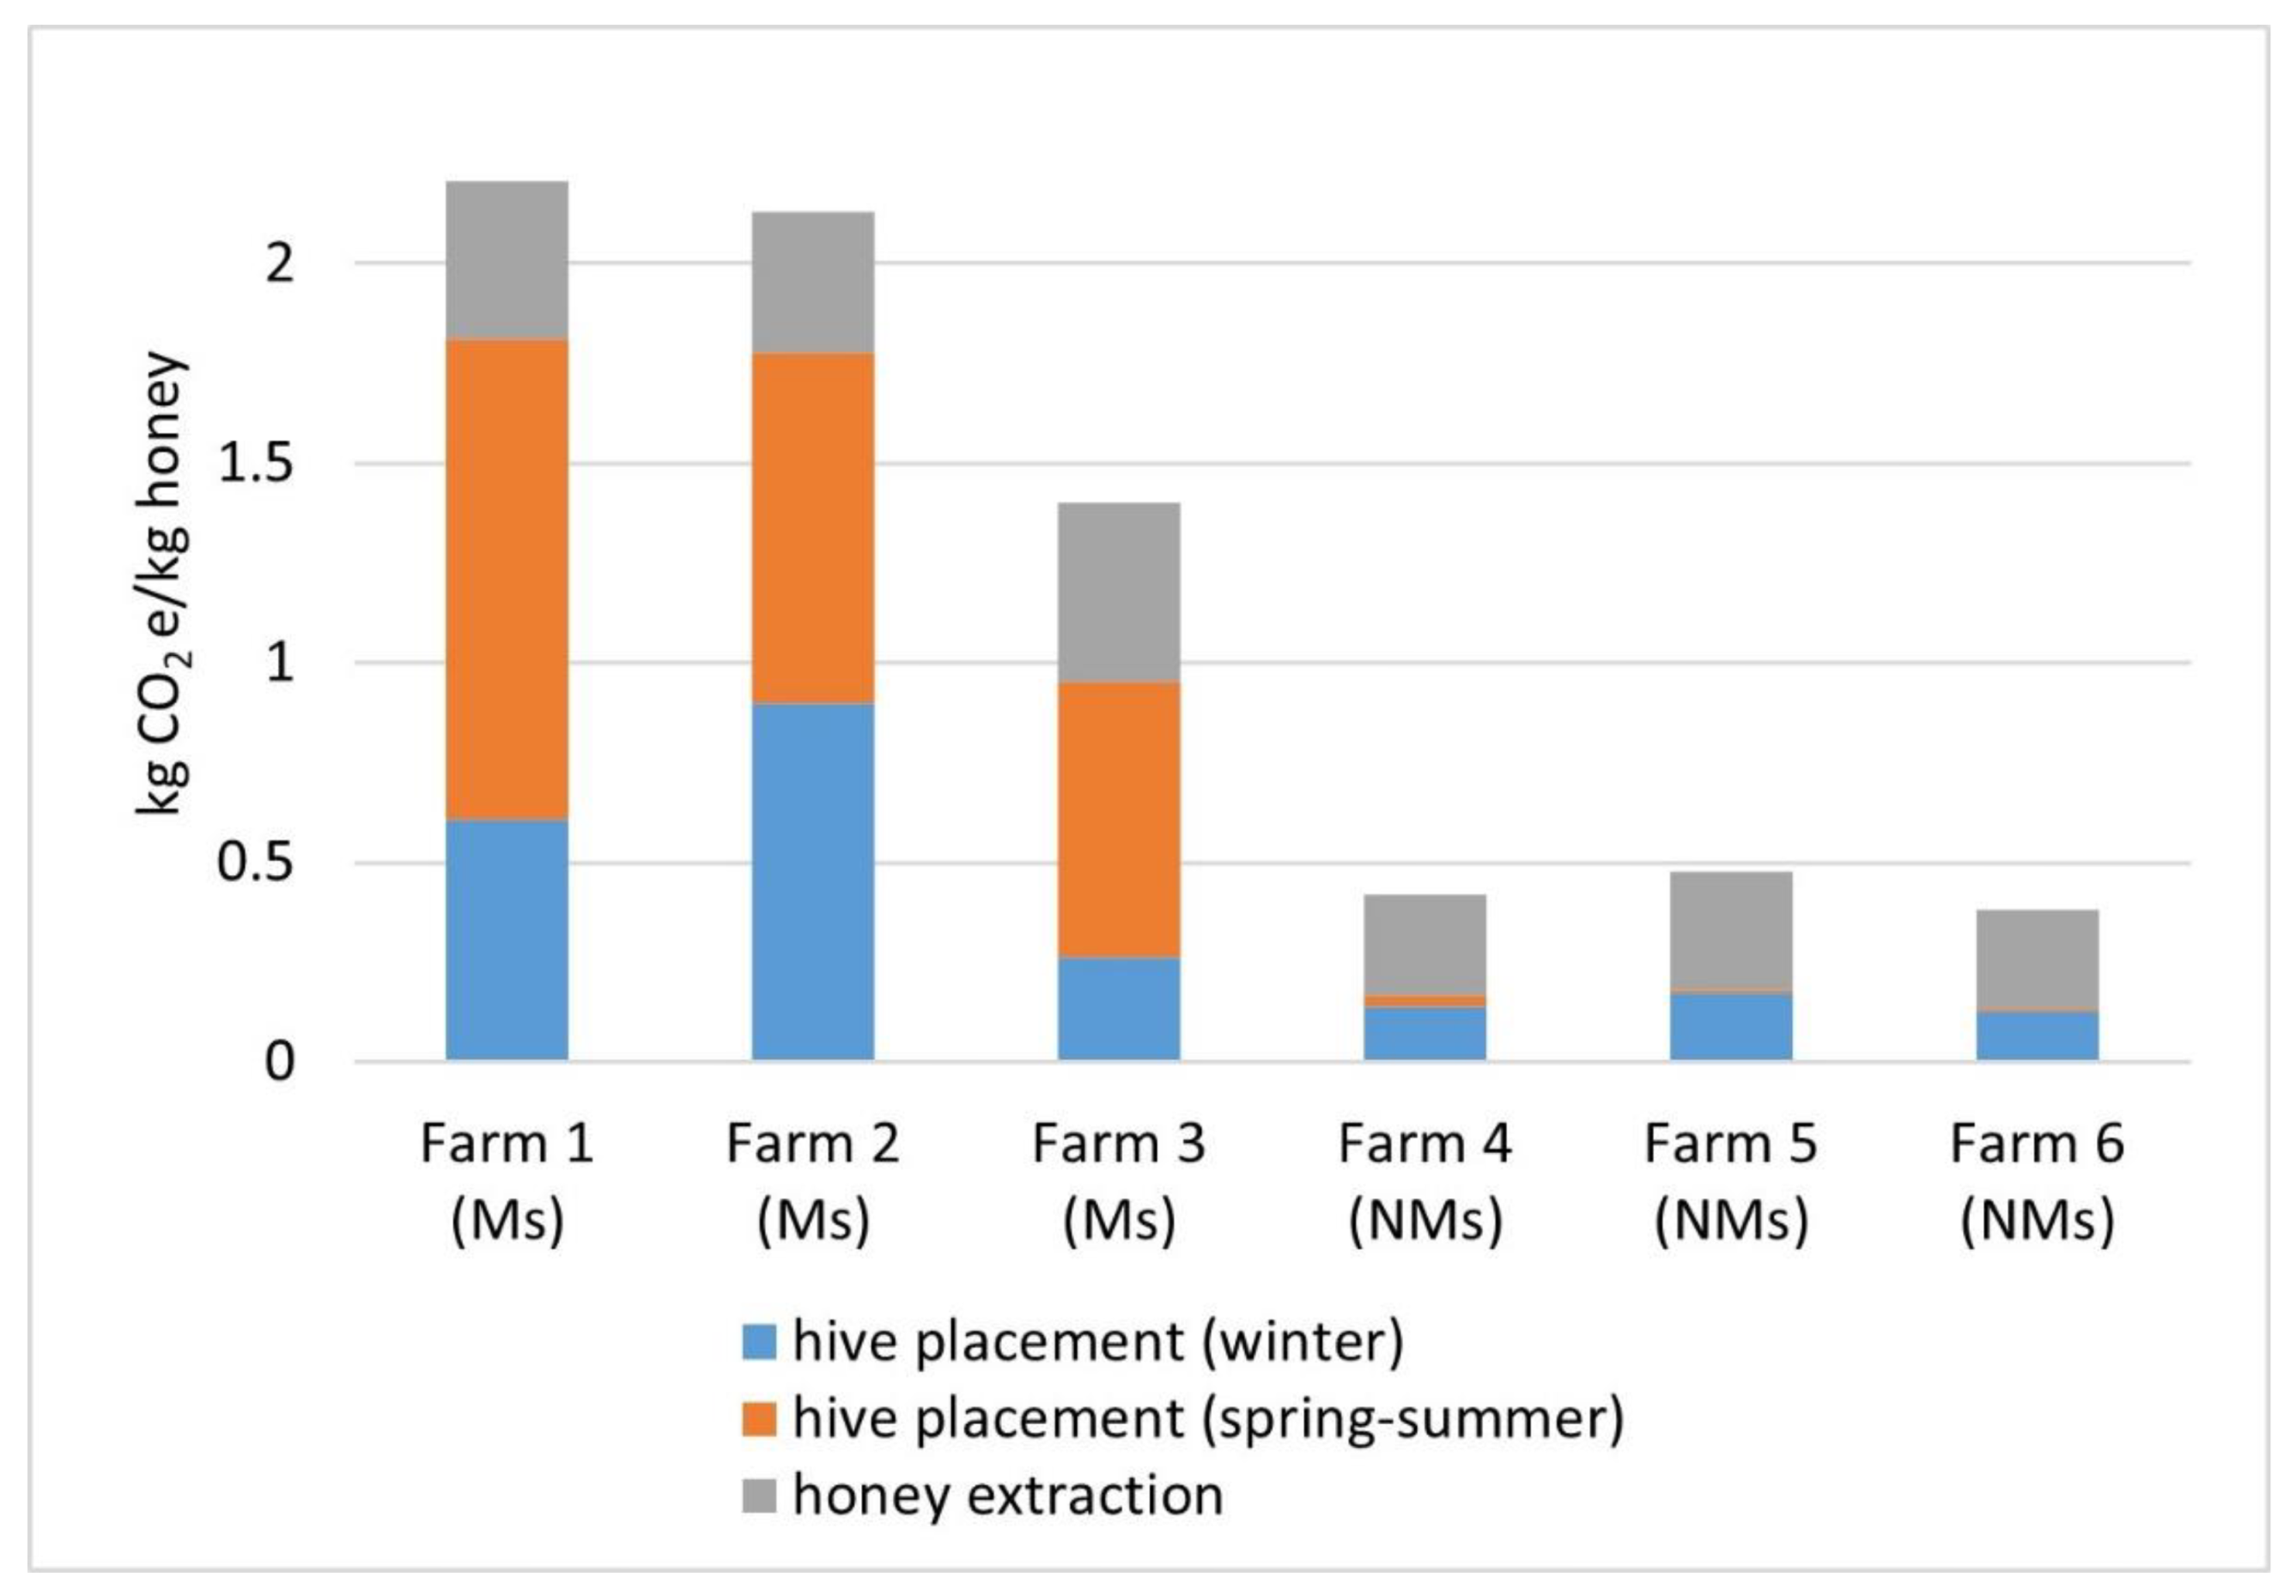
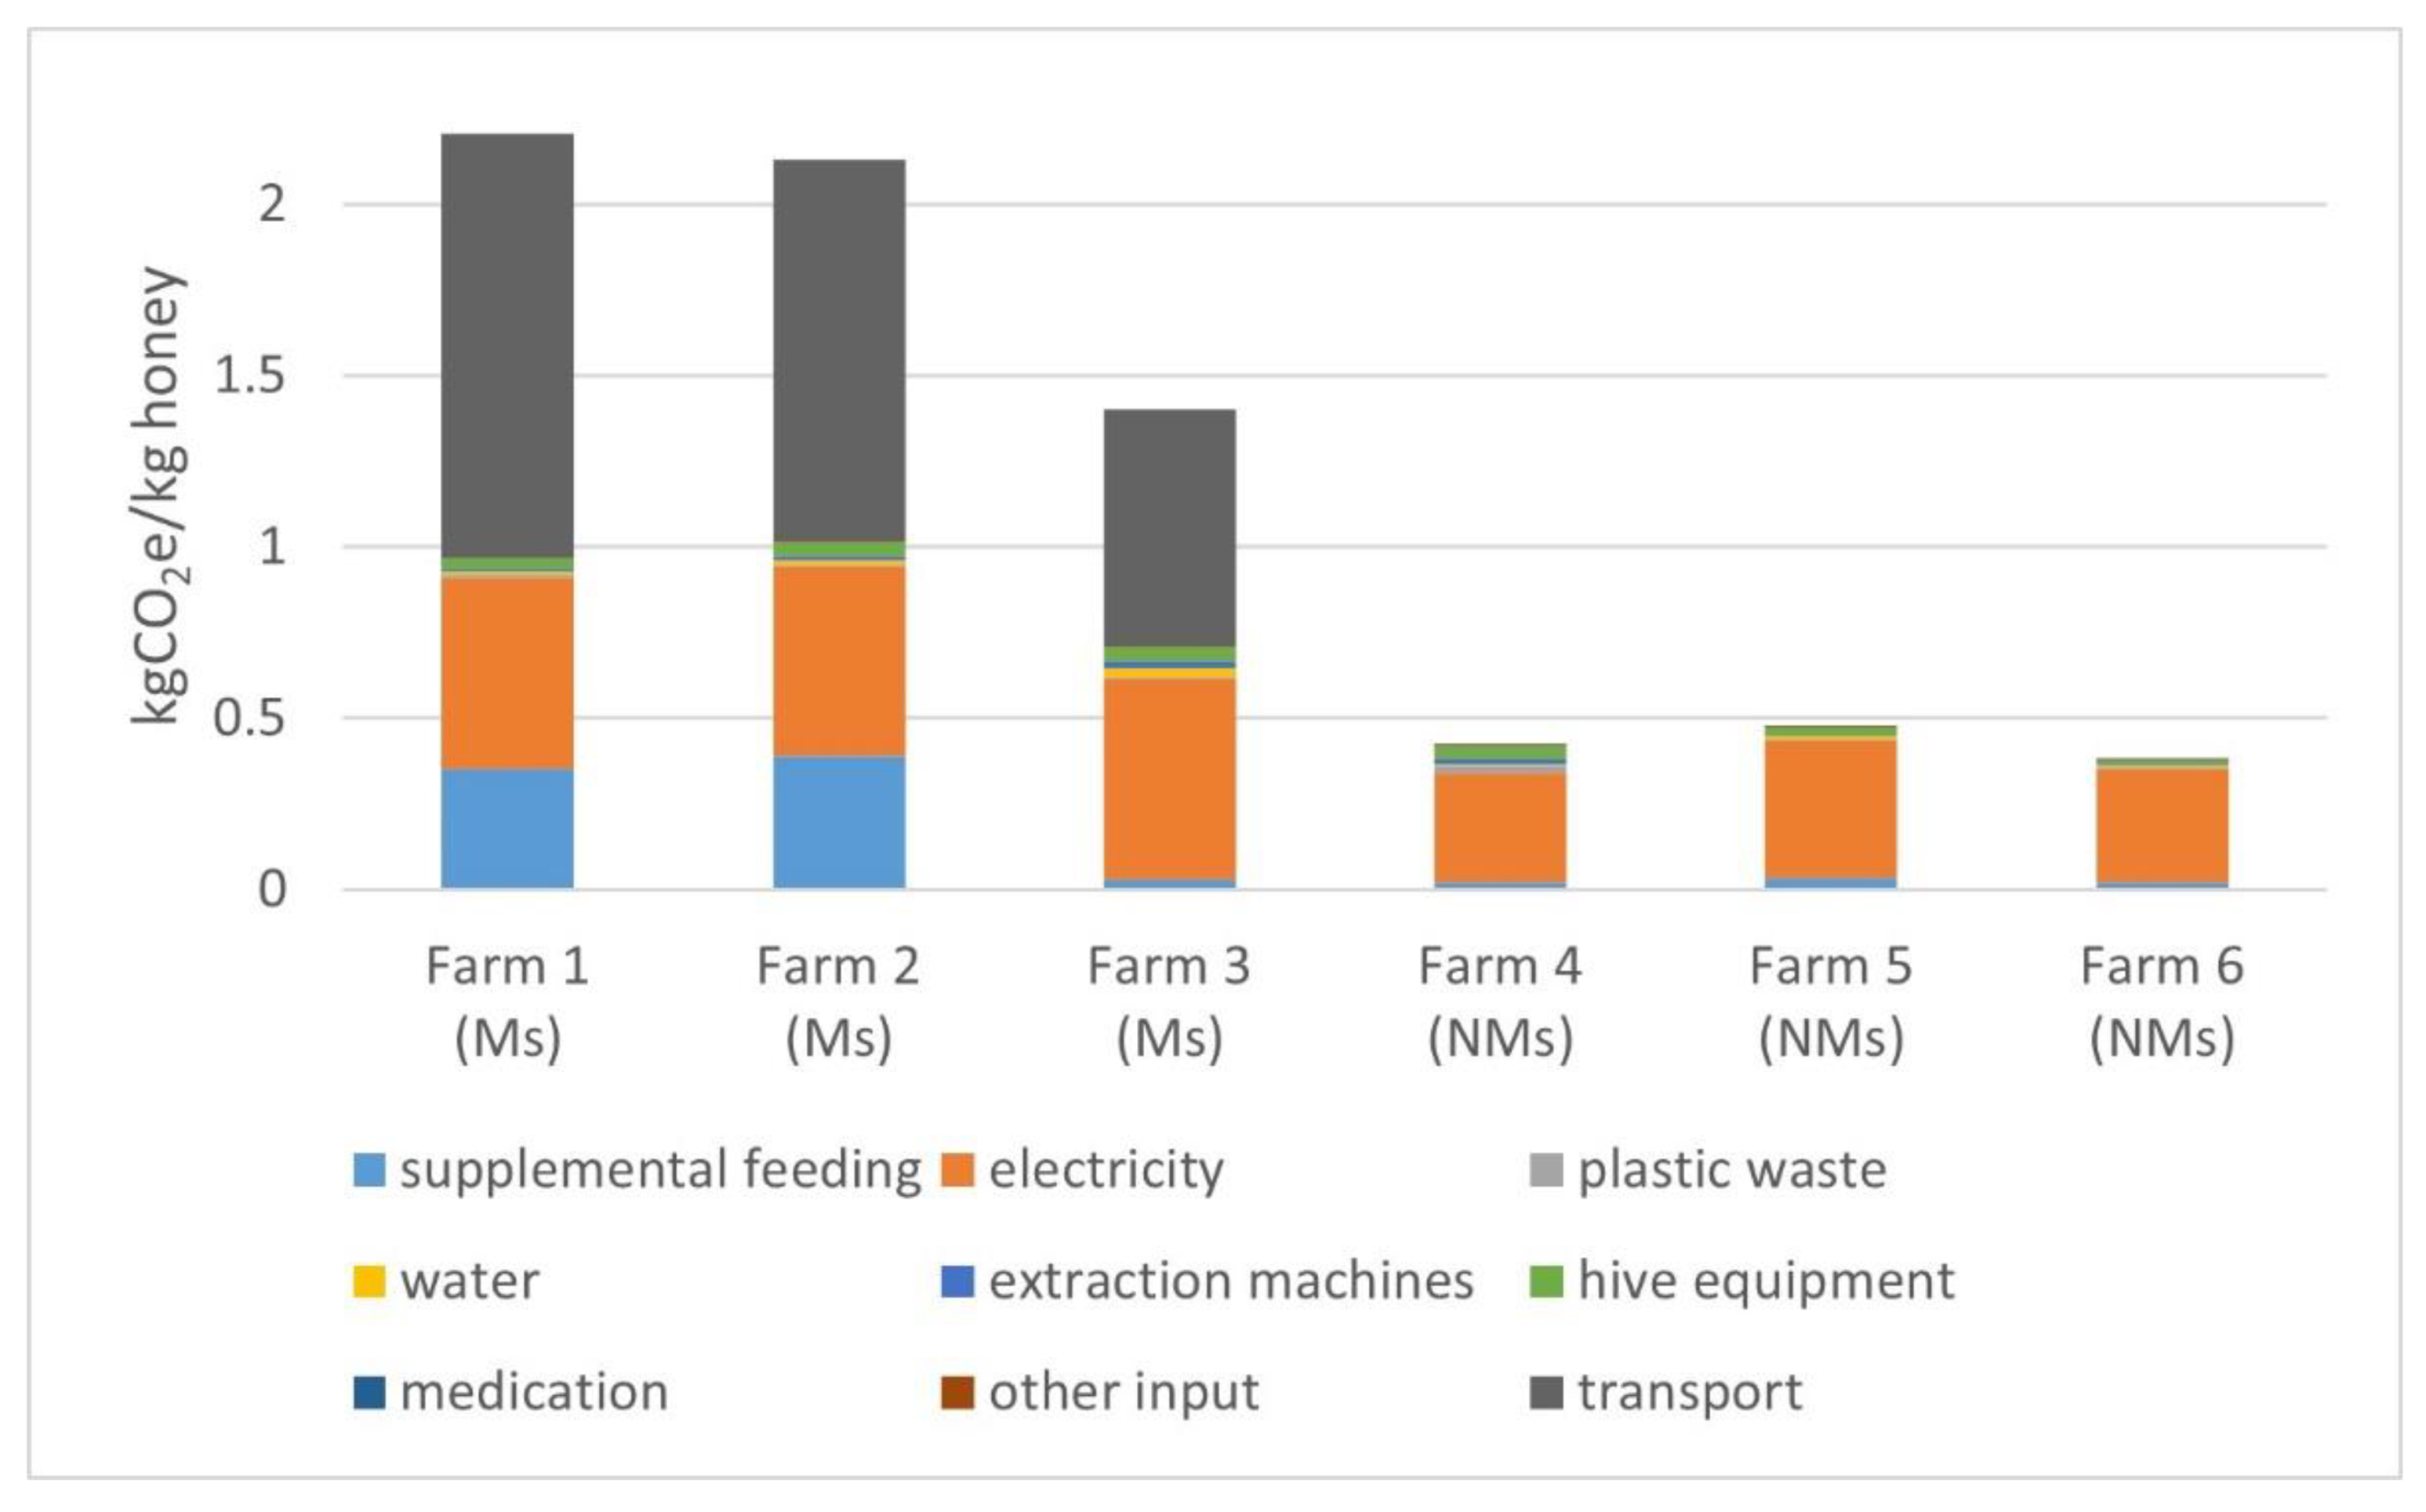
3.1. Carbon Footprint of Honey

The greenhouse gas emissions were calculated for 1 kg of processed honey; in the analytical process, three different phases were defined: hive placement (winter), hive placement (summer), and honey extraction. The Life Cycle Inventory was integrated with the inputs and outputs related to honey production. This method was developed for both the overall honey produced by the six beekeeping farms and the different types of honey. Figure 3 shows the contributions to Climate Change (CC) of the beekeeping systems; farm 1 (Ms) produced 2.20 kg CO2e/kg of honey, farm 2 (Ms) produced 2.13 kg CO2e/kg of honey, farm 3 (Ms) produced 1.40 kg CO2e/kg of honey, farm 4 (NMs) produced 0.42 kg CO2e/kg of honey, farm 5 (NMs) produced 0.47 kg CO2e/kg of honey, and farm 6 (NMs) produced 0.37 kg CO2e/kg of honey.
On average, the migratory farms (Ms) emitted 1.91 kg CO2e/kg on honey, whilst the stationary ones (NMs) emitted 0.42 kg CO2e/kg of honey.
The impact of migratory system (Ms) was significantly higher than that of non-migratory systems (NMs) due to the transportation. The transportation for hive management, including the relocation of hives and the provision of supplemental feeding and medication, generated 1.23, 1.11, and 0.68 kg CO2e/kg of honey in farms 1, 2, and 3, respectively, whereas this input was zero for the stationary ones (NMs). Transportation caused more than half of the total emissions in the migratory beekeeping systems (Ms).
The GHG emissions differed in the migratory beekeeping systems (Ms) in relation to the distance and the number of beehives moved from each farm. Therefore, farm 1 was the most impactful, which was mainly due to the greater amount of transportation in terms of both kilometers and the number of hives; however, farm 3 was the least impactful because it had the fewest kilometers travelled (Table 1). Supplemental feeding is also a key factor for increasing the results of an LCA; it represented the second impact factor in the most impactful farms (farms 1 and 2), accounting for 16.5% of their emissions, whereas it provided less than 2% of the emissions of farm 3. The transportation and supplemental feeding were the inputs that differed in farms analyzed. This suggests that beehive management is decisive in the Carbon Footprint of honey. The usage of other inputs, such as electricity and water consumption, was quantified in proportion to the honey production. Electricity consumption provided 0.55 kg CO2e/kg of honey in farms 1 and 2, which was around 25% of their Carbon Footprints, as well as 0.58 kg CO2e/kg of honey in farm 3, making up 42% of its CF.
Electricity was mainly used to power the extraction machines, so it was related to the honey extraction phase. Only a small amount of electricity was used for the conservation of the wooden frames in the cold refrigerator.
On the contrary, electricity was the main impact factor in the NMs cluster; it represented 82% of their emissions on average. This input produced 0.31 kg CO2e/kg of honey in farm 4, 0.40 kg CO2e/kg of honey in farm 5, and 0.33 kg CO2e/kg of honey in farm 6. The impact of transportation was zero due to their non-migratory beekeeping system, and the supplemental feeding impact was less than 5% due to their low usage.
Other inputs, e.g., wood for hive construction and steel for extraction machines, were negligible because they represented less than 5% of the Carbon Footprints in the farms sampled in this study.
Hive equipment and extraction machines accounted for less than 2% of the CFs due to their long lifespans; in addition, medication was a minor impact because of the low dosages, producing, on average, 0.0004 kg CO2e/kg of honey. Plastic waste ranged from an impact of 5% in farm 4 (0.0018 kg CO2e) to 0.2% in farm 3 (0.00141 kg CO2e). Water was also among the least impactful inputs due to its usage only for cleaning; so, it accounted for less than 2% in all farms analyzed.
As regards the honey production process, Figure 4 shows the distribution of the various impacts in the three production phases, expressed as a percentage and as kg CO2 equivalent per kg of honey. More than half of the total impacts were allocated to hive placement (summer and winter) in the migratory beekeeping systems (Ms), whereas 60% of the impacts were due to the honey extraction phase in non-migratory beekeeping systems (NMs).
The impacts of the production phases reflect those of individual inputs; therefore, they depend on the beekeeping systems. Hive placement in summer was the most impactful phase in migratory beekeeping systems (Ms), providing 54% of the total GHG emissions in farm 1 (1.20 kg CO2e/kg of honey) and 38% in farm 3 (0.68 kg CO2e/kg of honey); however, in farm 2 (Ms), the hive placement phase had almost equal impacts in summer (41.2% and 0.87 kg CO2e/kg of honey) and in winter (42.2% and 0.89 kg CO2e/kg of honey). This difference was due to the greater number of trips for hive management during the spring–summer season in farms 1 and 3 compared to farm 2, as outlined in the paragraph on beekeeping farms.
According to the impact of electricity, honey extraction was the most impactful phase in the stationary beekeeping systems (NMs); it accounted for 62 ± 2% of their Carbon Footprints.
In farms 4, 5, and 6 (NMs), the second most impactful phase was hive placement in winter because it required more inputs than placement in summer, e.g., supplemental feeding and medications.

3.2. Carbon Footprints of Honey Types

Figure 5 shows the Carbon Footprints of the different honey types produced by the beekeeping farms. In order to compare migratory (MS) and non-migratory (NMs) systems, data were processed with an LCA without the transportation input. Although mileage was specific to the honey type, other inputs (electricity, supplemental feeding, medication, and others) were equally divided in each beehive based on the honey yield declared by the farms.
The resulting CF was lower for the stationary (NMs) honey types, for which the impact ranged from 0.24 to 0.66 kg CO2e/kg of honey. The Carbon Footprint of the migratory (Ms) honey types varied from 0.80 to 1.46 kg CO2e/kg of honey.
The impact was affected by the yield, which differed between beekeeping systems and among different honey types. Yield is the key factor in LCA analyses because the environmental impact is quantified based on the production according to a functional unit, which was 1 kg of honey in this study.
In relation to the information received by the beekeepers, during the year of the analysis, the migratory farms (Ms) reported, on average, a 20% decline in beehives, whereas in the non-migratory farms (NMs), these losses were 10%. It follows that migratory (Ms) honey types were characterized by a lower yield—on average, 10 ± 2 kg honey/hive vs. 21 ± 6 kg honey/hive—which caused a higher CF compared to non-migratory farms (NMs).
This study quantified the hives’ existence at the beginning and the end of the production season by applying the LCA method. The causes of the decline in bees were analyzed because this was not the objective of this work.
The yield factor also influenced the differences in CFs between honey types within the same farm; for example, wildflower (summer) was the most impactful honey type (1.46 kg CO2e/kg of honey) in farm 1 due to its lower yield, and the same was true for the other farms.
When the transportation input was considered in the LCA, it significantly affected the LCA result, making the honey yield marginal. Figure 6 shows the Carbon Footprints for the migratory honey types (79% of beehives were transported by farm 1, 16% were transported by farm 2, and 34% were transported by farm 3) produced by the migratory beekeeping farms (Ms). In farm 1 (Ms), the most impactful honey type was heather honey (5.06 kg CO2e/kg of honey), for which the transportation input provided 82% of its total emissions by transporting all hives 130 km for each hive management trip from the farm.
By accounting for the kilometers travelled, black locust honey became the most impactful type of honey in farm 2 (Ms) due to the transportation of all of its beehives, whereas chestnut had a lower impact because only 20% of its hives were nomadic.
The same results were obtained for farm 3 (Ms), in which 0.89 and 2.32 kg CO2e were emitted for 1 kg of black locust and chestnut honey, respectively, due to transportation.

3.3. Co-Product Allocation

This LCA study was carried out by using a mass allocation method according to the physical properties of the co-products. The mass-value-based allocation estimated that for all beekeeping farms, more than 90% of emissions had to be allocated to honey production, except for farm 5, which had an allocation factor that was estimated to be 88%. In fact, a part of the beekeeping activity of farm 5 was focused on honeycomb production. In addition, farm 1 (Ms) had a low allocation value (93%) due to the large number of co-products (refer to Table 1). The allocation values assessed for farm 2 (Ms), farm 3 (Ms), farm 4 (NMs), and farm 6 (NMs) ranged from 95% to 99%. Arzoumanidis et al. [9] calculated that 59.26% of environmental impacts were allocated to honey and 40.74% to pollination services by using an economic allocation method; thus, the Carbon Footprint was 1.01 kg CO2e/kg of honey. When pollination services are included in an LCA and an economic allocation method was applied, a lower Carbon Footprint was obtained [9,21,22]. The choice of the co-product treatment method in an LCA may significantly influence the results.

4. Discussion

A Life Cycle Assessment (LCA) is a generally accepted method for estimating the environmental impact of agricultural products from a global perspective due to its ability to include the environmental impacts of processes and products in a holistic assessment [32]. The individual results of milk, tomato, and sugar LCAs were influenced by characteristics linked to the production cycle [2,3,4,5]. As the literature has shown, these assessments have had variable results for the Carbon Footprint of sugar [6,7].
The comparison between honey and other agri-food products is complex because honey is a unique food product, and the corresponding environmental impacts therefore differ from one another. Indeed, honey does not demand the direct use of fertilizers and irrigation during production [21].
In this research, the Carbon Footprint of honey production ranged from 1.40 to 2.20 kg CO2e/kg of honey in migratory beekeeping systems and from 0.380 to 0.48 kg CO2e/kg of honey for non-migratory beekeeping systems.
The stationary beekeeping systems achieved significantly lower emissions due to their lack of transportation needs. However, in the migratory beekeeping farms, the trips for beehive placement and control produced 1.234, 1.113, and 0.68 kg CO2e/kg of honey for totals of 12,400, 5200, and 4160 kilometers travelled, respectively. According to this, the honey types that had the greatest impact were those for which transportation was necessary. The impact of the honey types was also estimated without transportation for a complete understanding of the beekeeping systems’ environmental impacts. Even without mileage, the CFs of nomadic honey types were confirmed to be higher than those of the stationary ones due to their lower yield. This was caused by the fact that the migratory farms reported twice as many beehive losses than the stationary farms.
In addition, supplemental feeding is another impact factor that may influence the Carbon Footprint of honey; its amount is due to farm management, and it does not characterize the beekeeping systems. The subdivision method applied to quantify the CF of honey allowed us to trace the burden of each phase of the production process. The hive placement in summer and winter represented the most impactful phases for the migratory systems, whereas the honey extraction phase produced more emissions in the non-migratory systems. The functional unit of kg CO2e/kg of honey used was proven to be adequate for the purposes of comparison; the first inference was that there were various differences in the values reported in other studies. Mujica et al. [22] estimated a CF value for honey (2.5 ± 0.17 kg CO2e/kg of honey) that was similar to our results for migratory beekeeping, but it should be noted that the production of Argentinian honey differs from that of Italian honey. Argentinian honey production (35 kg/hive/year and 76,000 tonnes) is more intensive than Italian honey production (25 kg/hive/year and 23,300 tonnes); 93% of Argentine production is concentrated in five regions, whereas in Italy, beekeeping is spread evenly in the north, center, and south of the country [22,33]. The significant contribution of the transport item was also reported by Kendall et al. [21], who established that the Carbon Footprint of honey was in a range from 0.4 to 1.4 kg CO2e/kg of honey while also considering the pollination services. The CF results obtained by using economic-value-based allocation in order to include pollination services were generally lower than those found in our assessment [8,21,22,23]. The differences in the values reported in LCA studies indicated that honey’s CF is strongly dependent on the method applied, as well as on the production practices and honey beekeeping chain characteristics [22]. Given that this study identified the migratory system as the most impactful one, a potential method for reducing emissions is to minimize the transportation distance, and then to enhance stationary beekeeping. Some researchers suggested that the transportation of bee colonies increases their exposure to pesticides and pathogens, and also limits their access to diversified pollen sources [19]. Migratory beekeeping systems are linked to widespread disease and lowering of the bees’ immune system [17,19,34,35]. The lower migratory yield found in this research could be investigated in new surveys. In addition, future developments of this study may be focused on the analysis of the capacity of the land around farms and the selection the best-performing vegetation based on the number of bees, climate conditions, and soil properties.
This approach may lead to a reduction of the Carbon Footprint of honey, but it may also achieve positive effects on both bees and the surrounding environment.

Author Contributions

Conceptualization, A.P. and A.D.P.; methodology, A.P., S.P. and A.D.P.; software, A.P.; validation, A.P. and S.P.; formal analysis, A.P. and A.D.P.; investigation, A.P. and A.D.P.; resources, A.D.P.; data curation, A.P. and A.D.P.; writing—original draft preparation, A.P. and A.D.P.; writing—review and editing, A.P., A.D.P., E.C. and C.C.; visualization, A.P. and A.D.P.; supervision, A.P., A.D.P., E.C. and C.C.; project administration, A.D.P.; funding acquisition, A.D.P. All authors have read and agreed to the published version of the manuscript.

Funding

The study was part of the project funded by the Emilia-Romagna RDP 2014–2020 (Italy), “domanda di aiuto n. 5150471, Focus Area 2 A”, and the work was carried out within the Operational Group InnovAPE.

Institutional Review Board Statement

Not applicable.

Informed Consent Statement

Not applicable.

Data Availability Statement

Not applicable.

Acknowledgments

The authors thank the beekeepers who took part in this research for their collaboration and provision of data.

Conflicts of Interest

The authors declare no conflict of interest.

References

  1. Baldo, G.L.; Rossi, S.; Marino, M. Analisi del Ciclo di Vita LCA: Gli Strumenti per la Progettazione Sostenibile di Materiali, Prodotti e Processi: Environmental Life Cycle Thinking, Life Cycle Assessment (Lca), Life Cycle Design (Ecodesign), Comunicazione Ambientale, Environmental Product Declaration (Epda), Climate Declaration, Ecolabel, Carbon Footprint; Edizioni Ambiente: Milano, Italia, 2008. [Google Scholar]
  2. Gilson, G.; Ferrero, F.; Bava, L.; Borreani, G.; Dal Prà, A.; Pacchioli, M.T.; Sandrucci, A.; Zucali, M.; Tabacco, E. Forage systems and sustainability of milk production: Feed efficiency, environmental impacts and soil carbon stocks. J. Clean. Prod. 2020, 103, 8048–8061. [Google Scholar]
  3. Almeida, J.; Achten, W.M.J.; Verbist, B.; Heuts Reindert, F.; Schrevens, E.; Muys, B. Carbon and Water Footprints and Energy Use of Greenhouse Tomato Production in Northern Italy. J. Ind. Ecol. 2014, 18, 898–908. [Google Scholar] [CrossRef]
  4. Ronga, D.; Gallingani, T.; Zaccardelli, M.; Perrone, D.; Francia, E.; Milc, J.; Pecchioni, N. Carbon footprint and energetic analysis of tomato production in the organic vs the conventional cropping systems in Southern Italy. J. Clean. Prod. 2019, 220, 836–845. [Google Scholar] [CrossRef] [Green Version]
  5. Wallén, A.; Brandt, N.; Wennersten, R. Does the Swedish consumer’s choice of food influence greenhouse gas emissions? Environ. Sci. Policy 2004, 7, 525–535. [Google Scholar] [CrossRef]
  6. García, C.A.; García-Trevino, E.S.; Aguilar-Rivera, N.; Aguilar-Rivera, C. Carbon footprint of sugar production in Mexico. J. Clean. Prod. 2016, 112, 2632–2641. [Google Scholar] [CrossRef]
  7. Demafelis, R.B.; Mendoza, C.T.; Matanguihan, A.E.D.; Malabuyoc, J.L.S.; Magadia, R.V., Jr.; Pector, A.A.; Hourani, K.A.; Manaig, L.M.A.; Movillon, J.L. Carbon Footprint of Raw Sugar Production: Is Raw Sugar Carbon Positive or Negative? In Proceedings of the 62nd Philsutech Convention, Cebu City, Philippines, 13 August 2015. [Google Scholar]
  8. Arzoumanidis, I.; Petti, L.; Raggi, A.; Zamagni, A. Life Cycle Assessment (LCA) for the agri-food sector. In Product-Oriented Environmental Management System (POEMS)—Improving Sustainability and Competitiveness in the Agri-Food Chain with Innovative Environmental Management Tools; Springer: Berlin, Germany, 2013; pp. 105–122. [Google Scholar]
  9. Pasupuleti, V.R.; Sammugam, L.; Ramesh, N.; Gan, S.H. Honey, propolis, and royal jelly: A comprehensive review of their biological actions and health benefits. Oxid. Med. Cell. Longev. 2017, 2017, 1259510. [Google Scholar] [CrossRef] [PubMed]
  10. Arzoumanidis, I.; Petti, L.; Raggi, A. Life Cycle Assessment of Honey: Considering the Pollination Service. Adm. Sci. 2019, 9, 27. [Google Scholar] [CrossRef] [Green Version]
  11. Potts, S.G.; Imperatriz-Fonseca, V.L.; Ngo, H.T.; Biesmeijer, J.C.; Breeze, T.D.; Dicks, L.V.; Garibaldi, L.A.; Hill, R.; Settele, J.; Vanbergen, A.J.; et al. IPBES (2016): Summary for Policymakers of the Assessment Report of the Intergovernmental Science-Policy Platform on Biodiversity and Ecosystem Services on Pollinators, Pollination and food Production; Secretariat of the Intergovernmental Science-Policy Platform on Biodiversity and Ecosystem Services: Bonn, Germany, 2016. [Google Scholar]
  12. Kearns, C.A.; Inouye, D.W.; Waser, N.M. Endangered mutualisms: The conservation of plant-pollinator interactions. Annu. Rev. Ecol. Evol. Syst. 1998, 29, 83–112. [Google Scholar] [CrossRef]
  13. Klein, A.M.; Vaissiere, B.E.; Cane, J.H.; Steffan-Dewenter, I.; Cunningham, S.A.; Kremen, C.; Tscharntke, T. Importance of pollinators in changing landscapes for world crops. Proc. R. Soc. B 2007, 274, 303–313. [Google Scholar] [CrossRef] [Green Version]
  14. Silman, J.; Uusitalo, V.; Tapanen, T.; Salonen, A.; Soukka, R.; Kahiluoto, H. Contribution of honeybees towards the net environmental benefits of food. Sci. Total Environ. 2021, 756, 143880. [Google Scholar] [CrossRef]
  15. Rader, R.; Bartomeus, I.; Tylianakis, J.M.; Lalibertè, E. The winners and losers of land use intensification: Pollinator community disassembly is non-random and alters functional diversity. Divers. Distrib. 2014, 20, 908–917. [Google Scholar] [CrossRef] [Green Version]
  16. Crenna, E.; Jolliet, O.; Collina, E.; Sala, S.; Fantked, P. Characterizing honey bee exposure and effects from pesticides for chemical prioritization and life cycle assessment. Environ. Int. 2020, 138, 105642. [Google Scholar] [CrossRef] [PubMed]
  17. Brosi, B.J.; Delaplane, K.S.; Boots, M.; De Roode, J.C. Ecological and evolutionary approaches to managing honeybee disease. Nat. Ecol. Evol. 2017, 1, 1250–1262. [Google Scholar] [CrossRef] [PubMed] [Green Version]
  18. VanEngelsdorp, D.; Meixner, M.D. A historical review of managed honey bee populations in Europe and the United States and the factors that may affect them. J. Invertebr. Pathol. 2010, 103, S80–S95. [Google Scholar] [CrossRef] [PubMed]
  19. Simone-Finstrom, M.; Li-Byarlay, H.; Huang, M.H.; Strand, M.K.; Rueppel, O.; Tarpy, D.R. Migratory management and environmental conditions affect lifespan and oxidative stress in honey bees. Sci. Rep. 2016, 6, 32023. [Google Scholar] [CrossRef]
  20. Pocol, C.B.; Šedík, P.; Brumă, I.S.; Amuza, A.; Chirsanova, A. Organic Beekeeping Practices in Romania: Status and Perspectives towards a Sustainable Development. Agriculture 2021, 11, 281. [Google Scholar] [CrossRef]
  21. Kendall, A.; Yuan, J.; Brodt, S.B. Carbon footprint and air emissions inventories for US honey production: Case studies. Int. J. Life Cycle Assess. 2013, 18, 392–400. [Google Scholar] [CrossRef]
  22. Mujica, M.; Blanco, G.; Santalla, E. Carbon footprint of honey produced in Argentina. J. Clean. Prod. 2016, 116, 50–60. [Google Scholar] [CrossRef]
  23. Arzoumanidis, I.; Petti, L.; Raucci, D.; Raggi, A. Multifunctional modelling in the life cycle assessment of honey considering pollination. Int. J. Life Cycle Assess. 2021, 26, 643–655. [Google Scholar] [CrossRef]
  24. Crenna, E.; Sala, S.; Polce, C.; Collina, E. Pollinators in life cycle assessment: Towards a framework for impact assessment. J. Clean. Prod. 2017, 140, 525–536. [Google Scholar] [CrossRef]
  25. Ulmer, M.; Smetana, S.; Heinz, V. Utilizing honeybee drone brood as a protein source for food products: Life cycle assessment of apiculture in Germany. Resour. Conserv. Recycl. 2020, 154, 104576. [Google Scholar] [CrossRef]
  26. International Standard Organization. ISO 14040. Environmental Management: Life Cycle Assessment, Principles and Framework; International Standard Organization: Geneva, Switzerland, 2010. [Google Scholar]
  27. Wiedmann, T.; Minx, J. A definition of ‘Carbon footprint’. In Ecological Economics Research Trends, 2nd ed.; Pertsova, C.C., Ed.; Nova Science Publishers: Hauppauge, NY, USA, 2008; pp. 1–11. [Google Scholar]
  28. Kendall, A.; Yuan, J.; Brodt, S.B.; Kramer, K.J. Carbon Footprint of U.S. Honey Production and Packing—Report to the National Honey Board; University of California: Davis, CA, USA, 2011; pp. 1–23. [Google Scholar]
  29. ISO. ISO 14040:2006. Environmental Management—Life Cycle Assessment—Principles and Framework, 2nd ed.; International Organisation for Standardisation: Geneva, Switzerland, 2006. [Google Scholar]
  30. Tillman, A.M. Significance of decision-making for LCA methodology. Environ. Impact Assess. Rev. 2000, 20, 113–123. [Google Scholar] [CrossRef] [Green Version]
  31. Stocker, T.F.; Qin, D.; Plattner, G.K.; Tignor, M.; Allen, S.K.; Boschung, J.; Nauels, A.; Xia, Y.; Bex, V.; Midgley, P.M. (Eds.) IPCC, 2013: Climate Change 2013: The Physical Science Basis. Contribution of Working Group I to the Fifth Assessment Report of the Intergovernmental Panel on Climate Change; Cambridge University Press: Cambridge, UK; New York, NY, USA, 2013; p. 1535. [Google Scholar]
  32. Guerci, M.; Bava, L.; Zucali, M.; Sandrucci, A.; Penati, C.; Tamburini, A. Effect of farming strategies on environmental impact of intensive dairy farms in Italy. J. Dairy Res. 2013, 80, 300–308. [Google Scholar] [CrossRef] [PubMed]
  33. ISMEA Istituto dei Servizi Per il Mercato Agricolo Alimentare. Il Settore Apistico—Analisi di Mercato e Prime Valutazioni sui Danni Economici per la Campagna Produttiva 2019; ISMEA: Rome, Italy, 2019. [Google Scholar]
  34. Gordon, R.; Schott-Bresolin, N.; East, I.J. Nomadic beekeeper movements create the potential for widespread disease in the honeybee industry. Aust. Vet. J. 2014, 92, 283–290. [Google Scholar] [CrossRef] [PubMed]
  35. Jara, L.; Ruiz, C.; Martín-Hernández, R.; Muñoz, I.; Higes, M.; Serrano, J.; De la Rúa, P. The effect of migratory beekeeping on the infestation rate of parasites in honey bee (Apis mellifera) colonies and on their genetic variability. Microorganisms 2021, 9, 22. [Google Scholar] [CrossRef]
Figure 1. Flowchart of the boundaries and main activities in the LCA of a beekeeping chain.
Sustainability 13 11063 g001
Figure 2. Location of the beekeeping operations (honey extraction laboratory and migratory hives).
Sustainability 13 11063 g002
Figure 3. Contributions to climate change of honey production and inputs, expressed as kg CO2 equivalent per kg of honey.
Sustainability 13 11063 g003
Figure 4. Contribution to climate change in the honey production phases, expressed as kg CO2 equivalent per kg of honey.
Sustainability 13 11063 g004
Figure 5. Contributions to climate change without transportation, expressed as kg CO2 equivalent per kg of honey.
Sustainability 13 11063 g005
Figure 6. Contributions to climate change of migratory honey types, expressed as kg CO2 equivalent for each different honey type in the migratory beekeeping systems (Ms).
Sustainability 13 11063 g006
Table 1. Characteristics of the beekeeping farms used for the LCA.
Beekeeping FarmsEcological AreaSupplemental Feeding Beehives
Transported
Total Annual
Kilometers (Km)
Honey
Types
Co-Products
Farm 1Permanent grassland
Alfalfa
Forest
High79%12,400Black locust Chestnut
Dandelion Heather Honeydew Linden
Wildflower (summer and autumnal)
Beeswax
Honeycombs
Propolis
Royal jelly
Farm 2Forest
Permanent grassland
High16%5200Black locust
Chestnut
Dandelion
Summer wildflower
Beeswax
Honeycombs
Farm 3Olive
Vineyards
Forest
Low34%4160Black locust Chestnut
Dandelion Linden
Summer wildflower
Beeswax
Honeycombs
Farm 4Alfalfa
Vineyards
Winter cereals
Low0%0Alfalfa
Dandelion
Linden
Summer wildflower
Beeswax
Farm 5Alfalfa
Vineyards
Winter cereals
Low0%0Alfalfa
Dandelion
Honeydew
Linden
Summer wildflower
Beeswax
Honeycombs
Royal jelly
Farm 6Alfalfa
Vineyards
Winter cereals
Low0%0Autumnal wildflower
Black locust
Linden
Beeswax
Table 2. Life Cycle Inventory with input and output flows.
Life Cycle PhasesInputsOutputs
Hive placement (winter)Beehives
Wooden frame
Beehive paint
Supplemental feeding
Beeswax
Medicines
Electricity
Beekeeping instruments
Transportation
Beehives with honeybees
Waste:
cardboard and plastic waste
Hive placement (summer)Beehives
Wooden frame
Beehive paint
Supplemental feeding
Beeswax
Medicines
Beekeeping instruments
Transportation
Beehives filled with honey
Waste:
cardboard and plastic waste
Co-products:
honeycombs
Honey extractionUniform
Gloves
Lab coats
Electricity
Water
Machines
Filters
Honey
Waste: cotton
Co-products:
beeswax,
propolis,
royal jelly
Table 3. Some examples of characterization factors evaluated in the IPCC 2013 method [31].
Gas Chemical FormulaGWP100 (CO2 Equivalent)
Anidride dioxydeCO21
Nitrous oxideN2O265
MethaneCH430.5
Publisher’s Note: MDPI stays neutral with regard to jurisdictional claims in published maps and institutional affiliations.

