Article

Examining the Ability of Communities to Cope with Food Insecurity due to Climate Change

1
Department of Networks, Makerere University, Kampala P.O. Box 7062, Uganda
2
Department of Agricultural Production, Makerere University, Kampala P.O. Box 7062, Uganda
3
Department of Geography, Geo-informatics and Climatic Sciences, Makerere University, Kampala P.O. Box 7062, Uganda
4
College of International Education, Nanjing University of Information Sciences and Technology, Nanjing 210044, China
5
Directorate of Training and Research, Uganda National Meteorological Authority, Kampala P.O. Box 7025, Uganda
6
Institute of Water Resources, Rhodes University, Makhanda 6139, South Africa
7
Directorate of Forecasting Services, Uganda National Meteorological Authority, Kampala P.O. Box 7025, Uganda
8
Department of Environmental Management, Makerere University, Kampala P.O. Box 7062, Uganda
9
Department of Philosophy, Makerere University, Kampala P.O. Box 7062, Uganda
10
Department of Linguisitics, English Language Studies and Communication Skills, Makerere University, Kampala P.O. Box 7062, Uganda
*
Author to whom correspondence should be addressed.
Sustainability 2021, 13(19), 11047; https://doi.org/10.3390/su131911047
Submission received: 3 August 2021 / Revised: 6 September 2021 / Accepted: 20 September 2021 / Published: 6 October 2021

Abstract

:
The changing climate has negatively impacted food systems by affecting rainfall patterns and leading to drought, flooding, and higher temperatures which reduce food production. This study examined the ability of communities to cope with food insecurity due to the changing climate in the Serere and Buyende districts, which are two different agro-ecological zones of Uganda. We administered 806 questionnaires to households, a sample size which was determined using Yamane’s formula, with the snowball sampling method used to select the households. The questionnaire sought information, including that regarding the respondents’ resources, the effects of climate change on households, and the coping mechanisms employed to reduce the impact of climate change on food security. The data collected was coded and analyzed using the statistical package for the social sciences (SPSS). Agriculture was found to be the main source of income for 42.4% of male adults and 41.2% of female adults in Serere. In Buyende, 39.9% of males and 33.7% of females rely on selling animal, poultry, and food crops. Aggregate results further showed that 58.3% of females and 42.2% of the males from both districts had suffered from the impacts of climate change, and that the effects were more evident between March and May, when communities experienced crop failure. The study further found that the percentage of households who had three meals a day was reduced from 59.7% to 43.6%, while the number of households with no major meals a day increased from 1.3% to 1.6%. We also found that 34.3% of households reported buying food during periods of crop failure or food scarcity. Moreover, despite reporting an understanding of several coping mechanisms, many households were limited in their ability to implement the coping mechanisms by their low incomes. This reinforced their reliance on affordable mechanisms, such as growing drought-resistant crops (32.7%), rearing drought-resistant livestock breeds (26.1%), and reducing the number of meals a day (14.5%), which are mechanisms that are insufficient for solving all the climate-related food insecurity challenges. We recommend that the government intervenes by revising policies which help farmers cope with the negative effects of climate change, promoting the sensitization of farmers to employing the coping mechanisms, and subsidizing agricultural inputs, such as resistant varieties of crops, for all to afford.

1. Introduction

Food security is the state whereby all people, at all times, have physical, social, and economic access to sufficient, safe, and nutritious food that meets their food preferences and dietary needs for an active and healthy life. Food security has multiple dimensions including availability, access, utilization, and stability [1,2]. A projected rapid population growth would be the leading cause of food insecurity and widespread undernourishment across Africa [3]. Notably, cases where many small-farm communities have access to food with limited or no nutritional value may increase. The high levels of food underutilization are further manifested through the increase in obesity and the malnutrition of children, of which Africa and Asia are set to be the biggest victims [4]. Food insecurity is caused predominantly by climate change, price variability [5], and conflict [6]. There is a projected 20% decrease in output per adult by the end of the century due to the combined effect of climate change on food consumption and labor supply [7]. Moreover, urbanization in low- and middle-income countries is a high contributor to food insecurity, since food affordability and utilization is heavily determined by the income dimensions of people as a result of decreases in production and increases in access to food via trade mechanisms [8]. This pushes the burden of food production to a few individuals, who rely predominantly on small-scale production. While towns are attractive for their economic opportunities and potential for a better life, many people struggle to get by [9]. Fewer food-secure households depend more on short-cycle food crops compared with better-off households [10]. The high dependency of better-off households on the formal food retail outlets exposes them to unhealthy food items [11].
Climate change is a global issue, impacting people and their property negatively and with varying dimensions. Due to growing population sizes, especially in Africa, there is a noticeable stress on the available resources, predominantly land. This has led to increased land-use change with, for example, forests and permanent wetlands turned into farmland, so as to improve food security. This causes destruction of the ecosystem services, further exacerbating climate change [12]. While some communities experience increases in the occurrence and intensity of river floods and forest fires, others have reported increased drought. Overall, many regions are experiencing rising daily temperatures and declining rainfall [13,14]. These extreme climate conditions have negatively impacted everyone globally, making low-income and poor communities more vulnerable. The poor are also expected to be the worst hit by climate change due to their inability to cope with the negative effects [15]. While climate change cannot be completely eliminated, interventions to limit its impact have been proposed. However, the cost of implementing the adaptation measures has been prohibitive to many poor communities [16,17]. A case in point is the farming communities in Uganda, which heavily rely on rain-fed agriculture for their livelihood because of their inability to afford smart farming practices. Only a few farmers with a large number of assets and entitlements, such as land, education, and access to governmental resources, have the capacity to create buffers for the shocks that will result from climate change [18]. Moreover, agricultural land acquisition may not necessarily address the food security needs in many countries because of local land practices. Large-scale land acquisitions, often used to acquire huge chunks of land for agriculture, are focused almost entirely on serving the financial interests of transnational companies and local elites with the support of host governments [19]. As a result of these land acquisitions, more food is produced for export, leaving local communities food insecure. Faced with short rain seasons and long drought periods, farmers are often faced with low productivity and reduced yield, creating food, hunger, and malnutrition [20].
The vulnerability of communities to climate change, and their ability to adapt to and cope with climate shocks, has been extensively studied. In order to promote equity in climate change adaptations, several social dimensions have been proposed. Among these is gender, which takes into consideration the roles of men and women, targeting them differently in order to tailor climate change interventions [21,22,23]. For instance, a higher percentage of wives were found to adopt crop-related strategies, whereas husbands were found to prefer employing livestock and agroforestry-related strategies [24]. Women have been observed to have less access to resources, including labor and money, and are less assured to benefit from investments, making it harder for them to adapt compared to men [25,26]. Migration has also been cited as one of the coping mechanisms to the effects of climate change [25].
Government support for climate change adaptation is mostly given through policies and budgeting for implementation plans at the various administrative structures. Policy actions targeted at sustainable agriculture and rural development can help tackle the challenges posed by climate change [27]. Furthermore, policies targeting early warning, weather-based crop insurance, and disaster risk planning can, if put in place, address the direct impacts of droughts and migration (which, as an adaptation strategy, impacts on local communities), and help prevent and resolve conflict in vulnerable regions [28]. There was an observable imbalance in gender-related policies with regard to climate change interventions, characterized by inconsistencies in allocations by gender at subnational levels, with sharp differences between estimated and actual budgets, and with gendered activities not addressing structural inequalities [29]. However, due to other concerns, such as economic development, several climate change interventions may be undermined [30]. The production of improved crop varieties is one of the major investments governments have made towards addressing climate adaptation challenges in communities, addressing dietary and food access needs [31].
This study therefore sought to assess the ability of communities to cope with food insecurity due to climate change. This was achieved by assessing factors employed by communities in coping with the effects of climate change on agricultural activities.

2. Materials and Methods

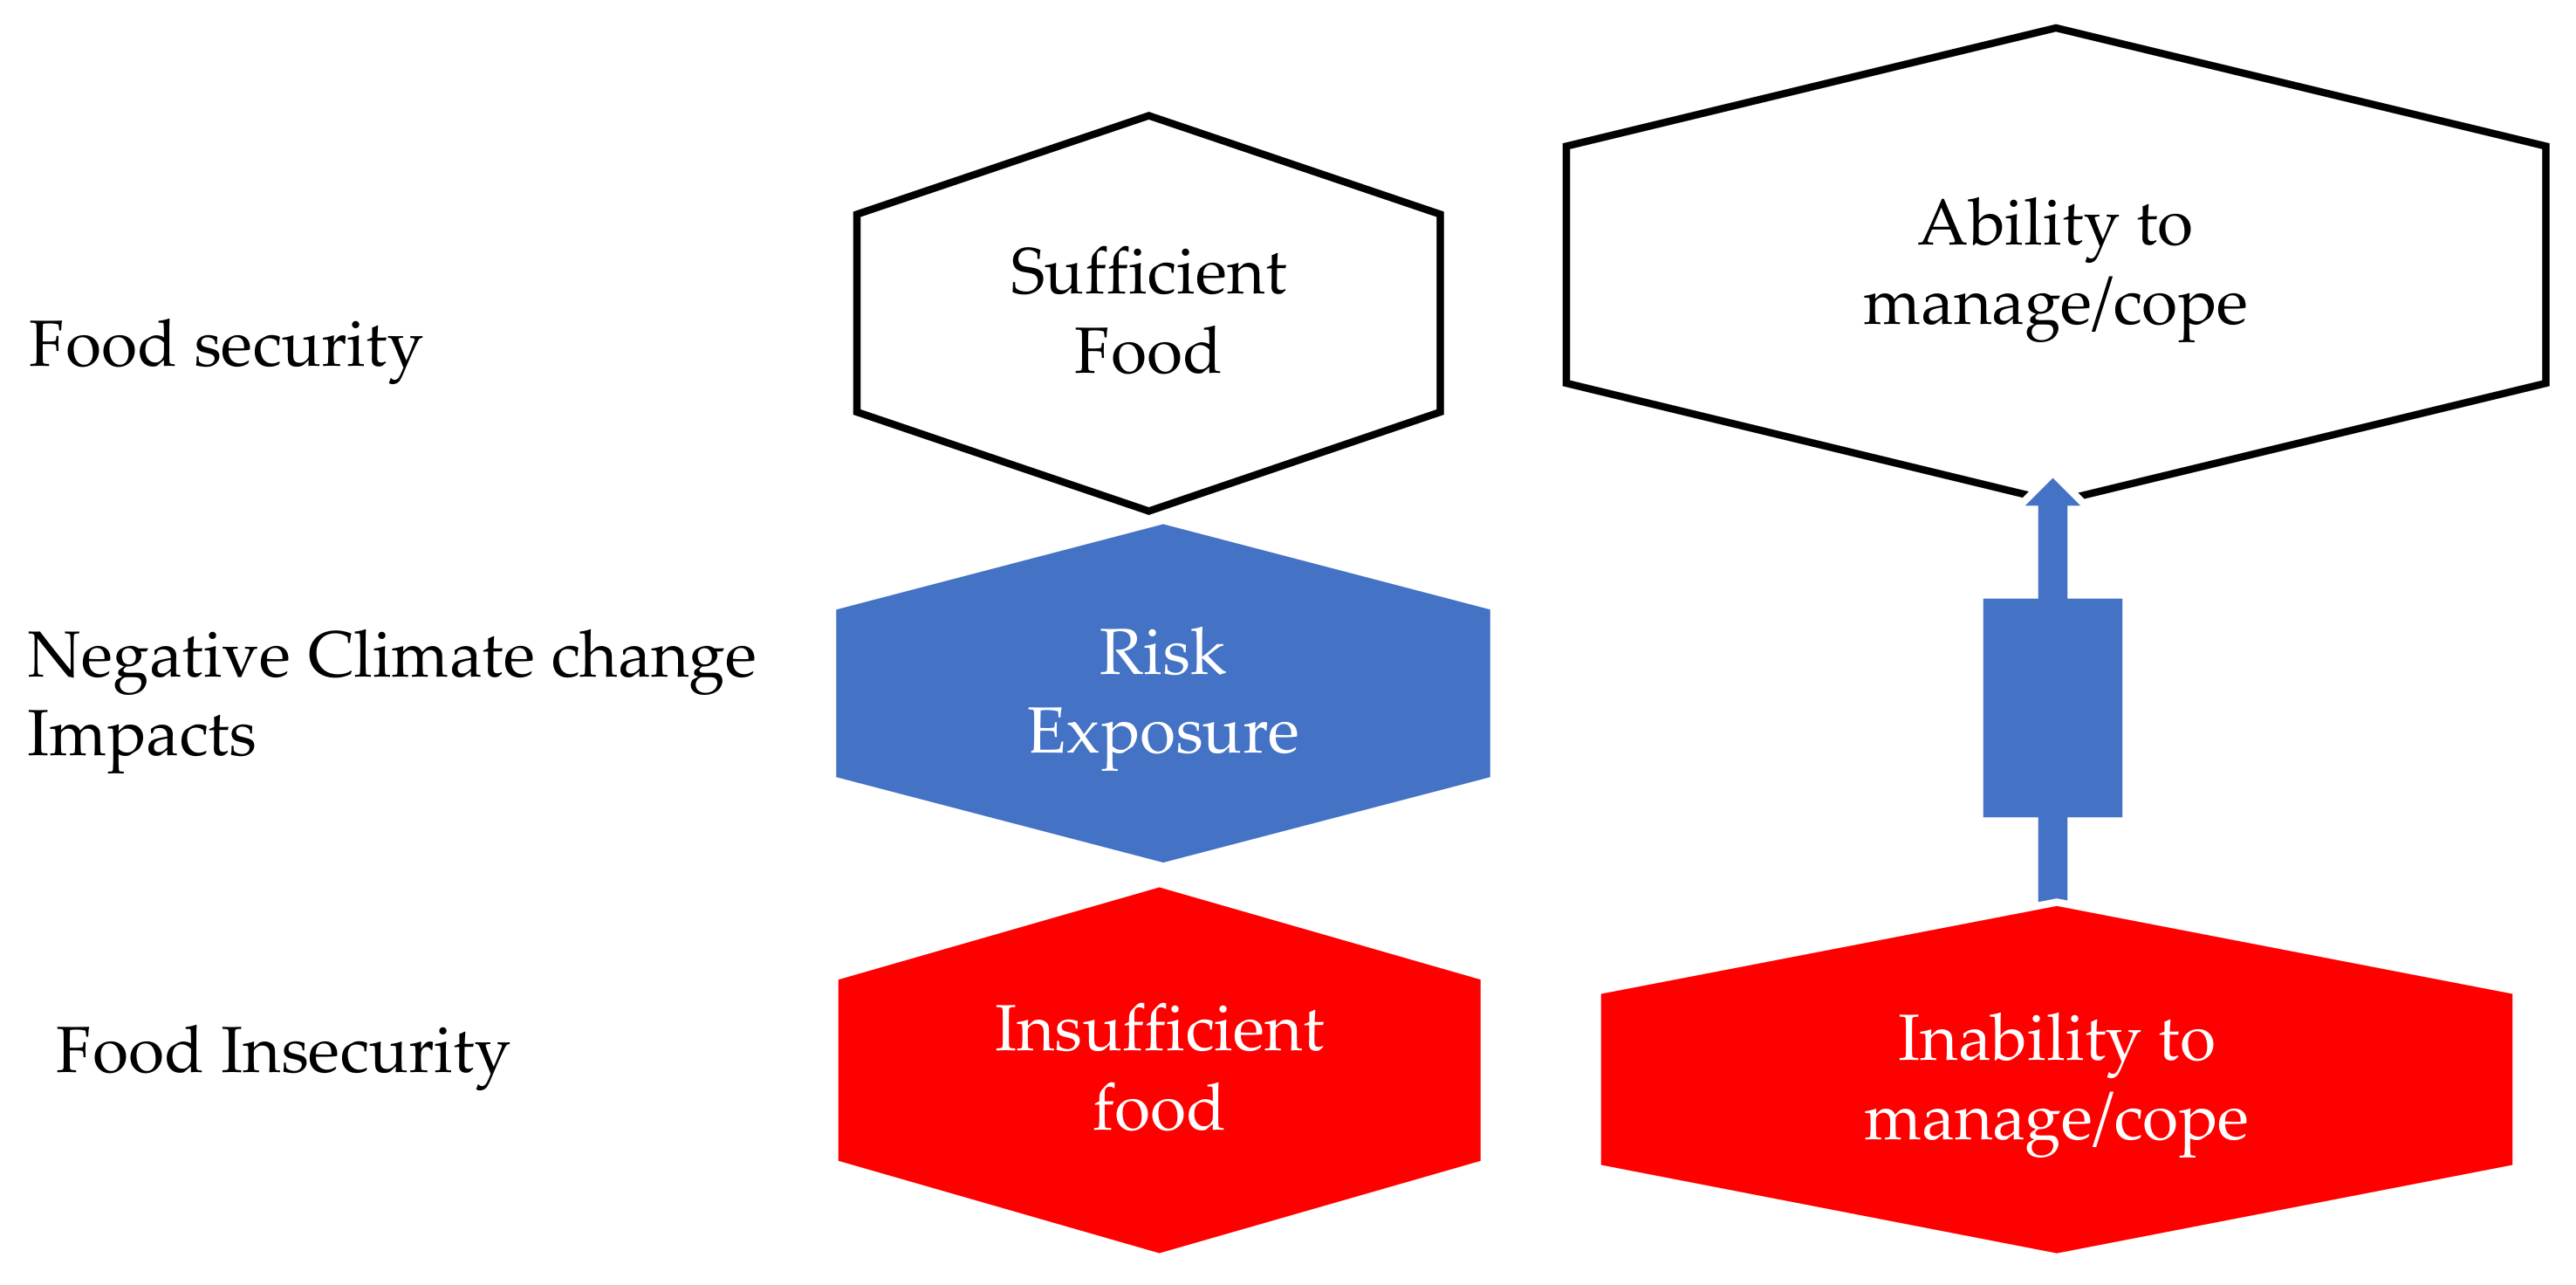
2.1. Theoretical Framework

A community’s ability to cope with food insecurity hinges on their ability to deal with the risks to which they are exposed. Failure to deal with the risks will make communities become food insecure. Figure 1 shows the theoretical framework used in this study.
In the face of climate change, agricultural productivity faces risks due to increased heat, drought, insect outbreaks, and reduced water supplies, among others [32]. These factors lead to reduced agricultural yields, among other negative effects, which in turn lowers food availability. Exposure to risks makes communities vulnerable to food insecurity. As a means of reducing the negative impacts, one has to learn how to cope with the difficult conditions. Coping with climate change stress on agriculture requires the adoption of mechanisms which can limit the negative effects. These adaptation responses and mitigation mechanisms, such as adopting technological changes, input substitution, and crop switching, are used to mitigate the negative impact of warming and improve crop yields [33]. Hence, a community’s ability to cope with food insecurity hinges on their ability to deal with the risks to which they are exposed. Such coping mechanisms include a household’s education level, its dependency ratio, and the amount of land and fertilizer, among others [34,35]. However, the extent to which the adaptation strategies are adopted is variable, and is influenced by both biophysical and socioeconomic considerations [36]. Therefore, households that are able to counter the negative impacts of climate change by employing the adaptation mechanisms are able to maintain agricultural production. Hence, such households are considered to be food secure. On the other hand, failure to deal with the risks makes communities food insecure [37,38]. Communities that are food insecure are unable to maintain a consistent food supply for either their own consumption or for income generation. Figure 1 shows the theoretical framework that guided this study.

2.2. Survey Administration

To explore the community’s ability to cope with food insecurity, we carried out a survey in the Buyende and Serere districts of Uganda and administered 806 questionnaires. The questionnaire included information on respondents’ resources, the effects of climate change on their agricultural production, and the coping mechanisms that they employed to reduce the impact of climate change on food security. The survey was generally conducted in English, but those who did not understand English were interviewed through interpreters who were recruited from within the communities. The sample size was estimated using Yamane’s formula [39,40,41]. The Equation (1) that was used assumed a 95% confidence level with p = 0.05, and is expressed as follows:
n = N 1 + N e 2
where n is the sample size, N is the population size, and e is the level of precision.

Selection Procedure

The respondents were randomly selected from the different subcounties that make up the two districts (Serere and Buyende). Snowball sampling was adopted in the study [42,43,44,45,46]. A random sample of individuals was drawn from a given finite populations of 323,067 and 285,903 people in Buyende and Serere, respectively. In the model that we used, each individual in the sample is asked to name k different individuals in the population, where k is a specified integer; for example, each individual may be asked to name his “k best friends,” or the “k individuals with whom they most frequently associate,” or the “k individuals whose opinions they most frequently seek,” etc. (For the sake of simplicity, we assume that an individual cannot include himself or herself in their list of k individuals). The individuals who are not in the random sample, but who are named by individuals from within the random sample, form the first stage. Each of the individuals in the first stage is then asked to name k different individuals. (This assumes that the question asked of the individuals in the random sample and of those in each stage is the same and that k is the same.) [44,45]. The individuals who are neither in the random sample nor in the first stage are named by individuals who are in the first stage. Each of the individuals in the second stage is then asked to name k different individuals. The individuals who are not in the random sample nor in the first or second stages, but who are named by individuals who are in the second stage form the third stage. Each of the individuals in the third stage is then asked to name k different individuals. This procedure is continued until each of the individuals in the sth stage has been asked to name k different individuals [46].
This method was performed to make sure that the data obtained using the snowball sampling procedure can be utilized to make statistical inferences about various aspects of the relationships present in the population [47]. The relationships present, in the hypothetical situation where each individual in the population is asked to name k different individuals, can be described using a matrix with rows and columns corresponding to the members of the population, with rows for the individuals performing the naming and columns for the individuals who are being named [48,49].

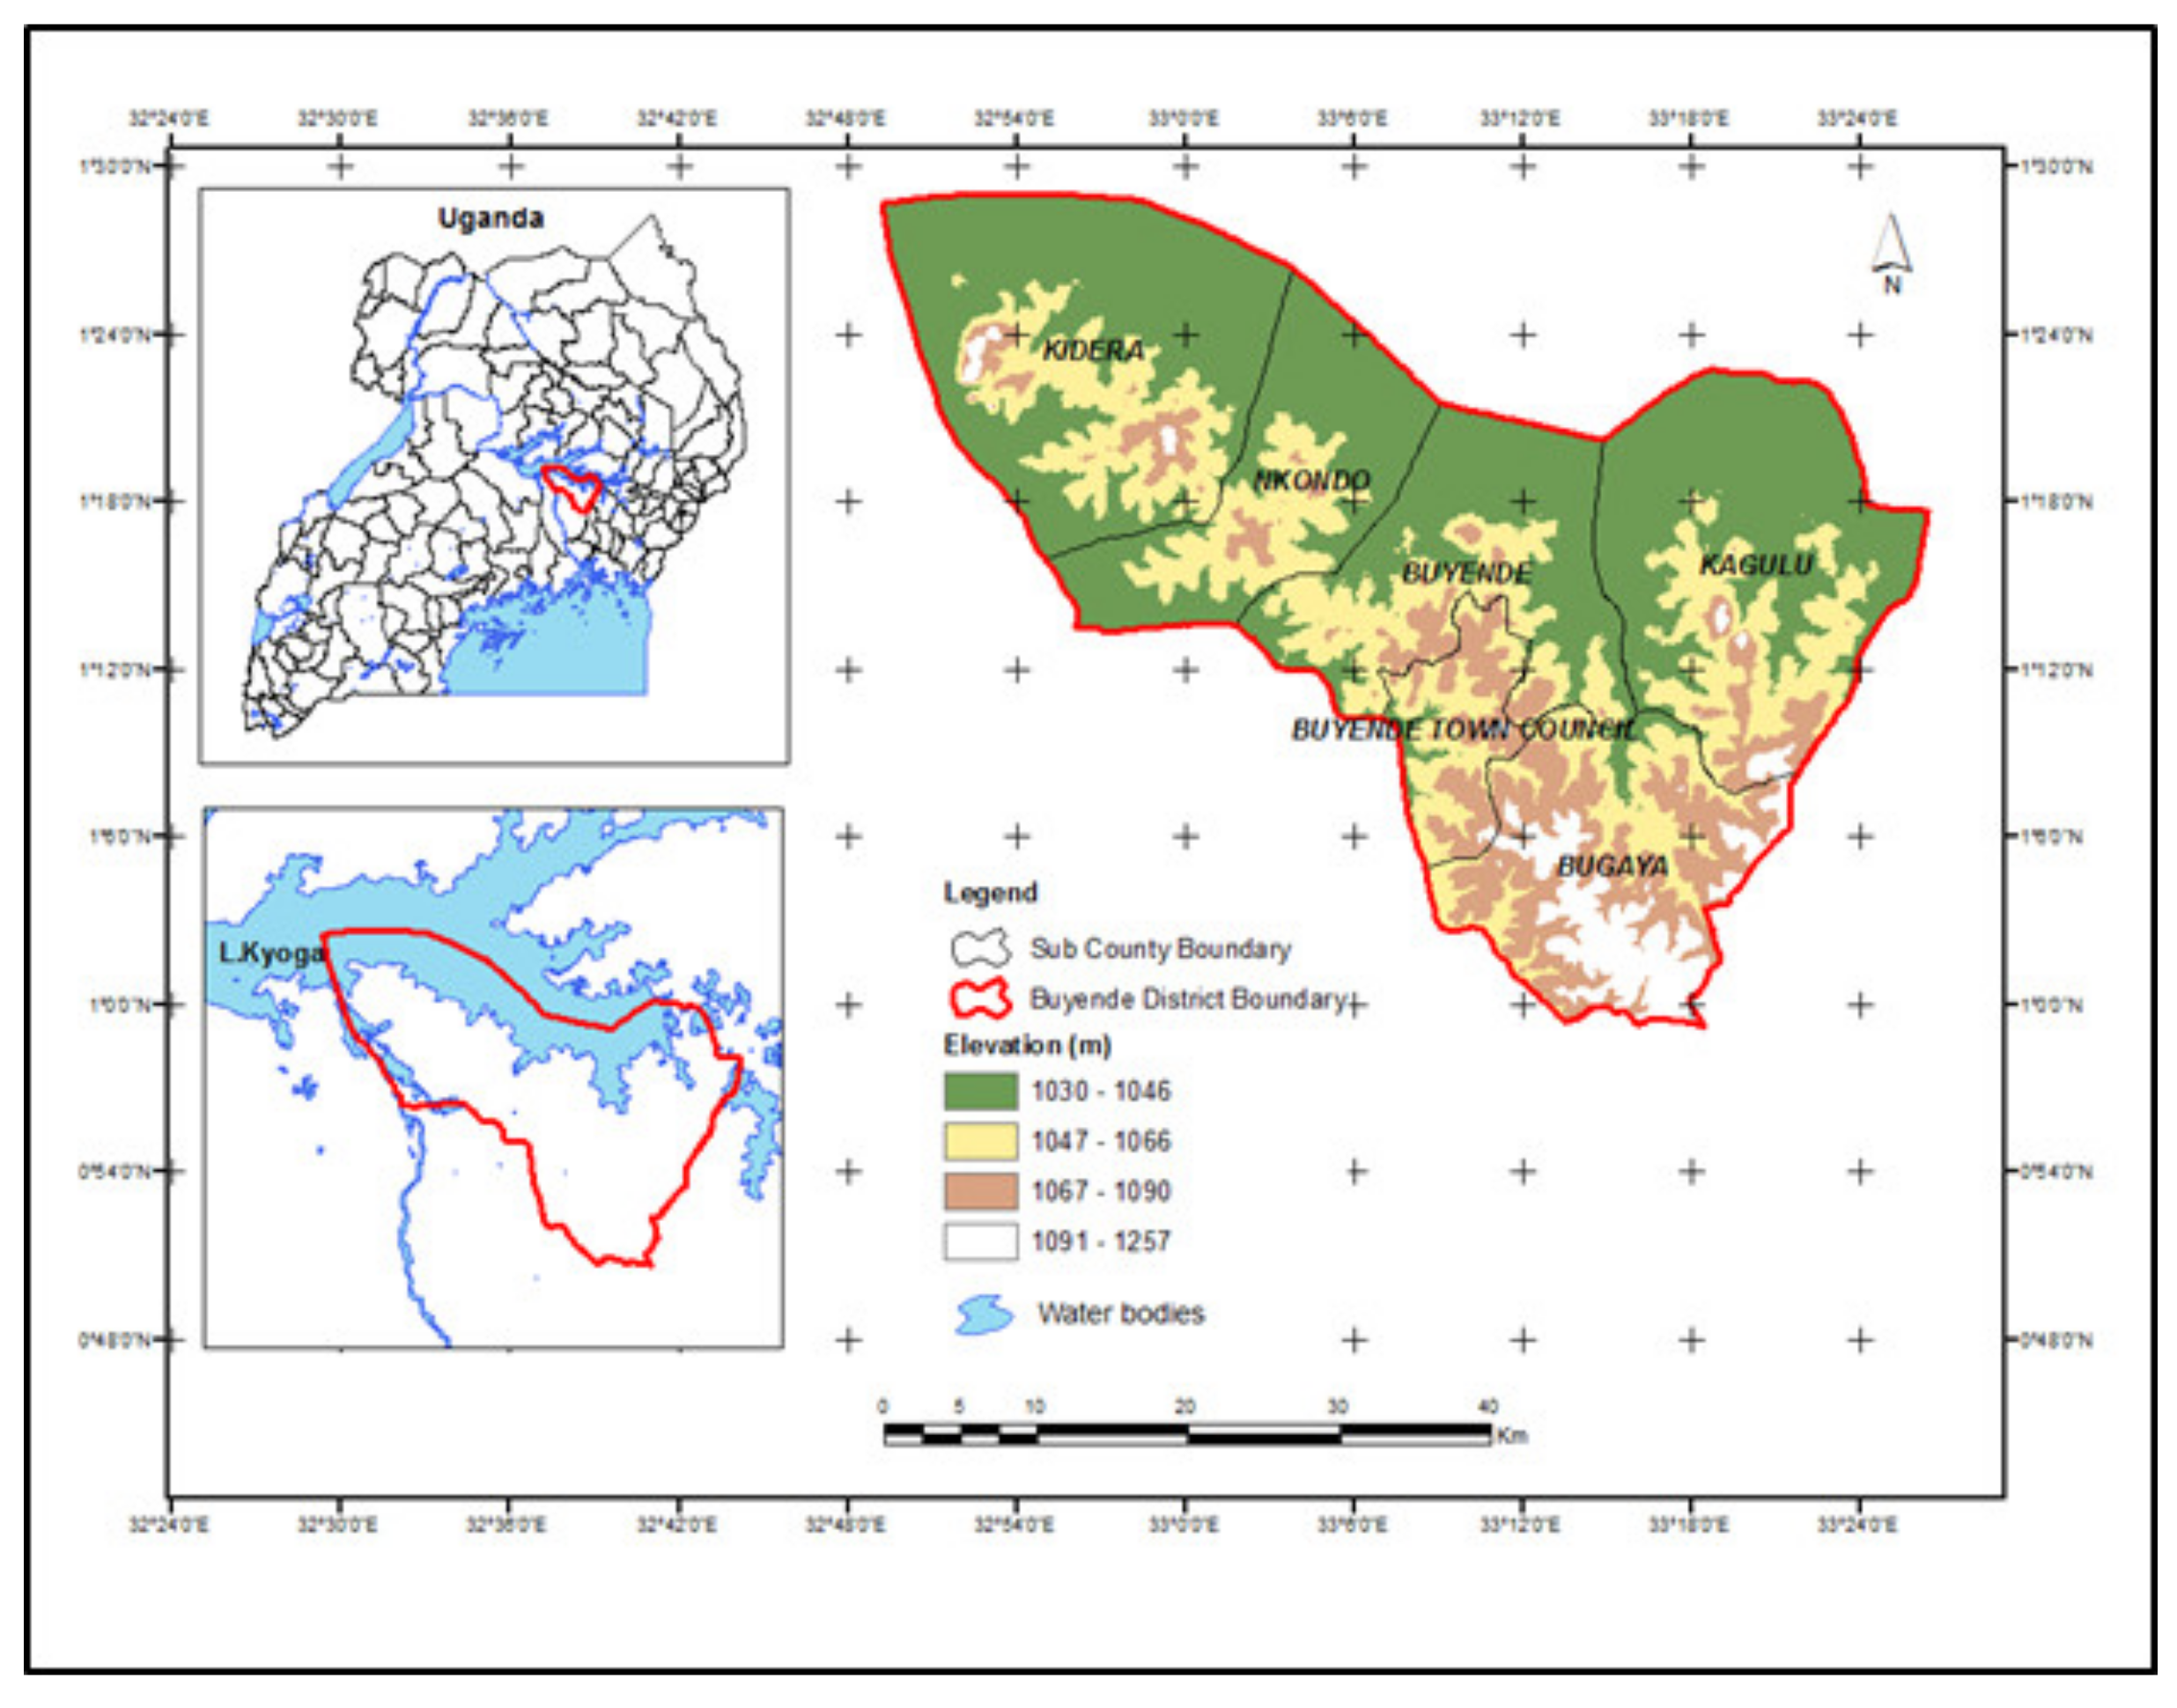
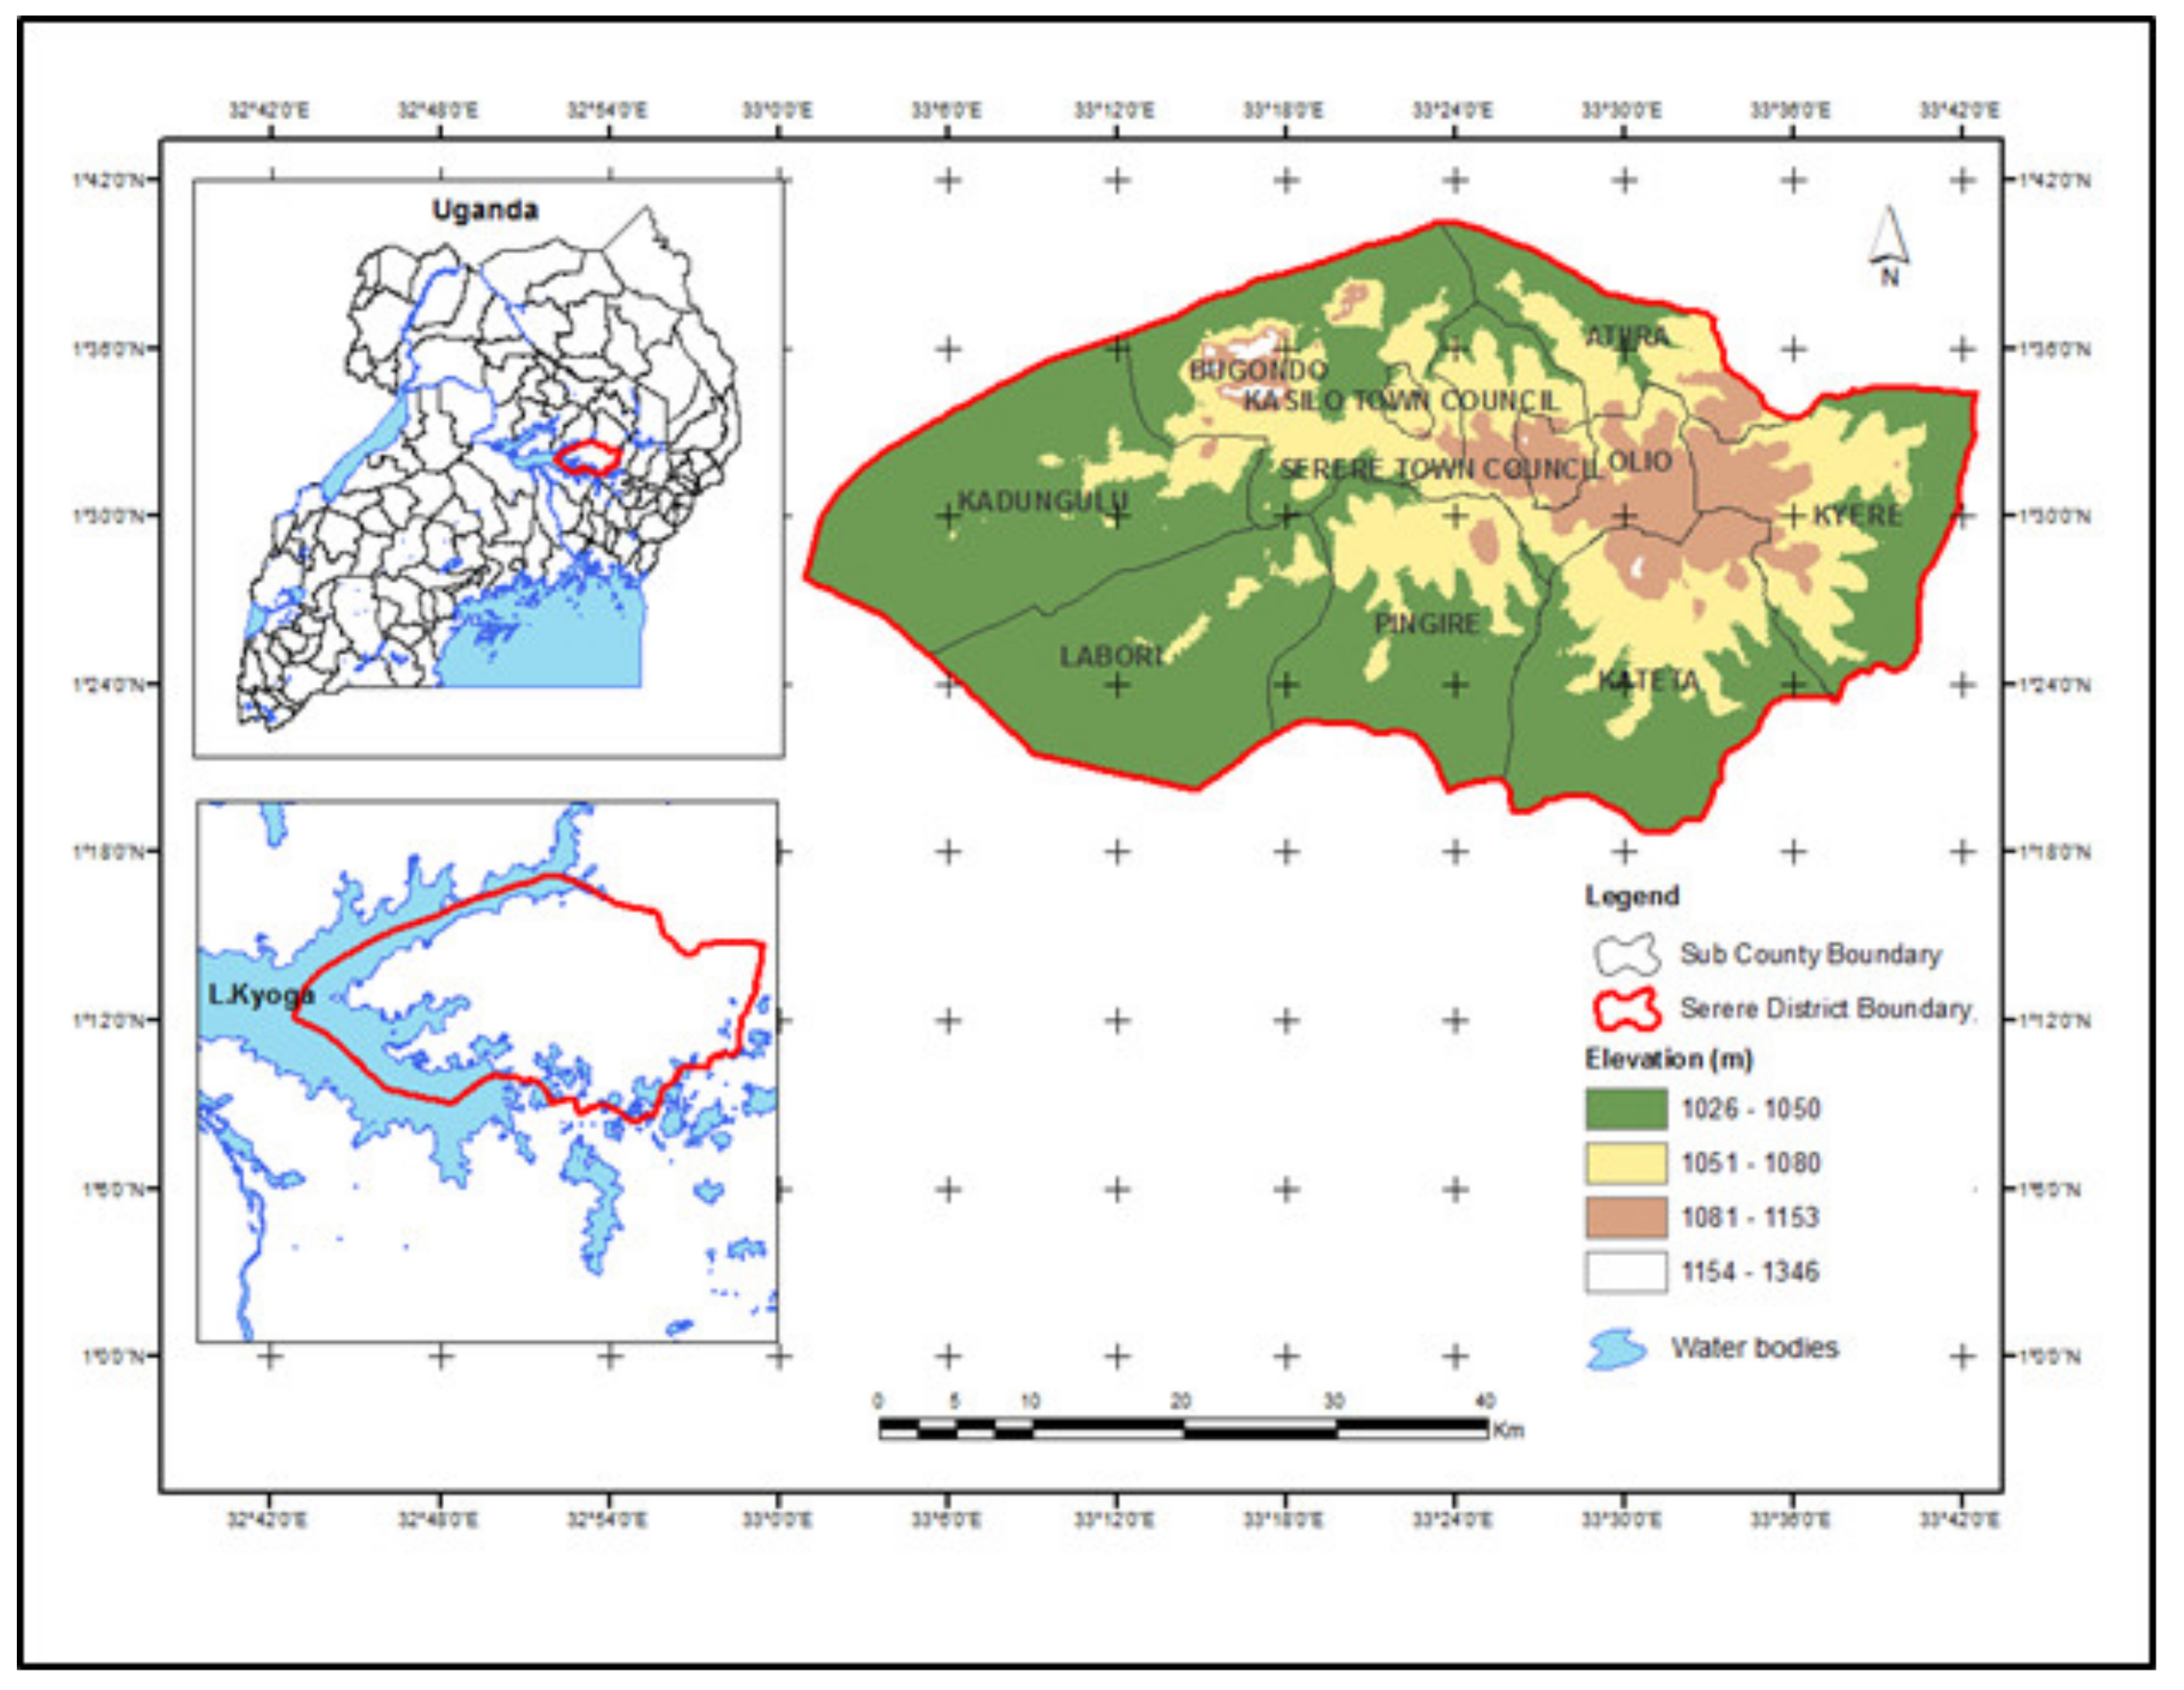
2.3. Description of the Study Area

This study arose from the need to achieve one specific objective: to examine the resilience and adaptation strategies of farmers across the different agro-climatological zones under the project ‘Towards a food secure Uganda under a changing climate’. The study was conducted in the Kyoga basin, during the period between 10 January 2021 and 23 February 2021 in the Buyende and Serere districts of Uganda.
The Buyende district is geographically located in the Busoga subregion in Eastern Uganda, and covers an area of approximately 726.1 square miles [50], with an average elevation of about 1080 m above sea level (Figure 2). The Serere district is located in Eastern Uganda, in the Teso subregion, and covers approximately 1965.4 square km [50], with an average elevation of 1095 m above sea level (Figure 3). These areas normally experience two rainfall seasons, the first from March to May, and the second from September to November.
The respondents were randomly selected from the different subcounties that make up the two districts (Serere and Buyende). A proportionate sampling procedure was used to determine the sample of households based on number of households in each district using national household survey [51]. The sample size was determined according to [52] and is presented using the Equation (1).

2.4. Data Analysis

Quantitative data from household surveys were coded and analyzed in SPSS Version 20. Descriptive statistics were generated and results were presented as either percentages or counts in both graphical and table forms. Chi-square tests were computed and used to determine the association between the communities’ perceptions of the effects of climate change and the coping mechanisms employed to reduce the impact of climate change on food security at a 5% level of significance. The chi-square test was further used to analyze and compare sociodemographic and economic variables and to establish significant differences between socioeconomic groups (gender, age, education, income, house head type) and food security. The primary data on community residents’ perceptions of climate change and variability (changes in temperature and rainfall) were backed with an empirical trend analysis [53]. Qualitative information was recorded and typed out in Microsoft Word and summarized thematically. Content analysis was then used in the analysis of qualitative data [54,55].

3. Results

3.1. Sociodemographic Characteristics

The sociodemographic results are presented in Table 1. The results include gender, age of respondent, education level, household head type, and number of household members. From the survey results (Table 1), we can see that: 51.3% were males and 48.7% were females; 49.3% of the respondents had completed secondary and tertiary level of education, which meant that they could easily respond to the given questions; 9% of the respondents had no formal education while 41.7% had completed primary level; 80.3% of the households were male-headed, 18% female-headed, 1.2% were child-headed, and only 0.5% were headed by older people (i.e., a grandparent). About 64.1% of the number of household members belonged to the below 18, 18–25, and above 50 age categories (the dependent categories), while 35.9% belonged to the 26–35 age category, which is the independent category.
The Buyende district survey results (Table 2) show that both male and female respondents were equal (50% and 50%, respectively). Only 13.3% of the respondents had completed secondary and tertiary levels of education, which meant that they could easily respond to the given questions, while 86.7% of the respondents had no formal education or had completed primary. However, those who did not understand English were interviewed through interpreters who were recruited from within the communities. We found that 82.8% of the households were male-headed, 15.3% were female-headed, 1.5% were older people-headed, and only 0.5% were headed by children. The below 18, 18–25, and above 50 age categories (the dependent categories) had about 68% of the number of household members, while 32% belonged to the 26–35 age category, which is the independent category.

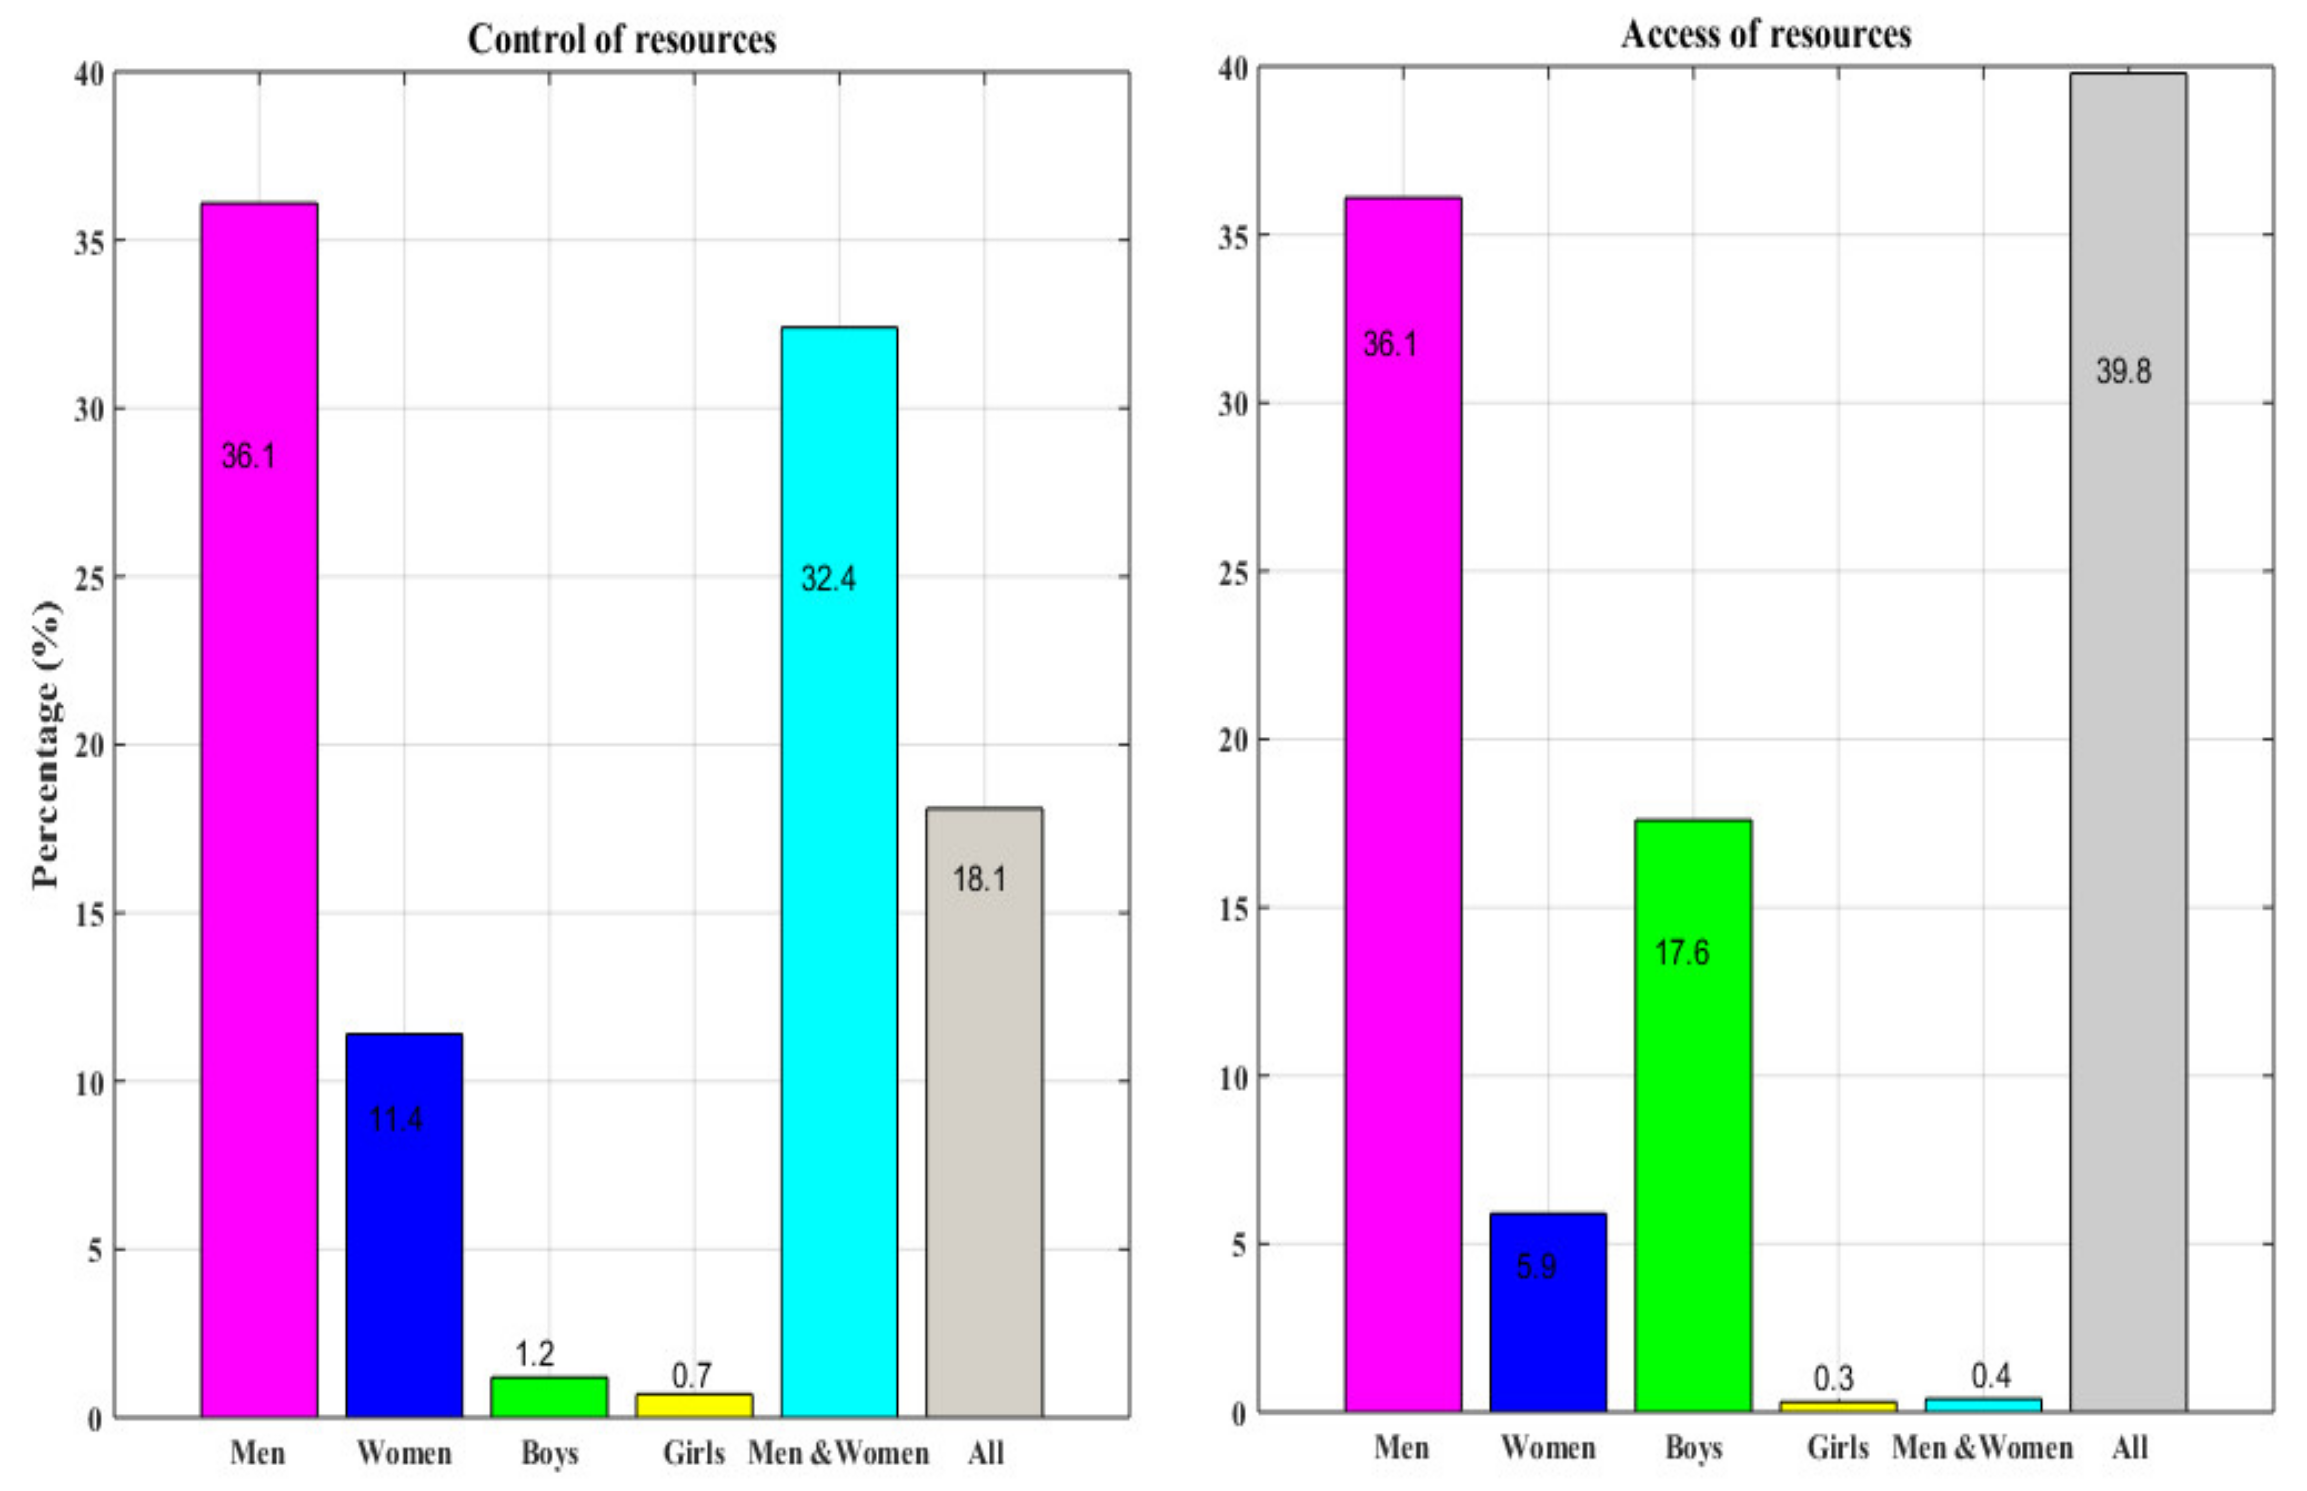
3.2. Resource Availability

Resource availability considered household assets, access to water resources, and household income.

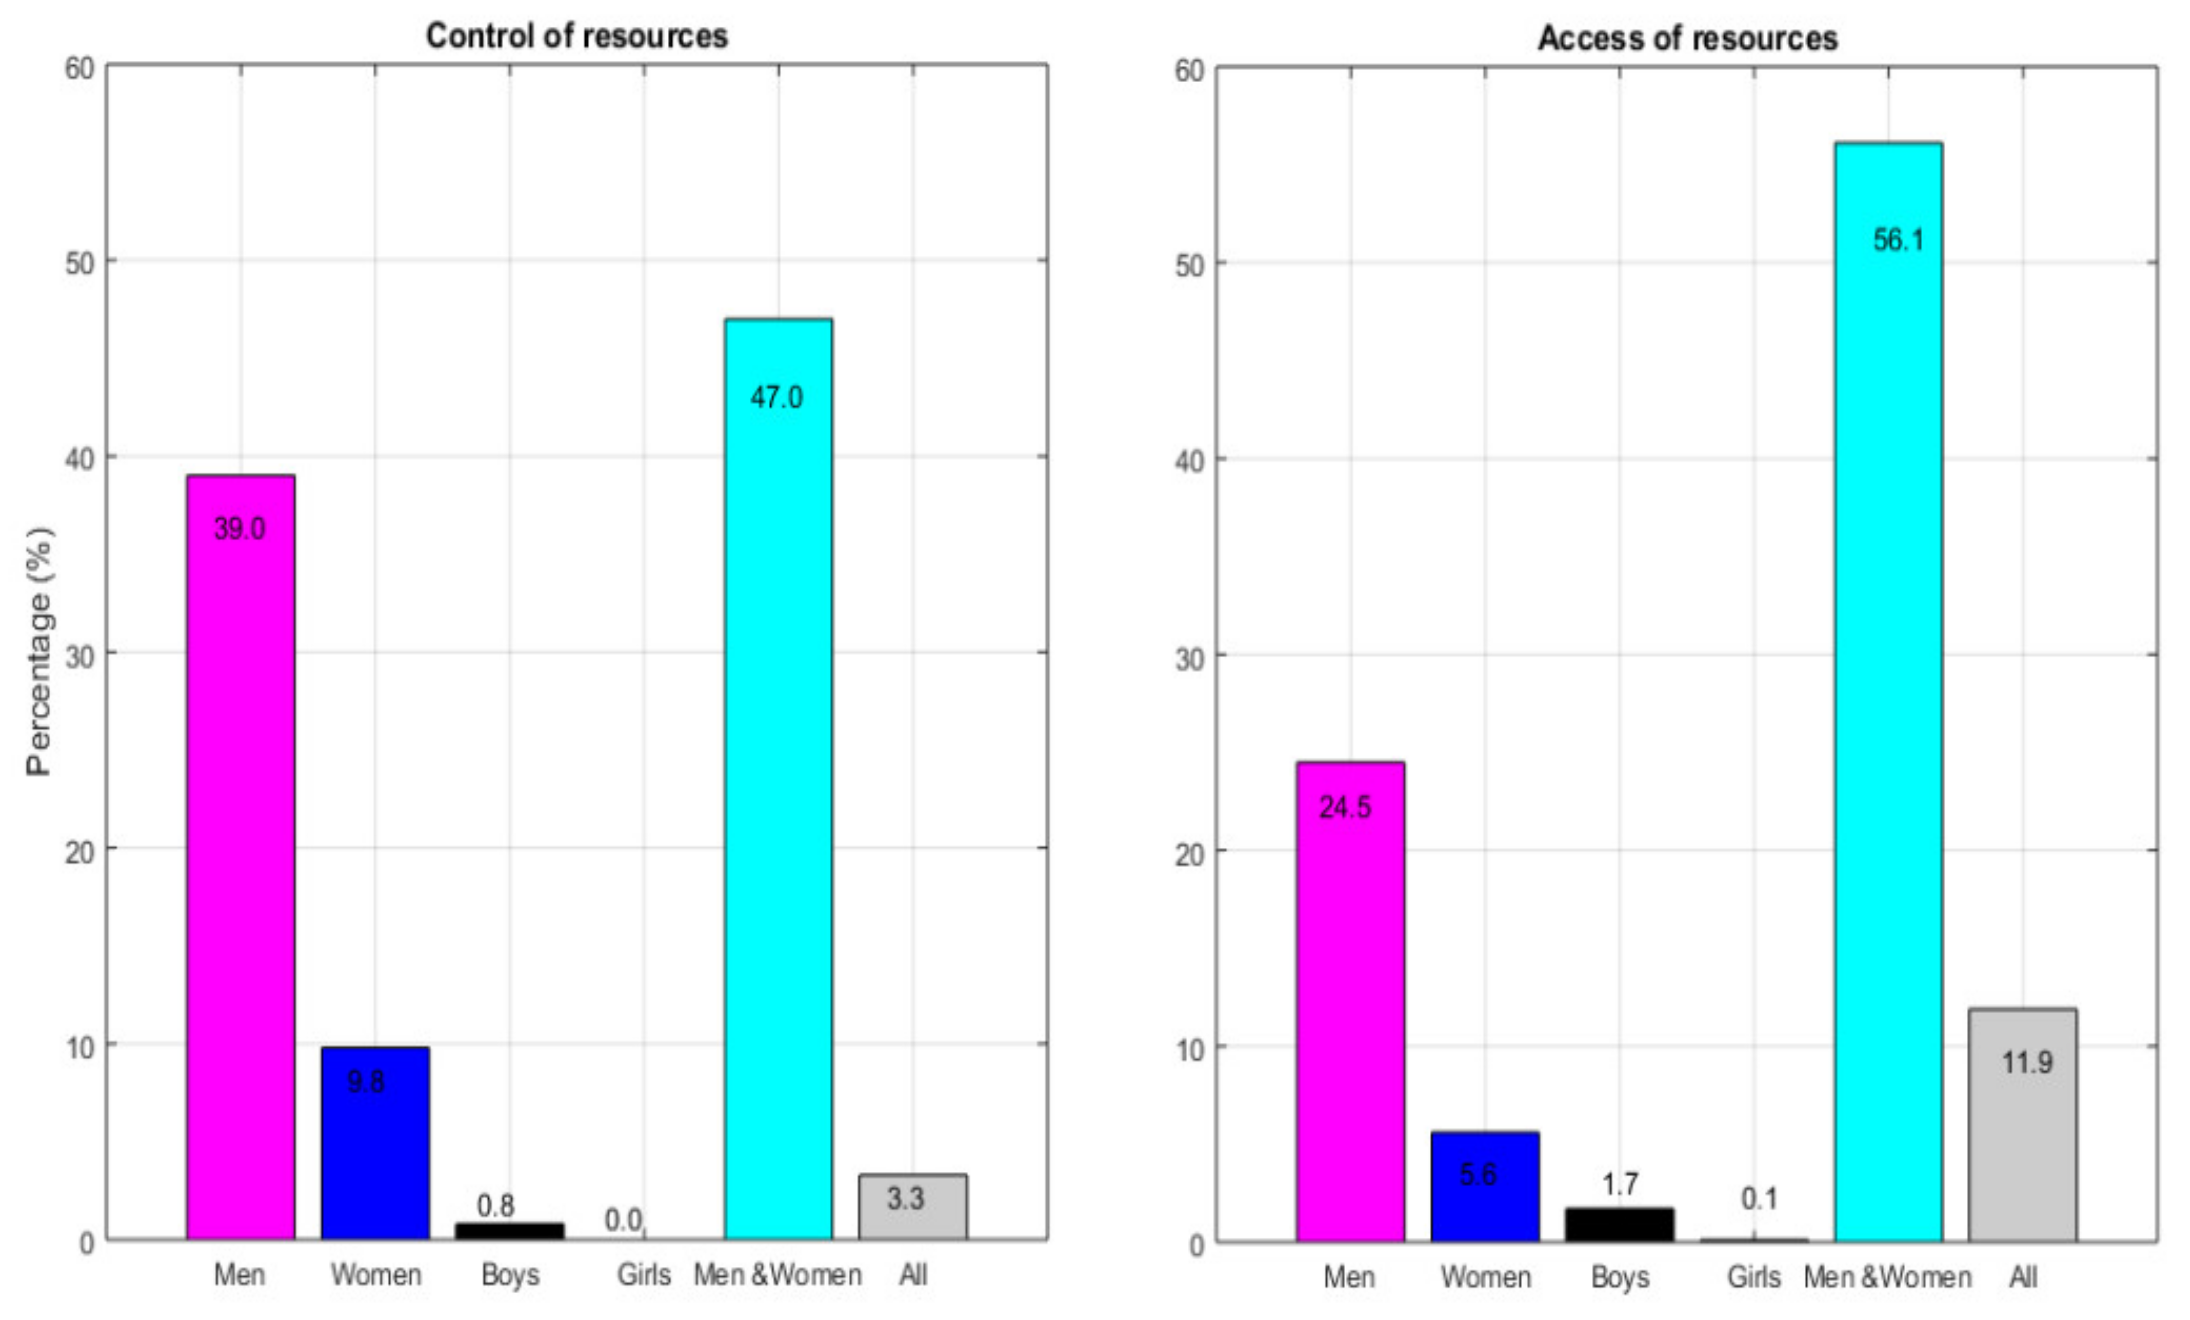
3.2.1. Household Assets

The household assets were analyzed in terms of individual control of and access to the respective assets used to cope with climate change. Results from two districts (see Figure 4 and Figure 5) indicate that men generally control and access the resources (assets), followed by a combination of both men and women, while children (girls and boys) have little access to and control over assets.

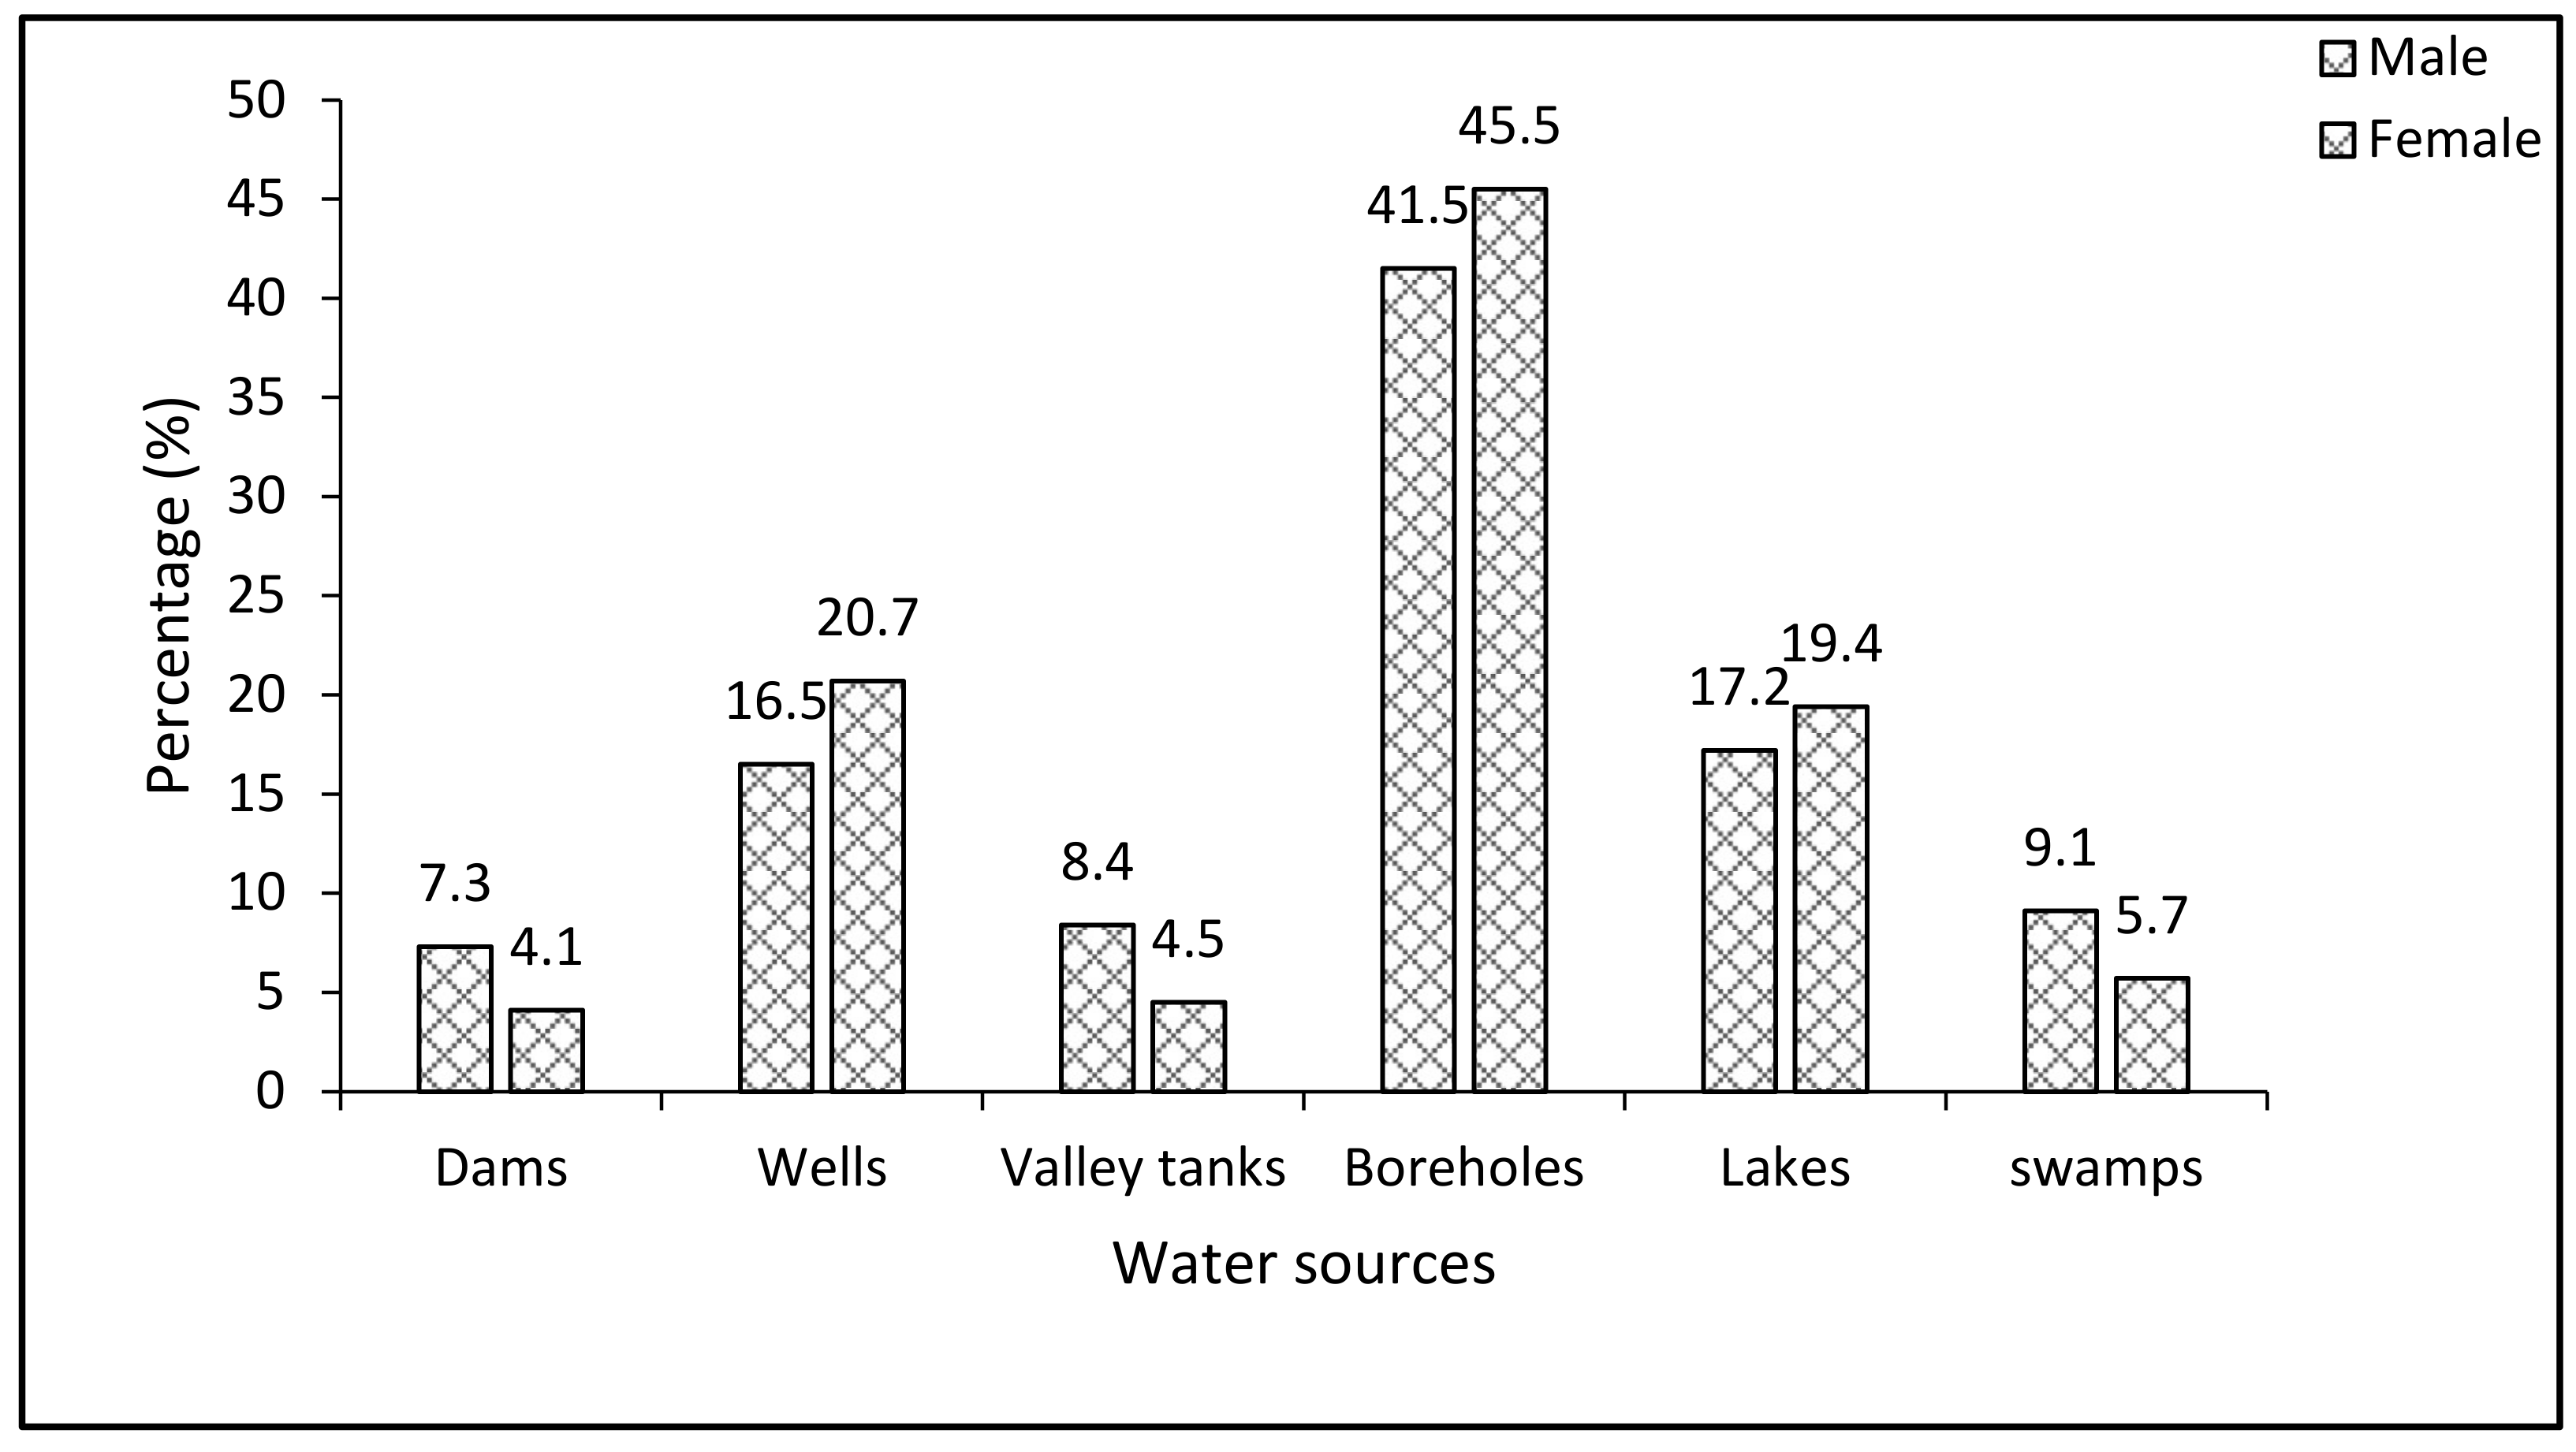
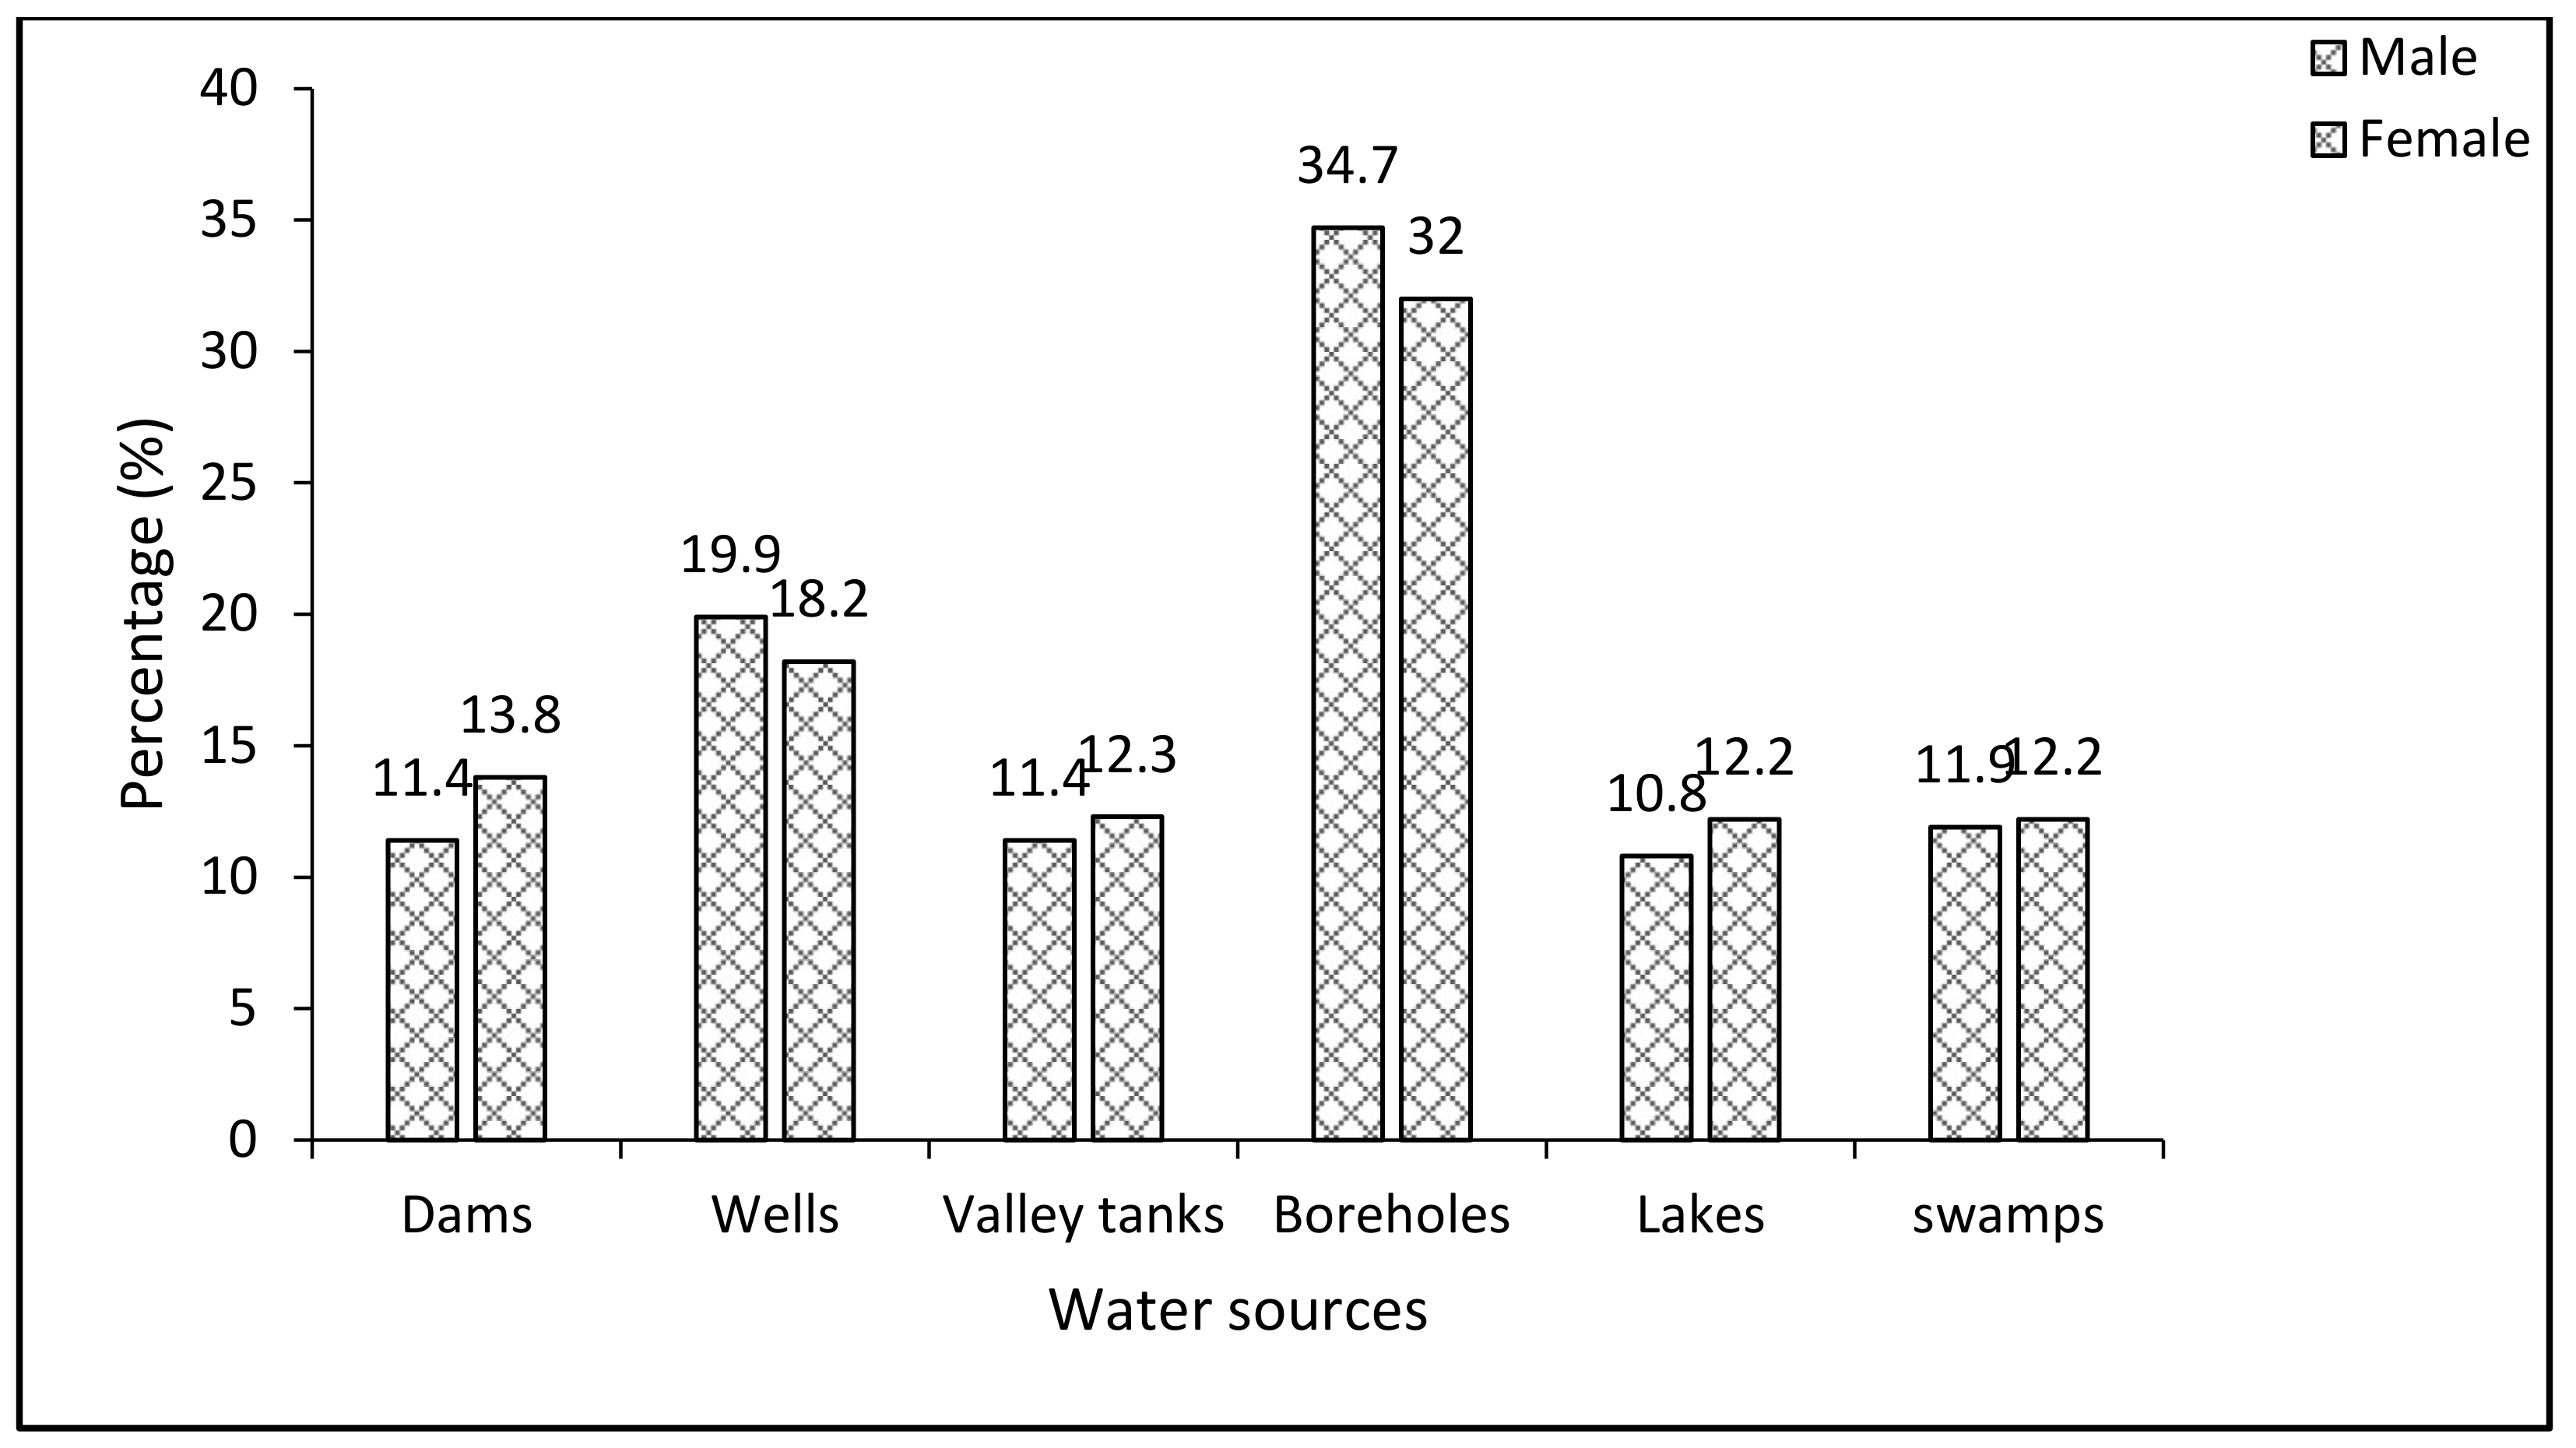
3.2.2. Access to Water Sources

The access to water sources was analyzed considering the different available sources of water. Results from the two districts (see Figure 6 and Figure 7) indicate that the majority of respondents access water from boreholes, which were used by 41.5% of males and 45.5% of females in the Buyende district, and 34.7% of males and 32% of females in the Serere district. Wells are the second major source of water, while lakes and dams are the least-used source of water due to the costs and risks of accident associated with dams. Generally, for the two districts combined, males have higher access to water sources compared to female.

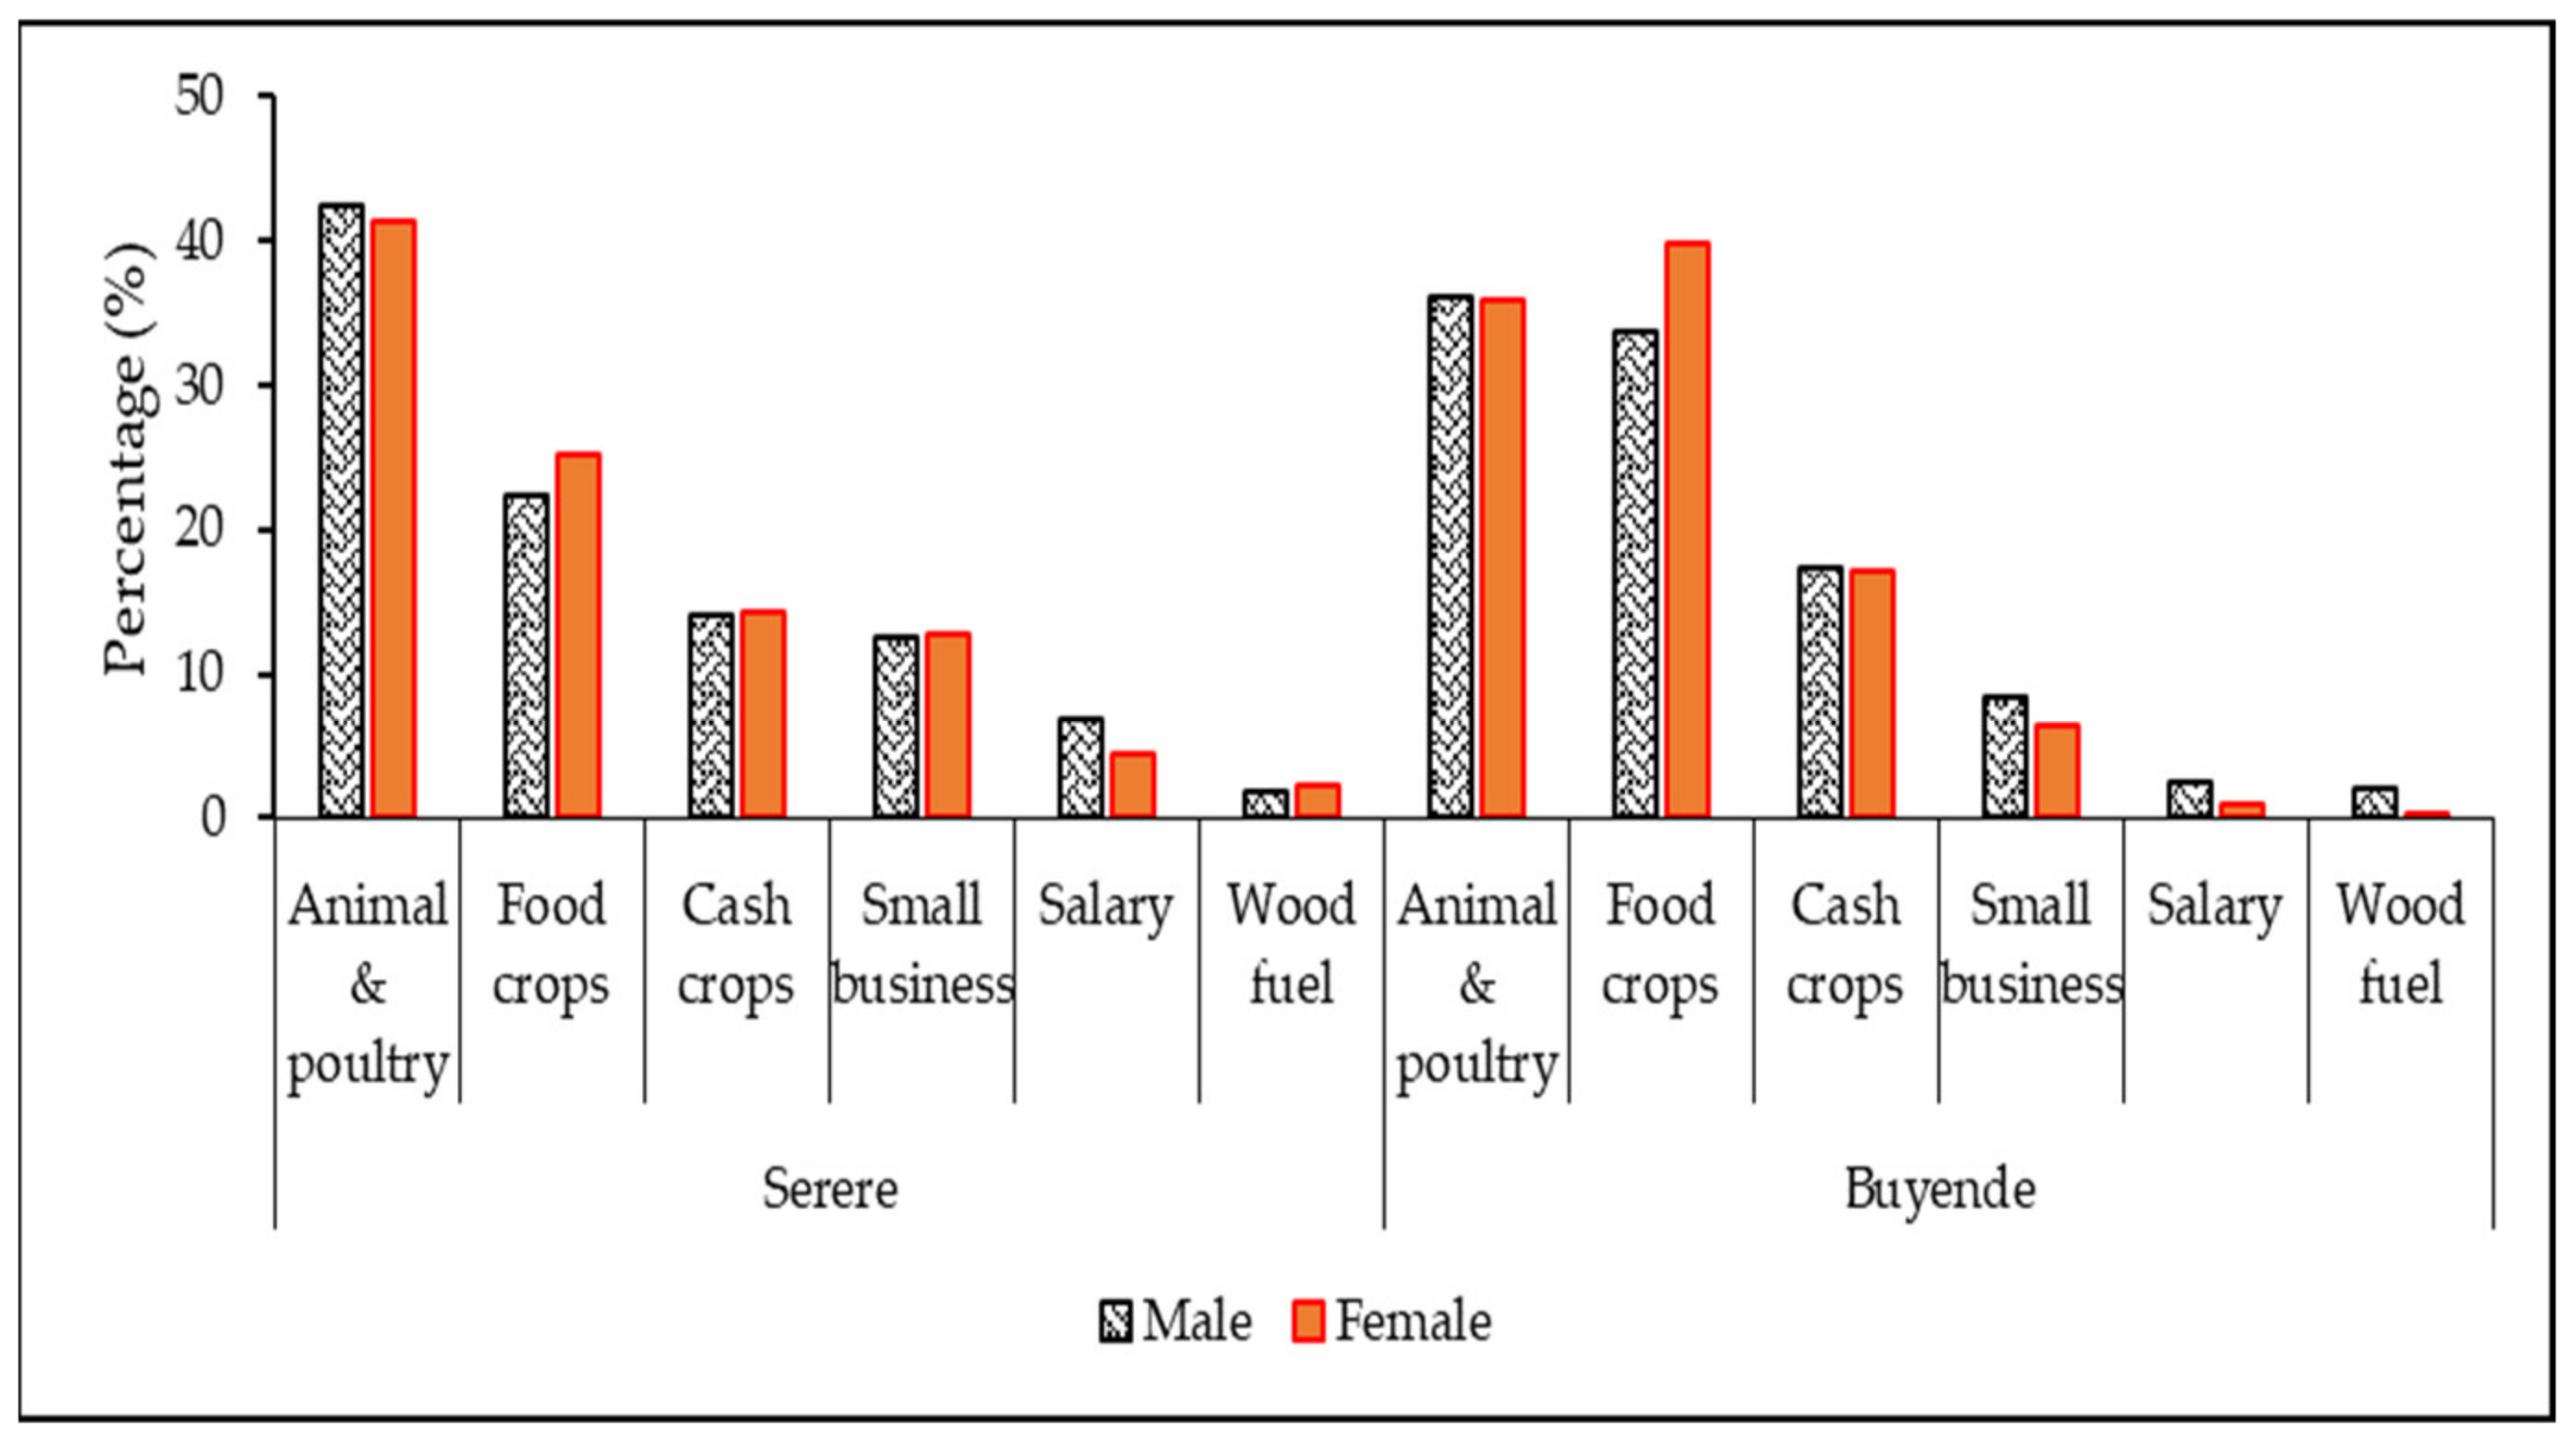
3.2.3. Household Income

In Serere (see Figure 8), the main source of income for the females is poultry and animal husbandry (41.2%), followed by food crops (25.2%), cash crops (14.2%), small business (12.7%), with 4.5% earning income from salaried household heads, and 2.3% from wood fuel. On the other hand, the main source of income for men is poultry and animal husbandry (42.4%), followed by food crops (22.3%), cash crops (14.1%), small business (12.5%), with 6.8% of men earning income from their salaries, and 1.9% earning income from wood fuel.
In Buyende (Figure 8), the main source income for females is food crops (39.9%), followed by poultry and animal husbandry (35.8%), cash crops (17.0%), small business (6.3%), with 1.0% for salary work, and 0.2% from wood fuel, whereas for the men, the main source of income is poultry and animal husbandry (36.0%), followed by food crops (33.7%), cash crops (17.4%), small business (8.4%), 2.5% for salary work, and 2.0% from wood fuel.

3.3. Climate Change and Its Effects to the Communities

The results show that the perceptions of climate change (e.g., awareness of increase in temperature, changes in rainfall intensity, and changes in rainfall days) were significantly associated with the respondent’s sex in the Serere district (see Table 3). We found that 52.8% of the male and 47.2% of the female respondents were aware of the changing climate. Additionally, the level of education was found to influence respondents’ awareness of climate change. Both male (42.2%) and female (58.3%) respondents (Table 4) reported that climate change is impacting them, and that they have observed significant increases in temperatures, changes in rainfall days, and increase in number of lightning days.

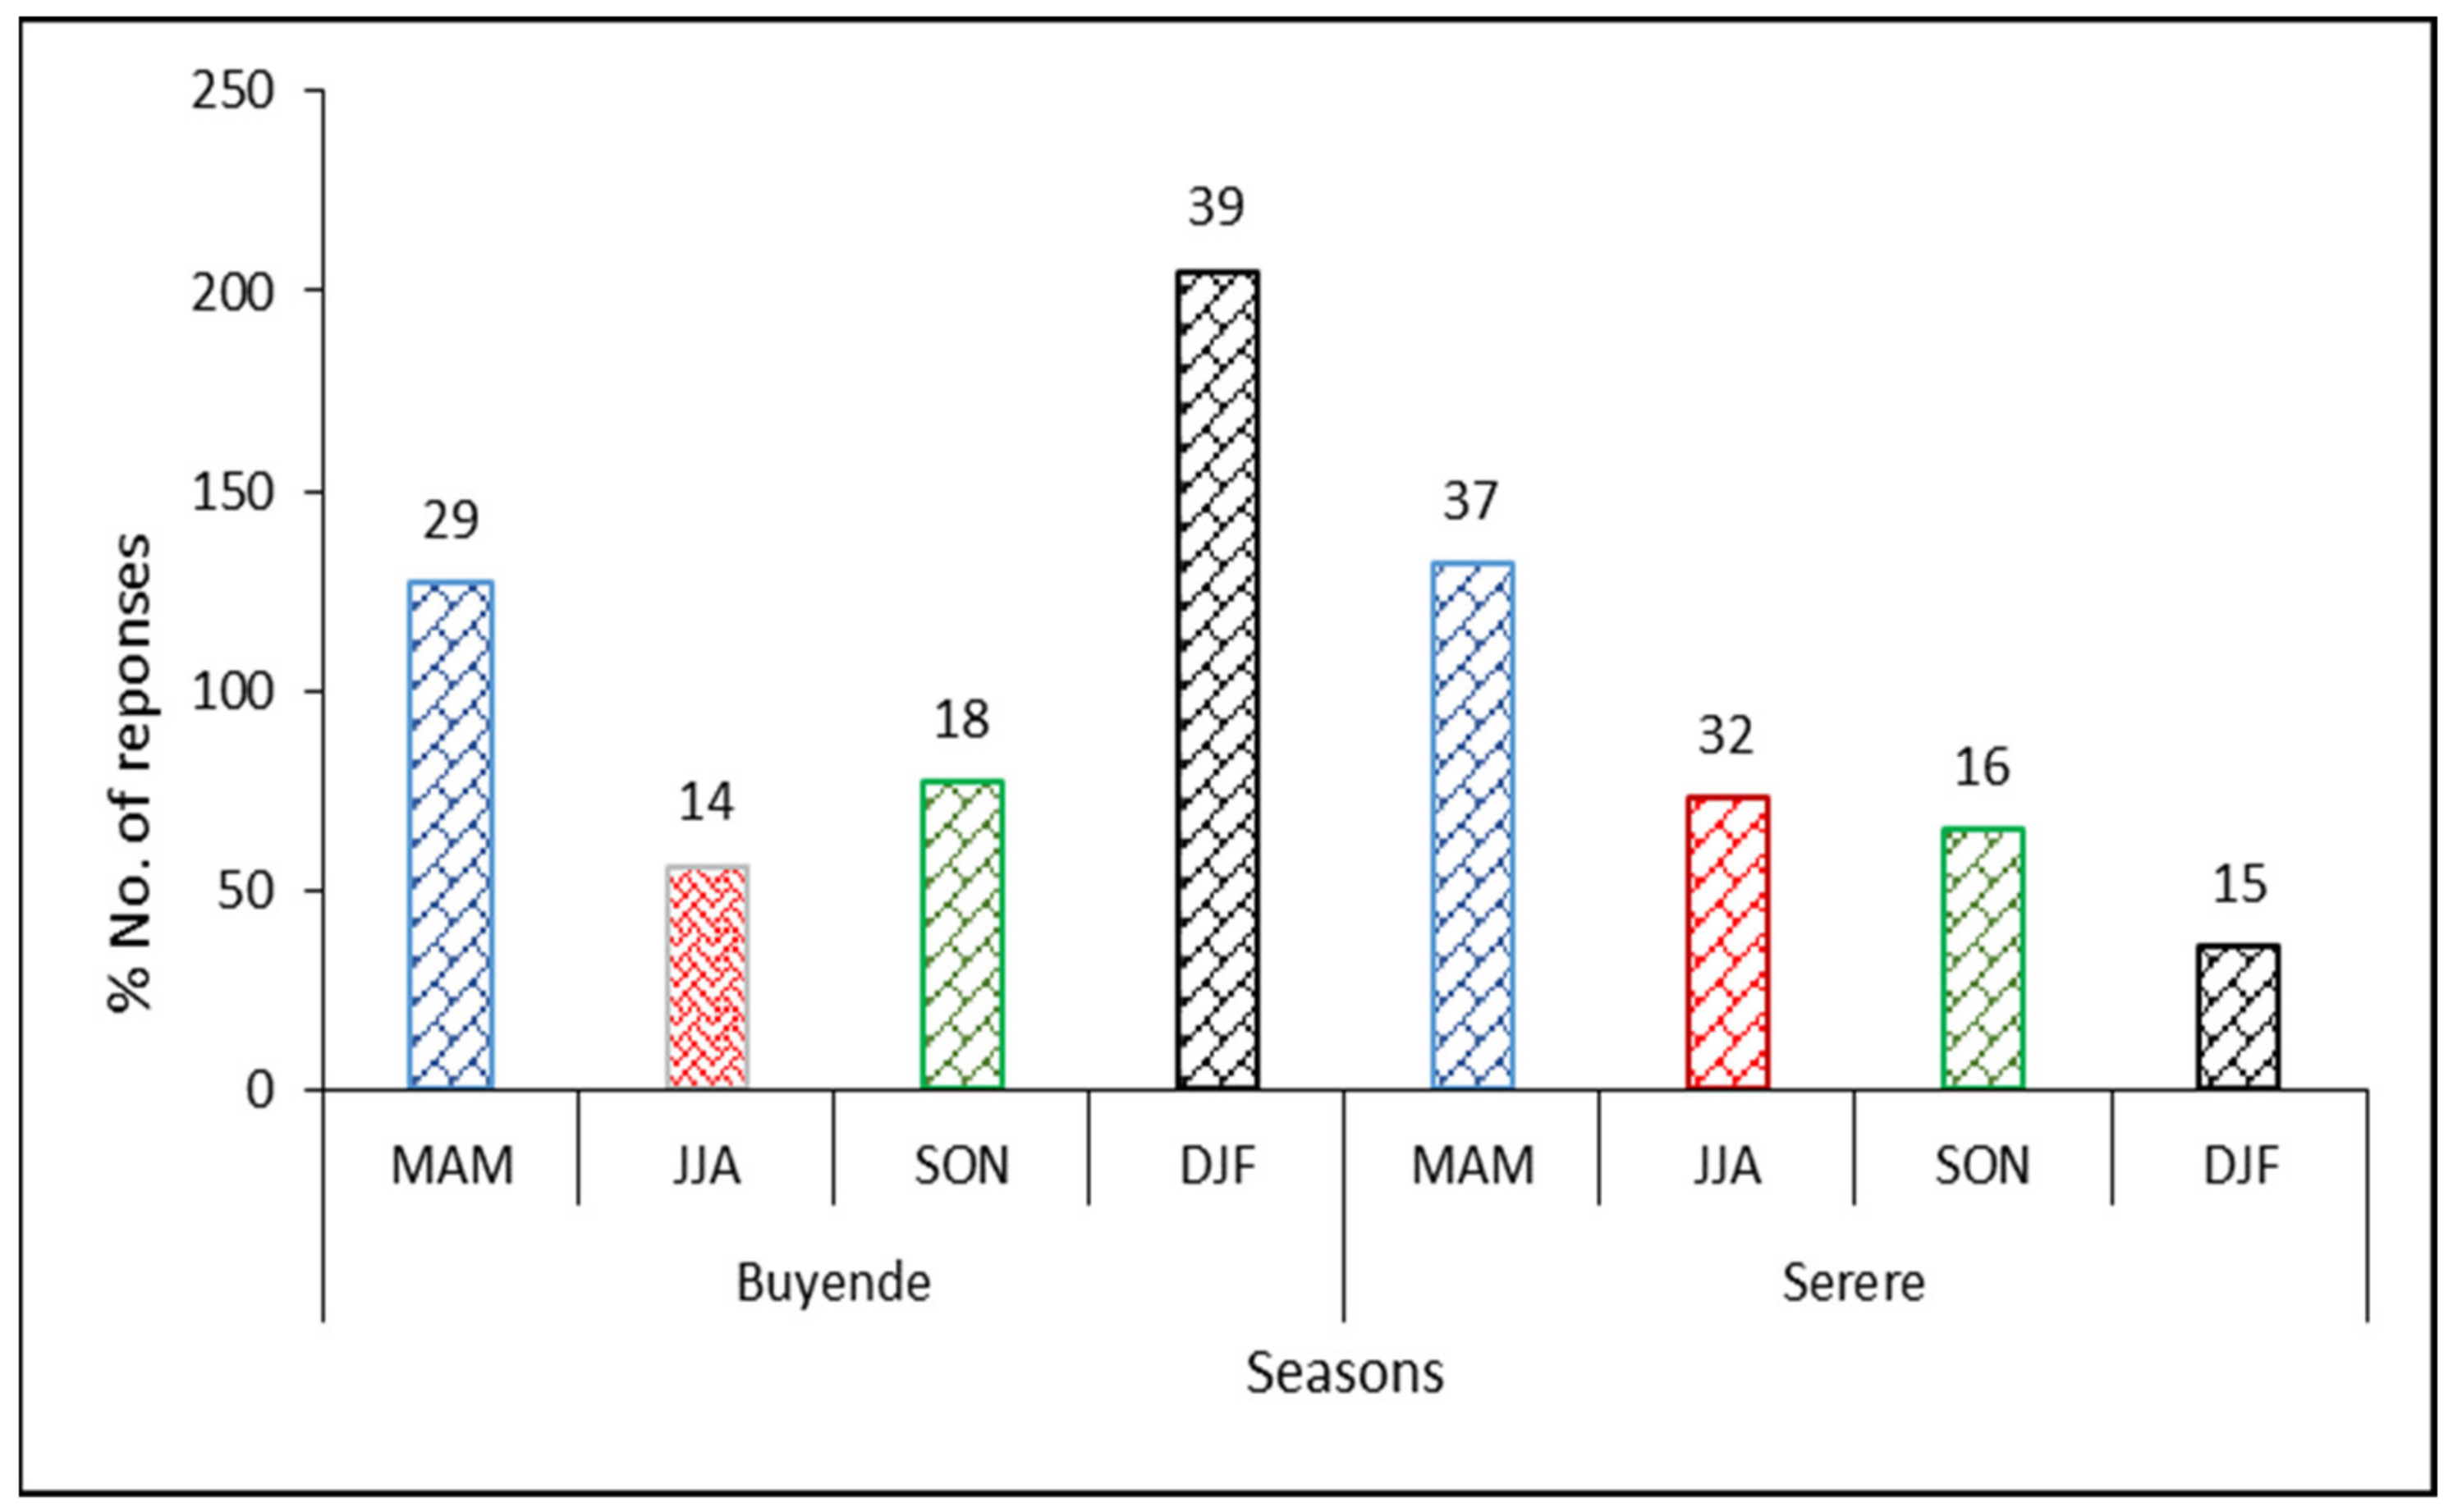
3.4. Variability in Seasons
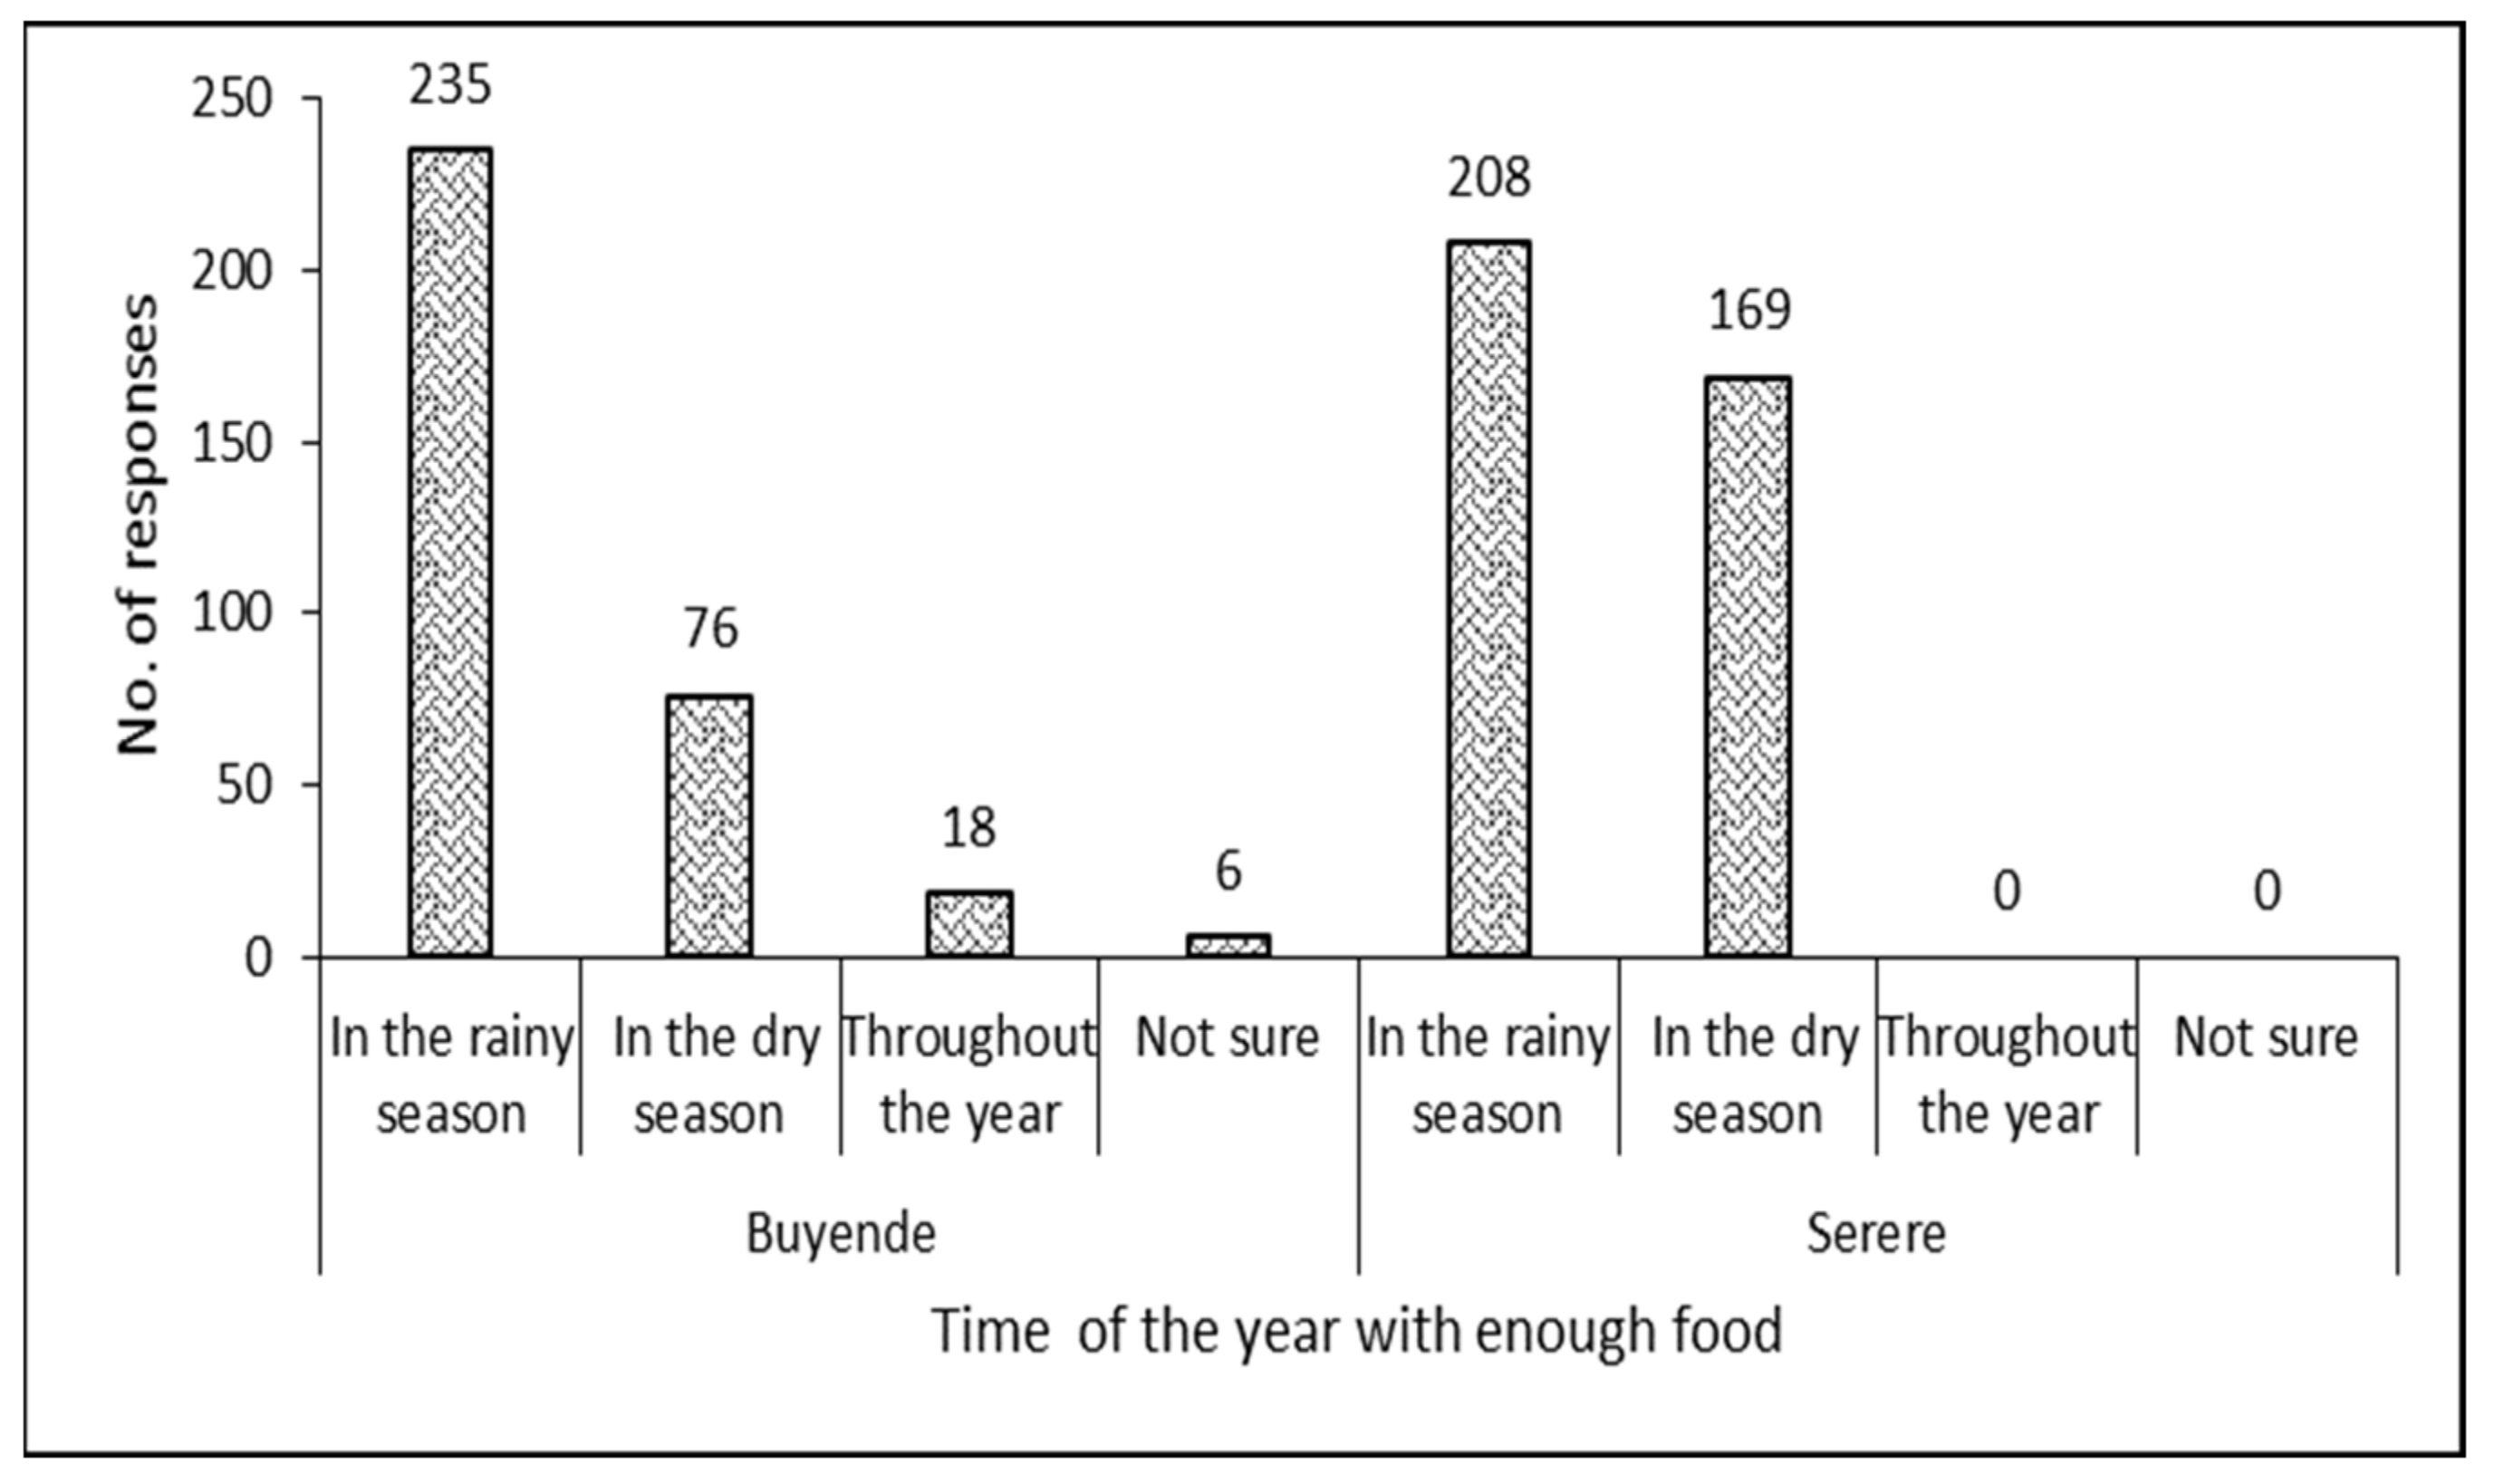
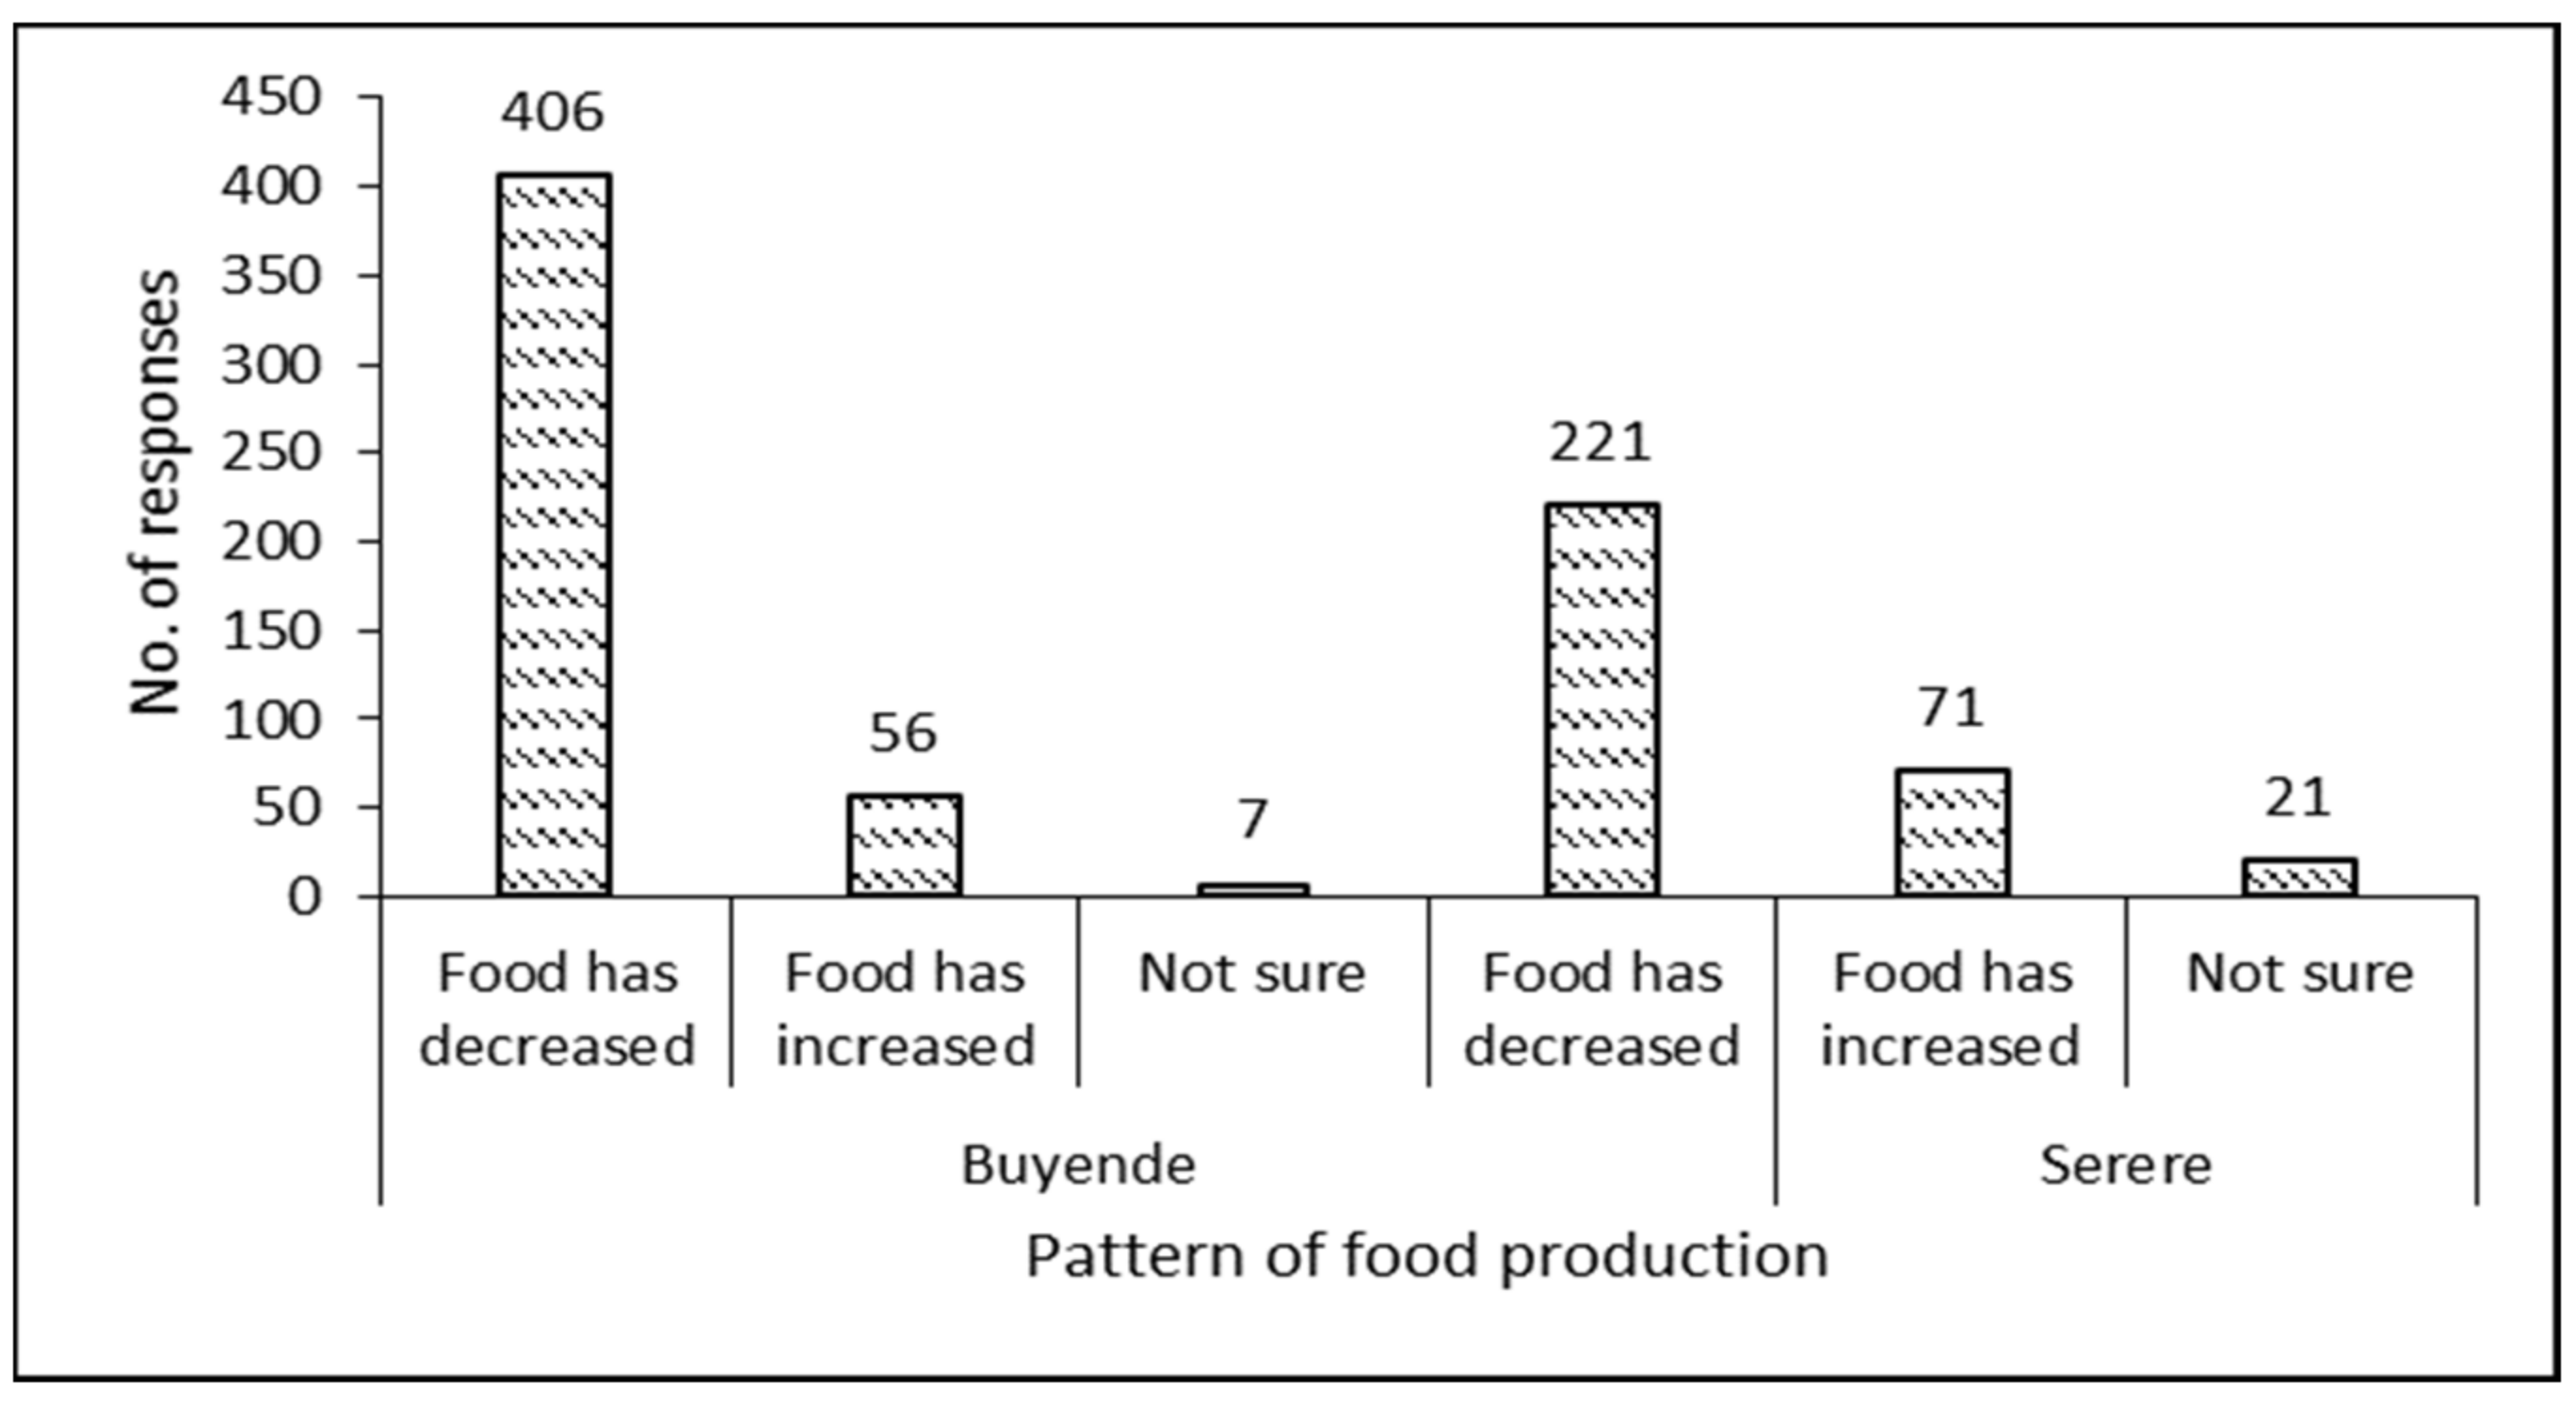
The March–May (MAM) rainfall season was reported to be more variable (37%), followed by the June–August (JJA) dry season (32%), September–November (SON) rainfall season (16%), and the December–February (DJF) dry season (15%) (See Figure 9). However, in the Buyende district (see Figure 9), the DJF season was reported to be the most variable (39%), followed by the MAM (29%), SON (18%), and JJA seasons (14%).

3.5. Food Security

In order to understand if the communities were food secure, the data on major crops grown, crop uses, times of the year households have enough food, patterns of food production in the past five years, current major meals, and past major meals were used to assess food security status in both the Serere and Buyende districts. Results (see Table 5) show that cassava (19.5%) is the major crop grown in both districts, followed by maize (18.5%), sweet potatoes (17.4%), groundnuts (8.8%), and the minor grown crop is rice (1.8%). In respect to crop uses (see Table 6), sweet potatoes emerged to be the major food crop (26.6%), followed by cassava (17.1%), maize (11.4%), beans and ground nuts (11.1%), and rice (0.8%) as the least used food crop, while maize is considered to be the major cash crop (23.8%) across the two districts, followed by sorghum (19.3%), millet (17.9%), cassava (17.1%), with banana and vegetables (0.9% each) as the minor cash crops grown in the two district (see Table 6).
Figure 10 shows that across the two districts, the major time of the year with enough food is during the rainy season (72%) followed by the dry season (24%), throughout the year (3%), and not sure with (1%). Furthermore, 74% of respondents reported that food production across the two districts (Serere and Buyende) in the past five years has greatly decreased, and only 24% reported that over the past five years food production has been increasing (See Figure 11). Results shown in Table 7 indicate that the number of respondents eating three meals per day has decreased from 59.7% in the past five years to 43.6% in the present moment, while the number of respondents eating two meals per day has increased from 35.9% in the past five years to 52.1% in the current situation (See Table 7).

3.6. Coping Strategies

3.6.1. Coping Mechanisms Employed by Communities

Communities in the two districts employed various ways of coping with the different impacts of climate change and climate variability. These coping mechanisms have been applied differently considering the changes in rainfall availability, changes in food availability, and crop failures. The majority of respondents across the two districts opt to use the growing of drought-resistant crops (32.7%), followed by rearing drought-resistant livestock breeds (26.1%), and eating fewer meals a day (14.5%) (See Table 8). For changes in food availability and crop failures, the majority of the respondents opt to buy food (34.3%) (See Table 9).

3.6.2. Effectiveness of Coping Mechanisms

A Chi-square test was performed to test for the effectiveness of the coping mechanisms employed to overcome the effects of climate change and climate variations across the two districts (Serere and Buyende). The results (Table 10) indicate that the most effective coping mechanisms that are significantly associated with the respondents’ sociodemographic characteristics are: growing drought-resistant crops, having fewer meals a day, growing a variety of crops, and early planting and harvesting.

4. Discussion

In both districts in the different agro-ecological zones, less than 50% (Serere, 49.3% and Buyende, 13.3%) of the respondents had formal education up to at least secondary level. There were also female- and child-headed households. This is of great importance to the two districts, as the prevalence of food insecurity is higher among female- and child-headed households, possibly because they frequently have less access to adult labor and may lack the means to seek employment away from their families. Additionally, there is less access to and control of assets (see Figure 4 and Figure 5) by women and children, which may also explain why female- and child-headed households are more vulnerable to food insecurity. Generally, female- and child-headed households are more vulnerable to food insecurity because of their tighter time schedules and income constraints.
Low education levels were reported in the two districts. This implies that many households are restricted to earning income from agricultural activities and blue-collar jobs. Furthermore, low levels of education limit the use of smart farming practices that can help communities cope with the effects of climate change. This leaves many households prone to crop failure since they mainly rely on a few coping mechanisms, which often cater for specific risks. It is therefore important for government to sensitize communities to climate change and invest in promoting smart farming methods amongst farmers. This will enable farmers to grow off-season crops and therefore improve food security.
The main crops grown in the area are mostly for household food supply, and provide low incomes to the respective households which opt for selling off some of the crops. These crops can only raise a reasonable amount of income if stored and sold during the period of scarcity. This may not happen, however, since many households are unable to adopt the costly food conservation mechanisms required. Hence, the low incomes generated during the crop seasons may not be able to provide the food requirements during the time of scarcity. We recommend that the government of Uganda train farmers on food conservation and promote market identification to limit farmer exploitation.
From the results, both districts mainly rely on growing crops for food and income (for example, the 41.2% of females and 42.4% of males from Serere, where their major source of income is from selling animal, poultry, and food crops, and likewise the 39.9% of females and 36% of males from Buyende). Food access is based on the ability to procure food. Buying food, especially for a population which relies predominantly upon agriculture for their income generation, is not practical. This is because the little which is produced is divided between food supply for the households and for sale. This is the same reason many families have resorted to the reduction of the number of meals eaten in a day, indicating that they are food insecure. The fact that these communities mainly rely on rain-fed subsistence agriculture means that they are very likely to incur losses in case of harsh climatic conditions. It is therefore of paramount importance to strengthen the policy of providing early warning of major climate events and weather forecasting, weather-based crop insurance, and disaster risk planning to address the direct impacts of climate change.
The limited access to assets by many women means that they are less likely to cope with the effects of climate change. For instance, bicycles used to access distant water sources are mainly owned by men. This implies that whenever men are away from home, women may not be able to effectively access water. It is therefore important to empower rural women to improve their financial standing in order to be able to cope with the challenges.
With the growing population, there are also limitations to increasing land under cultivation, a method which can address the problem of low yields. This has therefore led many households to use the same pieces of land continuously, further reducing the fertility of the soil. The high pressure exerted by the growing populations also makes the limited available land a resource for competition, which leave some households without land due to their inability to afford the land because of the growing costs. Such households are left to depend on renting land each season. This land tenure system limits the respective households to planting short-term crops, which further depletes the fertility of the land. This leads to lower crop yields and heightens the risks of food insecurity. It is therefore important to sensitize communities to methods of utilizing the little land available to maintain productivity. This may be in form of identifying market demands and adopting the cultivation of high value crops.
Communities reported their ability to cope with the impacts of climate change and climate variability in different ways. For instance, in order to cope with changes in rainfall availability, changes in food availability, and crop failures, a majority of respondents across the two districts reported that they rely on growing drought-resistant crops (32.7%). This is followed by rearing drought-resistant livestock breeds (26.1%) and reducing the number of meals they eat in a day (14.5%). With regard to changes in food availability and crop failures, a majority of respondents buy food (34.3%). However, given the limited levels of education among communities and their high reliance on agriculture, many risk becoming food insecure. This is because many are unable to afford to buy food. While the drought-resistant crops have been mainly used to cope, accessibility to a range of varieties is subject to government interventions, who mainly conduct the research to produce new drought-resistant crops. These varieties further come at an extra cost, which many households may not be able to afford in large quantities. We recommend that the government of Uganda subsidizes the purchase of drought-resistant varieties to improve access.

5. Conclusions and Recommendations

The changing climate has negatively impacted food systems, affecting rainfall patterns and leading to drought or flooding, among other negative effects. This study examined the community’s ability to cope with food insecurity due to the changing climate in the Serere and Buyende districts of Uganda. We administered 806 questionnaires to households, seeking to assess household resources, the effects of climate change to households, and the coping mechanisms employed to reduce the impact of climate change on food security. We found that many households are either food insecure or at risk of food insecurity. This was manifested through a reduction in the number of meals per day respondents ate in order to save on food consumption. Furthermore, many households are heavily reliant upon crop production, which is often negatively affected by climate change. Moreover, many of these households were limited by low education levels and low incomes from efficiently adopting the coping mechanisms. It is therefore important to enhance government interventions to enable low-income earners to cope with the effects of climate change on agriculture, which would improve food security among communities by revising policies that promote each community’s ability to cope with the effects of climate change, providing advisory and sensitization services, weather forecasting, and subsidies, among others. These will increase the number of households who are able to maintain food production even under the effects of climate change.

Author Contributions

This study was conceptualized by I.M. (Isaac Mugume); The design and administering of data collection instruments was done by C.B., R.K., S.N., F.N., R.I.O. and P.W.; The introduction was written by M.N. and J.S.-O.; Presentation of the results was done by A.N., A.M. and I.M. (Irene Musiime); B.A.O. contributed on discussing the results including writing the conclusion. All authors have read and agreed to the published version of the manuscript.

Funding

This research was funded by the Government of Uganda through the Research and Innovation Fund (RIF), Makerere University.

Institutional Review Board Statement

Not applicable.

Informed Consent Statement

Informed consent was obtained from all participants involved in the study.

Data Availability Statement

The data used in this study can be made available on request by the Research and Innovation Fund, Makerere University ([email protected]).

Acknowledgments

We acknowledge the support of all respondents and village heads in the Serere and Buyende districts.

Conflicts of Interest

The authors declare no conflict of interest.

References

  1. FAO. Food Security Indicators; FAO Statistics: Rome, Italy, 2019. [Google Scholar]
  2. World Food Summit. Rome Declaration on World Food Security and World Food Summit Plan of Action Rome Declaration on World Food Security; World Food Summit: Rome, Italy, 1996. [Google Scholar]
  3. Hall, C.; Dawson, T.P.; Macdiarmid, J.I.; Matthews, R.B.; Smith, P. The impact of population growth and climate change on food security in Africa: Looking ahead to 2050. Int. J. Agric. Sustain. 2017, 15, 124–135. [Google Scholar] [CrossRef] [Green Version]
  4. WHO. The state of food security and nutrition in the world 2019: Safeguarding against economic slowdowns and downturns. Food Agric. Org. 2019, 2019, 3–25. [Google Scholar]
  5. Wossen, T.; Berger, T.; Haile, M.G.; Troost, C. Impacts of climate variability and food price volatility on household income and food security of farm households in East and West Africa. Agric. Syst. 2018, 163, 7–15. [Google Scholar] [CrossRef]
  6. Tegebu, F.N. Climate Change-Induced Migration in the Horn of Africa; University of the Witwatersrand: Johannesburg, South Africa, 2020. [Google Scholar]
  7. Antonelli, C.; Coromaldi, M.; Dasgupta, S.; Emmerling, J.; Shayegh, S. Climate impacts on nutrition and labor supply disentangled—An analysis for rural areas of Uganda. Environ. Dev. Econ. 2020, 26, 512–537. [Google Scholar] [CrossRef]
  8. Tacoli, C. Food (in) security in rapidly urbanising, low-income contexts. Int. J. Environ. Res. Public Health 2017, 14, 1554. [Google Scholar] [CrossRef] [PubMed] [Green Version]
  9. Stites, E. The Only Place to Do This is in Town: Experiences of Rural–Urban Migration in Northern Karamoja, Uganda. Nomad. People 2020, 24, 32–55. [Google Scholar] [CrossRef]
  10. Wichern, J.; van Wijk, M.T.; Descheemaeker, K.; Frelat, R.; van Asten, P.J.A.; Giller, K.E. Food availability and livelihood strategies among rural households across Uganda. Food Secur. 2017, 9, 1385–1403. [Google Scholar] [CrossRef] [Green Version]
  11. Spires, M.; Berggreen-Clausen, A.; Kasujja, F.X.; Delobelle, P.; Puoane, T.; Sanders, D.; Daivadanam, M. Snapshots of urban and rural food environments: EPOCH-based mapping in a high-, middle-, and low-income country from a non-communicable disease perspective. Nutrients 2020, 12, 484. [Google Scholar] [CrossRef] [PubMed] [Green Version]
  12. Lunyolo, L.D.; Khalifa, M.; Ribbe, L. Assessing the interaction of land cover/land use dynamics, climate extremes and food systems in Uganda. Sci. Total. Environ. 2021, 753, 142549. [Google Scholar] [CrossRef] [PubMed]
  13. Nsubuga, F.W.; Rautenbach, H. Climate change and variability: A review of what is known and ought to be known for Uganda. Int. J. Clim. Chang. Strateg. Manag. 2018, 10, 752–771. [Google Scholar] [CrossRef] [Green Version]
  14. Shi, C.; Jiang, Z.H.; Chen, W.L.; Li, L. Changes in temperature extremes over China under 1.5 °C and 2 °C global warming targets. Adv. Clim. Chang. Res. 2018, 9, 120–129. [Google Scholar] [CrossRef]
  15. King, A.D.; Harrington, L.J. The Inequality of Climate Change From 1.5 to 2 °C of Global Warming. Geophys. Res. Lett. 2018, 45, 5030–5033. [Google Scholar] [CrossRef]
  16. Mubiru, D.N.; Radeny, M.; Kyazze, F.B.; Zziwa, A.; Lwasa, J.; Kinyangi, J.; Mungai, C. Climate trends, risks and coping strategies in smallholder farming systems in Uganda. Clim. Risk Manag. 2018, 22, 4–21. [Google Scholar] [CrossRef]
  17. Ozor, N.; Madukwe, M.; Enete, A.; Amaechina, E.; Onokala, P. Barriers to Climate Change Adaptation Among Farming Households of Southern Nigeria. J. Agric. Ext. 2011, 14, 114–124. [Google Scholar] [CrossRef]
  18. Cooper, S.J.; Wheeler, T. Rural household vulnerability to climate risk in Uganda. Reg. Environ. Chang. 2017, 17, 649–663. [Google Scholar] [CrossRef]
  19. Mechiche-Alami, A.; Yagoubi, J.; Nicholas, K.A. Agricultural land acquisitions unlikely to address the food security needs of African countries. World Dev. 2021, 141, 105384. [Google Scholar] [CrossRef]
  20. FAO. Climate Change in Africa: The Threat to Agriculture; Food and Agriculture Organization: Rome, Italy, 2009; p. 7. [Google Scholar]
  21. Wrigley-Asante, C.; Owusu, K.; Egyir, I.S.; Owiyo, T.M. Gender dimensions of climate change adaptation practices: The experiences of smallholder crop farmers in the transition zone of Ghana. African Geogr. Rev. 2019, 38, 126–139. [Google Scholar] [CrossRef]
  22. Bryan, E.; Bernier, Q.; Espinal, M.; Ringler, C. Making climate change adaptation programmes in sub-Saharan Africa more gender responsive: Insights from implementing organizations on the barriers and opportunities. Clim. Dev. 2018, 10, 417–431. [Google Scholar] [CrossRef]
  23. Alhassan, S.I.; Kuwornu, J.K.M.; Osei-Asare, Y.B. Gender dimension of vulnerability to climate change and variability. Int. J. Clim. Chang. Strateg. Manag. 2019, 11, 195–214. [Google Scholar] [CrossRef]
  24. Ngigi, M.W.; Mueller, U.; Birner, R. Gender differences in climate change adaptation strategies and participation in group-based approaches: An intra-household analysis from rural Kenya. Ecol. Econ. 2017, 138, 99–108. [Google Scholar] [CrossRef]
  25. Kristjanson, P.; Bryan, E.; Bernier, Q.; Twyman, J.; Meinzen-Dick, R.; Kieran, C.; Ringler, C.; Jost, C.; Doss, C. Addressing gender in agricultural research for development in the face of a changing climate: Where are we and where should we be going? Int. J. Agric. Sustain. 2017, 15, 482–500. [Google Scholar] [CrossRef]
  26. Eastin, J. Climate change and gender equality in developing states. World Dev. 2018, 107, 289–305. [Google Scholar] [CrossRef]
  27. Falco, C.; Donzelli, F.; Olper, A. Climate change, agriculture and migration: A survey. Sustainability 2018, 10, 1405. [Google Scholar] [CrossRef] [Green Version]
  28. Adaawen, S.; Rademacher-Schulz, C.; Schraven, B.; Segadlo, N. Drought, migration, and conflict in sub-Saharan Africa: What are the links and policy options? Curr. Dir. Water Scarcity Res. 2019, 2, 15–31. [Google Scholar]
  29. Ampaire, E.L.; Acosta, M.; Huyer, S.; Kigonya, R.; Muchunguzi, P.; Muna, R.; Jassogne, L. Gender in climate change, agriculture, and natural resource policies: Insights from East Africa. Clim. Chang. 2020, 158, 43–60. [Google Scholar] [CrossRef] [Green Version]
  30. Renner, J. New Power Structures and Shifted Governance Agendas Disrupting Climate Change Adaptation Developments in Kenya and Uganda. Sustainability 2020, 12, 2799. [Google Scholar] [CrossRef]
  31. Larochelle, C.; Alwang, J. Impacts of Improved Bean Varieties Adoption on Dietary Diversity and Food Security in Rwanda. Eur. J. Dev. Res. 2021, 1–23. [Google Scholar] [CrossRef]
  32. Mubiru, D.N.; Kyazze, F.B.; Radeny, M.; Zziwa, A.; Lwasa, J.; Kinyangi, J. Climatic Trends, Risk Perceptions and Coping Strategies of Smallholder Farmers in Rural Uganda; CGIAR Research Program on Climate Change, Agriculture and Food Security: Copenhagen, Denmark, 2015. [Google Scholar]
  33. Ciscar, J.-C.; Fisher-Vanden, K.; Lobell, D.B. Synthesis and review: An inter-method comparison of climate change impacts on agriculture. Environ. Res. Lett. 2018, 13, 70401. [Google Scholar] [CrossRef]
  34. Feyisa, M.N. Determinants of food insecurity among rural households of South Western Ethiopia. J. Dev. Agric. Econ. 2018, 10, 404–412. [Google Scholar]
  35. Jamshidi, O.; Asadi, A.; Kalantari, K.; Azadi, H.; Scheffran, J. Vulnerability to climate change of smallholder farmers in the Hamadan province, Iran. Clim. Risk Manag. 2019, 23, 146–159. [Google Scholar] [CrossRef]
  36. Steiner, J.L.; Briske, D.D.; Brown, D.P.; Rottler, C.M. Vulnerability of Southern Plains agriculture to climate change. Clim. Chang. 2018, 146, 201–218. [Google Scholar] [CrossRef] [Green Version]
  37. Maguza-Tembo, F.; Mangison, J.; Edris, A.K.; Kenamu, E. Determinants of adoption of multiple climate change adaptation strategies in Southern Malawi: An ordered probit analysis. J. Dev. Agric. Econ. 2017, 9, 1–7. [Google Scholar]
  38. Agidew, A.A.; Singh, K.N. Determinants of food insecurity in the rural farm households in South Wollo Zone of Ethiopia: The case of the Teleyayen sub-watershed. Agric. Food Econ. 2018, 6, 1–23. [Google Scholar] [CrossRef]
  39. Oriangi, G.; Bamutaze, Y.; Mukwaya, P.I.; Musali, P.; Baldassarre, G.D.; Pilesjö, P. Testing the Proposed Municipality Resilience Index to Climate Change Shocks and Stresses in Mbale Municipality in Eastern Uganda. Am. J. Clim. Change 2019, 8, 520–543. [Google Scholar] [CrossRef] [Green Version]
  40. Adam, A.M. Sample size determination in survey research. J. Sci. Res. Rep. 2020, 26, 90–97. [Google Scholar] [CrossRef]
  41. Yamane, I.; Sato, K. Effect of temperature on the decomposition of organic substances in flooded soil. Soil Sci. Plant Nutr. 1967, 13, 94–100. [Google Scholar] [CrossRef]
  42. Handcock, M.S.; Gile, K.J. Comment: On the concept of snowball sampling. Sociol. Methodol. 2011, 41, 367–371. [Google Scholar] [CrossRef] [Green Version]
  43. Biernacki, P.; Waldorf, D. Snowball sampling: Problems and techniques of chain referral sampling. Sociol. Methods Res. 1981, 10, 141–163. [Google Scholar] [CrossRef]
  44. Etikan, I.; Alkassim, R.; Abubakar, S. Comparison of snowball sampling and sequential sampling technique. Biom. Biostat. Int. J. 2016, 3, 164. [Google Scholar]
  45. Goodman, L.A. Snowball sampling. Ann. Math. Stat. 1961, 32, 148–170. [Google Scholar] [CrossRef]
  46. Browne, K. Snowball sampling: Using social networks to research non-heterosexual women. Int. J. Soc. Res. Methodol. 2005, 8, 47–60. [Google Scholar] [CrossRef]
  47. Ghaljaie, F.; Naderifar, M.; Goli, H. Snowball sampling: A purposeful method of sampling in qualitative research. Strides Dev. Med. Educ. 2017, 14. [Google Scholar] [CrossRef] [Green Version]
  48. Cohen, N.; Arieli, T. Field research in conflict environments: Methodological challenges and snowball sampling. J. Peace Res. 2011, 48, 423–435. [Google Scholar] [CrossRef]
  49. Emojong, J. Influence of Competence-Based Education Approach on Employee Productivity and Efficiency: A Case of Uganda Revenue Authority Education Programs. Ugandan J. Manag. Public Policy Stud. 2018, 15, 54–76. [Google Scholar]
  50. Agwot, R.K. Contract Management and Service Delivery in Local Governments in Uganda: A Case of Serere District Local Government. Ph.D. Thesis, Uganda Management Institute, Kampala, Uganda, 2018. [Google Scholar]
  51. Partey, S.T.; Dakorah, A.D.; Zougmoré, R.B.; Ouédraogo, M.; Nyasimi, M.; Nikoi, G.K.; Huyer, S. Gender and climate risk management: Evidence of climate information use in Ghana. Clim. Chang. 2020, 158, 61–75. [Google Scholar] [CrossRef] [Green Version]
  52. Uganda Bureau of Statistics. The National Population and Housing Census 2014—Area Specific Profile Series. 2016. Available online: https://www.ubos.org/wp-content/uploads/publications/03_20182014_National_Census_Main_Report.pdf (accessed on 30 September 2021).
  53. Mugume, I.; Semyalo, R.; Wasswa, P.; Ngailo, T.; Odongo, I.R.; Lunyolo, J.; Tao, S. Community views on water demands under a changing climate: The case of River Mpanga Water Catchment, Western Uganda. Afr. J. Environ. Sci. Technol. 2021, 15, 371–378. [Google Scholar]
  54. Ratna, S.B.; Ratnam, J.V.; Behera, S.K.; Rautenbach, C.D.; Ndarana, T.; Takahashi, K.; Yamagata, T. Performance assessment of three convective parameterization schemes in WRF for downscaling summer rainfall over South Africa. Clim. Dyn. 2014, 42, 2931–2953. [Google Scholar] [CrossRef] [Green Version]
  55. Bryman, A. Social Research Methods; Oxford Univiversity Press: Oxford, UK, 2016. [Google Scholar]
Figure 1. Theoretical framework that guided this study, which assesses the ability of communities to cope with food insecurity due to climate change.
Sustainability 13 11047 g001
Figure 2. Map of the Butene District.
Sustainability 13 11047 g002
Figure 3. Map of the Serere District.
Sustainability 13 11047 g003
Figure 4. Control of and access to household assets for the Serere district.
Sustainability 13 11047 g004
Figure 5. Control of and access to household assets for the Buyende district.
Sustainability 13 11047 g005
Figure 6. Access to water sources in the Buyende district.
Sustainability 13 11047 g006
Figure 7. Access to water sources in the Serere district.
Sustainability 13 11047 g007
Figure 8. Household sources of income for both the Serere and Buyende districts.
Sustainability 13 11047 g008
Figure 9. Variations of seasons in the Serere district and the Buyende district.
Sustainability 13 11047 g009
Figure 10. Time of the year when food is enough.
Sustainability 13 11047 g010
Figure 11. Pattern of food production in the last five years.
Sustainability 13 11047 g011
Table 1. Serere respondents’ characteristics.
VariableFrequency (n = 400)%
Gender
Male20551.3
Female19548.7
Education level
None369
Primary16741.7
Secondary14536.3
Tertiary5213
Household Head type
Male-headed32180.3
Female-headed7218
Older person-headed20.5
Child-headed51.2
No. Household members (in years)
Below 1831327.4
18–2526022.8
26–3522119.4
36–5018916.5
Above 5015913.9
Table 2. Buyende respondents’ characteristics.
VariableFrequency (n = 406)%
Gender
Male20350
Female20350
Education level
None8821.7
Primary26465
Secondary5313.1
Tertiary10.2
Household Head type
Male headed33682.8
Female headed6215.3
Older person headed61.5
Child headed20.5
No. Household members (in years)
Below 1837336.1
18–2523422.6
26–3519318.7
36–5013813.3
Above 50969.3
Table 3. Perceptions of climate change in the Serere district.
Sociodemographic CharacteristicsPerceptions
Aware of Climate
Change/Variability
Change (Rise)
in Temperature
Changes in
Rainfall Intensity
Changes in
Rainfall Days
Changes (Increase) in Lightning Days
X2df.Sig.X2df.Sig.X2df.Sig.X2df.Sig.X2df.Sig.
Sex8.04020.018 *56.99220.000 *146.18720.000 *177.07120.000 *286110.091
Marital status2.15180.97611.80880.1608.17080.4178.27180.4075.54440.236
Age of respondent7.13580.5224.23380.8355.65980.6857.97680.4365.75540.218
Education level3.13060.7927.76560.25615.53760.016 *13.91160.031 *1.49130.684
Household head type0.75580.99911.76480.16223.63080.003 *24.07280.002 *0.73440.947
* Significant at 95%.
Table 4. Perceptions of climate change in the Buyende district.
Sociodemographic CharacteristicsPerceptions
Aware of Climate
Change/Variability
Change (Rise)
in Temperature
Changes in
Rainfall Intensity
Changes in
Rainfall Days
Changes (Increase) in Lightning Days
X2df.Sig.X2df.Sig.X2df.Sig.X2df.Sig.X2df.Sig.
Sex0.49010.48428.78610.000 *0.01310.90912.97010.000 *48.42020.000 *
Marital status1.46930.6891.89630.5942.78730.4264.10930.2502.37560.882
Age of respondent2.33060.8875.79660.4463.27860.77312.45860.05217.272120.140
Education level2.74330.4332.76530.4294.49330.2135.51430.1385.26160.511
Household head type1.68230.6411.87230.5991.29030.7312.79130.4251.44160.963
* Significant at 95%.
Table 5. Main crops grown.
Type of Crop(%)
Banana3.8
Cassava19.5
Sweet potatoes17.4
Beans7.1
Maize18.5
Millet8.7
Sorghum8.6
Ground nuts8.8
Simsim3.9
Rice1.8
Vegetables1.9
Total100
Table 6. Crop use.
Table 6. Crop use.
Type of CropUse (%)
Food CropCash Crop
Banana5.60.9
Cassava17.117.1
Sweet potatoes26.62.2
Beans11.12.2
Maize11.423.8
Millet5.417.9
Sorghum5.419.3
Ground nuts11.13.6
Simsim2.010.3
Rice0.81.8
Vegetables3.50.9
Total100100
Table 7. Patterns of meals.
No. of Meals per DayCurrent (%)Past 5 Years (%)
Three meals43.659.7
Two meals52.135.9
One meal2.73.1
None1.61.3
Total100100
Table 8. Coping with changes in rainfall availability.
StrategyPercent (%)
Settling down with family/reduced nomadism13.5
Growing drought-resistant crops32.7
Using drought-resistant livestock breeds26.1
Having less/fewer meals a day14.5
Nothing/not sure/just look on13.2
Total100
Table 9. Coping with seasonal changes in food availability.
Percent (%)
Buying food (e.g., beans and maize flour)34.3
Settling down with family/reduced nomadism7.5
Growing crops16.7
Increased production19.6
Having less/fewer meals a day15.9
Nothing/not sure/just look on6.1
Total100
Table 10. Effectiveness of the coping mechanisms.
Coping MechanismX2df.Sig.
Settling down with family/reduced nomadism2.04960.915
Growing drought resistant crops74.444380.000 *
Using drought resistant livestock breeds6.75380.564
Having less/fewer meals a day152.979360.000 *
Nothing/not sure/just look on7.46160.280
Buying food (e.g., beans and maize flour)8.38380.397
Growing a variety of crops93.416400.000 *
Early planting and harvesting160.561460.000 *
Using improved or resistant varieties of crops10.45680.234
* Significant at 95%.
Publisher’s Note: MDPI stays neutral with regard to jurisdictional claims in published maps and institutional affiliations.

