1. Introduction
Recently, human-powered electric vehicles, such as electric bicycles, kick-scooters, and roller skates, have been widely and increasingly used due to their environmental friendliness. The dynamic performance of electric bicycles, including efficiency, driving range, etc., is an important characteristic, and efforts have been made to accurately calculate and improve these qualities. In general, efficiency is measured on a chassis dynamometer with a full vehicle subject to a selected test-driving cycle, such as the World Motorcycle Test Cycle (WMTC) [
1], thus making it possible to predict efficiency after a full vehicle is available for testing. In order to predict the efficiency of electric bicycles at the design stage, even when a full vehicle is not available, this paper proposes a computational method for evaluating the efficiency of power train systems with consideration of the power train system components, as well as the chassis and road-load applied to the vehicle. For this purpose, the dynamic and kinematic characteristics of a drive motor, chassis, and various power transmission elements, such as the chain, belt, bearing, sprocket, etc., are taken into account.
To improve the performance of the battery, drive motor, and transmission systems [
2], the power, torque, efficiency, and driving speed and distance were used as characteristics of electric bicycles. The experimental results show that the drive motor required more power as the driving speed and load increased. To evaluate the performance of electric vehicles, the global positioning system, which can provide the motion information of vehicles, was used to estimate the power and energy consumption of electric vehicles [
3,
4,
5]. For example, Alvarez et al. [
4] estimated the energy consumption of electric bicycles, where the energy consumption is obtained by the power of driving resistance (rolling resistance, aerodynamic drag force, and gravitational force) based on the bicycle dynamics and the related time interval. The global positioning system records the driving data on time and positions, and the results show the average energy consumption of an electric bicycle is 0.99 ± 0.004 kWh/route (a route of approximately 6.5 km). Similarly, Penić et al. [
5] estimated the energy consumption based on the power of driving resistance and related time intervals using global positioning systems, and the estimated consumed power was compared with the measured generated power in the electric bicycle. It turns out that the efficiency of the transmission system, which is the ratio of the estimated consumed power to the measured generated power, is 80.28%. Kang et al. [
6] proposed a method for evaluating energy efficiency using a hardware-in-the-loop simulation for an electric bicycle driven on a motor dynamometer. The performance of the electric bicycles was computed for the simulation and field test. The energy efficiency of the electric bicycle in the field test was 18.7 Wh/km, and in the simulation, it was 17.8 Wh/km. Although most studies focus on the total efficiency of electric bicycle systems, the efficiency of transmission systems considering the individual components such as the chain drive system, bearing, etc. is ignored.
In Lodge et al. [
7], the power transmission efficiency of a chain drive system considering the friction loss and inertia loss was calculated. The results show that power transmission efficiency is mainly affected by mechanical characteristics, such as rotational speed, driving power, and gear ratio. To calculate the transmission efficiency of electric bicycles, Casteel et al. [
8] used a bicycle model that is driven by a center motor, and the power is transmitted to the rear wheel by belt devices. The efficiency of a power train is investigated with respect to rotational speeds and the engaged gear ratio. Although the transmission efficiency of the whole drive system was determined, the loss of efficiency due to the friction and inertia of the transmission components, such as the chain, bearing, etc., was not considered. In Spicer et al. [
9], to calculate bicycle chain drive efficiency, the frictional force for the inner link bushing and chain pin, as well as the sprocket tooth and link roller, was modeled by the product of normal force and the coefficient of friction. The frictional loss in the chain device assuming a steady-state condition (constant rotational speed and drive torque) was considered, and the transmission efficiency of the drive chain device was estimated, and its results were verified through experiment. In Burgess et al. [
10], the transmission efficiency of a drive chain for an electric bicycle was calculated by the ratio of power delivered to the wheel divided by the power provided to the sprocket. The efficiencies were compared between the drive motor at full power and half power, and the results demonstrate that the transmission efficiency with the full power of a motor is higher than with half of the power of a motor with increasing driving speeds of the bicycle. However, there was no experimental validation to support the results. In Zhang et al. [
11], the transmission efficiency of the chain drive system was calculated considering the sliding friction force of pin articulation and bush articulation, lateral offset due to the derailleur system, and damping force between two sprockets. The transmission efficiency was computed considering the rotational speed of the sprocket, lateral offset angle, and torque. Through an experiment, it is shown that calculated and measured results exhibit a good correlation. In order to evaluate the performance of electric bicycles experimentally, Hassan [
12] designed a chassis dynamometer that can measure mechanical power, torque, and speed, with an applied road-load. The designed chassis dynamometer can effectively measure the transmission efficiency of electric bicycles. In order to study the motion characteristics of the driving motor of electric bicycles, Arango et al. [
13] experimentally investigated the relationship between the torque and rotational speed of a drive motor. It was found that motor torque decreases with the increasing rotational speed in all power-assist levels.
Although many researchers have investigated transmission efficiency with regard to various power transmission elements, the evaluation of the efficiency of the whole power transmission system incorporating chassis and road-load applied to electric bicycles has been largely insufficient. In this study, a computational method for estimating the efficiency of electric bicycle power train systems consisting of an electric motor, gear, sprockets, and chain is presented. In order to calculate the efficiency of the power train, the dynamic relationship between driving motor torque and the road-load that is exerted on the rear wheel is derived considering kinematics, inertia effects, and friction losses of every element of the power transmission system. Meanwhile, the factors that influence the efficiency of electric bicycles due to friction losses, such as the transmission efficiency of the chain system and the bearing in the sprocket and wheel, are quantified. The formulation is validated through an experiment using a specially designed electric bicycle that measures driving torque and road-load, and a chassis dynamometer test that can provide road-load. Based on the formulation, the effects of various factors in the power train system that influence transmission efficiency are investigated.
3. Power Train Dynamics Formulation
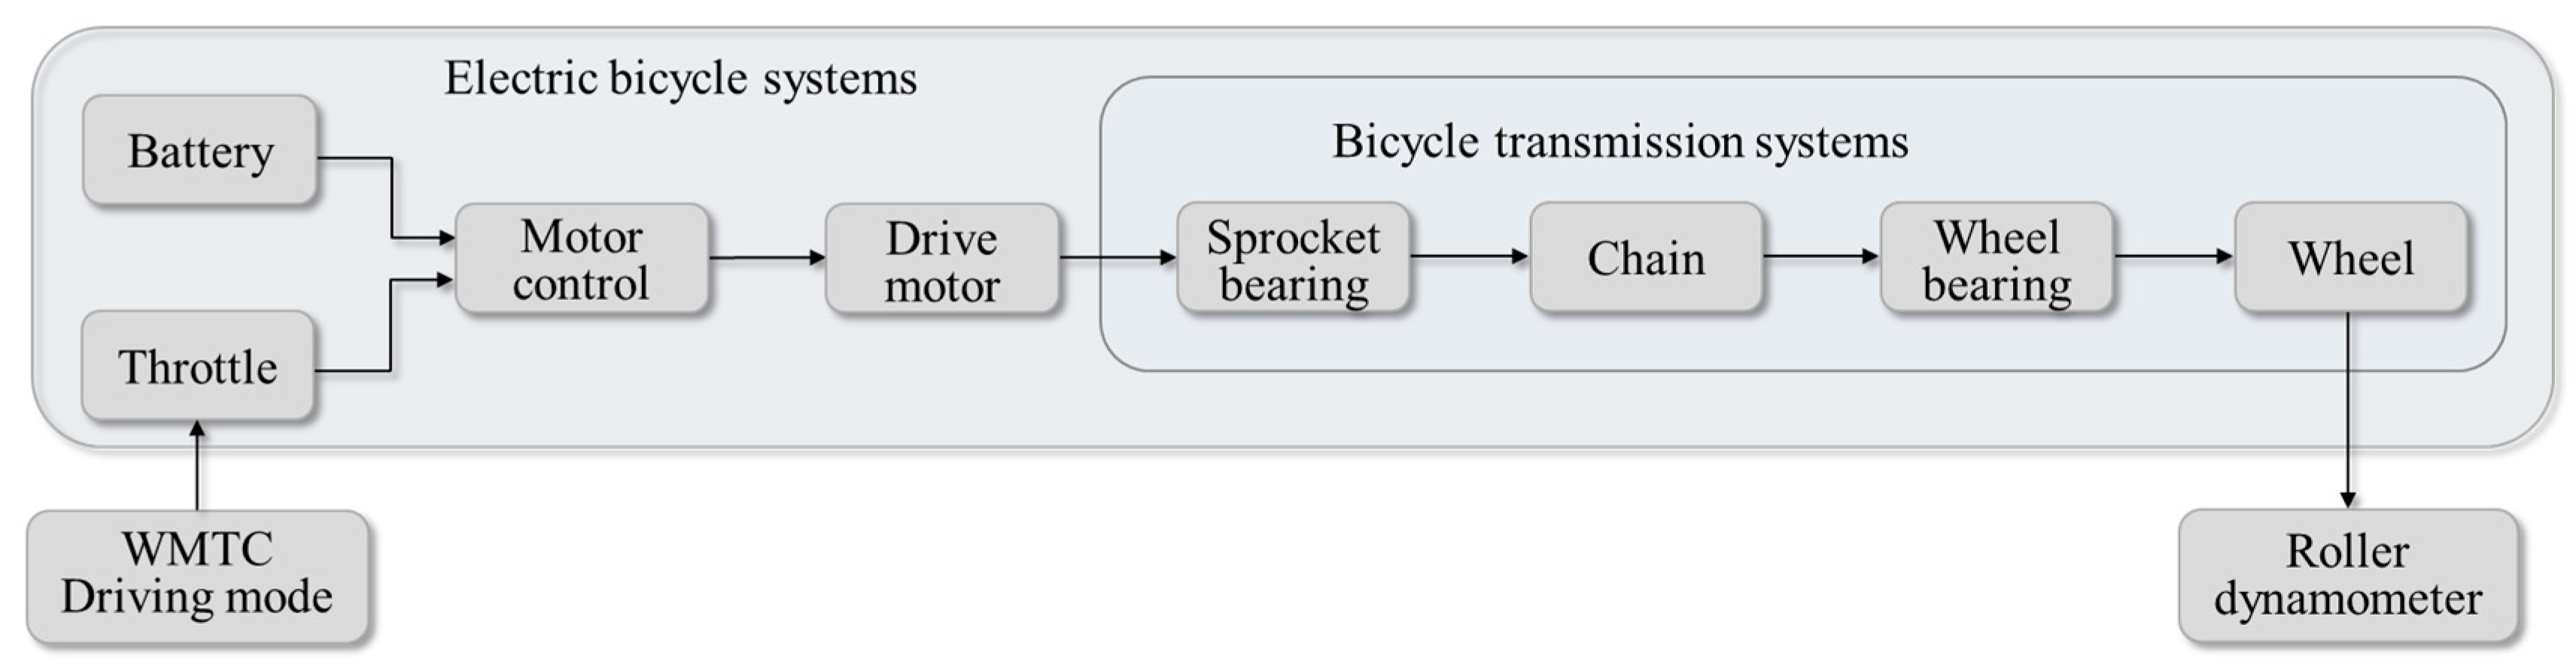
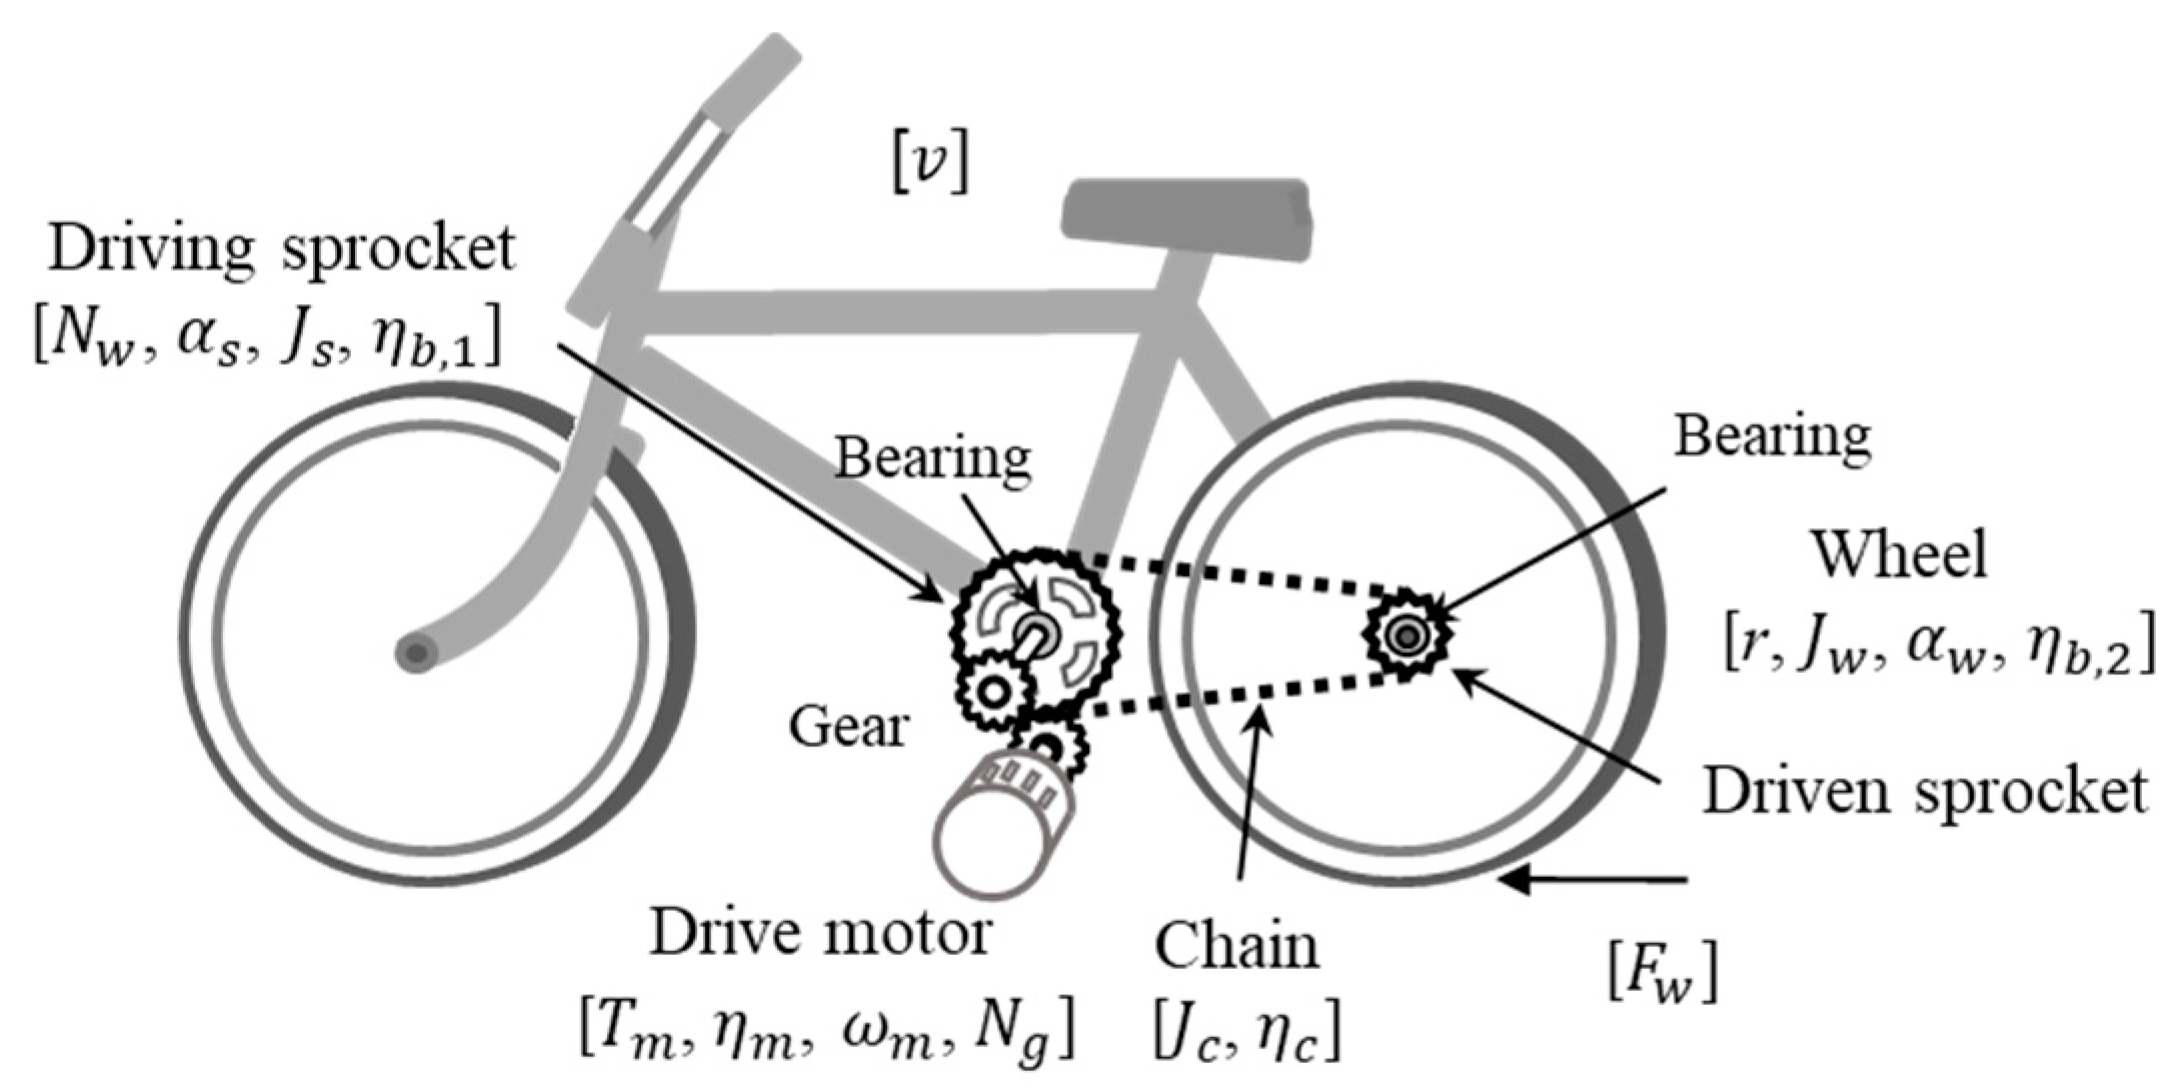
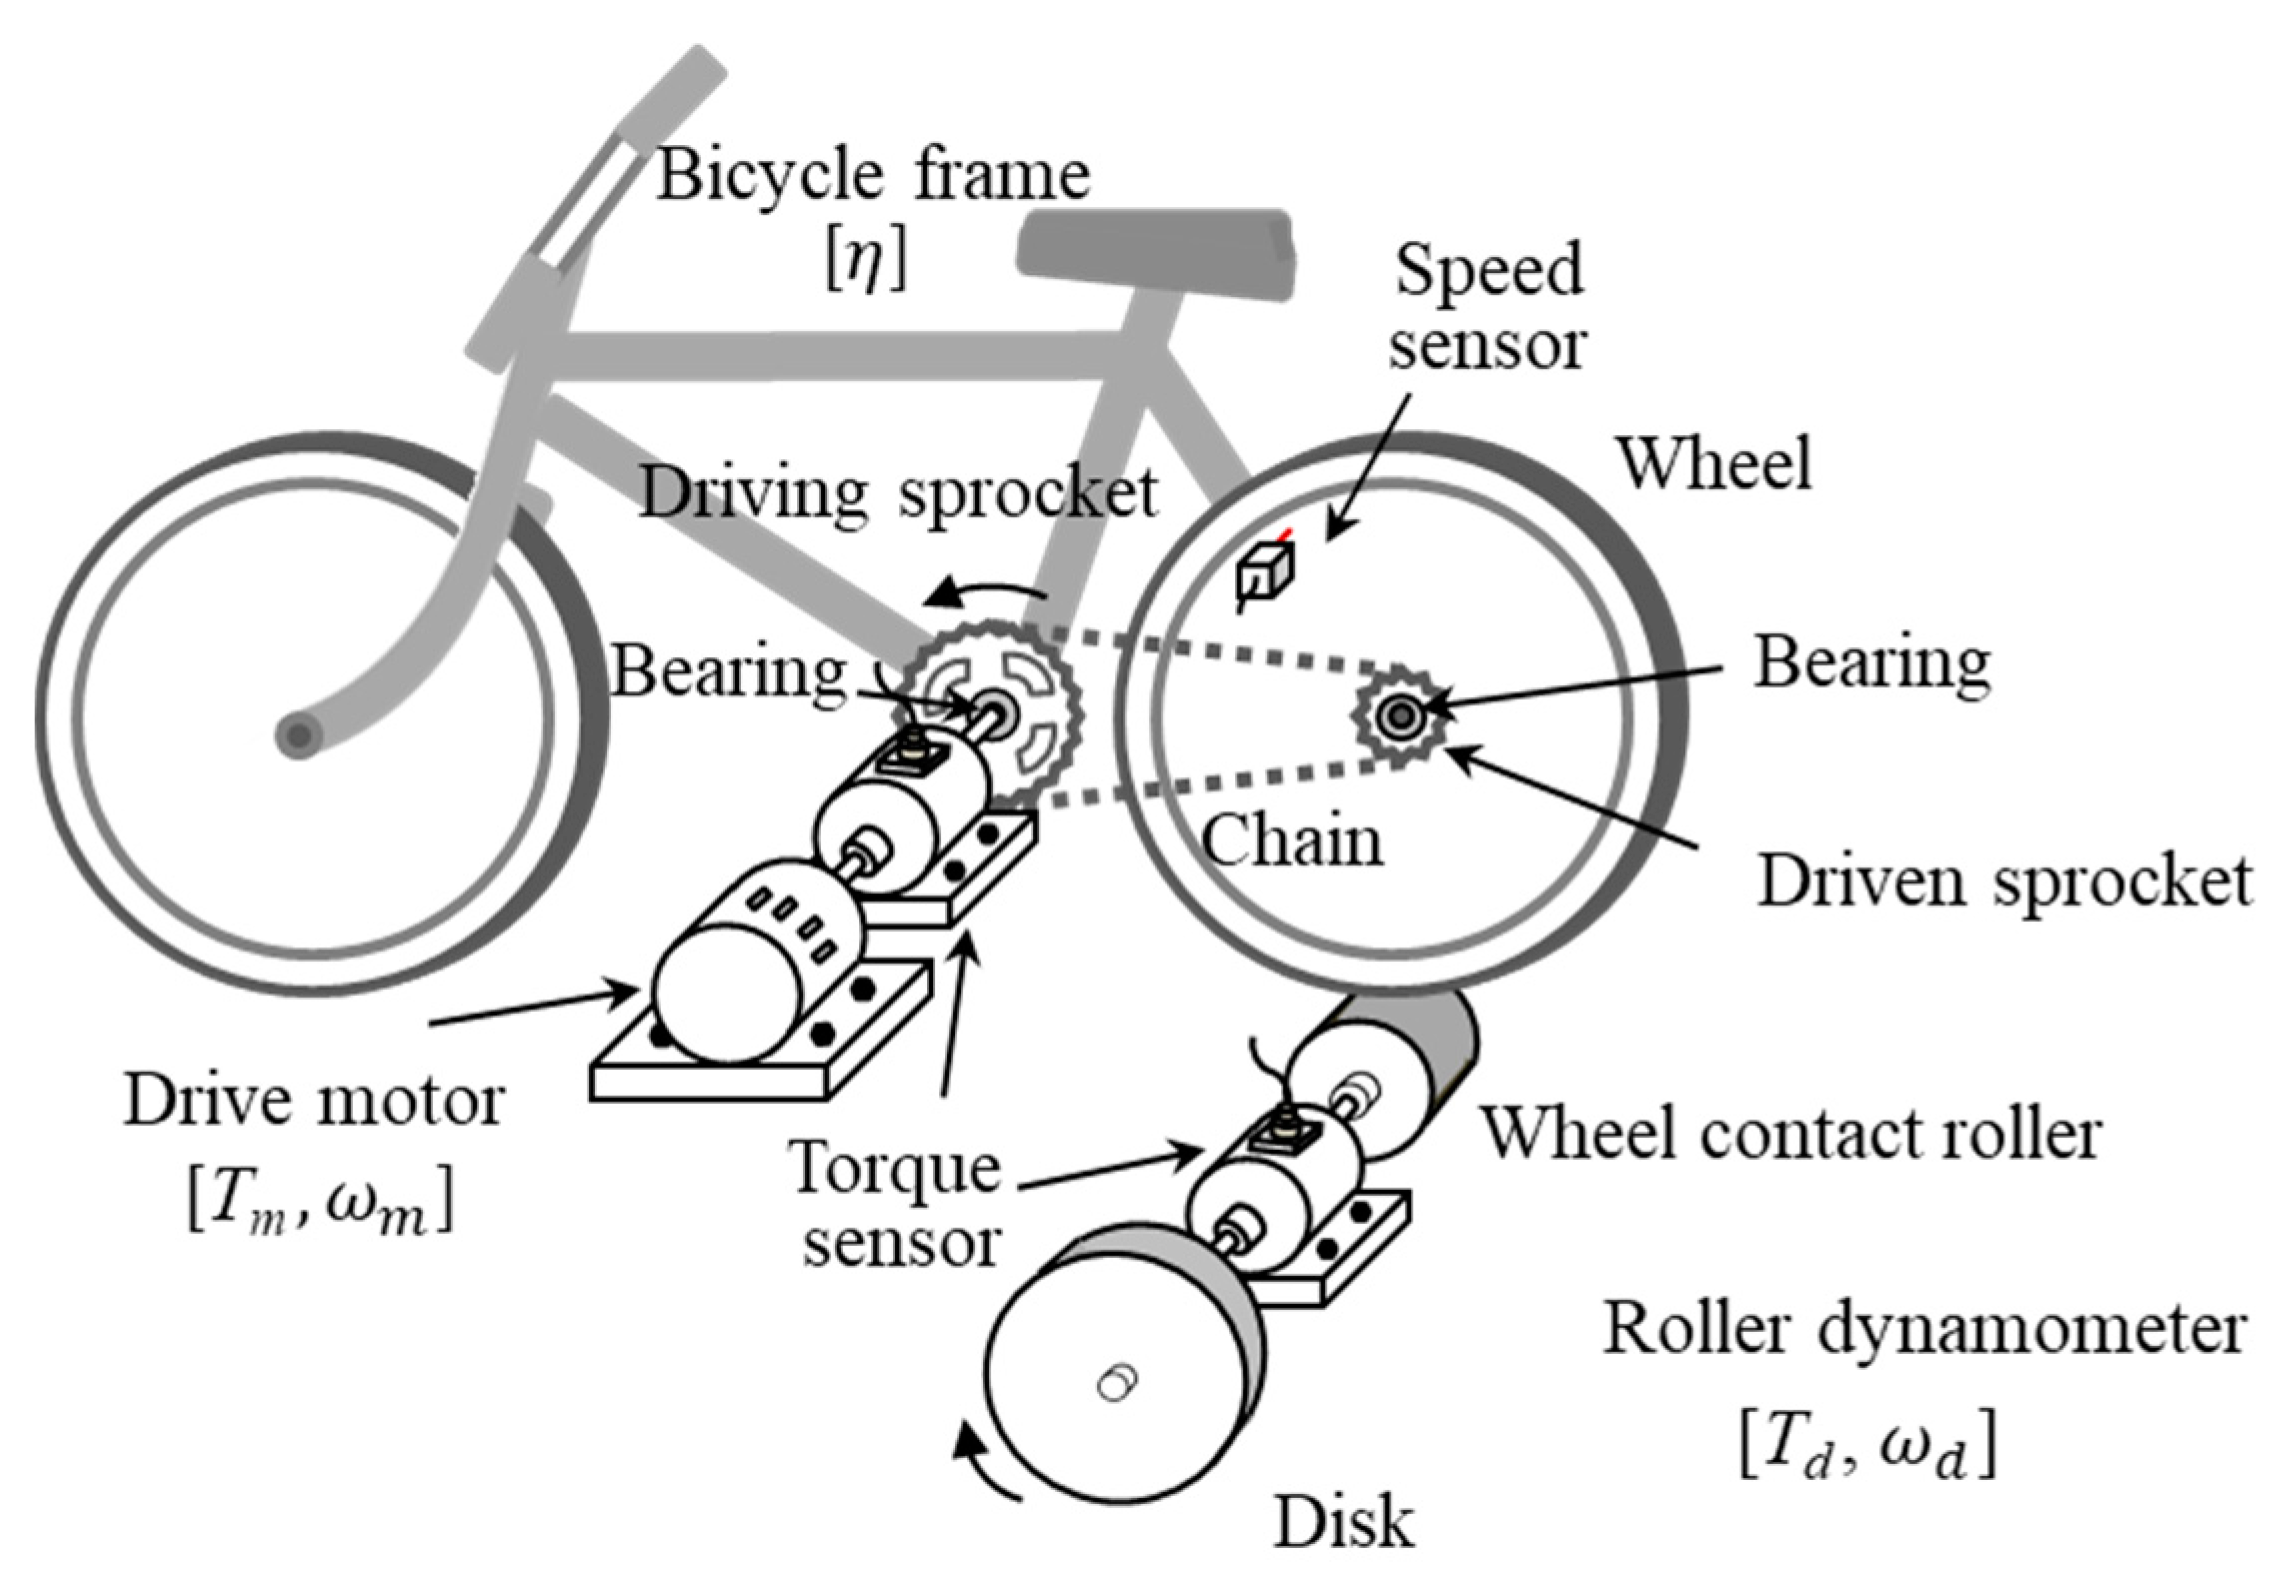
Figure 2 shows a typical bicycle driven by a centrally located motor, and its power is transmitted through the drive motor, bearing, driving sprocket, chain, and driven sprocket, and to the rear wheel. In
Table 1, all of the variables related to the characteristics of the drive train components and chassis, as well as road-load, are presented along with their nominal values for a typical electric bicycle. Other types of power transmission system configurations that use different components, such as the belt and propeller shaft, can also be considered in this formulation, once their inertia, friction, and kinematic characteristics are known.
The efficiency of the transmission system
η subject to a given driving cycle from time
t0 to
tf can be given as follows:
where
is the road-load applied to the rear wheel,
is the velocity of the vehicle, and
Tm and
ωm are the motor torque and its angular velocity, respectively. In order to calculate the transmission efficiency of bicycles, the relationship between drive motor torque and road-load should be known.
The electric bicycle was assumed to be running subject to road-load
due to acceleration, rolling resistance, and aerodynamic drag, which can be expressed as:
where
mi is the mass of the vehicle,
is the rolling resistance,
b is the aero drag coefficient, and
A is the acceleration of the vehicle. The value of
and
b can be either determined by a coast-down test or chosen as a function of the mass of the vehicle. Both methods are well-documented in the ISO 11486 [
15] and ISO 28981 [
16]. In this study, the road-load
is determined in accordance with ISO 28981, where
mi is set to 100 kg, and thus, rolling resistance
is given as 8.8 N and the aero drag coefficient
b is given as 0.0215 N/(km/h)
2.
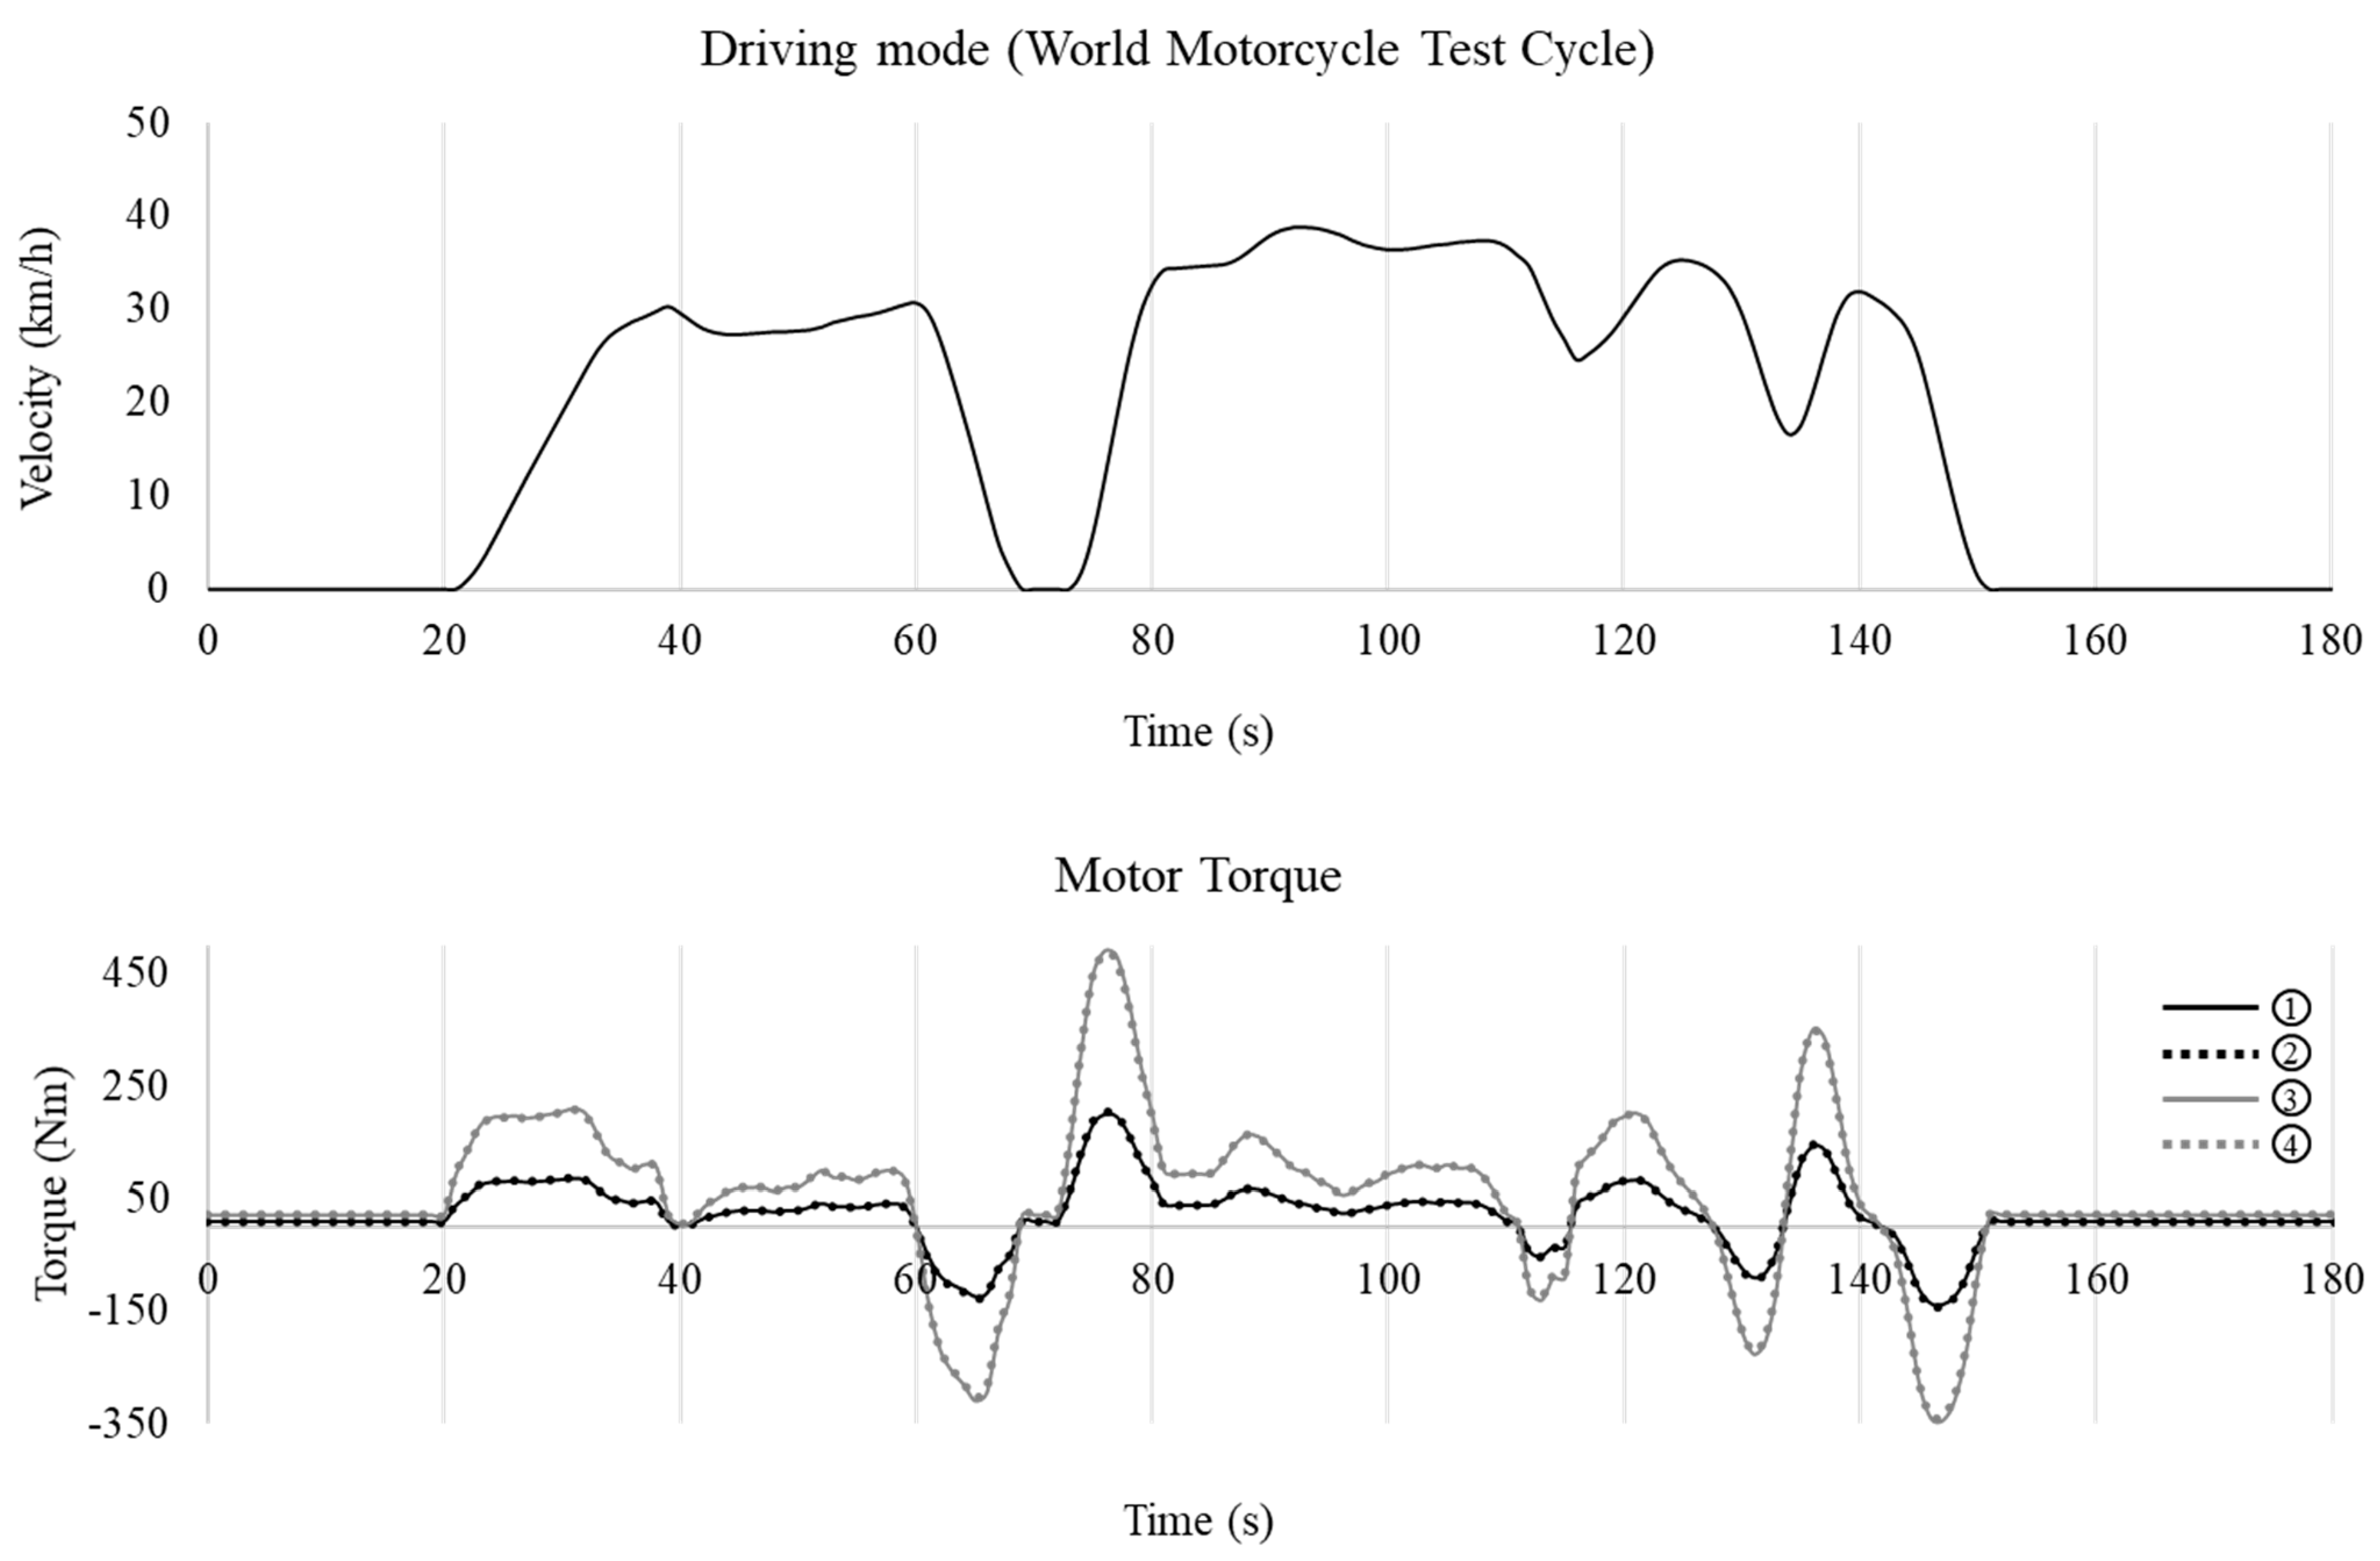
Regarding a driving cycle for electric bicycles, the World Motorcycle Test Cycle (WMTC) is widely used. The WMTC driving cycle is a three-phase transient cycle and is representative of actual on-road driving conditions.
Figure 3 shows part of the WMTC velocity profile.
The kinematic relationship between the driving motor angular acceleration (
αm) and the driving sprocket angular acceleration (
αs) can be given in terms of the motor to the driving sprocket gear ratio
as follows:
Similarly, the relation between driving sprocket (
αs) and wheel angular acceleration (
) can be written as:
where
is the driving sprocket to wheel gear ratio.
The relationship between vehicle acceleration
A and wheel angular acceleration can be given as:
The motor torque generated by the drive motor is magnified due to speed reduction: first, by the gear between the drive motor and the driving sprocket (gear ratio
); and second, by the chain connecting the driving and driven sprocket (gear ratio
). At the same time, motor torque loss occurs when power is transmitted through each transmission element, such as the bearing, sprocket, chain, etc., due to friction which is characterized by the transmission efficiency between each element, expressed as
with a corresponding subscript. Considering kinematic relations, frictional loss, and inertia effects, the Euler equation of the rotational moment between motor torque and road-load can be expressed as:
Substituting (3)–(5) into (6), and rearranging the relationship between motor torque and road-load, yields the following:
It is worth noting that inertias of transmission elements are only present at the second term on the right-hand side of Equation (7). Therefore, if inertia effects are neglected (i.e., Js = Jc = Jw = 0), then only the first term remains.
In order to elucidate the effects of friction loss and inertia effects in power transmission, four cases are considered: the first case assumes no friction loss, but inertia effects are considered (all
η = 1 and
J ≠ 0, with values given in
Table 1; case 1 in
Figure 3); the second case assumes no friction loss and no inertia effect are considered (all
η = 1 and all
J = 0; case 2); the third case considers both friction loss and inertia effects (
η ≠ 1 and
J ≠ 0, with values given in
Table 1; case 3); and the fourth case assumes friction loss, but no inertia effects are considered (
η ≠ 1 with values given in
Table 1, and
J = 0; case 4).
In
Figure 3, motor torques
for the above-mentioned four cases were computed for the given road-load
needed to run in accordance with the velocity profile. It can be observed that the motor torques for case 1 and case 2, in which both cases have no friction but different inertias, are close to each other. It can also be seen that the motor torques for case 3 and case 4, in which both cases have the same friction loss but different inertia, are close to each other. From these observations, it can be concluded that transmission efficiencies are dominant factors, and the inertia of each element is relatively insignificant.
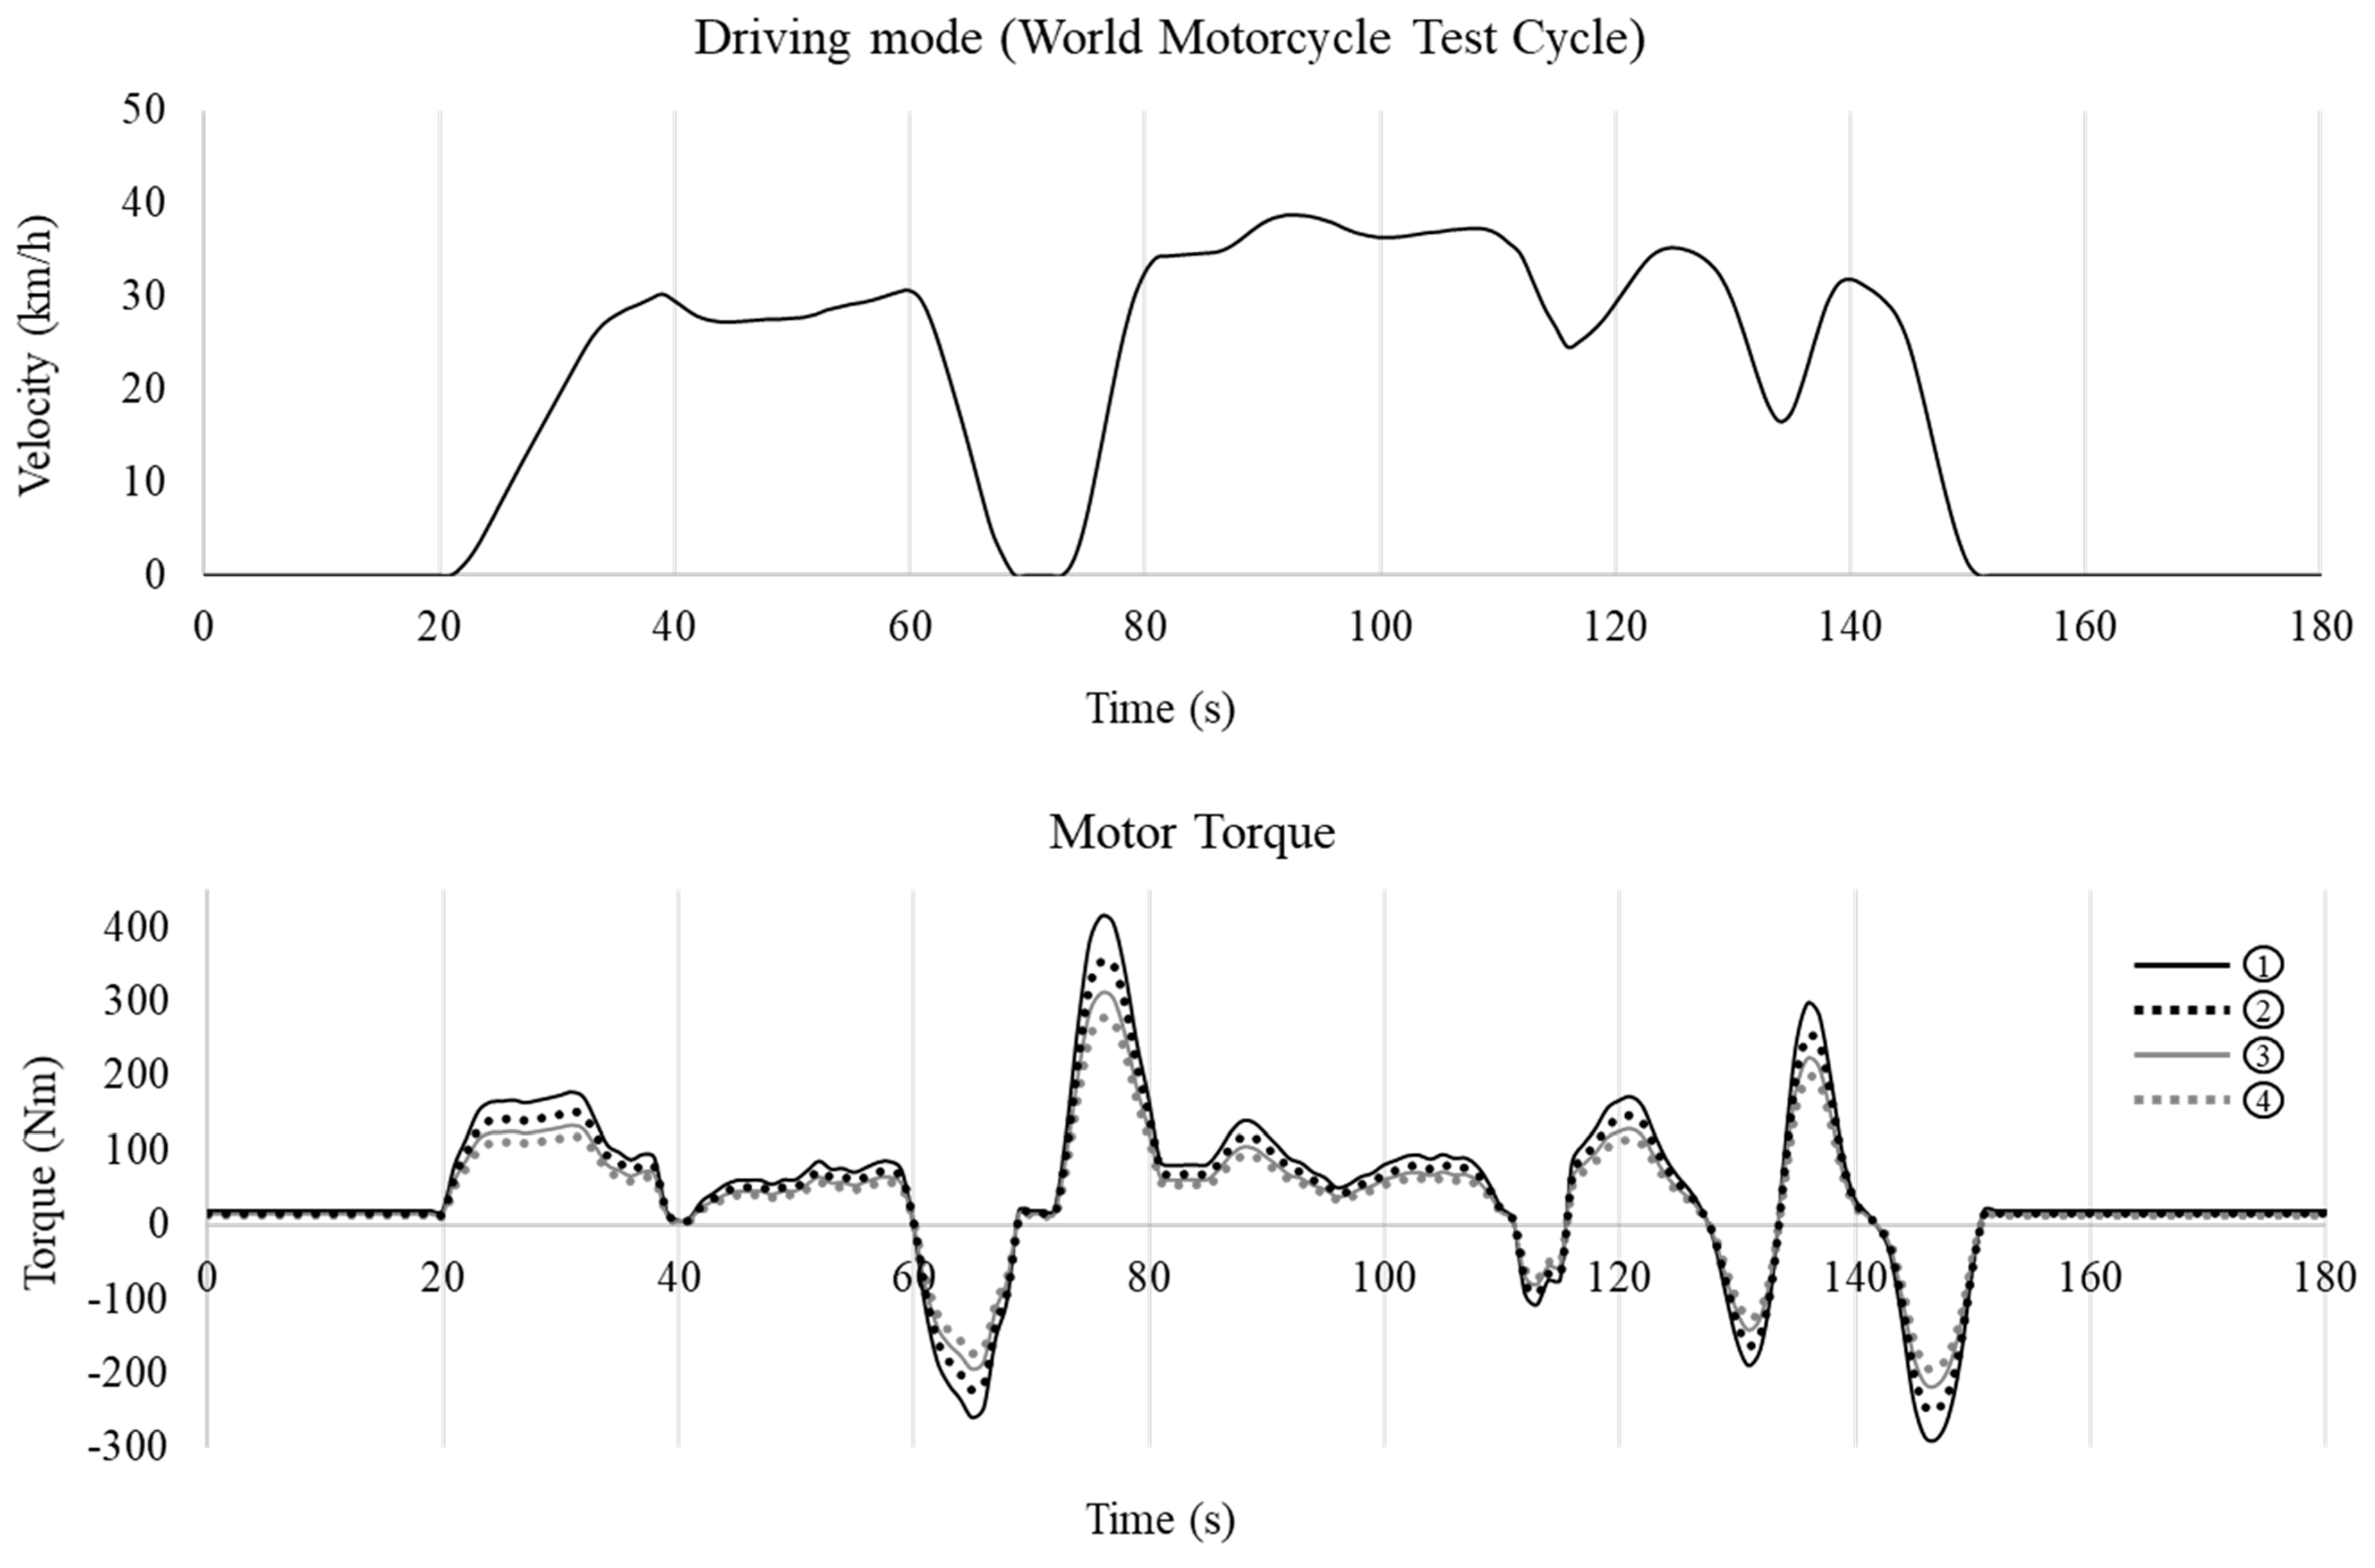
To determine the effect of transmission efficiencies in detail, motor torques with different transmission efficiencies were computed without inertia effects. The combined transmission efficiencies by four individual efficiencies of
ηg·
ηb,1·
ηc·
ηb,2 were assumed to have different values, and their effects were assessed. The first case assumed a combined transmission efficiency of 0.6, (case 1 in
Figure 4); the second case assumed a combined transmission efficiency of 0.7 (case 2); the third case assumed a combined transmission efficiency of 0.8 (case 3); and the fourth case assumed a combined transmission efficiency of 0.9 (case 4). For the four cases, motor torques were computed for the given road-load and compared.
Figure 4 shows that case 1, with a combined efficiency of 0.6, required the most motor torque, and case 4, with a combined efficiency of 0.9, required the least motor torque. The results demonstrate that the drive motor should provide more torque with the deceased transmission efficiency of the power train elements to overcome road-load.
4. Experimental Verification
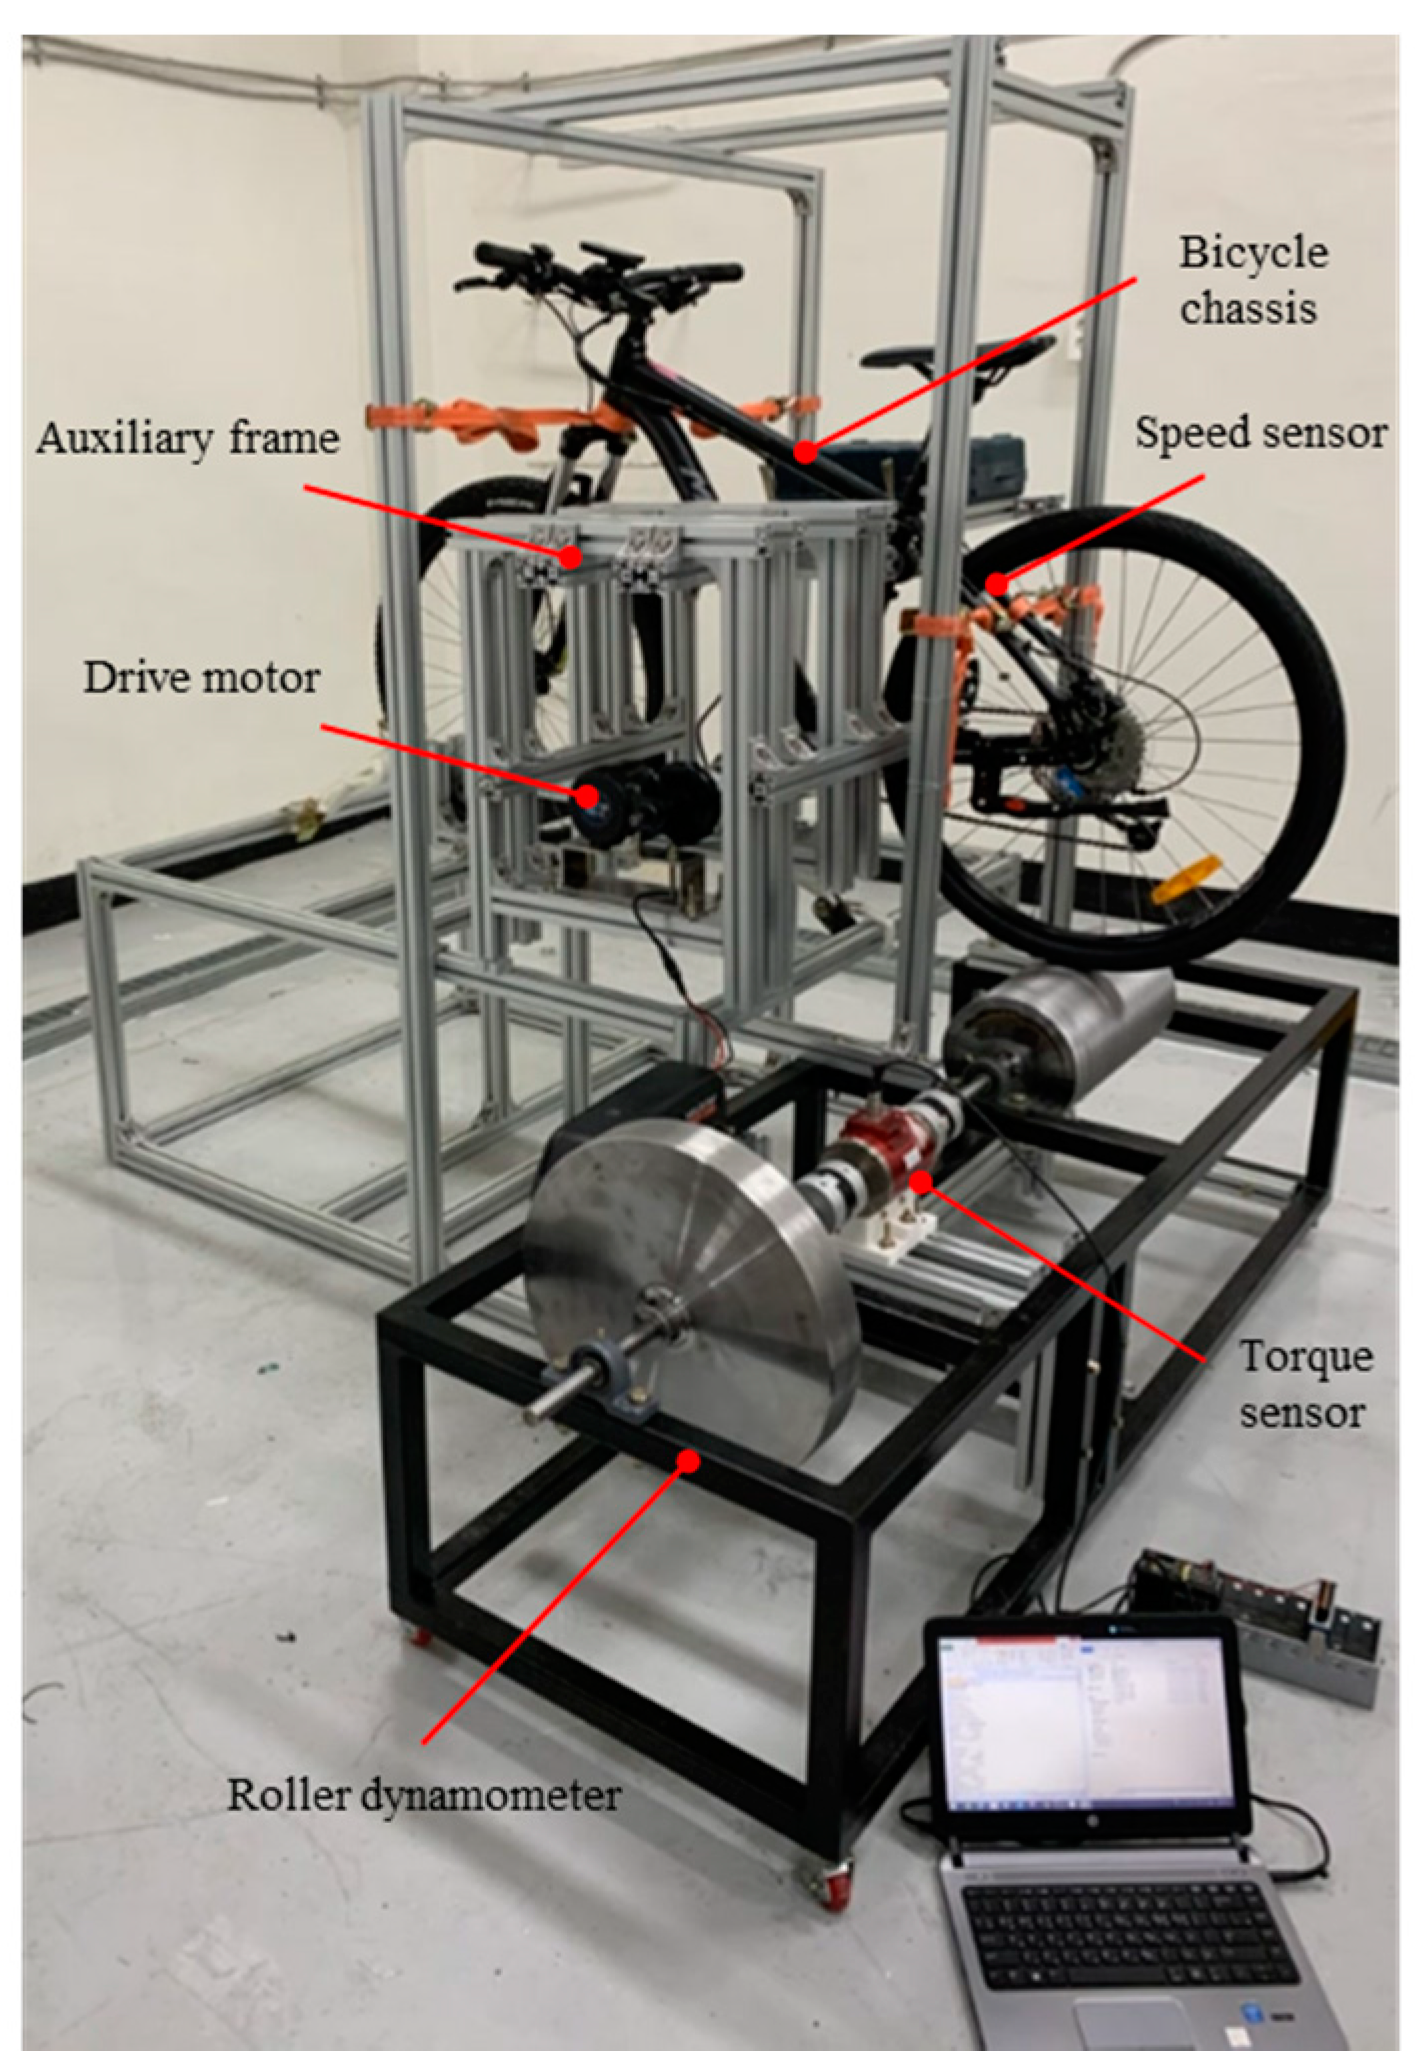
In order to verify the relationship between motor torque and road-load given in Equation (7), the experimental device was set up using an experimental electric bicycle running on a chassis dynamometer, as shown in
Figure 5. The experimental bicycle shown in
Figure 6 had a drive motor attached to a bicycle frame, through an auxiliary frame, and its driving torque and rotational speed were measured by a torque sensor and optical rotational speed sensor, respectively. The torque sensor has a rated capacity of 100 kgf-m and an accuracy of ±0.3%. The total mass of the test bicycle, including the bicycle chassis, drive motor, and auxiliary frame attached to the bicycle frame to support the drive motor, is 99.8 kg. The specifications of the battery and drive motor are shown in
Table 2. The power from the drive motor was transmitted to the roller dynamometer through the power train system. A hollow-type wheel contract roller (the mass and moment of inertia are 19.8 kg and 0.154 kg-m
2, respectively), whose moment of inertia was combined to the rear wheel of the bicycle, contacted the rear wheel of the bicycle. The rotational resistance load was provided by a disc with a mass of 60 kg and a moment of inertia of 2.4 kg-m
2. The dynamometer torque was measured at the axis between the disc and the hollow wheel contact roller.
Determining the exact values of the transmission efficiencies of the transmission elements in the experimental bicycle is not straightforward, since they can vary with operating conditions, such as load and speed [
17,
18]. Considering these uncertainties, a range of values for the transmission efficiency of the power train elements of the bearing, sprocket, and chain were considered based on the measurement values. Specifically, the following values were assumed: for the chain, three efficiency values of 0.85, 0.9, and 0.95; for the bearing of the sprocket, two efficiency values of 0.95 and 0.99; and for the bearing in the wheel, two efficiency values of 0.95 and 0.99. Considering the combinations of all the values of the transmission efficiencies, 12 cases were used to estimate the total transmission efficiency, as shown in
Table 3. According to the assumed values of the transmission efficiency of each component, the components, due to severe friction losses, should be designed or replaced appropriately to improve the efficiency of electric bicycles.
From the test setup presented in
Figure 5, motor torque
Tm, angular velocity
ωm, dynamometer torque
Td, and angular velocity
ωd were measured. Therefore, the efficiency is given as follows:
Similarly, the efficiency can be calculated by replacing Tm in Equation (8) with values obtained from Equation (7) for the given dynamometer torque Td = .
The error rate
ε between the calculated transmission efficiency (
ηcal) and experimental (
ηexp) transmission efficiency can be calculated by Equation (9) as:
Figure 7 compares the calculated and experimental results subject to WMTC, which shows vehicle speed, vehicle acceleration, measured motor torque, and the measured and calculated dynamometer output torque as a function of time. Acceleration was calculated from the speed of WMTC. The dynamometer torques were calculated for 12 cases of different efficiencies for a measured motor torque by Equation (7). “Motor-on” represents the motor drives of the bicycle during acceleration or constant speed, and “Motor-off” represents motor stops during deceleration; thus, motor torques are only measured in the “Motor-on” state. When the electric bicycle’s motor is in the “Motor-on” state, the power is transmitted from the drive motor to the dynamometer through bicycle transmission systems. When the driving motor is in the “Motor-off” state, the wheel is driven by the rotational inertia of the dynamometer; thus, the dynamometer torque becomes negative. The results demonstrate that the calculated dynamometer torques for 12 cases have a good correlation with the experimental results during the “Motor-on” state.
Table 3 presents a comparison between the calculated transmission efficiencies for 12 cases and experimental transmission efficiency. The experimental transmission efficiency is 82.0%, the range of calculated transmission efficiency is between 74.9% and 90.9%, and the error percentage between the 12 calculated transmission efficiencies and experimental transmission efficiency was calculated. The results show that the transmission efficiencies for cases 5 and 8 are close to the experiment result. The transmission efficiencies for case 12, in which the transmission efficiencies of the sprocket bearing and wheel bearing are 99%, and the transmission efficiency of the chain is 95%, have the maximum transmission efficiency error rate. The error percentage increases when the estimated values of the transmission efficiencies of the sprocket bearing
, wheel bearing
, and chain
ηc are too small or too big, which corresponds to cases 1 (smallest) and 12 (biggest). Thus, the appropriate value of the transmission efficiency of the chain and bearing should be assumed considering the operation environments, such as the load, speed, transmission gear ratio of the chain, vibration, and lubrication. For example, the transmission efficiency of the chain drive system tends to increase with an increase in input torque. Compared with the results using the global positioning system [
5], where the rate of error in the efficiency when using the estimated power and measured power is 19.72%, the maximum error rate of the efficiency in this study, which is 10.9%, is acceptable. Although the method [
6] using hardware-in-the-loop simulation for the electric bicycle driven on a motor dynamometer shows an energy efficiency error rate of 0.06% between the simulation and field test, it does not take into consideration the transmission system of the electric bicycles. When only the chain drive system estimation is considered [
11], it is reported that the transmission efficiency error rate of the chain drive system itself is 0.23–3.77%; thus, the error rate is expected to increase significantly when other transmission components are considered. It can be concluded that the estimated transmission efficiency in this study can evaluate the performance of electric bicycles with reasonable accuracy considering all the components of transmission systems.
5. Conclusions
In this study, a method for calculating the efficiency of electric bicycle power transmission systems with full consideration of the kinematics, friction, and inertia effects is presented. Based on this method, the factors that influence the efficiency of electric bicycles, such as the transmission efficiency of the chain and bearing, were quantified. In order to compute transmission efficiency, the dynamic relationship between the driving motor torque and road-load for a selected driving cycle was derived. For a given road-load due to a selected driving cycle, the motor torques required to overcome road-load subject to WMTC with different friction losses and inertias of various power train elements were computed. It was found that the effects of friction losses caused by each power train transmission element were markedly greater than the inertia effects, which could be neglected for efficiency estimation.
To validate the computational procedure to estimate power train efficiency, an experimental electric bicycle was designed to measure the driving motor torque and dynamometer torque. It was demonstrated that for a given motor torque, measured and computed dynamometer torque exhibit a good correlation, thus demonstrating the validity of the proposed computation scheme. The error rate of the results increased when the estimated values of the transmission efficiencies of the sprocket bearing, wheel bearing, and chain were too small or too big. Compared with other estimation methods, the estimated transmission efficiency in this study can evaluate the performance of electric bicycles with reasonable accuracy considering all the components of transmission systems. This method provides a practical and accurate means to predict the drive train efficiency of electric bicycles at the design stage when the full vehicle is not available for testing.
In a further study, the modeling and experiments, considering the effect factors of transmission parts of electric bicycles such as the lubrication of the bearing and the lateral offset between the driving sprocket and driven sprocket of the derailleur system, will be designed to improve the energy efficiency of electric bicycles. Since the efficiency of the power train system is highly dependent on the individual component’s efficiency, adequate consideration should be taken to improve the transmission efficiency of the individual components, which could affect the cost of the components.


