Article

Place Branding for Smart Cities and Smart Tourism Destinations: Do They Communicate Their Smartness?

1
Communication Research Group (ASTERISC), Department of Communication, Universitat Rovira i Virgili, 43002 Tarragona, Spain
2
Department of Computer Engineering and Mathematics, Universitat Rovira i Virgili, 43005 Tarragona, Spain
3
Intelligent Technologies for Advanced Knowledge Acquisition (ITAKA) Research Group, Computer Engineering and Mathematics Department, Universitat Rovira i Virgili, 43005 Tarragona, Spain
*
Author to whom correspondence should be addressed.
Sustainability 2021, 13(19), 10953; https://doi.org/10.3390/su131910953
Submission received: 4 August 2021 / Revised: 24 September 2021 / Accepted: 27 September 2021 / Published: 1 October 2021

Abstract

:
Smart cities and smart tourism destinations integrate technological infrastructures and end-user devices with the aim of providing more satisfying experiences. They generate expectations of superior innovation, greater interactivity, participation and a better image. Therefore, they need to communicate their smartness and include it in their branding. The study analyses the smart content present in the tourist and non-tourist official Twitter accounts of a selection of smart cities and smart destinations, through semantic analysis, in order to find out which smart concepts are strategically branded to create a smart tourism destination image. The results show that the best cities in the ranking for each smart topic are not the ones with highest percentages of tweets on that topic. The study also shows that the number and percentage of tweets that communicate smart aspects on the platforms analyzed are low, showing the smartness is not included in their branding. It has also been observed that, almost all cities communicate or do not communicate the same concepts, evincing an undifferentiated branding strategy. The results of this study are interesting for urban policy-makers and tourism destination marketers to improve their branding.

1. Introduction

Due to the rapid and growing evolution of technology, cities and destinations are evolving [1] and becoming smart. Smart cities (SCs) apply technology and information technologies (ICTs) [2] to achieve resource saving, sustainable development [3] and improvement of the residents’ quality of life [4], also generating added value and better experiences for tourists [5]. Therefore, as Encalada et al. [1] stated, the ICTs adopted by SCs facilitate access to information and services for both tourists and residents. So the development of SCs foments the emergence of smart tourism destinations (STDs) [1]. In fact, STDs are SCs which take into account both residents and tourists in their effort to support mobility, resource availability, sustainability, and the quality of life and visits [6,7]. Therefore, this evolution of cities and destinations also requires a change in their branding. As place branding is identity-driven [8] and it is also a constantly evolving dynamic process [9], cities and destinations should include their smart aspects in their branding.
SCs and STDs integrate technological infrastructures and end-user devices with the aim of providing a more satisfying experience for citizens [10] and tourists [11]. Technological evolution has allowed SCs and STDs to maintain the personalized, real-time exchange of information with citizens and tourists [12] and at the same time collect vast amounts of information from them to offer them even more personalized services [13]. It is this interactivity between users and technology that co-creates the added value for the citizens [14] and for the tourist [15], generating the most satisfying experiences [15,16,17] and co-creating city image [18] and tourist destination image (TDI) [19].
Place image and TDI are key factors to attract residents, tourists and wealth to territories [20]. For this reason, cities and tourist destinations communicate strategically seeking to generate a positive image [21]. As residents and tourists have a better image of SCs and STDs, because they generate expectations of superior innovation, greater interactivity and participation, and more satisfying tourist experiences [7], SCs and STDs need to communicate their sustainability and their smartness through their branding in order to generate a better image. So, as place branding is a type of urban policy [22], it should be a central instrument in spatial planning [23] for cities and destinations. Moreover, place brands are constantly evolving and dynamically constructed [24], so SCs and STDs have to manage the place branding strategically, including the sustainable and smart aspects.
Social media are key tools for place branding [25], especially in the communication by local governments and DMOs of the identity and the brand of the place to residents and tourists [1,26,27]. Smartness, sustainability and technological development are essential for the image of cities and destinations and their tourist attraction [7]. Tourists are interested in discovering the smart technologies and services that destinations offer. However, previous studies have shown [17] that, despite the importance of smartness in place branding and in the configuration of a positive TDI [28], some cities and destinations do not communicate their smart aspects effectively [17]. Consequently, it is necessary to develop tools to know what smart topics SCs and STDs communicate through their branding in social media.
For all these reasons, the aim of this study is to analyze the smartness or smart content included in the place branding of SCs and STDs through the semantic analysis of their official Twitter accounts, in order to ascertain which smart concepts are strategically branded to create a smart image; and also to find out if the smart cities best positioned in the ranking for each smart aspect communicate more content about it revealing a communication strategy based on their identity.

2. Theoretical Framework

2.1. Smartness in the Creation of Smart City Image (SCI) and Smart Tourism Destination Image (STDI)

Smart city development and smart tourism development have increasingly become interconnected [6,29,30,31], because tourists at destinations share smart urban resources, spaces and technologies with the local citizens [6]. The smart city concept has fostered the development of STDs [32]. SCs share their smart infrastructure with destinations, providing experiences and quality of life for both tourists and residents [33,34].
Smartness has generated new opportunities in destination management processes [35]. However, ICT development is not enough for destinations to become smart [28]. Intelligent systems, sensors and GPS, the Internet of Things (IoT), cloud computing, and virtual and augmented reality, among other technological advances, are creating new advantages for tourist destinations [36], arousing great interest among them to become smart.
It has been shown that SCs attract more residents and tourists than other cities [37,38]. Similarly, STDs allow tourists to enjoy activities suited to their preferences [39,40,41]. Consequently, tourists have a better image of SCs and STDs because they generate expectations of more personalized services [42] and more satisfying tourist experiences [7]. Thus, the image of cities and destinations will depend on their ability to provide technology and connectivity to residents and tourists through their smartphones [43].
For the above reasons, SCs and STDs need to communicate their smartness in their branding in order to influence the creation of their image [44]. Smartness is an attribute that shapes the image of cities and destinations among residents and tourists [7,17,45], which also generates expectations of more satisfying tourist experiences [46]. Consequently, smart city branding is a requirement for managing an SCI and an STDI [8].

2.2. Place Branding and the Role of Social Media in the Co-Creation of Smart City Image (SCI) and Smart Tourism Destination Image (STDI)

Place promotion and word-of-mouth media communication [47]. Studies about place branding started 40 years ago and were originated in tourism management [48]. During the first decade of the 21st century they highlighted its identity-drivenness [49], its authenticity [25], the dynamic view of place identity [9] and the dynamic view of place branding [24]. During the second decade of the 21st century, place branding studies focused on participatory branding with co-creation by different internal and external stakeholders [18], [50]; and they also specialized in other aspects [8,22]. Place branding has become a popular governance strategy for governments in order to create better environmental, social and economic conditions [48]. Recent studies have shown that place branding is an urban policy [22] and should be a tool for urban and destination planning [23]. However, in a literature review of place branding studies, Vuignier [51] noted the literature’s lack of interest in the political and institutional context of place branding even though it is crucial for public management.
In the current context of smart cities, place branding involves key strategies to foster collective intelligence and knowledge-based urban development [52]. Therefore, the interaction and communication with citizens should be a priority. However, this does not always happen in the professional field and there are not many scholar studies on it either [53]. In this direction, Aragonez et al. [54] recently built a city strategic management model involving citizens in medium-long term city strategies. In the same line, Grebosz-Krawczyk [44] created a smart city’s brand management model based on building a local identity, with the involvement and initiatives of residents and other stakeholders. Therefore, a relational and participatory management of the smart city brand is needed. However, Aragonez et al. [54] showed that city politicians do not take into consideration neither the city brand nor the objectives of smart cities.
Social media have changed the communication and branding of cities and tourist destinations [55]. Social media are efficient platforms for the promotion of cities allowing interactions with stakeholders, residents and tourists, [18,56] and the creation of positive place images [28,57]. Their huge potential to allow the active participation of users and the creation of user generated content [58,59], along with technological advancements, has increased stakeholders’ power of influence in SCI and TDI formation.
The role of social media in STDs is twofold in the creation of TDI. On the one hand, social media allow the communication and branding of destinations and the co-creation of their image, making STDs more attractive to tourists [55,60]. On the other hand, social media are technological tools that allow the participation of tourists in the co-creation of tourist experiences, also creating TDI [16,27,61,62]. Therefore, the potential of social media and ICTs as branding and communication tools has been widely acknowledged [28,56,57,60].
Nowadays, SCs try to implement smart city strategies with the aim of improving their SCI [63,64] and STDI [28,57]. However, smartness or smart concepts are still hardly used in the communication and branding of cities [65,66] and destinations [17]. Despite the importance of smartness in the configuration of positive STDI [28], some destinations do not communicate their smart aspects effectively [17] and it remains a developing area of implementation and research [44].

3. Materials and Methods

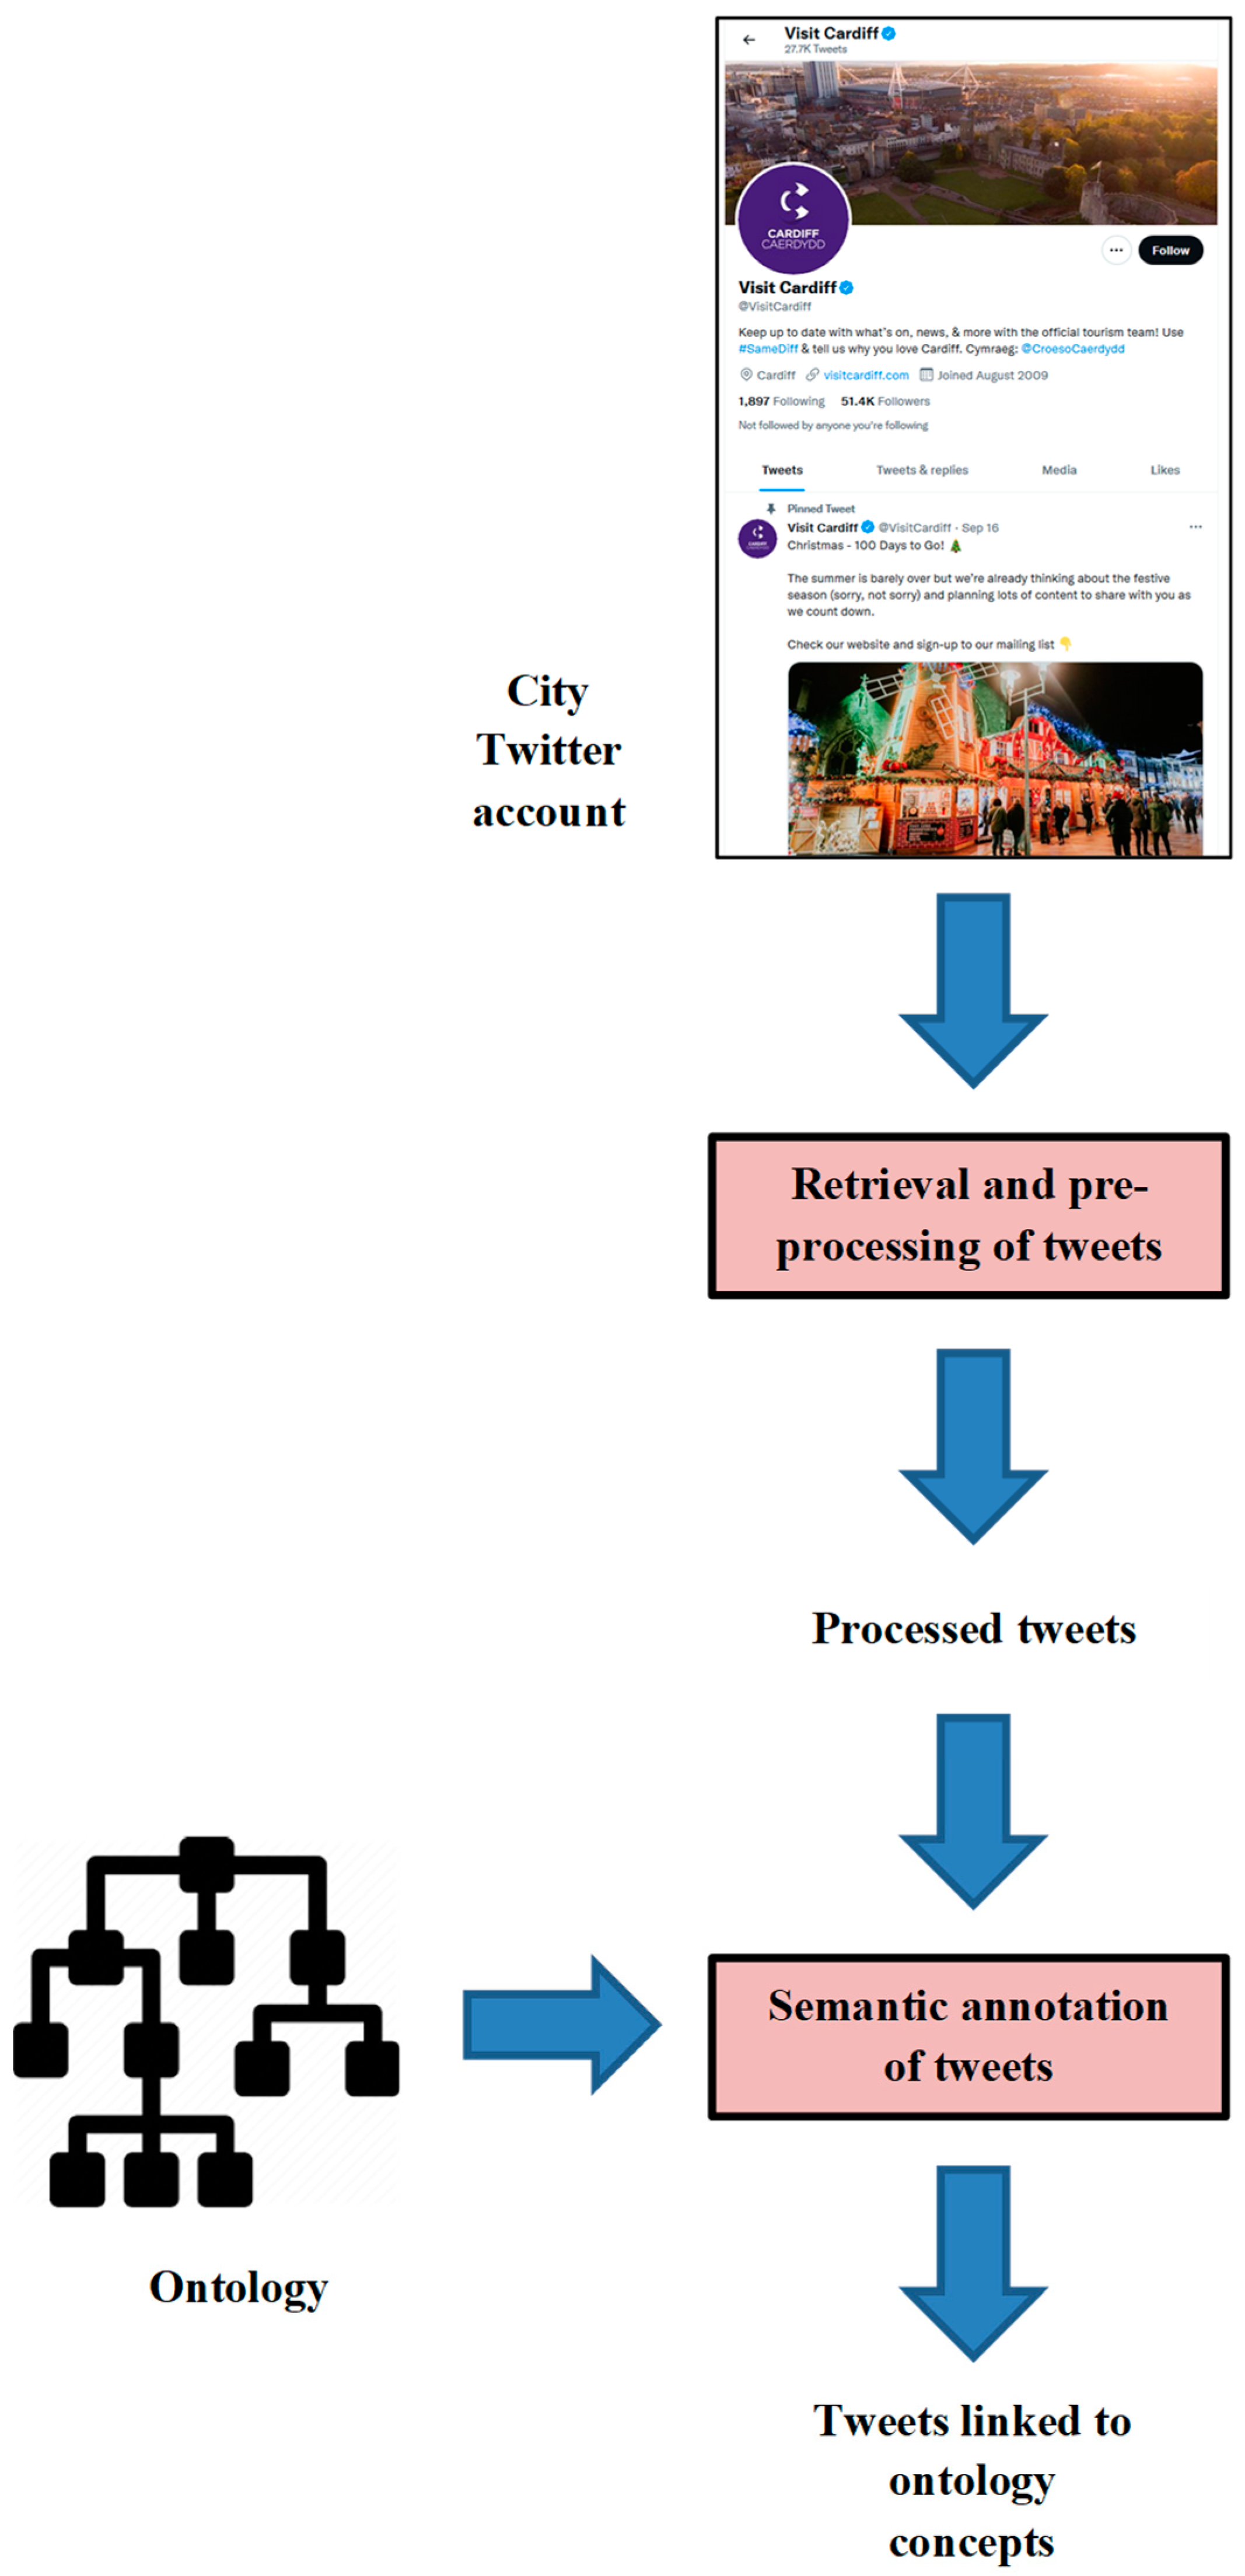
3.1. System Architecture

The architecture of the system is shown in Figure 1. First, the tweets sent from the official Twitter account of a destination are retrieved and pre-processed. Then, the words contained in the tweets are semantically compared with the main concepts of a domain, represented in an ontology. The result of this semantic annotation process is the association of every tweet with the concepts which are related to it. In this way it is possible to uncover which are the topics about which the destination is communicating with its followers.
The following subsections describe which were the ontologies developed in this work (Section 3.2), which cities were selected to be analyzed (Section 3.3), how the tweets from each destination were retrieved and pre-processed (Section 3.4) and how the semantic annotation step was implemented, using the notion of word embeddings (Section 3.5).

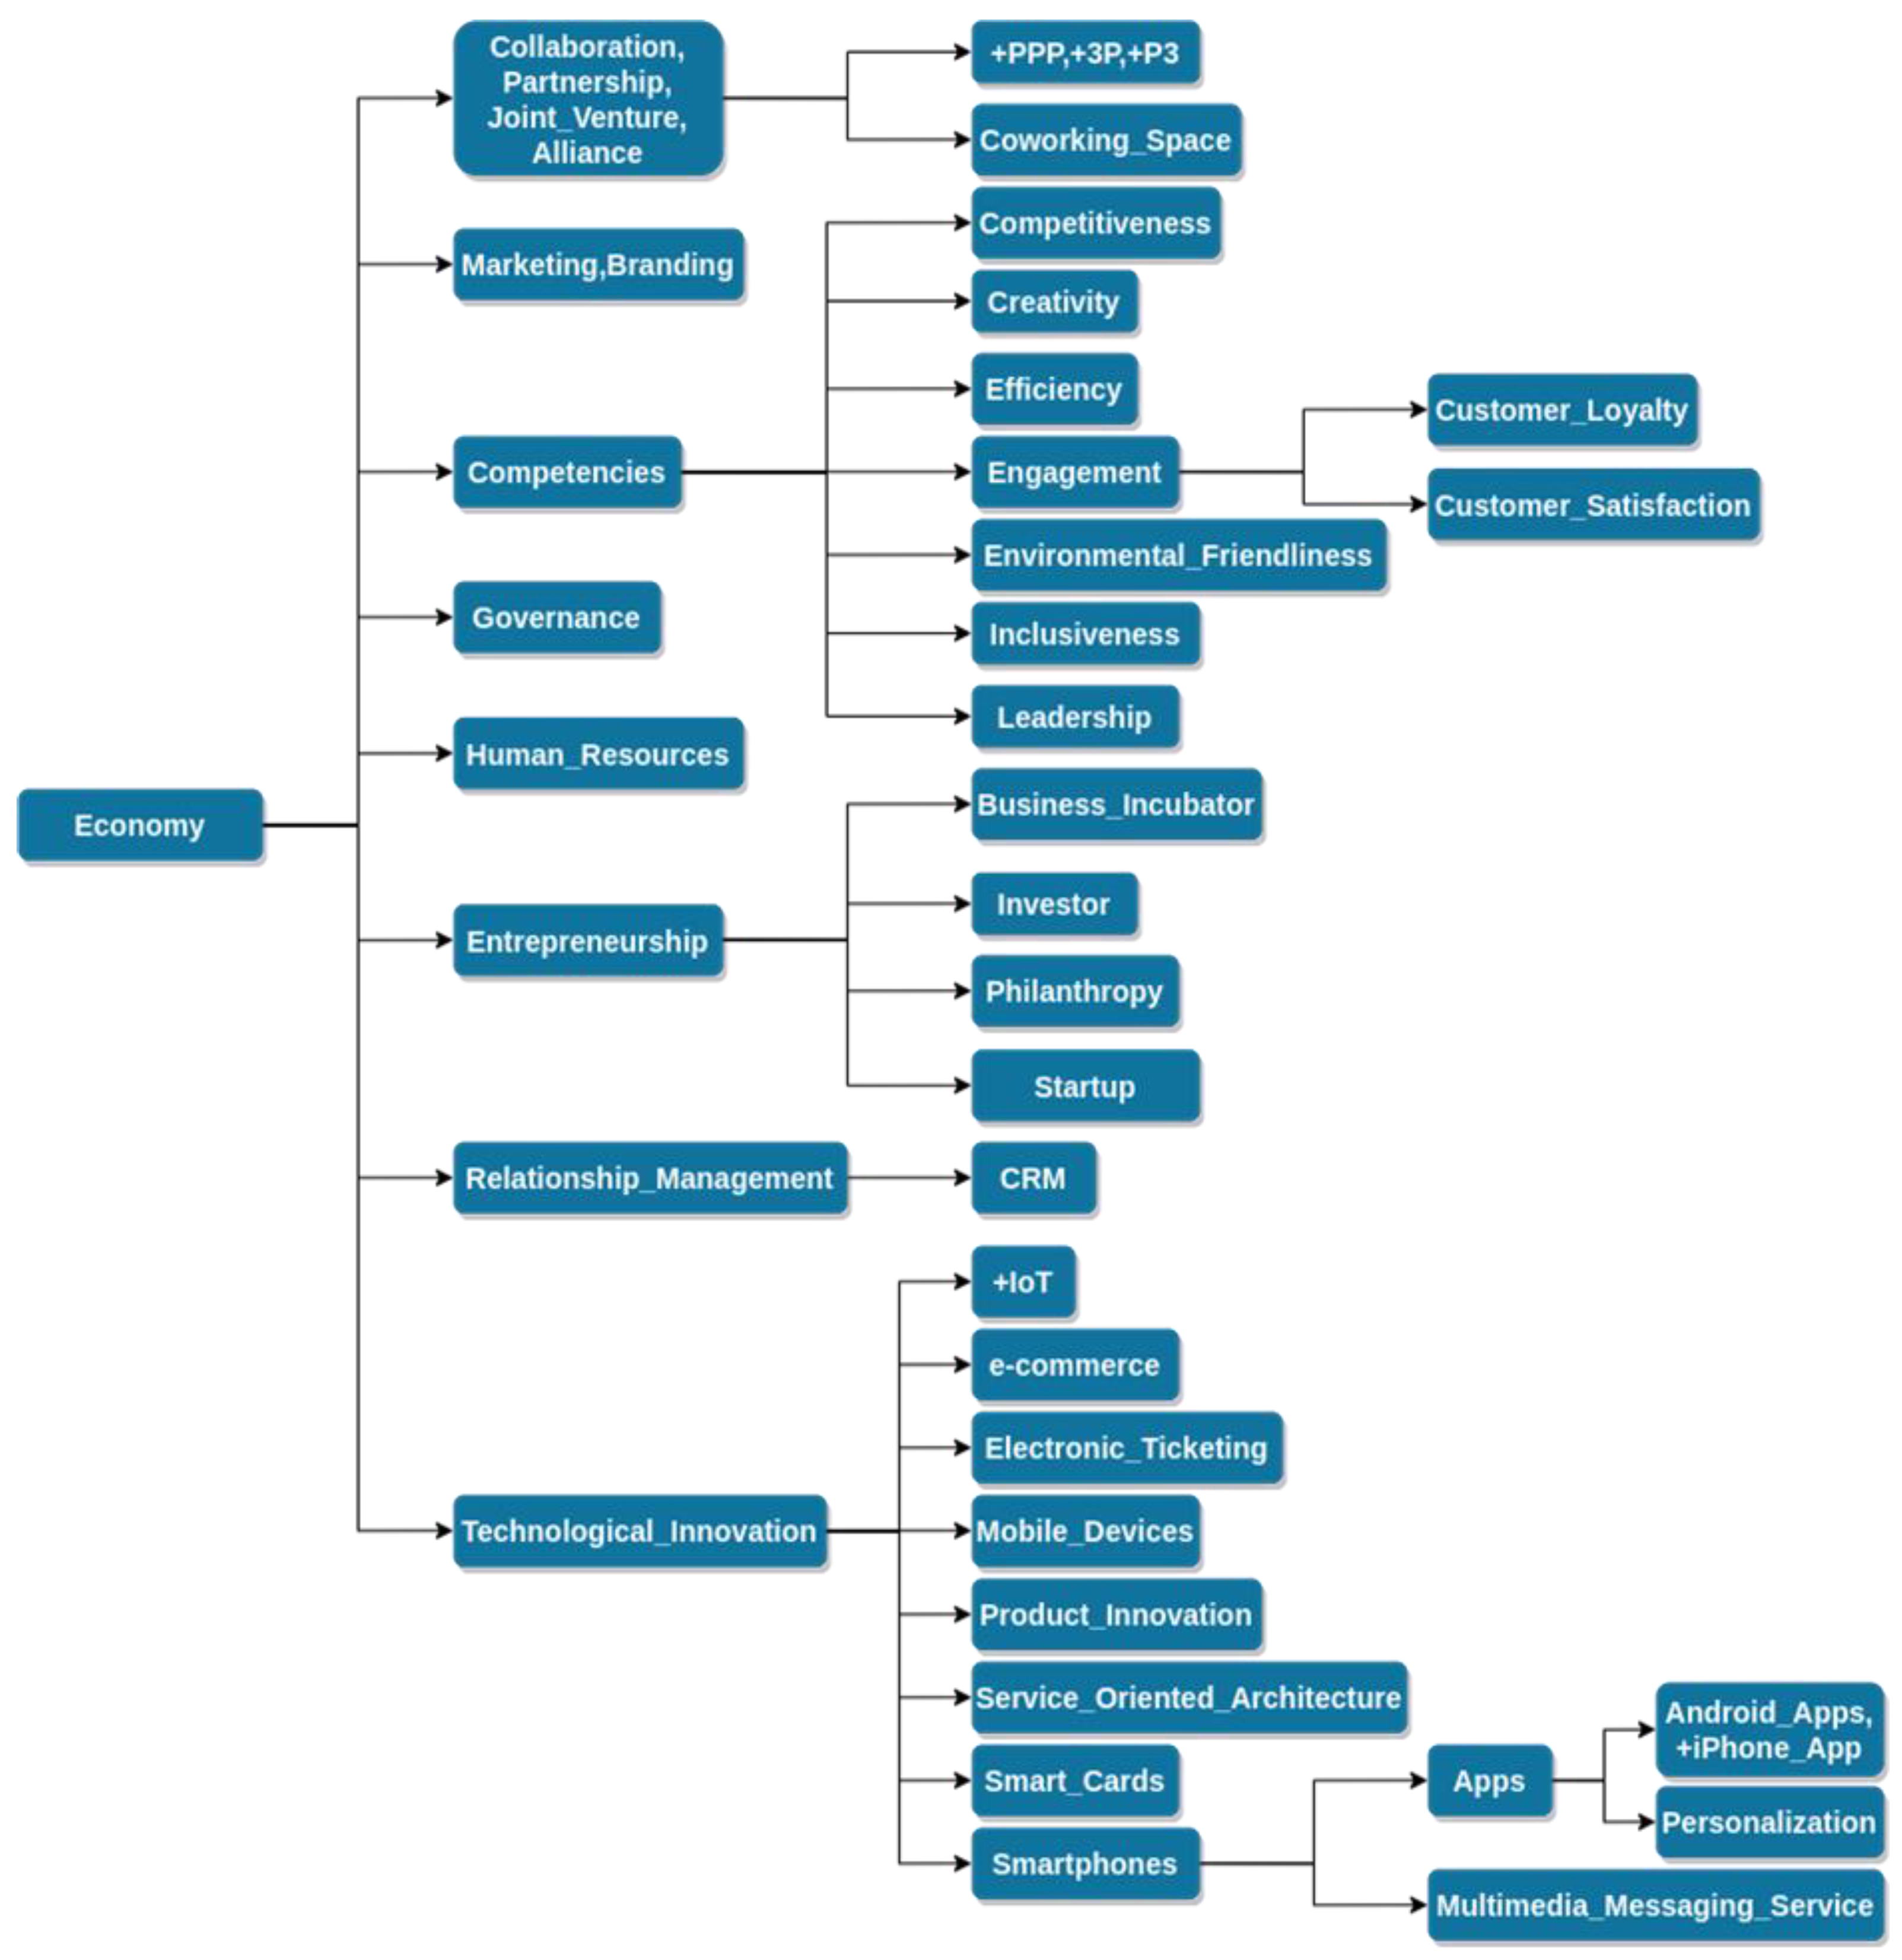
3.2. Ontology Construction

An ontology is basically a commonly shared conceptualization of a domain. It usually contains the main domain concepts linked hierarchically. In this study, only taxonomic relationships were considered. Technology, sustainability and economy, the ontologies covered in this study, are the relevant dimensions of smart cities most commonly mentioned by previous studies [28,67,68,69,70,71]. The main aspects that can be observed in these ontologies (Figure 2, Figure 3 and Figure 4) are the following:
  • The root concept of an ontology (its most general concept) represents the whole domain. Each ontology is a taxonomical hierarchy of concepts. The higher the concept in the ontology is, the more specific it is. For example, in the “Sustainability” ontology there is a “Clean Energy” concept, which contains sub-concepts such as “Biofuel”, “Hydroelectric Plants” or “Wind Farms”.
  • In some cases a node of the ontology contains different ways of representing roughly the same concept. For instance, in the “Economy” ontology there is a node that represents collaborative efforts and is labelled “Collaboration, Partnership, Joint Venture, Alliance”. In this way, all tweets referring to any of these ideas will be labelled under the same concept.
  • The concepts of the ontologies have to be transformed into word embeddings (numerical vectors) in order to make a semantic comparison with the words appearing in the tweets (see Section 3.5). Thus, the concepts used in the ontologies must have a word embedding representation. The word embedding used in this work was Google News Negative300. It was generated with the word2vec method, analyzing a Google News dataset of 100 billion words. The model contains the representation of three million words and phrases in vectors of 300 real numbers, and it is available from the Web.
  • Some very specific concepts (e.g., Wi-Fi, Smart City, Big Data) do not have associated word embeddings. In these cases, the corresponding string was added to the ontology as a new concept, prefixed by the symbol “*”. As discussed later, this means that these concepts will only be detected in tweets with a strict string matching (not with a semantic comparison as regular concepts). For example, in the “Technology” ontology there is a concept labelled as “*Wi-Fi, *WiFi”), which will match any tweet that contains at least one of these two expressions.
  • The word embedding employed later to transform ontology concepts into numerical vectors takes the capitalization of words into account. In the cases in which we want a concept only to be considered with a particular capitalization, and not in both lower and upper case, we have used the “+” symbol. For example, in the “Economy” ontology we have the concept “+IoT”, which is an acronym that refers to the Internet of Things, and we will only label a tweet with this concept if it contains exactly this string with these particular letters in this precise capitalization.

3.3. City Selection

We wished to analyze the cities contained in a smart city ranking, so that we could compare the mention of smart concepts in the tweets of the destinations with their positions in the ranking. The Smart Cities European project ranking (www.smart-cities.eu), developed by the Vienna University of Technology, the Delft University of Technology and the University of Ljubljana, was chosen. This ranking is composed of 70 medium-sized European cities (100,000–500,000 inhabitants), hosting a University and with a catchment area of less than 1,500,000 people [72]. The main reason for the selection of this ranking was that it provided not only a global classification of the smartness of the cities, but also more specialized rankings in the dimensions of Economy, Mobility, Environment, People, Living and Governance.
The official Twitter accounts of these 70 cities were manually searched and analyzed. Twitter accounts of different kinds of city institutions (City council, DMOs, News, etc.) were found. The accounts that did not tweet in English, had less than a hundred tweets or did not have recent tweets were removed from the analysis. After this step, twenty-one cities and twenty-four accounts remained.
For the cities with multiple accounts, only the one that seemed most relevant to a smart destination was kept. The final nine selected cities were Aberdeen, Cardiff, Cork, Eindhoven, Gent, Leicester, Ljubljana, Portsmouth and Tampere. It is interesting to note that this selection includes three accounts managed by tourist offices or DMOs (Cardiff, Gent and Ljubljana), three managed by the City council (Aberdeen, Cork and Eindhoven) and three News accounts of the cities (Leicester, Portsmouth and a specialized account on smart cities of Tampere).

3.4. Retrieval and Pre-Processing of the Tweets

The tweets were retrieved from the account of a destination using a public Python library called GetOldTweets3, and were then pre-processed as follows:
Removal of stop words (articles, determiners, prepositions, etc.), numbers, URLs and mentions (@username) that are not useful for the semantic annotation.
  • Tokenize the tweet to divide it into words. In the case of hashtags (words preceded by the # symbol), a word divider was used to obtain the words composing the hashtag.
  • An n-gram collocation model [73] was used to obtain relevant n-grams in the text (sequences of n consecutive words constituting a term, e.g., “Smart City” is a 2-g composed by two words).
  • Finally, each word in the tweet is represented in two different ways, starting with lower and upper case. If we have an n-gram composed of several words, the first letter of each word is capitalized.

3.5. Semantic Annotation of Tweets

The aim of this step is to analyze the textual content of a tweet and to associate it with zero, one or more concepts of an ontology. A tweet is labelled with a concept of an ontology if it contains a term (i.e., a word or an n-gram) with a high semantic similarity to the concept. In the case of the ontology concepts marked with a “*” symbol, the system only takes into account the appearance in the tweet of a term matching exactly the name of the concept, as commented previously. Thus, the system combines a syntactic and a semantic perspective.
In the analysis of each term we check if any of these two conditions is satisfied:
  • If the term matches exactly one of the ontology concepts marked with the “*” symbol (e.g., a tweet contains exactly the string “Smart City”).
  • If the term has a high semantic relationship with any of the ontology concepts. If the term does not have an associated word embedding in our word2vec model, it is dismissed; otherwise, we compute the cosine similarity between the word embedding of the term and the one of each ontology concept. The word embedding of each term in the tweets (or each ontology concept) is a vector of 300 real numbers. The cosine similarity of two vectors is their dot product divided by the product of their norms. This computation returns a similarity between −1 and 1, where 1 denotes a extremely high similarity and −1 represents the maximum dissimilarity.
The tweet is labelled with a concept of the ontology if a term in the tweet exactly matches with a “*”-concept of the ontology or if the semantic relationship between a term of the tweet and an ontology concept is above 0.6.

4. Results

Table 1 shows that, in general, the number and percentage of tweets that mention or communicate smart aspects with respect to the total number of tweets in the accounts analyzed are low. For example, in the case of Leicester, which has the highest number of tweets, only 2.66% of these tweets communicate sustainability, 4.57% technology, and 2.69% economy. In fact, in most of the cities analyzed, the tweets about smartness in each ontology do not reach 6%. This means that they scarcely communicate their smart aspects, and therefore their smartness, with respect to the total topics covered.
However, there are some exceptions: the high percentages of tweets dealing with smartness in Eindhoven on the smart economy (26.82%), or in Tampere on the smart economy (28.14%) and smart technology (53.8%). These cities most communicate some of their smart aspects despite being the ones with the lowest number of tweets in their Twitter accounts. However, it should be noted that the Twitter account of Eindhoven is not the tourist one, but the municipal one, and the account of Tampere is dedicated especially to smart communication (@SmartTampere).
The tourist accounts analyzed (Cardiff, Gent and Ljubljana), despite having a high number of tweets, especially in the case of Cardiff, show the lowest communication percentages of Smartness. Thus, we can say that if cities in general do not make a strong effort to communicate their smart aspects, in tourist communication they are dealt with even less.
Table 2 compares the positions obtained in the Smart Cities project rankings [74] for Sustainability and Economy with the number and percentage of tweets of the cities concerning these topics, to find out whether the smart cities which make a higher number of tweets about the aspects analyzed correspond to the best positioned in the ranking for this topic.
It can be seen that the cities best positioned in the ranking are not the ones that make a higher number of tweets with respect to their total number of tweets. For instance, in sustainability, Ljubljana is the 3rd smart city in the ranking, but just 1.25% of the tweets talk about this aspect. By contrast, the worst city for sustainability in the ranking, Aberdeen, which is 67th, has 4.66% of tweets related to sustainability, more than four times those by Ljubljana.
In the economy topic, the exceptions are Cork and Eindhoven, which show a good relationship between their position in the ranking and the percentage of tweets on the topic. The best results in the ranking for Economy were obtained by Cork (2nd position), which also has a relatively high percentage of related tweets (6.53%). Eindhoven holds 6th position in the ranking and also has a very high percentage (26.82%). However, in general there is not a relationship between the percentage of tweets on economy and position in the ranking. For example, Tampere has the worst results in the ranking for the economy aspect (29th), but it has the greatest number of tweets about it (28.14%).
In general, it can be said that there seems to be no correlation between the position of a smart city in the ranking and the number and percentage of tweets they make about the smart city topic analyzed. Therefore, it seems that there is no communication strategy of the smart aspects where the cities and destinations are better positioned.

4.1. Smart Sustainability

In the analysis of each ontology, Table 3 shows the concepts of sustainability that appear in the tweets of the cities analyzed. The green, orange and yellow cells represent the highest, second and third number of labels assigned for each smart city respectively.
For sustainability, the most recurring concept is recycling, followed by waste disposal and environmental sustainability. Others that are also rather present are: natural gas, carbon emissions, climate change, and global warming. However, a few concepts are barely tweeted about or not mentioned, like desertification or resource management.
The cities with the highest number of tweets about sustainability are Aberdeen, Leicester and Portsmouth. Interestingly, they are the worst positioned cities in the Smart Cities ranking for sustainability, in 67th, 64th and 63rd positions, respectively, in a ranking of 70 cities. The highest number of tweets by Aberdeen and Portsmouth are about recycling, followed by waste disposal and natural gas. Leicester’s highest number of tweets are about recycling and waste disposal, with carbon emissions in third position. It should be noted that the Twitter accounts analyzed in these three cities are not the tourist ones, which as we have already seen, were the ones dealing the least with smart aspects.
On the other hand, Gent, Eindhoven and Tampere have the fewest tweets about sustainability. Tampere’s poor results are surprising, because the city occupies a medium position in the ranking for sustainability and also because the analyzed Twitter account is specific about smartness.
Ljubljana, Cardiff and Gent, the tourist accounts analyzed, have a low number of tweets on sustainability, with very low percentages.

4.2. Smart Technology

In the case of technology, Table 4 shows that the most mentioned concepts are social networking, traffic congestion and Wi-Fi. Other topics that are less present in the tweets are monitoring, smart city, or broadband connectivity. A few of them are barely present or not present at all, like intelligence BI, biometrics or data science (Table 4).
The cities which have most tweets about technology are Leicester, Aberdeen and Tampere. It should be noted that Tampere is third with respect to the number of tweets about technology, but it is the city with the highest percentage of tweets about technology, with a huge difference compared to the rest (53.8%). It is also important to note that Cardiff also has a considerable number of tweets about technology, just two tweets less than Tampere. Its tweets mainly deal with social networking, Wi-Fi and traffic congestion. Thus, an effort is observed by this tourist account to communicate these aspects of the destination, despite the fact that, if we take into account the total number of tweets, it is still a low percentage (1.78%).
The cities that have the lowest communication of technological aspects in their tweets are Gent, Eindhoven and Ljubljana.
Finally, in the case of “Economy”, Table 5 shows that the most tweeted concepts are Android and iPhone apps, partnership and creativity, followed by customer satisfaction, innovation, and smartphones. Some concepts are hardly present in the tweets, such as coworking space or human resources (Table 5).
In this case, the cities with most tweets about “Economy” are Leicester, Aberdeen and Cork. Leicester is the top city in the communication of economic concepts, and it occupies third position in the Smart Cities ranking for this topic. The tweets are basically related to Android and iPhone apps, smartphones and, surprisingly, customer satisfaction. It is the only city with high scores for this topic. Consequently, it is a smart city with a great potential for the smart economy that strategically communicates the topic through its news Twitter account. Cork is the third smart city in the communication of Economy topics, and it occupies second position in the Smart Cities ranking. The smart concepts most present in its tweets are partnership, creativity and entrepreneurship. This smart city also uses its Twitter account, managed by the city council, to communicate this topic. It can be observed how these two cities, which occupy a high position in the Smart Cities ranking, communicate these concepts in their Twitter accounts. They even communicate some different smart concepts from other cities, which shows that they have a communication strategy of differentiation and branding.
Curiously, Tampere and Eindhoven are the cities with the highest percentages of tweets about the smart economy, 28.14% and 26.82% respectively. They show a strategy for communicating this concept, even though Eindhoven occupies 6th position in the Smart Cities ranking and Tampere comes 29th.
In their touristic accounts, Cardiff and Ljubljana also show a medium number of tweets about the smart economy, but, if we consider the total number of tweets, the percentages are very low. Therefore, these concepts are present in their tweets, but the low percentages do not show the existence of a content strategy regarding these topics.

5. Discussion

The study shows that, in general, the number and percentage of tweets that mention or communicate smart aspects with respect to the total number of tweets on the platforms analyzed are low. Only the high percentages of a concept with respect to the total tweets clearly shows the existence of a content communication strategy, and in the study the only exceptions that reflect high percentages of smartness treatment are Eindhoven, on smart economy, and Tampere, on smart economy and smart technology. These results corroborate previous studies [65,66] that showed that smartness or smart concepts are still hardly introduced in the branding of cities. It is difficult to comprehend that, given the importance of branding smart aspects to be more attractive [37,38] and the importance of smartness to create more sustainable cities and destinations [7], sustainability, precisely, appears not to be consciously used and communicated by any of the smart cities analyzed.
Previous studies have shown the importance of smartness in the branding of cities [48,52] and the need for rulers to create branding strategies involving citizens and different stakeholders to promote the smart aspects of cities [44]. Therefore, it is surprising that the different cities’ institutions no longer use a channel such as Twitter, which is precisely useful to generate interaction with stakeholders [19] and is an effective branding tool [75], to include smartness in their strategy branding. However, these results are in line with those of Sánchez-Martínez [53] and Aragonez [54].
Moreover, the tourist accounts analyzed (Cardiff, Gent and Ljubljana) show the lowest communication percentages on smartness. If cities hardly communicate their smart attributes, in tourist communication the treatment of their smart attributes will be even lower, corroborating previous studies [17]. Despite the importance of smartness in the configuration of positive STDI [28] and although it has been shown that STDs have to create brand strategies to set themselves apart from their competitors and brand communicate their smartness to tourists and residents [17] the STDs analyzed do not do so. They do not include smartness in their branding.
Previous studies have shown [28,76] that the application of smart systems and smart tools in tourism increases tourist satisfaction and improves the effectiveness of resource management. They have also shown that tourists are attracted to smart destinations [40]. The new tourist, more experienced and demanding, values technology, personalization and smart attractions and destinations. It has also been shown that there is a positive correlation between smartness and the creation of a more attractive and memorable tourist visiting experience, both in the preliminary phase and during the trip [77]. Thus, destinations perceived as smart are more attractive and will attract more tourists. Therefore, it is surprising that they no longer communicate their smartness in their branding strategy.
The study also shows that the best cities in the ranking for each smart topic are not the ones with the highest percentages of tweets on that topic. Thus, it can be said that, in general, there is no correlation between the position of a smart city in the Smart Cities European project ranking and the number and percentage of tweets that contain said topic. The only exceptions are for the economic topic in the cities of Cork (2nd position in the ranking and 6.53% of the tweets about the smart economy) and Eindhoven (6th position in the ranking and 26.82% of tweets on the topic). This shows that cities do not take advantage of their smart potential and do not prioritize it in their branding via Twitter. It also indicates that they do not have communication or positioning strategies with respect to these smart aspects in which they stand out. Thus, it has been shown that branding is not based on their identity or their reality, as many authors claim it should be [9,25].
It has also been observed that, in general, the concepts communicated by each smart topic are similar for most cities. That is, almost all cities communicate or do not communicate the same concepts in their tweets. This also demonstrates that there is no brand communication or differentiating positioning strategy on the part of cities, as previous studies have shown with the communication of brand emotional values [19,78].
From the methodological and technical points of view, the work has several limitations that could be addressed in future works. Some of the most relevant ones are the following:
The Sustainability, Technology and Economy ontologies were developed manually by the authors, taking into the account the concepts of these domains that appear more often in the literature on smart cities. However, it would be worthy to employ more exhaustive and standard ontologies developed by international organizations on these fields.
The study is limited to three dimensions of analysis which are certainly relevant in the general conceptualizations of smart cities. However, there are other aspects of smart cities, such as their social or mobility dimensions, that should also be studied.
Technically, the word embedding that was employed in this work does not cover all possible terms appearing in tweets, especially those that refer to very specific technologies. That is why a syntactic step of comparison was also included in the system. A word embedding that is more exhaustive could be used. Moreover, the word embedding is specific to terms in English, so the system currently can only process tweets in this language.

6. Conclusions

One of the main contributions of this study is its methodology. Designed to analyze automatically and semantically the content of the tweets, it is very useful for the analysis of the presence of smart topics in cities’ Twitter accounts. Different word embedding models were tested and the most suitable was selected for the analysis. The three different multi-level ontologies are another contribution of the study.
The study has shown that SCs and STDs in general do not yet strategically communicate their smart potential through their Twitter accounts and therefore, do not include smartness in their branding. Likewise, the cities analyzed do not take full advantage of the potential of Twitter as a tourism marketing and branding tool [28,56,57,60] to create a smart image [16,27,61,62].
The contribution of the study to the theory of place branding is that, in general, cities and destinations do not include their smart aspects in their branding strategy. Therefore, an effort must be made to understand that branding is not only the management and communication of a brand. It must be an entire process of management, in constant evolution, which must include all the key aspects of the identity, reality and development of cities and destinations, and it also has to be able to include aspects and realities of the territory even if they are not part of the previously created brand, such as smart aspects.
The study has also managerial implications. The results of this study are interesting for urban policy-makers and tourism destination marketers to know what is communicated so they may improve their branding including the communication of smart attributes; especially sustainability attributes, which are the least communicated although they really are important attributes for citizens and tourists.
Finally, one of the main limitations of the study is to have analyzed more than one type of Twitter profile, that of the City council, the tourist or the DMOs and the News. Future research should focus different studies on the different Twitter profiles and the different stakeholders they are targeting to ascertain whether smartness is present in city branding or in destination branding.

Author Contributions

Conceptualization, A.H. and A.M.; methodology, J.P. and A.M.; software, A.M.; validation, J.P. and A.M.; formal analysis, J.P.; investigation, J.P.; data curation, J.P.; writing—original draft preparation, A.H.; writing—review and editing, A.H.; supervision, A.H. All authors have read and agreed to the published version of the manuscript.

Funding

This research received no external funding.

Conflicts of Interest

The authors declare no conflict of interest.

References

  1. Encalada, L.; Boavida-Portugal, I.; Ferreira, C.C.; Rocha, J. Identifying tourist places of interest based on digital imprints: Towards a sustainable smart City. Sustainability 2017, 9, 2317. [Google Scholar] [CrossRef] [Green Version]
  2. Kummitha, R.K.R.; Crutzen, N. How do we understand smart cities? An evolutionary perspective. Cities 2017, 67, 43–52. [Google Scholar] [CrossRef]
  3. Datta, A. A 100 smart cities, a 100 utopias. Dialogues Hum. Geogr. 2015, 5, 49–53. [Google Scholar] [CrossRef] [Green Version]
  4. Pencarelli, T. The digital revolution in the travel and tourism industry. Inf. Technol. Tour. 2019, 22, 455–476. [Google Scholar] [CrossRef]
  5. Gretzel, U. Intelligent systems in tourism. A Social Science Perspective. Ann. Tour. Res. 2011, 38, 757–779. [Google Scholar] [CrossRef]
  6. Gretzel, U.; Zhong, L.; Koo, C. Application of smart tourism to cities. Int. J. Tour. Cities 2016, 2, 2. [Google Scholar] [CrossRef]
  7. Mandić, A.; Praničević, D.G. Progress on the role of ICTs in establishing destination appeal. J. Hosp. Tour. Technol. 2019, 10, 791–813. [Google Scholar] [CrossRef]
  8. Boisen, M.; Terlouw, K.; Groote, P.; Couwenberg, O. Reframing, place promotion, place marketing, and place branding-moving beyond conceptual confusion. Cities 2018, 80, 4–11. [Google Scholar] [CrossRef] [Green Version]
  9. Kavaratzis, M.; Hatch, M.J. The dynamics of place brands: An identity-based approach to place branding theory. Mark. Theory 2013, 13, 69–86. [Google Scholar] [CrossRef]
  10. Abella, A.; Ortiz-de-Urbina-Criado, M.; De-Pablos-Heredero, C. A methodology to design and redesign services in smart cities based on the citizen experience. Inf. Polity 2019, 24, 183–197. [Google Scholar] [CrossRef]
  11. Neuhofer, B.; Buhalis, D.; Ladkin, A. Smart technologies for personalized experiences: A case study in the hospitality domain. Electron. Mark. 2015, 25, 243–254. [Google Scholar] [CrossRef]
  12. Wang, K.; Lin, C.L. The adoption of mobile value-added services: Investigating the influence of IS quality and perceived playfulness. Manag. Serv. Qual. Int. J. 2012, 22, 184–208. [Google Scholar] [CrossRef]
  13. Lamsfus, C.; Martin, D.; Alzua-Sorzabal, A.; Torres-Manzanera, E. Smart Tourism Destinations: An Extended Conception of Smart Cities Focusing on Human Mobility. In Information and Communication Technologies in Tourism 2015; Springer International Publishing: New York, NY, USA, 2015; pp. 363–375. [Google Scholar]
  14. Xu, H.; Zhu, W. Evaluating the impact mechanism of citizen participation on citizen satisfaction in a smart city. Environ. Plan. B Urban Anal. City Sci. 2020. [Google Scholar] [CrossRef]
  15. Boes, K.; Buhalis, D.; Inversini, A. Conceptualising smart tourism destination dimensions. In Information and Communication Technologies in Tourism; Tussyadiah, I., Inversini, A., Eds.; Springer International Publishing: New York, NY, USA, 2015; pp. 391–403. [Google Scholar]
  16. Buonincontri, P.; Micera, R. The experience co-creation in smart tourism destinations: A multiple case analysis of European destinations. Inf. Technol. Tour. 2016, 16, 285–315. [Google Scholar] [CrossRef]
  17. Molinillo, S.; Anaya-Sánchez, R.; Morrison, A.M.; Coca-Stefaniak, J.A. Smart city communication via social media: Analysing residents’ and visitors’ engagement. Cities 2019, 94, 247–255. [Google Scholar] [CrossRef]
  18. Casais, B.; Monteiro, P. Residents’ involvement in city brand co-creation and their perceptions of city brand identity: A case study in Porto. Place Brand. Public Dipl. 2019, 15, 229–237. [Google Scholar] [CrossRef]
  19. Jabreel, M.; Huertas, A.; Moreno, A. Semantic analysis and the evolution towards participative branding: Do locals communicate the same destination brand values as DMOs? PLoS ONE 2018, 13, e0206572. [Google Scholar] [CrossRef]
  20. Lee, W.; Gretzel, U. Designing persuasive destination websites: A mental imagery processing perspective. Tour. Manag. 2012, 33, 1270–1280. [Google Scholar] [CrossRef] [Green Version]
  21. Morgan, N.J.; Pritchard, A.; Piggott, R. Destination branding and the role of the stakeholders: The case of New Zealand. J. Vacat. Mark. 2003, 9, 285–299. [Google Scholar] [CrossRef]
  22. Lucarelli, A. Place branding as urban policy: The (im)political place branding. Cities 2018, 80, 12–21. [Google Scholar] [CrossRef]
  23. Oliveira, E. Place branding as a strategic spatial planning instrument: A theoretical framework to branding regions with references to northern Portugal. J. Place Manag. Dev. 2016, 9, 47–72. [Google Scholar] [CrossRef]
  24. Ballantyne, D.; Aitken, R. Branding in B2B markets: Insights from the service-dominant logic of marketing. J. Bus. Ind. Mark. 2007, 22, 363–371. [Google Scholar] [CrossRef]
  25. Aitken, R.; Campelo, A. The four Rs of place branding. J. Mark. Manag. 2011, 27, 913–933. [Google Scholar] [CrossRef]
  26. Binkhorst, E.; Den Dekker, T. Agenda for co-creation tourism experience research. J. Hosp. Mark. Manag. 2009, 18, 311–327. [Google Scholar] [CrossRef]
  27. Neuhofer, B.; Buhalis, D.; Ladkin, A. Conceptualising technology enhanced destination experiences. J. Destin. Mark. Manag. 2012, 1, 36–46. [Google Scholar] [CrossRef]
  28. Boes, K.; Buhalis, D.; Inversini, A. Smart tourism destinations: Ecosystems for tourism destination competitiveness From Smart Cities to Smart Tourism Destinations: Ecosystems for tourism destination competitiveness. Int. J. Tour. Cities 2016, 2, 108–124. [Google Scholar] [CrossRef]
  29. Gretzel, U.; Werthner, H.; Koo, C.; Lamsfus, C. Conceptual foundations for understanding smart tourism ecosystems. Comput. Hum. Behav. 2015, 50, 558–563. [Google Scholar] [CrossRef]
  30. Chan, C.S.; Peters, M.; Pikkemaat, B. Investigating visitors’ perception of smart city dimensions for city branding in Hong Kong. Int. J. Tour. Cities 2019, 5, 620–638. [Google Scholar] [CrossRef]
  31. Baggio, R.; Micera, R.; Del Chiappa, G. Smart tourism destinations: A critical reflection. J. Hosp. Tour. Technol. 2020, 11, 407–423. [Google Scholar] [CrossRef]
  32. Wang, D.; Park, S.; Fesenmaier, D.R. The role of smartphones in mediating the touristic experience. J. Travel Res. 2012, 51, 371–387. [Google Scholar] [CrossRef] [Green Version]
  33. Wang, D.; Li, X.R.; Li, Y.M. China’s “smart tourism destination” initiative: A taste of the service-dominant logic. J. Destin. Mark. Manag. 2013, 2, 59–61. [Google Scholar] [CrossRef]
  34. Errichiello, L.; Marasco, A. Tourism innovation-oriented public-private partnerships for smart destination development. In Knowledge Transfer to and within Tourism: Academic, Industry and Government Bridges; Scott, M., De Martino, M., Van Niekerk, M., Eds.; Emerald Publishing: Bingley, UK, 2017; pp. 147–166. [Google Scholar]
  35. Femenia-Serra, F.; Ivars-Baidal, J.A. Do smart tourism destinations really work? The case of Benidorm. Asia Pac. J. Tour. Res. 2021, 26, 365–384. [Google Scholar] [CrossRef]
  36. Marine-Roig, E. Online travel reviews: A massive paratextual analysis. In Analytics in Smart Tourism Design: Concepts and Methods; Xiang, Z., Fesenmaier, D.R., Eds.; Springer: Berlin/Heidelberg, Germany, 2017; pp. 179–202. ISBN 978-3-319-44262-4. [Google Scholar]
  37. Buhalis, D.; Amaranggana, A. Smart Tourism Destinations. In Information and Communication Technologies in Tourism 2014; Springer International Publishing: New York, NY, USA, 2014; pp. 553–564. [Google Scholar]
  38. Eichelberger, S.; Peters, M.; Pikkemaat, B.; Chan, C.S. Entrepreneurial ecosystems in smart cities for tourism development: From stakeholder perceptions to regional tourism policy implications. J. Hosp. Tour. Manag. 2020, 45, 319–329. [Google Scholar] [CrossRef]
  39. Kim, J.; Fesenmaier, D.R. Measuring emotions in real time: Implications for tourism experience design. J. Travel Res. 2015, 54, 419–429. [Google Scholar] [CrossRef]
  40. Wang, X.; Li, X.R.; Zhen, F.; Zhang, J.H. How smart is your tourist attraction?: Measuring tourist preferences of smart tourism attractions via a FCEM-AHP and IPA approach. Tour. Manag. 2016, 54, 309–320. [Google Scholar] [CrossRef]
  41. Khan, M.S.; Woo, M.; Nam, K.; Chathoth, P.K. Smart city and smart tourism: A case of Dubai. Sustainability 2017, 9, 2279. [Google Scholar] [CrossRef] [Green Version]
  42. Del Vecchio, P.; Mele, G.; Ndou, V.; Secundo, G. Creating value from Social Big Data: Implications for Smart Tourism Destinations. Inf. Process. Manag. 2018, 54, 847–860. [Google Scholar] [CrossRef]
  43. Hunter, W.C. The social construction of tourism online destination image: A comparative semiotic analysis of the visual representation of Seoul. Tour. Manag. 2016, 54, 221–229. [Google Scholar] [CrossRef]
  44. Grebosz-Krawczyk, M. Place branding (r) evolution: The management of the smart city’s brand. Place Brand. Public Dipl. 2021, 17, 93–104. [Google Scholar] [CrossRef]
  45. Qin, M.; Tang, C.H.H.; Jang, S.S.; Lehto, X. Mobile app introduction and shareholder returns. J. Hosp. Tour. Manag. 2017, 31, 173–180. [Google Scholar] [CrossRef]
  46. Gretzel, U.; Sigala, M.; Xiang, Z.; Koo, C. Smart tourism: Foundations and developments. Electron. Mark. 2015, 25, 179–188. [Google Scholar] [CrossRef] [Green Version]
  47. Kavaratzis, M. From city marketing to city branding: Towards a theoretical framework for developing city brands. Place Brand. Public Dipl. 2004, 1, 58–73. [Google Scholar] [CrossRef]
  48. Ma, W.; Schraven, D.; de Bruijne, M.; De Jong, M.; Lu, H. Tracing the origins of place branding research: A bibliometric study of concepts in use (1980–2018). Sustainability 2019, 11, 2999. [Google Scholar] [CrossRef] [Green Version]
  49. Kavaratzis, M. Place branding: A review of trends and conceptual models. Mark. Rev. 2005, 5, 329–342. [Google Scholar] [CrossRef]
  50. Kavaratzis, M. From “necessary evil” to necessity: Stakeholders’ involvement in place branding. J. Place Manag. Dev. 2012, 5, 7–19. [Google Scholar] [CrossRef]
  51. Vuignier, R. Place branding & place marketing 1976–2016: A multidisciplinary literature review. Int. Rev. Public Nonprofit Mark. 2017, 14, 447–473. [Google Scholar]
  52. Kolotouchkina, O.; Seisdedos, G. Place branding strategies in the context of new smart cities: Songdo IBD, Masdar and Skolkovo. Place Brand. Public Dipl. 2018, 14, 115–124. [Google Scholar] [CrossRef]
  53. Sánchez-Martínez, M.; Barceló Ugarte, T.; Cabezuelo Lorenzo, F. The smart city apps as the core of place branding strategy: A comparative analysis of innovation cases. Zer 2017, 22, 119–135. [Google Scholar]
  54. A onez, T.; Alves, G.C.; Blanco-González, A. Strategic management of city brands and its influence in smart cities. In Sustainable Smart Cities; Springer International Publishing: New York, NY, USA, 2017; pp. 79–88. [Google Scholar]
  55. Del Chiappa, G.; Baggio, R. Knowledge transfer in smart tourism destinations: Analyzing the effects of a network structure. J. Destin. Mark. Manag. 2015, 4, 145–150. [Google Scholar] [CrossRef]
  56. Zhou, L.; Wang, T. Social media: A new vehicle for city marketing in china. Cities 2014, 37, 27–32. [Google Scholar] [CrossRef]
  57. Molinillo, S.; Liébana-Cabanillas, F.; Anaya-Sánchez, R.; Buhalis, D. DMO online platforms: Image and intention to visit. Tour. Manag. 2018, 65, 116–130. [Google Scholar] [CrossRef]
  58. Buhalis, D.; Law, R. Progress in information technology and tourism management: 20 years on and 10 years after the internet: The state of eTourism research. Tour. Manag. 2008, 29, 609–623. [Google Scholar] [CrossRef] [Green Version]
  59. Jacobsen, J.K.S.; Munar, A.M. Tourist information search and destination choice in a digital age. Tour. Manag. Perspect. 2012, 1, 39–47. [Google Scholar] [CrossRef]
  60. Xiang, Z.; Gretzel, U. Role of social media in online travel information search. Tour. Manag. 2010, 31, 179–188. [Google Scholar] [CrossRef]
  61. Tussyadiah, I.P.; Fesenmaier, D.R. Mediating Tourist Experiences. Access to Places via Shared Videos. Ann. Tour. Res. 2009, 36, 24–40. [Google Scholar] [CrossRef]
  62. Buhalis, D.; Foerste, M. Journal of Destination Marketing & Management SoCoMo marketing for travel and tourism: Empowering co-creation of value. J. Destin. Mark. Manag. 2015, 4, 151–161. [Google Scholar] [CrossRef]
  63. Chan, C.S. Which city theme has the strongest local brand equity for Hong Kong: Green, creative or smart city? Place Brand. Public Dipl. 2019, 15, 12–27. [Google Scholar] [CrossRef]
  64. Zvolska, L.; Lehner, M.; Voytenko Palgan, Y.; Mont, O.; Plepys, A. Urban sharing in smart cities: The cases of Berlin and London. Local Environ. 2019, 24, 628–645. [Google Scholar] [CrossRef] [Green Version]
  65. Wang, K.Y.; Wu, C.-M. Building an Intelligent government, intelligent city, and intelligent citizenry through ICTs: Smart city innovations in New Taipei City, Taiwan. Public Adm. Inf. Technol. 2016, 11, 259–278. [Google Scholar]
  66. Sharifi, A. A critical review of selected smart city assessment tools and indicator sets. J. Clean. Prod. 2019, 233, 1269–1283. [Google Scholar] [CrossRef]
  67. Mahizhnan, A. Smart cities: The Singapore case. Cities 1999, 16, 13–18. [Google Scholar] [CrossRef]
  68. Nam, T.; Pardo, T.A. Conceptualizing Smart City with dimensions of technology, people, and institutions. In Proceedings of the 12th Annual International Digital Government Research Conference: Digital Government Innovation in Challenging Times, University of Maryland, College Park, MD, USA, 12–15 June 2011; pp. 282–291. [Google Scholar]
  69. Lombardi, P.; Giordano, S.; Farouh, H.; Yousef, W. Modelling the smart city performance. Innov. Eur. J. Soc. Sci. Res. 2012, 25, 137–149. [Google Scholar] [CrossRef]
  70. Albino, V.; Berardi, U.; Dangelico, R.M. Smart cities: Definitions, dimensions, performance, and initiatives. J. Urban Technol. 2015, 22, 3–21. [Google Scholar] [CrossRef]
  71. van Winden, W.; van den Buuse, D. Smart city pilot projects: Exploring the dimensions and conditions of scaling up. J. Urban Technol. 2017, 24, 51–72. [Google Scholar] [CrossRef]
  72. Giffinger, R.; Fertner, C.; Kramar, H.; Meijers, E. City-Ranking of European Medium-Sized Cities; Centre of Regional Science, Vienna University of Technology: Vienna, Austria, 2007. [Google Scholar]
  73. Mikolov, T.; Sutskever, I.; Chen, K.; Corrado, G.S.; Dean, J. Distributed representations of words and phrases and their compositionality. In Advances in Neural Information Processing Systems; Curran Associates Inc.: Red Hook, NY, USA, 2013; pp. 3111–3119. [Google Scholar]
  74. Giffinger, R.; Gudrun, H. Smart cities ranking: An effective instrument for the positioning of the cities? ACE Archit. City Environ. 2010, 4, 7–26. [Google Scholar]
  75. Sevin, E. Places going viral: Twitter usage patterns in destination marketing and place branding. J. Place Manag. Dev. 2013, 6, 227–239. [Google Scholar] [CrossRef]
  76. Koo, C.; Joun, Y.; Han, H.; Chung, N. The Impact of Potential Travellers’ Media Cultural Experiences. In Information and Communication Technologies in Tourism 2014; Xiang, Z., Tussyadiah, I., Eds.; Springer International Publishing: New York, NY, USA, 2013; pp. 579–592. [Google Scholar]
  77. Shen, S.; Sotiriadis, M.; Zhang, Y. The influence of smart technologies on customer journey in tourist attractions within the smart tourism management framework. Sustainability 2020, 12, 4157. [Google Scholar] [CrossRef]
  78. Jabreel, M.; Moreno, A.; Huertas, A. Semantic comparison of the emotional values communicated by destinations and tourists on social media. J. Destin. Mark. Manag. 2017, 6, 170–183. [Google Scholar] [CrossRef]
Figure 1. System architecture.
Sustainability 13 10953 g001
Figure 2. Sustainability ontology.
Sustainability 13 10953 g002
Figure 3. Technology ontology.
Sustainability 13 10953 g003
Figure 4. Economy ontology.
Sustainability 13 10953 g004
Table 1. Tweets assigned to the concepts of each ontology.
CityRetrieved TweetsLabels Assigned to SustainabilityLabels Assigned to TechnologyLabels Assigned to Economy
Cardiff 15,38249 (0.32%)274 (1.78%)179 (1.16%)
Gent 698417 (0.24%)31 (0.44%)74 (1.06%)
Ljubljana 661783 (1.25%)66 (1%)100 (1.51%)
Aberdeen 25,4861192 (4.66%)764 (3%)761 (2.96%)
Cork 5175172 (3.3%)167 (3.23%)345 (6.53%)
Eindhoven 91719 (2.07%)60 (6.53%)287 (26.82%)
Leicester 30,347809 (2.66%)1389 (4.57%)821 (2.69%)
Portsmouth 7398376 (5.06%)240 (3.24%)223 (3%)
Tampere 47433 (6.89%)276 (53.8%)148 (28.14%)
Table 2. Comparison of the rankings of the Smart Cities project.
CityPosition in SustainabilityLabels Assigned to SustainabilityPosition in EconomyLabels Assigned to Economy
Cardiff 6049 (0.32%)13179 (1.16%)
Gent 4817 (0.24%)1974 (1.06%)
Ljubljana 383 (1.25%)8100 (1.51%)
Aberdeen 671192 (4.66%)10761 (2.96%)
Cork 66172 (3.3%)2345 (6.53%)
Eindhoven 3919 (2.07%)6287 (26.82%)
Leicester 64809 (2.66%)3821 (2.69%)
Portsmouth 63376 (5.06%)7223 (3%)
Tampere 1233 (6.89%)29148 (28.14%)
Table 3. Sustainability labels assignment.
Concept/CityCardiffGentLjubljanaAberdeenCorkEindhovenLeicesterPortsmouthTampereTotal
Sustainability 1 12
Clean_Energy 62 129 29
Hydroelectric_plants 6 6
natural_gas111 1043 16301166
biofuels1 7 13113
geothermal 1 113
solar_panels 53944 25
wind_farm 3 1 4
Resource_Management 0
Land_Management 1 1
Natural_Resources1 87 10 26
Wildlife_Resources9 23 432 77
Water_Resources 312 11 17
Mineral_Resources2 1 3
environmental_sustainability15674422588710195
climate_change 114120 51142130
global_warming 114120 51142130
carbon_emissions2623917 731714170
deforestation2 94 3 18
desertification 0
waste_disposal31218126116656 436
wastewater_treatment 371 139
recycling31162328 357218 1231
radioactive_waste 3 3
Solid_Waste_Management 112 13 26
Total49178311921721980937633
Table 4. Technology labels assignment.
Concept/CityCardiffGentLjubljanaAberdeenCorkEindhovenLeicesterPortsmouthTampereTotal
Technology55 3342910312101
Smart_City 74 176187
Artificial_Intelligence, AI 111 1518
Drones1 4133 214
Predictive_Analysis 1 1 57
Wireless_Connectivity2 41 1 210
Broadband_Connectivity4 124 54432119
Infrastructure1 1646 113288
Robotics57 9211 2054
Machine_Learning 66
Monitoring2 7210 35143136
Sensors 2 1 25
Deep_Learning 11
Data_Science 11
Traffic_Congestion11 1635253 432804948
Privacy 1 23
Lidar 55
Biometrics 11
Cybersecurity1 33 11110
User_Experience 11
Chatbot 33
Smart_Grid 1 113
Social_Networking21011181615266627591204
Big_Data 3 1 4
Virtual_Reality2 2 4 1 9
Cloud_Computing6521711 259 75
Modeling1 23 6
ICT 2 2
Accessibility2 51 3 11
Wi-fi, wifi2132415 12110 194
Intelligence_BI 1 1
Information_Technology 47 29 40
Total2743166764167601389240276
Table 5. Economy labels assignment.
Concept/CityCardiffGentLjubljanaAberdeenCorkEindhovenLeicesterPortsmouthTampereTotal
partnership201710161962642411405
alliance8 16221 4610 148
joint_venture8 15618 437 133
customer_satisfaction6 16610 11411 208
smartphones1255283191322179
economy5113611 542 110
technological_innovation511154196416237209
creativity2510341054569401713358
innovation1271431286391320197
entrepreneurship1 126303614314125
android_apps, iphone_app56152033532805215479
social_entrepreneurship 1 252 5 15
engagement 3617 4 259
efficiency 8311714245
operational_efficiencies 131 8 13
marketing 4 4
leadership 210 21 15
governance 32 210118
collaboration1 1611013932
branding116424181474290
environmental_friendliness 112 22 8
crm 1 1
smart_cards 1 81 10
ppp, 3p, p3 1 1
apps1112 1 17
philanthropy1 11 2 5
inclusiveness1 4 1 6
dynamism6 2 19
coworking_space 1 1
startup 222211744
human_resources 2 2
personalization 1 12
Total17974100761345287821223148
Publisher’s Note: MDPI stays neutral with regard to jurisdictional claims in published maps and institutional affiliations.

