Abstract
Landslides occur frequently in Lixian County, China, and land use has changed significantly in recent decades. We obtained land use data for the years 1980, 2000, and 2018, as well as three landslide susceptibility maps from a Random Forest model. Agricultural land, low coverage grassland, water area, and urban, rural and other construction land were prone to landslides. Landslide susceptibility was low in areas of woodland, moderate and high coverage grassland, bare rock land, desert and tundra. Areas with high landslide susceptibility were mainly located in the catchment of the study region, and a 2.61% decrease in high landslide susceptibility areas over the 38-year period was primarily driven by changes in agricultural and rural land. By contrast, a 1.42% increase in low landslide susceptibility areas over the 38-year period was driven by changes in moderate and high coverage woodland and moderate coverage grassland. There is a need for effective management measures to be implemented because areas with high landslide susceptibility are still present. We also found that human aggregations, or the absence of these, vary in their effects on the areas of Lixian County most susceptible to landslides.
1. Introduction
Landslides are dangerous geological disasters that can result in substantial losses of life and property and affect social development [1,2]. Land use can have a substantial effect on landslide susceptibility (LS) by altering slope stability [3]. There is thus a need to evaluate the relationship between land use and LS at large temporal scales.
Vegetation cover can modify slope stability in various ways. Plant roots provide mechanical reinforcement to the slope; however, the strength of plants roots can vary [4]. For example, tree roots in the soil increase the macroscopic stiffness of the soil mass, which redistributes the forces of the hillslope through small deformations [5]. This can reduce the risk of various natural hazards such as shallow landslides, seepage, and soil creep [6]. By contrast, grasses have shorter and weaker roots. Although grassland can slow the erosion of surface soil, its effect on the stability of the deep soil layer is weak. Therefore, under the same influencing condition [7,8,9,10], larger and deeper landslides occur more frequently in areas with grassland and less frequently in areas with woodland [11]. Previous studies have shown that areas with denser vegetation are considered less susceptible to landslides compared with areas with little or no vegetation [12,13].
Human activities are closely related to the occurrence of natural disasters [14,15,16,17]. There is a positive correlation between vegetation coverage and landslide activity in the Kumaun Himalayas because vegetation tends to be limited to areas with unstable slopes [14]. Human activities affect landslides through agriculture, water area construction, urban and rural construction, and industrial and mining activities.
Artificial planting and the expansion of agricultural land may increase susceptibility to landslides because of the loosening of slope material stemming from initial planting, as well as the loosening of soil, surface runoff, and groundwater infiltration associated with subsequent farming and irrigation activities [18]. Steep-slope agriculture in hilly and mountainous areas increases slope instability and is exacerbated by natural and anthropogenic factors [19]. Excavation and construction activities also play a significant role in the occurrence of landslides, and a series of engineering measures, such as excavation and blasting, alters the natural stress state of slopes, leading to slope instability [18,20]. When the weak structural surface at the bottom of the slope is excavated and exposed, the slope is in a suspended state and loses its primary equilibrium [11], which increases LS.
Most LS studies assume that slope instability processes are time-invariant [21,22,23,24]. However, given that land use can vary substantially over narrow temporal scales, research on the relationship between landslides and land use in different periods is needed. For example, one previous study examined the effect of changes in land use on the susceptibility to shallow landslides over 58 years [25]. Another study characterizing changes in land use in Calabria, Italy from 1921 to 2010 showed that agricultural practices and land management reduced LS [26].
Lixian County lies within the administrative region of southern Gansu Province, and geological disasters occur frequently in this region. It is currently in the deformation stage, and large-scale landslides can occur at any time because of rainfall, earthquakes, human activities, and other factors. Thus, analyses previously conducted to characterize historical LS are no longer appropriate for the current development needs of this region. Previous studies on LS in Lixian county were all based on a single time point, so this paper has a novel guiding significance for this region.
In this study, land use in the study area was classified into agricultural land, woodland, grassland, water area; urban, rural, construction land; and unused land. Agricultural land was divided into paddy field and rainfed cropland according to the presence of water resources and irrigation method. Woodland was divided into forest land (coverage of more than 30%), shrubwood (coverage of more than 40% and plant height less than 2 m), sparse woodland (coverage of less than 15%), other woodland (unformed woodlands), and all types of gardens and nurseries with artificial plants. Grassland was divided into high coverage grassland (coverage greater than 50%), moderate coverage grassland (coverage of 20–50%), and low coverage grassland (coverage of 5–20%). The water area was divided into river, reservoir, and bottomland. Urban, rural and construction land was divided into urban land, rural land, and other construction land for factories and mines, large industrial areas, quarries, and other special land. Unused land was divided into desert, tundra; bare land with soil surface cover; and bare rock land with rock surface cover.
Land use has changed drastically in Lixian County since 1980, when it was an economically undeveloped region through economic reform led by the government. Construction land and bare land appeared for the first time in the region in 2000, and bare rock land first appeared in 2018. Therefore, land use data from three evenly separated years (1980, 2000, and 2018) were used to analyze how land use changes have affected the occurrence of landslides and the LS zoning map. The types of land use in 1990 were the same as in 2000, the only difference being a small area variation between them. The same problem existed from 2010 to 2018, so the land use data of 1990 and 2010 have little research significance and are excluded from our study.
Based on the situation described above, the aims of this study were to (i) obtain the LS zoning map based on the land use data in different years, (ii) determine the land use types most likely to cause landslides, and (iii) make recommendations for land use reconstruction in different LS zones to aid economic development and disaster prevention in the study area.
2. Study Area
The study area is located in Longnan City, in the southeast of Gansu Province (Figure 1) with latitudes between 33°35′ E and 34°31′ E and longitudes between 104°37′ E and 105°36′ E. The area covers approximate 4299.92 km2. Lixian County has a temperate continental monsoon climate with obvious dry and wet seasons. Precipitation is concentrated in summer, which has a significant impact on landslides and vegetation coverage. From 1980 to 2018, the average annual precipitation decreased by approximately 100 mm. Therefore, the average annual precipitation for each year analyzed was used in the LS assessment.
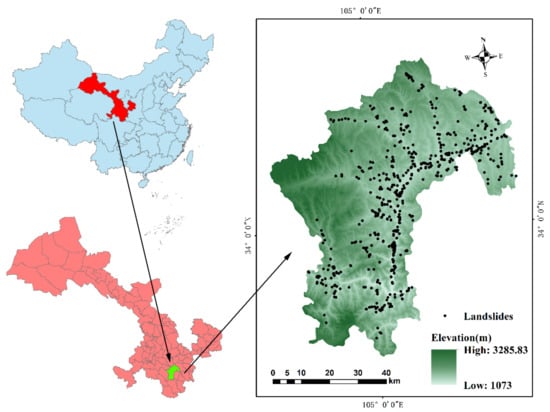
Figure 1.
Location of the study area.
Topographically, the highest altitude is 3312 m, the lowest is 1080 m, and the terrain slopes from northwest to southeast. Lixian County is located in the Hualixi and Indosinian fold belt (collision zone between Yangtze plate and North China plate) in the middle Qinling Mountains. The representative lithologies are coal bearing sedimentary rock, limestone interclastic rock, sand and conglomerates of huge thickness. The distribution of land use at different elevations is shown in Figure 2, and the area of each land use category is shown in Table 1. Grassland area is always the largest primary category, and rainfed cropland is the largest secondary category in Lixian County.

Figure 2.
Elevation distribution of land use in different years: (a) 1980, (b) 2000, (c) 2018.

Table 1.
Proportion of various types of land-use area.
3. Materials
3.1. Historical Landslide Records
Based on the historical landslide inventory map created by the professional geological team of Chinese Academy of Sciences, our field surveys and previous studies [27,28,29], we obtained a total of 590 historical landslide records in the study area. The main characteristics of these landslides are small scale with high frequency, and the distribution is uniform and wide. Most of these landslides have occurred in unstable areas that are vulnerable to landslides. As a typical landslide in Moshi Village, Lixian County, the Lanshan landslide may occur again at any time. If it slides again, it would not only block traffic on Provincial Road 306 but also the water of the Western Han Shui River, which could form a barrier lake and affect the safety of more than 3000 residents and their property [30].
3.2. Landslide Influencing Factor
The terrain of the study area is mountainous and hilly, the slopes are steep, the land use types are diverse, and there is a developed water system. The structure of the rock and soil is broken, and geological disasters such as landslides are common in the area because of earthquakes, rainfall, and other factors [27]. Based on these circumstances and expert advice, apart from land use, 11 factors included elevation, slope, aspect, distance to roads and rivers, plan curvature, profile curvature, geology, precipitation, solar radiation, and earthquake magnitude were selected for the study, and are commonly used in LS assessment [31,32,33,34,35,36].
Some factors were obtained based on a digital elevation model (DEM) with a resolution of 12.5 m, such as elevation, slope, aspect, plan curvature, profile curvature, and solar radiation. Vector data of the road and river network, and text data of the earthquake magnitude in Lixian County, were obtained after digitizing relevant materials. The annual precipitation and geological grid data of Gansu Province were obtained from the National Meteorological Administration and the Gansu Institute of Geology. The map of three-phase land use in this paper was obtained by photo-interpretation of aerial photos through the Institute of Remote Sensing and Digital Earth (http://rs.ceode.ac.cn/, accessed on 15 September 2020) supplemented by local field data.
Although we made a preliminary selection of the influence factors, the process of selecting influence factors was still somewhat subjective. Some factors have a low correlation with landslide, or there may be certain noisy factors that reduce the predictive capability of models [37]. Thus, Variance Inflation Factor (VIF) values and Pearson correlation coefficients were used to analyze the independence of each factor and the correlations between independent and dependent factors, respectively. The results are shown in Table 2. The Pearson coefficient values of these factors were all >0, which means they had predictive significance. However, VIF values of plan curvature and profile curvature were >10, indicating high multicollinearity with other factors. Given the importance of curvature in LS assessment, we added the curvature factor and performed the VIF analysis again, and the VIF values of plan curvature and profile curvature were still >10. Therefore, these three factors were excluded from analyses in this study. The factors finally selected in this paper are shown in Figure 3.
Table 2.
Thematic factor correlation test.
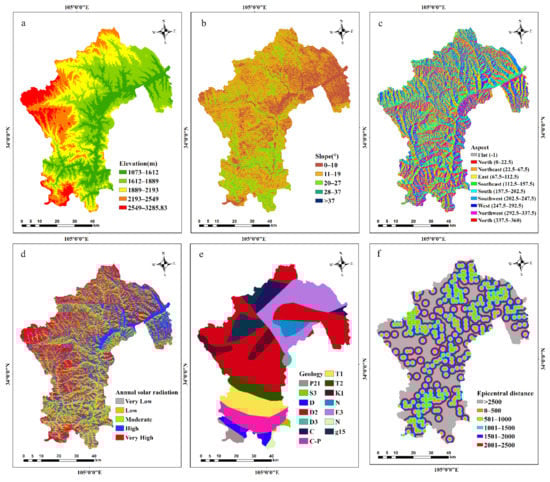
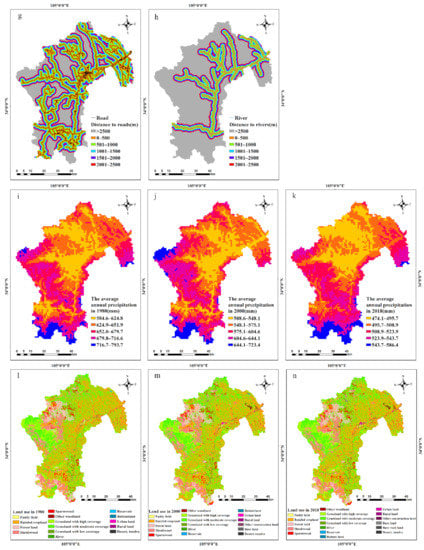
Figure 3.
Predictor layers used for landslide susceptibility (LS) mapping: (a) Elevation, (b) Slope, (c) Slope aspect, (d) Annual solar radiation, (e) Geology: P21, S3 (Middle Cambrian and Upper Silurian Series of Lower Paleozoic), D, D2, D3 (Upper Paleozoic Devonian and its Middle Upper Series), C, CP (Upper Paleozoic Carboniferous and lower Permian), T1, T2, K1 (Mesozoic Middle Upper Triassic and Upper Cretaceous), N, E3, N3 (Tertiary, Paleogene and Neogene of the Cenozoic), g15 (Indosinian granites), (f) Epicentral distance, (g) Distance to roads, (h) Distance to rivers, (i) average annual precipitation in 1980, (j) average annual precipitation in 2000, (k) average annual precipitation in 2018, (l) land use in 1980, (m) land use in 2000, (n) land use in 2018.
4. Method
4.1. Factor Feature Extraction by Frequency Ratio Algorithm
In order to construct a quantitative LS map, it is necessary to extract the characteristics of the evaluation factors. The Frequency Ratio (FR) algorithm was used to analyze and calculate the impact of each subcategory of condition factors on the landslide [33,38] as shown by Equation (1) [39].
% Landslide (+) represents the ratio of landslide points in each subcategory of evaluation factors and % domain (+) represents the ratio of the total area occupied by the sub-categories of each factor.
4.2. Random Forest Model
In this paper, we used the Random Forest (RF) model for the LS assessment. We used the sklearn module in Python3.6 for modeling. Our development environment was Jupyter Notebook.
The core idea of RF model is to create a large number of decision trees, which are then combined to calculate a classification by randomly replacing the resampled data and altering the predictor sets over different tree induction processes. The bootstrapping method was used, and a large number of unrelated decision tree models () were constructed for training [40,41]. The classification () of different training sets was obtained through sample training. Therefore, the RF model can be expressed by Equation (2):
The CART tree follows the Gini coefficient minimization principle. According to the probability of (), randomly selected objects are assigned to class at node , and the probability that the classified objects actually belong to class is estimated to be . Under this rule, the estimated probability of misclassification is shown in Equation (3):
5. Results and Discussion
5.1. LS Map Construction
The LS maps are shown in Figure 4. The natural breaks method was used to divide the susceptibility assessment map into five categories: very low (VL), low (L), moderate (M), high (H), and very high (VH) susceptibility. The map shows LS, and the LS values range from 0 (low LS) to 1 (high LS). Higher susceptibility values correspond to greater landslide risk. Areas with VH and H susceptibility across all three years were located in the main stream of the Western Han River Basin in the eastern part of the study area. Areas with VL and L susceptibility were located in the high elevation area in the western portion of the study area. These maps show the susceptibility values of Lixian County, which were higher in the eastern and northern regions and lower in the western and southern regions.

Figure 4.
LS map based on land use data from (a) 1980, (b) 2000, and (c) 2018.
The relative percentage of the different LS classes is shown in Figure 5. From 1980 to 2018, areas with higher LS gradually decreased, while areas with lower LS increased from 1980 to 2018 but decreased from 2000 to 2018.
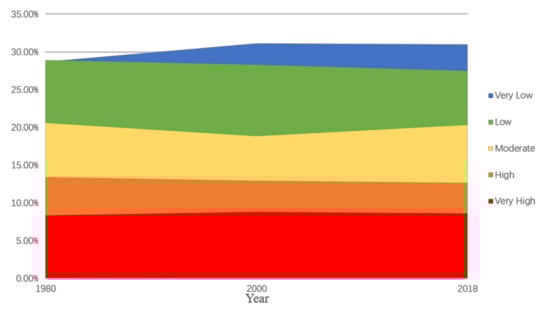
Figure 5.
Relative percentage of the different LS classes.
In this study, we used Receiver Operating Curves (ROC) to evaluate the results (Figure 6). The AUC values of three results were all >0.8, indicating that they all had good predictive ability.

Figure 6.
ROC curve test results.
5.2. Relationship between Different Land Use Types and LS
The results of quantification of factors by Equation (1) are shown in Table 3. Land use types with an FR value > 1 might increase LS.
Table 3.
Spatial relationship between conditioning factors and landslides based on the FR method.
In 1980, the FR values of urban land, rural land, river, grassland with low coverage, bottomland, and rainfed cropland were >1, and there were no landslides in paddy field, other woodland, reservoir, and desert, tundra in 1980.
In 2000, the FR values of rural land, urban land, bottomland, river, bare land, low coverage grassland, paddy field, rainfed cropland, and other woodland were >1. and there were no landslides in reservoirs, other construction land, and desert, tundra in 2000.
In 2018, the FR values of river, rural land, paddy fields, other woodland, bottomland, low coverage grassland, rainfed cropland, and urban land were >1, and there were no landslides in reservoirs, bare land, bare rock land and desert, tundra.
The FR value alone is likely insufficient for explaining the relationship between land use and landslides. Therefore, we superimposed LS maps with land use grid data to determine the distribution and area of various land use in different LS areas.
Almost all paddy fields were in areas with VH susceptibility (Figure 7a); however, they made up a small portion of VH susceptibility area. Therefore, paddy fields did not affect LS zoning because the area of paddy fields was low. Lixian county is an administrative area dominated by primary industries, and rainfed cropland was evenly and widely distributed in five LS areas. Rainfed cropland covered more than 50% of H and VH susceptibility areas. However, the largest part of rainfed cropland is located in the L susceptibility area, and we suspect that this is related to farming conditions, such as the gentle slope (0–27°), the soil (cinnamon soil, brown soil, and loessal soil), and the extensive moderate coverage grassland [42].

Figure 7.
Distribution (histogram) and area (broken line graph) of (a) Agricultural land; (b) Forest land; (c) Grassland; (d) Water area (e) Urban, Rural Residential and Industrial and Mining land and (f) Unused land in areas differing in LS.
Forest land, shrubwood and sparse woodland were in areas with VL and L susceptibility (Figure 7b), and they had low FR values. The area of these three woodlands decreased from VL to VH susceptibility areas. Overall, forest land had the strongest ability to stabilize the slope because of the higher density of land cover and the greater strength of tree roots [43]. Shrubwood had a higher surface coverage (>40%) and facilitated slope consolidation to a greater degree compared with sparse woodland, which, although characterized by stronger roots, was lower in coverage (<15%).
However, other woodland with artificial afforestation had a higher FR value. Because the process of soil removal during artificial planting can create conditions favorable for landslides, 43.84% of the other woodland area appeared in areas with VH susceptibility in 1980. In 2000 and 2018, the role of vegetation in fixing slope began to appear via the formation of other woodlands, and the LS index decreased. Therefore, the proportion of other woodland in areas with VH and H susceptibility also decreased, and the largest area of other woodlands occurred in areas with M susceptibility.
The FR value was higher for high and moderate coverage grassland, and most of high and moderate coverage grassland was classified as VL and L susceptibility areas (Figure 7c). However, the FR value was higher for low coverage grassland, and most low coverage grassland was located in VH and H susceptibility areas. There was a negative correlation between grassland coverage and the occurrence of landslides in the study area. Thus, the probability of landslides occurrence increased as grassland coverage decreased.
Water area was classified as VH and H susceptibility areas from 1980 to 2018 (Figure 7d). Unlike rivers and bottomlands concentrated in areas with VH susceptibility, reservoirs were mainly distributed in areas with H susceptibility because humans tend to select sites for reservoir construction in areas where landslides are less likely to occur. Although the area of reservoirs in Lixian County is small, construction activities still had a negative effect on the local slope. Previous studies have suggested that soils on both sides of catchments are typically the most vulnerable to landslides [44]. Consequently, water infiltration, the lateral erosion of the bank slope by rivers, and the excavation of the slope during the construction of channels and reservoirs in Lixian County, were inevitable slopes unstable and increasing the LS index.
Urban land and rural land area were mainly located in VH and H susceptibility areas (Figure 7e). According to our survey, urban land was mainly concentrated in the VH susceptibility zone, and the landslide distribution around urban land was denser compared with other types of land use [45]. This was verified by the pattern of overlap between the VH and H susceptibility zones and the population grid data (1-km resolution) (Figure 8). Because of continuous vibrations stemming from traffic, the growing real estate interest in the area, and the development of urban land [46,47], construction activities such as slope cutting and blasting will be expanded [48], and vegetation coverage will decrease. Rural land was observed in all types of susceptibility zones. The selection of rural land sites is closely tied to the location of agricultural land and grazing land; thus, the distribution of rural land in Lixian County is relatively scattered.

Figure 8.
Overlay map of 2018 population network data (1-km resolution) and LS zoning.
Because of backward economic level, other construction land did not appear until 2000. In 2000, other construction land was classified as VH susceptibility area, and in 2018, the largest part of other construction land was found in the L susceptibility area. We considered that other construction land is prone to landslides. However, because of the low coverage of other construction land in the study area, no landslides have been recorded in this land use type. However, the occurrence of landslides in nearby areas is related to construction activities.
The least common land use type in Lixian County is unused land. The FR values indicated that LS was lower in unused land. Desert, tundra was the only unused land use type present in the study area during all three years, and was classified as a VL susceptibility region during all three years (Figure 7f). Bare land was only present in 2000 and 2018, and was mostly classified as an L susceptibility region. Bare rock land only appeared in 2018, and was classified as a VL susceptibility region. The regions of desert, tundra and bare rock land are high elevation, sparsely populated, and characterized by single land use categories, lithological structures and stable slopes. Thus, the LS index of these land use types was low. Bare land was mainly distributed in middle and low elevation areas, and was mainly derived from the conversion of abandoned agricultural land. Compared with desert, tundra and bare rock land, bare land had a higher LS index.
5.3. Relationship between Land Use Change and LS Change
After analyzing land use maps from different periods and different susceptibility areas, we characterized the effect of land use changes on various types of susceptibility zoning in 1980, 2000, and 2018. We used pixels as mapping units, and changes in land use area were determined by the number of pixels that increased and decreased (Figure 9).

Figure 9.
Changes in land use area (a) from 1980 to 2000 and (b) from 2000 to 2018.
From 1980 to 2000, rainfed cropland, forest land, shrubwood, moderate coverage grassland, and rural land had significant changes (Figure 9a and Figure 10). Areas with VL susceptibility increased by 8.36%, and were dominated by forest land, shrubwood, and moderate coverage grassland. Areas with L susceptibility decreased by 2.22%, which corresponded with a marked decrease in forest land and moderate coverage grassland. Areas with M susceptibility decreased by 8.48%, and were dominated by rainfed cropland, shrubwood and moderate coverage grassland. Areas with H susceptibility decreased by 3.63%, which was related to a large reduction in the area of rainfed cropland and secondarily by moderate coverage grassland, but the reduction in these land use types was far less compared with that of rainfed cropland. Areas with VH susceptibility increased by 5.74%, which corresponded to an increase in the area of moderate coverage grassland and rural land.

Figure 10.
Changes in the area of LS from 1980 to 2000 (left) and from 2000 to 2018 (right).
From 2000 to 2018, rainfed cropland, forest land, shrubwood and moderate coverage grassland had significant changes in the study area (Figure 9b). Forest land and shrubwood decreased significantly, but rainfed cropland and high coverage grassland area increased; thus, the number of pixels that changed in areas with VL susceptibility during this period was low (decrease of 0.40%). Areas with L susceptibility decreased by 2.87% because of the decrease in shrubwood and moderate coverage grassland. Areas with M susceptibility increased by 7.60%, which was associated with changes in forest land, shrubwood, and moderate coverage grassland. Areas with H susceptibility decreased by 2.01%, which mainly stemmed from reduction in rainfed cropland and moderate coverage grassland. The 2.67% decrease in the area of VH susceptibility was mainly related to the significant reduction in the area of rainfed cropland.
In conclusion, land use change was largely driven by changes in areas of rainfed cropland, forest land, shrubwood, and moderate coverage grassland. Changes in areas with low LS index were dominated by grassland (with moderate coverage) and woodland (forest land and shrubwood). We speculate that changes in woodland play a more important role in VL susceptibility areas, and changes in grassland play a more important role in L susceptibility areas. Changes in areas with higher LS index were mainly affected by rainfed cropland. Among them, from 1980 to 2000, changes in rural land had a greater impact on VH susceptibility areas.
We found that areas with VL and M susceptibility changed the most from 1980 to 2000. During this period, the proportion of land with VH susceptibility increased, and this increase was lower than change in the proportion of land with VL susceptibility. Areas with L, M, and H susceptibility decreased over this period. Between 2000 and 2018, only the area of M susceptibility increased significantly; the area of all other LS categories decreased. Therefore, although areas with low LS index in the study area increased from 1980 to 2018, this did not occur to the optimal level; that is, low the LS index area significantly expanded, while the area of high LS index significantly decreased.
5.4. Several Areas Showing Significant Land Use Changes
According to Figure 11, there were four areas with significant changes in the map from 1980 to 2000, and three areas from 2000 to 2018.

From 1980 to 2000, areas with higher average annual precipitation in the western part of the study area increased, which provided a suitable growth environment for both natural woodland and grassland. As a result, the area of forest land, shrubwood, and moderate coverage grassland increased, and these land use types were derived from rainfed cropland and grassland with moderate and high coverage (Figure 12a, which resulted in an increase in areas with very low and low susceptibility.

Figure 12.
Concrete changes in LS zoning and land use in the study area from 1980 to 2000: (a) western region, (b) northeastern region, (c) eastern region, and (d) southern region.
Significant land use changes in the northeastern portion of the study area included the conversion area of rainfed cropland to other woodlands for artificial afforestation or garden cultivation, and the conversion of moderate coverage grassland to shrubwood and low coverage grassland (Figure 12b). Because of soil erosion caused by slope reclamation and rainfed cropland weathering on the slope, afforestation and garden nursery cultivation were not sufficient for stabilizing the slope; instead, the appearance of these new land use types made the slope more unstable. Most of the area was converted into low coverage grassland because of decreases in precipitation. Consequently, the LS of some areas changed from M to H and from H to VH.
In the eastern part of the study area (Figure 12c), rainfed cropland was converted into rural land and other woodland, and some paddy fields were converted into urban land. Moderate coverage grassland was converted into rainfed cropland and vice versa in different places, and the area over which moderate coverage grassland was converted to rainfed cropland was larger. Parts of the river were occupied by urban lands and paddy fields. The main reason for these changes in land use was human activities; specifically, urban and rural land expanded to areas surrounding rainfed cropland. After rainfed cropland became occupied by urban and rural land, moderate coverage grassland was converted to rainfed cropland. The construction and reclamation activities damaged the slope, which led to an increase in the area of VH and H susceptibility.
In the southern portion of the study area (Figure 12d), precipitation increased slightly and the area of high coverage grassland increased. Therefore, the LS of some areas in this region changed from M and L to VL and L. As the increase in precipitation was also conducive to agricultural activities, a small part of the high coverage grassland in the southern part of the study area was converted to rainfed cropland, which increased the LS in the surrounding areas.
From 2000 to 2018, the annual average precipitation decreased significantly in the western portion of the study area (Figure 13a), which was the main reason for the decrease in shrubwood. Therefore, shrubwood was converted to moderate and high coverage grassland, which is suitable for an arid climate. The ability of roots to stabilize the slope weakened, the LS index decreased, and areas with VL, L, and M susceptibility in this region were converted into L, M, and H susceptibility areas.

Figure 13.
Concrete changes in LS zoning and land use in the study area from 2000 to 2018: (a) western region, (b) central region, and (c) southern region.
In the central of the study region, rainfed cropland, shrubwood and sparse woodland were converted to other construction land and bare land (Figure 13b), and the vegetation coverage in these areas also decreased at the same time. The soil fertility of rainfed cropland decreased after long-term cultivation, and some of the abandoned rainfed cropland was converted to bare land. The weathering degree of the slope in this region was the greatest. Some industrial and mining facilities were built in this area to promote economic development, which led to an increase in the LS index.
Significant land use changes occurred in the river basin of the eastern portion of the study area (Figure 13c), which is suitable for human habitation. As the human population has increased, paddy field, rainfed cropland, shrubwood, sparse woodland, other woodland, and low coverage grassland have been transformed into bare land, urban and rural, industrial and mining, and residential land. In the river basin, some bottomland and river areas were replaced by agricultural land. To protect people’s property in this region, the construction of disaster prevention and mitigation facilities around urban and rural areas has increased, and this has resulted in a decrease in the LS index.
5.5. Suggestions for Future Land Use Planning
According to the above analysis, the LS index decreased when land use types were converted to woodland and grassland, and the coverage of natural vegetation increased. When land use types were converted to other woodland, urban and rural residential land, and rainfed cropland dominated by human activities, the LS index increased. However, in high population density regions, the area of urban and rural residential land, and industrial and mining construction land, increased. Nevertheless, the LS index decreased in these regions because of an increase in the number of disaster prevention and mitigation facilities.
Landslide prevention and control measures have improved as societal development and urban construction have increased in recent decades. Some agricultural areas have been converted to urban areas, and some to woodland and grassland per China’s grain-for-green policy [49]. However, LS index is still high in this region because of the continuous and rapid growth of urban and rural land use. We suggest that part of land in areas with L and M susceptibility index can be repurposed into areas conducive to human settlement, which would meet the need for urban development, while minimizing disturbance to the slope caused by construction.
In conclusion, we found that the effects of human activities on landslides in Lixian County can be two-sided. Areas with a high LS index decreased because the construction of disaster prevention and mitigation facilities increased in areas with larger concentrations of humans. In other areas, the LS index increased because of slope modification associated with human activities.
From 1980 to 2018, areas with VH and H susceptibility decreased, indicating that LS has decreased. This is an encouraging pattern. However, from 2000 to 2018, areas of VL and L susceptibility decreased, and areas of M susceptibility increased. There is thus a need for additional land use modification to aid the control of landslide disasters and ensure that areas with low LS index continue to increase and areas with high LS index continue to decrease.
The conversion of rainfed cropland to woodland and high coverage grassland is the best approach for ensuring slope stability. However, excessive reductions in rainfed cropland could compromise economic development in the study area, resulting in soil loss, and have negative short-term effects on the agricultural landscape and the local ecological environment [50]. Therefore, new farming sites should not be established on slopes, especially in areas that appear geologically stable when dry but are highly vulnerable to collapse when saturated, such as alluvial, loess, sedimentary, or volcanic units [51]. We thus suggest that new farming sites be established in areas close to rural settlements in regions with VL and L susceptibility index. However, because VL and L susceptibility areas are sparsely populated, high in altitude, low in annual precipitation, and abundant in bare rock and desert, tundra, inappropriate reclamation and cultivation activities could also have negative effects on the ecological environment in this area. Thus, in addition to shifting the location of rainfed cropland, irrigation methods used in VH and H susceptibility zones need to be improved to minimize the negative effects of rainfed cropland on the slope, such as drip irrigation. The advantage is to minimize the amount of water required per unit area in a local manner, that is, directly to the root system, thus significantly reducing the amount of leakage and enhancing slope stability.
Moderate coverage grassland accounted for more than 30% of the total area in Lixian County. Based on the precipitation data, the climate is relatively dry, and annual precipitation has decreased from 1980 to 2018. Thus, areas with moderate coverage grassland and grass species with high reproductive capacity, drought tolerance, and poor resistance to cultivation should be protected in areas of unused land to facilitate slope consolidation.
6. Conclusions
In this paper, the impact of various land use types in Lixian County to LS zoning from 1980 to 2018 was analyzed. The low elevation valley area of Lixian County shows high LS index, and susceptibility index is steadily decreasing. Although areas with low LS index increased over the 38-year period, low LS areas decreased from 2000 to 2018, indicating that there is still a need for effective management measures to be implemented in the future.
Changes in the areas of VL and L susceptibility in the study area were dominated by moderate coverage grassland, forest land, and shrubwood, and changes of VH and H susceptibility zones were mainly affected by rainfed cropland and rural land.
In Lixian County, human activities had both positive and negative effects on the occurrence of landslides. In areas with high concentrations of humans, LS index decreased when human activities were focused on disaster prevention and mitigation increase. However, LS index increased in other such areas because of the negative effects of human activities on slope reconstruction.
Paddy field, rainfed cropland, low coverage grassland, rivers, reservoirs, bottomland, urban and rural land, and other construction land were prone to landslides. LS index was low in forest land, shrubwood, sparse woodland, moderate and high coverage grassland, bare rock land and desert, tundra. The effects of other woodland and bare land on landslides will likely change over time because of human activities.
We suggest that the rate of urban and rural residential expansion in areas with high LS index be slowed, and the construction of disaster prevention facilities around densely populated areas be accelerated. The vegetation coverage of Lixian County also needs to improve, such as the implementation of certain protection measures for moderate coverage grassland and the cultivation of grass species with greater survival capabilities.
Author Contributions
Conceptualization, methodology, programming development, validation, investigation, writing—original Draft, and visualization, J.L.; resources, data curation, writing—review & editing, and funding acquisition, Z.W.; supervision, project administration, and funding acquisition, H.Z. All authors have read and agreed to the published version of the manuscript.
Funding
This study was supported by eight subjects, the National Key R&D Program of China (No. 2018YFC1503206); the Science for Earthquake Resilience of China Earthquake Administration (XH20059); the National Natural Science Foundation of China (No. 41761006); the Key Project of Gansu Natural Science Foundation (20JR5RA097); the Key R & D Program of Gansu Province (No. 20YF8FA105); the Self-listed Program of Forestry and Grassland Bureau of Gansu Province (2019kj122); the Project of Gansu Natural Science Foundation (20JR5RA093) and the Basic Scientific research Foundation of China Earthquake Administration (2020IESLZ04).
Institutional Review Board Statement
Not applicable.
Informed Consent Statement
Not applicable.
Acknowledgments
The authors kindly thank the following institute: Lanzhou Geotechnical and Seismological Research Institute for preparing the research site and conditions, and the Institute of Remote Sensing and Digital Earth Chinese Academy of Sciences for preparing the remote sensing data.
Conflicts of Interest
The authors declare no competing interests.
References
- Bălteanu, D.; Micu, M.; Jurchescu, M.; Malet, J.-P.; Sima, M.; Kucsicsa, G.; Dumitrică, C.; Petrea, D.; Mărgărint, M.C.; Bilaşco, Ş.; et al. National-scale landslide susceptibility map of Romania in a European methodological framework. Geomorphology 2020, 371, 107432. [Google Scholar] [CrossRef]
- Aditian, A.; Kubota, T.; Shinohara, Y. Comparison of GIS-based landslide susceptibility models using frequency ratio, logistic regression, and artificial neural network in a tertiary region of Ambon, Indonesia. Geomorphology 2018, 318, 101–111. [Google Scholar] [CrossRef]
- Reichenbach, P.; Busca, C.; Mondini, A.C.; Rossi, M. The influence of land use change on landslide susceptibility zonation: The Briga catchment test site (Messina, Italy). Environ. Manag. 2014, 54, 1372–1384. [Google Scholar] [CrossRef] [PubMed] [Green Version]
- Schmidt, K.M.; Roering, J.J.; Stock, J.D.; Dietrich, W.E.; Montgomery, D.R.; Schaub, T. The variability of root cohesion as an influence on shallow landslide susceptibility in the Oregon Coast Range. Can. Geotech. J. 2001, 38, 995–1024. [Google Scholar] [CrossRef]
- Cohen, D.; Schwarz, M. Tree-root control of shallow landslides. Earth Surf. Dyn. 2017, 5, 451–477. [Google Scholar] [CrossRef] [Green Version]
- Mao, Z.; Yang, M.; Bourrier, F.; Fourcaud, T. Evaluation of root reinforcement models using numerical modelling approaches. Plant Soil 2014, 381, 249–270. [Google Scholar] [CrossRef]
- Quesada-Román, A.; Fallas-López, B.; Hernández-Espinoza, K.; Stoffel, M.; Ballesteros-Cánovas, J.A. Relationships between earthquakes, hurricanes, and landslides in Costa Rica. Landslides 2019, 16, 1539–1550. [Google Scholar] [CrossRef]
- Díaz, S.R.; Cadena, E.; Adame, S.; Dávila, N. Landslides in Mexico: Their occurrence and social impact since 1935. Landslides 2019, 17, 379–394. [Google Scholar] [CrossRef]
- Froude, M.J.; Petley, D.N. Global fatal landslide occurrence from 2004 to 2016. Nat. Hazards Earth Syst. Sci. 2018, 18, 2161–2181. [Google Scholar] [CrossRef] [Green Version]
- Quesada-Román, A. Landslide risk index map at the municipal scale for Costa Rica. Int. J. Disaster Risk Reduct. 2021, 56, 102144. [Google Scholar] [CrossRef]
- Yi, J.; Yu, B.; Chen, J.; Huang, J.; Jing, G. Analysis of landslides susceptibility to different land use patterns in Enshi. In Proceedings of the 2010 2nd Conference on Environmental Science and Information Application Technology, Wuhan, China, 17–18 July 2010. [Google Scholar]
- Glade, T. Landslide occurrence as a response to land use change: A review of evidence from New Zealand. Catena 2003, 51, 297–314. [Google Scholar] [CrossRef] [Green Version]
- Gökceoglu, C.; Aksoy, H. Landslide susceptibility mapping of the slopes in the residual soils of the Mengen region (Turkey) by deterministic stability analyses and image processing techniques. Eng. Geol. 1996, 44, 147–161. [Google Scholar] [CrossRef]
- Haigh, M.J.; Rawat, J.S.; Rawat, M.S.; Bartarya, S.K.; Rai, S.P. Interactions between forest and landslide activity along new highways in the Kumaun Himalaya. For. Ecol. Manag. 1995, 78, 173–189. [Google Scholar] [CrossRef]
- Guzzetti, F.; Reichenbach, P.; Cardinali, M.; Galli, M.; Ardizzone, F. Probabilistic landslide hazard assessment at the basin scale. Geomorphology 2005, 72, 272–299. [Google Scholar] [CrossRef]
- Van Den Eeckhaut, M.; Poesen, J.; Vandekerckhove, L.; Van Gils, M.; Van Rompaey, A. Human-environment interactions in residential areas susceptible to landsliding: The Flemish Ardennes case study. Area 2010, 42, 339–358. [Google Scholar] [CrossRef]
- Bruschi, V.M.; Bonachea, J.; Remondo, J.; Gómez-Arozamena, J.; Rivas, V.; Barbieri, M.; Capocchi, S.; Soldati, M.; Cendrero, A. Land Management Versus Natural Factors in Land Instability: Some Examples in Northern Spain. Environ. Manag. 2013, 52, 398–416. [Google Scholar] [CrossRef] [PubMed]
- Li, Y.; Wang, X.; Mao, H. Influence of human activity on landslide susceptibility development in the Three Gorges area. Nat. Hazards 2020, 104, 2115–2151. [Google Scholar] [CrossRef]
- Tarolli, P.; Pijl, A.; Cucchiaro, S.; Wei, W. Slope instabilities in steep cultivation systems: Process classification and opportunities from remote sensing. Land Degrad. Dev. 2020, 32, 1368–1388. [Google Scholar] [CrossRef]
- Singh, R.; Umrao, R.K.; Singh, T.N. Stability evaluation of road-cut slopes in the Lesser Himalaya of Uttarakhand, India: Conventional and numerical approaches. Bull. Eng. Geol. Environ. 2013, 73, 845–857. [Google Scholar] [CrossRef]
- Xiao, T.; Yin, K.; Yao, T.; Liu, S. Spatial prediction of landslide susceptibility using GIS-based statistical and machine learning models in Wanzhou County, Three Gorges Reservoir, China. Acta Geochim. 2019, 38, 654–669. [Google Scholar] [CrossRef]
- Yao, J.; Qin, S.; Qiao, S.; Che, W.; Chen, Y.; Su, G.; Miao, Q. Assessment of Landslide Susceptibility Combining Deep Learning with Semi-Supervised Learning in Jiaohe County, Jilin Province, China. Appl. Sci. 2020, 10, 5640. [Google Scholar] [CrossRef]
- Tanyu, B.F.; Abbaspour, A.; Alimohammadlou, Y.; Tecuci, G. Landslide susceptibility analyses using Random Forest, C4.5, and C5.0 with balanced and unbalanced datasets. Catena 2021, 203, 105355. [Google Scholar] [CrossRef]
- Rabby, Y.W.; Hossain, M.B.; Abedin, J. Landslide susceptibility mapping in three Upazilas of Rangamati hill district Bangladesh: Application and comparison of GIS-based machine learning methods. Geocarto Int. 2021, 1–27. [Google Scholar] [CrossRef]
- Persichillo, M.G.; Bordoni, M.; Meisina, C. The role of land use changes in the distribution of shallow landslides. Sci. Total Environ. 2017, 574, 924–937. [Google Scholar] [CrossRef]
- Gariano, S.L.; Petrucci, O.; Rianna, G.; Santini, M.; Guzzetti, F. Impacts of past and future land changes on landslides in southern Italy. Reg. Environ. Chang. 2017, 18, 437–449. [Google Scholar] [CrossRef]
- Feng, W.; Zhao, F.; Chen, X.; Tang, Y.; Zhang, L. Susceptibility Evalution of Geological Disasters Along the Fault Zone of Lixian to Luojiabu. J. Gansu Sci. 2021, 33, 88–96. [Google Scholar]
- Liu, J. Study on the Regularity and Mechanism of Landslides in Longnan Mountain Area. Master’s Thesis, Lanzhou University, Gansu, China, 2020. [Google Scholar]
- Xu, X. Risk Evaluation of Geological Disasters in Longnan City based on GIS. Master’s Thesis, Shaanxi Normal University, Shaanxi, China, 2015. [Google Scholar]
- Ma, Z.; Zhang, Y.; Liu, X.; Zheng, L. Characteristics and stability analysis of lanshan landslide in lixian county under coupling action of earthquake and rainfall. Sci. Technol. Eng. 2016, 16, 34–40. [Google Scholar]
- Psomiadis, E.; Papazachariou, A.; Soulis, K.; Alexiou, D.-S.; Charalampopoulos, I. Landslide Mapping and Susceptibility Assessment Using Geospatial Analysis and Earth Observation Data. Land 2020, 9, 133. [Google Scholar] [CrossRef]
- Chawla, A.; Pasupuleti, S.; Chawla, S.; Rao, A.C.S.; Sarkar, K.; Dwivedi, R. Landslide Susceptibility Zonation Mapping: A Case Study from Darjeeling District, Eastern Himalayas, India. J. Indian Soc. Remote Sens. 2019, 47, 497–511. [Google Scholar] [CrossRef]
- Huang, F.; Cao, Z.; Guo, J.; Jiang, S.-H.; Li, S.; Guo, Z. Comparisons of heuristic, general statistical and machine learning models for landslide susceptibility prediction and mapping. Catena 2020, 191, 104580. [Google Scholar] [CrossRef]
- Gorsevski, P.V.; Brown, M.K.; Panter, K.; Onasch, C.M.; Simic, A.; Snyder, J. Landslide detection and susceptibility mapping using LiDAR and an artificial neural network approach: A case study in the Cuyahoga Valley National Park, Ohio. Landslides 2015, 13, 467–484. [Google Scholar] [CrossRef]
- Abedini, M.; Ghasemian, B.; Shirzadi, A.; Shahabi, H.; Chapi, K.; Pham, B.T.; Bin Ahmad, B.; Tien Bui, D. A novel hybrid approach of Bayesian Logistic Regression and its ensembles for landslide susceptibility assessment. Geocarto Int. 2018, 34, 1427–1457. [Google Scholar] [CrossRef]
- Nourani, V.; Pradhan, B.; Ghaffari, H.; Sharifi, S.S. Landslide susceptibility mapping at Zonouz Plain, Iran using genetic programming and comparison with frequency ratio, logistic regression, and artificial neural network models. Nat. Hazards 2013, 71, 523–547. [Google Scholar] [CrossRef]
- Chen, W.; Xie, X.; Peng, J.; Shahabi, H.; Hong, H.; Bui, D.T.; Duan, Z.; Li, S.; Zhu, A.X. GIS-based landslide susceptibility evaluation using a novel hybrid integration approach of bivariate statistical based random forest method. Catena 2018, 164, 135–149. [Google Scholar] [CrossRef]
- Berhane, G.; Kebede, M.; Alfarah, N.; Hagos, E.; Grum, B.; Giday, A.; Abera, T. Landslide susceptibility zonation mapping using GIS-based frequency ratio model with multi-class spatial data-sets in the Adwa-Adigrat mountain chains, northern Ethiopia. J. Afr. Earth Sci. 2020, 164, 103795. [Google Scholar] [CrossRef]
- Park, S.-J.; Lee, C.-W.; Lee, S.; Lee, M.-J. Landslide Susceptibility Mapping and Comparison Using Decision Tree Models: A Case Study of Jumunjin Area, Korea. Remote Sens. 2018, 10, 1545. [Google Scholar] [CrossRef] [Green Version]
- Achour, Y.; Pourghasemi, H.R. How do machine learning techniques help in increasing accuracy of landslide susceptibility maps? Geosci. Front. 2020, 11, 871–883. [Google Scholar] [CrossRef]
- Sun, D.; Wen, H.; Wang, D.; Xu, J. A random forest model of landslide susceptibility mapping based on hyperparameter optimization using Bayes algorithm. Geomorphology 2020, 362, 107201. [Google Scholar] [CrossRef]
- Brian, B.; Łukasz, P. Post-landslide soil and vegetation recovery in a dry, montane system is slow and patchy. Ecosphere 2021, 12, e03346. [Google Scholar] [CrossRef]
- Waldron, L.J. The Shear Resistance of Root-Permeated Homogeneous and Stratified Soil. Soil Sci. Soc. Am. J. 1977, 41, 843–849. [Google Scholar] [CrossRef]
- Chen, L.; Guo, Z.; Yin, K.; Shrestha, D.P.; Jin, S. The influence of land use and land cover change on landslide susceptibility: A case study in Zhushan Town, Xuan’en County (Hubei, China). Nat. Hazards Earth Syst. Sci. 2019, 19, 2207–2228. [Google Scholar] [CrossRef] [Green Version]
- Han, L.; Cai, Q. The influence of land use on landslide is discussed. Soil and Water Conservation Science and Technology in Shanxi 2004, 3, 24–26. [Google Scholar] [CrossRef]
- Spalevic, V.; Barovic, G.; Vujacic, D.; Curovic, M.; Behzadfar, M.; Djurovic, N.; Dudic, B.; Billi, P. The Impact of Land Use Changes on Soil Erosion in the River Basin of Miocki Potok, Montenegro. Water 2020, 12, 2973. [Google Scholar] [CrossRef]
- Sestraș, P.; Bilașco, Ș.; Roșca, S.; Naș, S.; Bondrea, M.; Gâlgău, R.; Vereș, I.; Sălăgean, T.; Spalević, V.; Cîmpeanu, S. Landslides Susceptibility Assessment Based on GIS Statistical Bivariate Analysis in the Hills Surrounding a Metropolitan Area. Sustainability 2019, 11, 1362. [Google Scholar] [CrossRef] [Green Version]
- Zhou, G. Urban construction causes geological environment problems and prevention. West. Resour. 2019, 4, 95–96. [Google Scholar] [CrossRef]
- Gong, P. Consideration on Green Development and Rural Revitalization in Poverty-stricken Areas—Taking Lixian County as an Example. Gansu Agriculture 2020, 10, 90–94. [Google Scholar] [CrossRef]
- Deng, X.; Xu, D.; Zeng, M.; Qi, Y. Landslides and Cropland Abandonment in China’s Mountainous Areas: Spatial Distribution, Empirical Analysis and Policy Implications. Sustainability 2018, 10, 3909. [Google Scholar] [CrossRef] [Green Version]
- Liu, H.X.; Mao, Z.; Wang, Y.; Kim, J.H.; Bourrier, F.; Mohamed, A.; Stokes, A. Slow recovery from soil disturbance increases susceptibility of high elevation forests to landslides. For. Ecol. Manag. 2021, 485, 118891. [Google Scholar] [CrossRef]
Publisher’s Note: MDPI stays neutral with regard to jurisdictional claims in published maps and institutional affiliations. |
© 2021 by the authors. Licensee MDPI, Basel, Switzerland. This article is an open access article distributed under the terms and conditions of the Creative Commons Attribution (CC BY) license (https://creativecommons.org/licenses/by/4.0/).