Article

An E-Commerce Recommendation System Based on Dynamic Analysis of Customer Behavior

by
Farah Tawfiq Abdul Hussien
*,
Abdul Monem S. Rahma
and
Hala B. Abdulwahab
Computer Science Department, University of Technology, Baghdad 10001, Iraq
*
Author to whom correspondence should be addressed.
Sustainability 2021, 13(19), 10786; https://doi.org/10.3390/su131910786
Submission received: 8 August 2021 / Revised: 16 September 2021 / Accepted: 23 September 2021 / Published: 28 September 2021

Abstract

:
The technological development in the devices and services provided via the Internet and the availability of modern devices and their advanced applications, for most people, have led to an increase in the expansion and a trend towards electronic commerce. The large number and variety of goods offered on e-commerce websites sometimes make the customers feel overwhelmed and sometimes make it difficult to find the right product. These factors increase the amount of competition between global commercial sites, which increases the need to work efficiently to increase financial profits. The recommendation systems aim to improve the e-commerce systems performance by facilitating the customers to find the appropriate products according to their preferences. There are lots of recommendation system algorithms that are implemented for this purpose. However, most of these algorithms suffer from several problems, including: cold start, sparsity of user-item matrix, scalability, and changes in user interest. This paper aims to develop a recommendation system to solve the problems mentioned before and to achieve high realistic prediction results this is done by building the system based on the customers’ behavior and cooperating with the statistical analysis to support decision making, to be employed on an e-commerce site and increasing its performance. The project contribution can be shown by the experimental results using precision, recall, F-function, mean absolute error (MAE), and root mean square error (RMSE) metrics, which are used to evaluate system performance. The experimental results showed that using statistical methods improves the decision-making that is employed to increase the accuracy of recommendation lists suggested to the customers.

1. Introduction

E-commerce systems (EC) have witnessed a significant increase in the volume of sales in recent years, especially with the great technological progress and progress in the services provided by the Internet [1,2,3]. This fact led to the appearance of many large companies and the increase in competition between these companies to attract the largest possible number of customers and achieve the highest financial revenues [4,5,6]. This competition is represented in the increasing the number of offered goods, providing offers and discounts, facilitating payment processes, as well as facilitating the process of searching for goods for each customer according to their directions [7,8,9]. One of the ways to facilitate the shopping for the customers is to provide a list that suggests the customer-specific goods based on the customer’s trends, which is known as the recommendation system [10,11]. In this field, many studies have appeared that suggest different ways to build recommendation systems that increase the efficiency of commercial sites. A recommender system, often known as a recommendation system (RS), is a type of information filtering system that attempts to anticipate a customer’s “rating” or “preference” for an item [12,13]. Playlist generators for video and music services, product recommenders for online retailers, content recommenders for social media platforms, and open web content recommenders are all examples of recommender systems in use [14,15]. These systems can work with a single input, such as music, or numerous inputs, such as news, books, and search queries, inside and across platforms. [16,17]. Popular recommender systems for specialized themes, such as restaurants and online dating, are also available [18]. Research papers, experts, collaborators, and financial services have all been explored using recommender systems [19,20].
One of the RSs’ goals is to help customers manage large volumes of data [21,22]. RS boosts EC sales by converting visitors to buyers, displaying new products, cultivating customer loyalty, improving customer happiness, and increasing the probability of a pleased customer returning [23]. RSs are an essential component of the electronic business, according to research, with personalized RSs improving sales by up to 35% through recommended items. [24,25]. As a result, in the E-commerce age, the importance of these systems as one of the techniques for performing person-to-person marketing is increasing by the day [26]. The collaborative filter (CF) is one of the most popular and frequently used recommender systems [27,28], and it is regarded as one of the most important components of successful E-commerce systems [29,30,31]. CF has a number of disadvantages, including a lack of cold-start capability, scalability [32,33], sparsity of the user-item matrix [34,35,36], and the change in consumer preferences over time [37,38]. A cold-start is one of the most significant problems with CF, which happens when the system has not gathered enough data to generate trustworthy suggestions [39].
Because of the organization’s shifting expectations for utilizing and implementing RSs, measuring their success is difficult [40,41]. User happiness is, in general, the most telling indicator. Although a heuristic method cannot be used to calculate user happiness, it is feasible to assess RS performance based on how effectively they tackle common concerns [42,43,44].
The main challenges include:
  • Cold-start: the RS does not operate optimally when there is inadequate information or metadata available. It is always available to new and returning users [45,46].
  • Data sparsity: this is caused by the fact that consumers only want to rate a few things [47,48].
  • Scalability: due to the rapid expansion of e-commerce sites, scalability issues have become much more prevalent [49,50].
  • Diversity: rather than differences, suggestions are focused on overlaps. This limits the user’s exposure to a smaller number of things, and highly relevant specialized items may be ignored [51,52]. The main idea behind specific recommendations is to accurately distinguish items, which are divided into various categories based on the item’s characteristics, and then the recommendation system selects the most appropriate item for the customer from the classified items based on the customer’s focuses and preferences [53,54]. Customers’ behavior data should be supplied when they check in to the Internet in order to correctly know what they enjoy. The basic goal of a recommendation system is to propose something new that meets the user’s wants or preferences for products or information services [55]. One of the most essential functions of a recommendation system is to filter out irrelevant and secondary data from a variety of information sources [56].
Because negative feedback is rarely clearly seen and considering all non-purchased goods equally as negative feedback is unreasonable [57], extracting user preferences from purchase data for the job of purchase prediction is a problem.
Purchases and clicks can be easily retrieved from system logs, but extracting users’ preferences from implicit feedback for purchase prediction is difficult since negative feedback is not clearly seen. [58,59].
The main contributions of the proposed system are:
  • Build an efficient recommender system that solves the previously mentioned problems.
  • Employing the RS in an e-commerce site to improve the recommendation process and facilitate the shopping process for the customers.
  • This is done depending on the customer’s behavior, counting their activities to update their preferences that are changed with time.
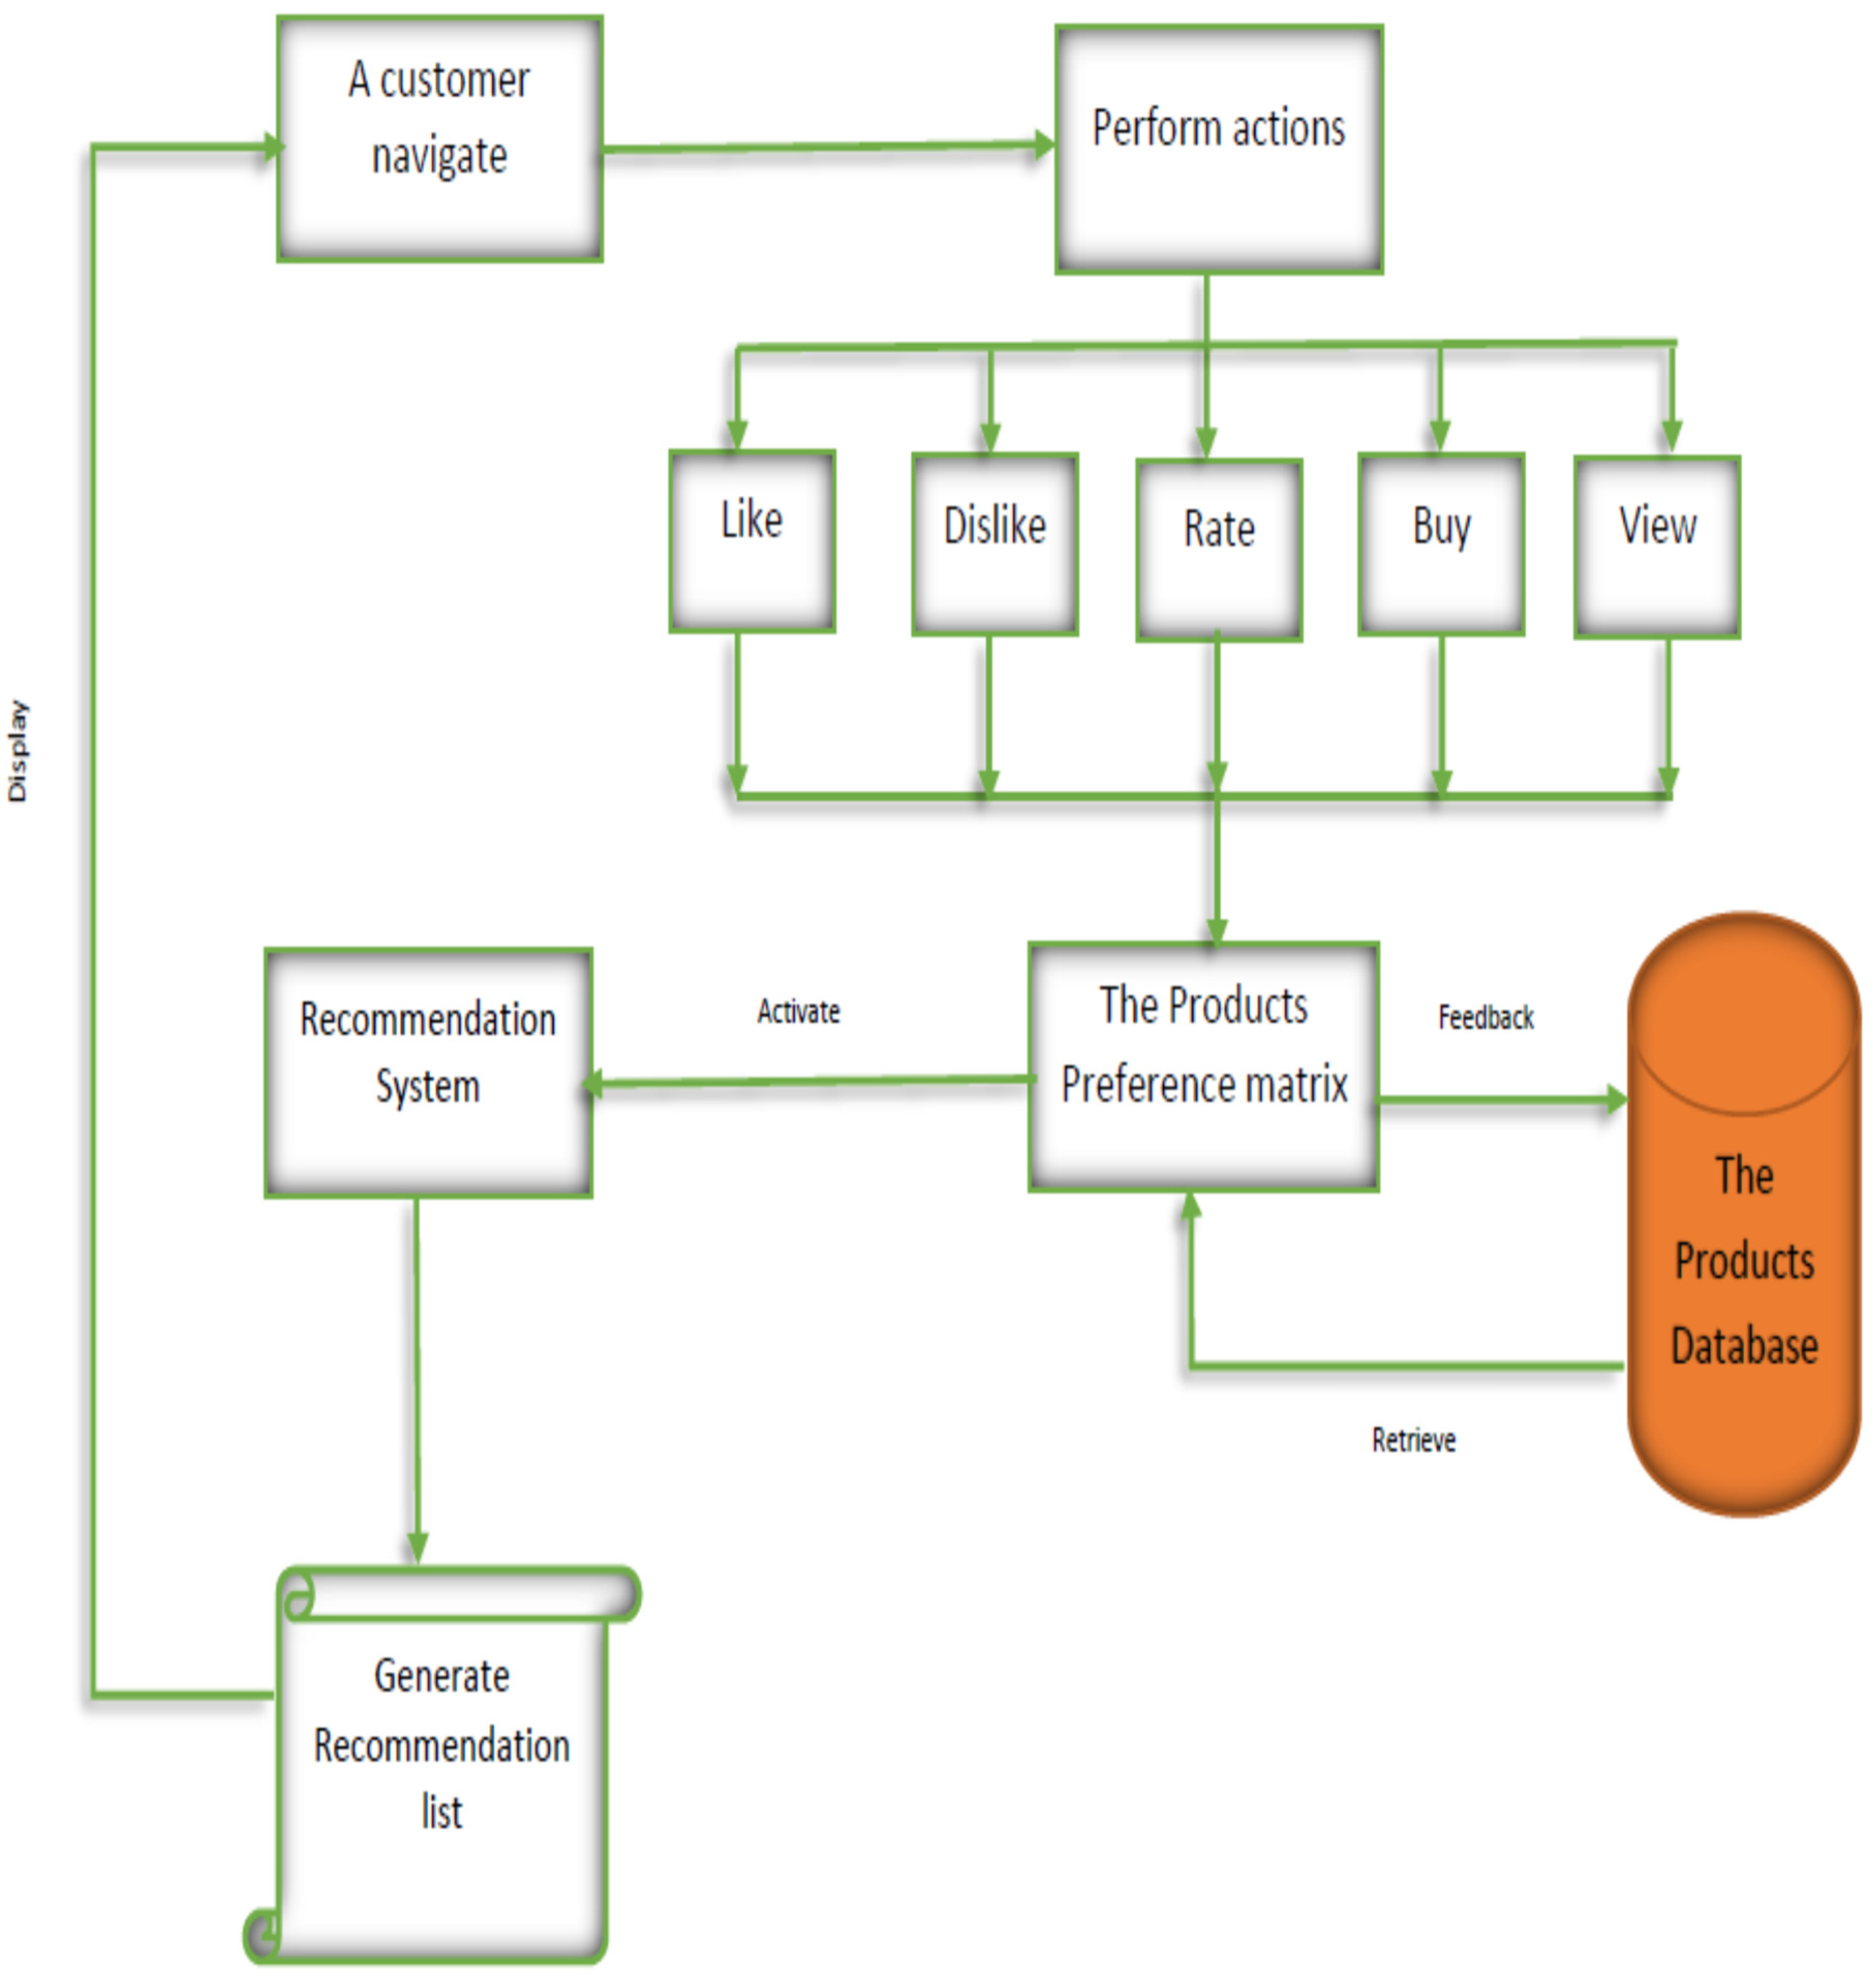
  • Divide the customer’s behaviors into five classes like, dislike, view, rate, and purchase, and distinguish among all these activities while not considering them similar.
  • Depending on statistical methods by employing the real trends of the customers to ensure that the RS lists that will be suggested to the customers are as accurate as possible.
  • The statistical analysis is employed to support decision-making in generating the appropriate RS list for every single client.
  • Creating global and local parameters that are used as counters for the products and the customers’ activities. Connecting between these parameters helps to indicate the customers’ preferences depending on their behavior.
This paper is structured as follows:
Section 2 presents the related work, Section 3 describes the proposed system design, Section 4 shows the experimental results and system evaluation, and Section 5 explains the conclusions and future works.

2. Related Works

Recommendation systems play an important role in increasing e-commerce system performance. Thus, there were various studies about designing different recommendation systems using different approaches. Some of them focused on customer behavior; here are some of these studies.
Yajie Hu, Mitsunori Ogihara 2011 [60] presented a new approach. The system’s purpose is to recommend songs that are favored by the user, are new to the user’s ear, and match the user’s listening pattern by assessing the freshness of a song using the “Forgetting Curve” and evaluating “preferences” using the user log. The user’s listening pattern is examined in order to determine the user’s level of interest in the next song.
Analyzing this paper depending on the RS challenges shows that when the cold-start problem is not solved for a new customer, a random song is picked. Increasing the number of songs scalability and the diverse preferences of the customers (diversity) led to increased time complexity due to the need for lots of calculations to be performed.
Mojtaba Salehi 2013 [61], based on user behavior, this study offered an effective recommendation. Because people express their thoughts implicitly based on product attributes, a preference matrix was developed to capture user preferences based on product attributes. In order to increase the quality of recommendations, weighted association rules are also utilized to discover these patterns. The most significant addition is the creation of a user behavior-based recommendation approach that identifies users’ interests based on implicit product attribute ratings. Furthermore, this method employs a sequential purchase pattern to improve the quality of recommendations. This paper concentrates on solving sparsity and employing the product’s features to measure the similarity among them, without giving attention to the rest problems of the RSs mentioned before. Depending on the product’s similarity is not enough to ensure giving a good recommendation according to the customer preferences, as not all users are similar in their trends.
Duo Lin, Su Jingtao 2015 [62], a revolutionary recommender method for comprehensive online shopping sites has been proposed. The client’s contextual information, such as access, click, read, and buy data, is used to determine the preferred degree for each item; goods with higher preference degrees are subsequently recommended to the customer. This paper concentrated on only the purchase and click actions, considering that the rest of the actions, such as browsing, rating, and searching, are not important enough to be considered. It succeeded in only solving the sparsity problem without covering the other problems.
Bo Wang et al., 2018 [63], a personalized recommendation algorithm based on the implicit feedback of a user (BUIF).
BUIF takes into account not only the user’s purchasing behavior but also their comparison and item sequences. The user’s buy behavior, comparison behavior, and item-sequences are retrieved from the user’s behavior log; the user’s similarity is computed using purchase behavior and comparison behavior, and the item’s similarity is determined by extending word-embedding to item-embedding. Using similarity measures can be used to solve the problem of diversity and scalability, but the other problems are not solved.
Andres Ferraro et al., 2018 [64], centered on music suggestions and suggested a new technique to improve recommendations based on a preferred metric of choice by merging different algorithms for each user individually depending on their projected performance. The proposed method involves forecasting an expected mistake that each system will generate for each user based on their historical behavior. For this purpose, the paper suggested a training regression model for several metrics that predict system performance based on a variety of parameters that characterize historical user activity in the system. After that, several fusion procedures are used to merge the recommendations given by each system. Using this method, the final hybrid system can be optimized in terms of the desired measure. Using the hybrid method helps to solve sparsity and diversity problems, which is approved by the evaluation metrics.
Kai Wang et al., 2019 [65], developed a learning clustering representation-based personalized e-commerce-product recommendation system. The traditional kNN approach is limited in its ability to choose nearby object sets. To pick the nearby object set, they provided a neighbor factor and a time function, as well as a dynamic selection model. To create the e-commerce product suggestion system, they merged RNN and attention mechanisms. This paper succeeded in solving scalability and diversity problems without mentioning other problems.
All the previous works concentrate on one or two of the RS problems but not all of them; in addition, all of them have high time complexity due to the large number of calculations that must be performed and may increase with system scalability. The proposed system depends on statistical analysis to solve the problem of a cold-start by providing a recommendation depending on the preferences matrix of the products. The continuous updating of the preferences matrix of the products and the customers helps to reduce sparsity, diversity, and scalability problems. Depending on all features (the customer actions that feed the product’s features), it provides recommendation results that are very close to the customer’s preferences. Further, the calculations are made continuously and gradually (updating the database).

3. Method

3.1. The Proposed System Description

The proposed system is a part of the commercial environment, which involves an e-commerce website, an e-bank system, and customers. This environment makes the experiments more realistic and reliable. The e-commerce website is a specialist in computers and their peripherals. Therefore, the system is divided into global sections and sub-sections.
The e-commerce system is organized in a hierarchal way. The first level consists of the computer brands, such as MSI, Lenovo, Dell, and so on. Each brand is branched to laptop, screen, keyboard, peripheral (mouse, RAM, headphone), and so on. Each branch is also according to budget range.
This means that the system contains the following levels:
  • Brands (MSI, Lenovo, Dell, HP, ……, etc.).
  • Each brand branches to laptop, CPU, monitor, peripherals (mouse, keyboard, others).
  • Then, each node is classified according to budget (price range).
The proposed recommendation system can be represented by Algorithm 1:
Algorithm 1 Personalized Recommendation Algorithm
Input: Products id, Customer Behavior
Output: Recommender List START
INITIALIZE:
          id = likes = dislikes = rating = purchased = viewed = 0
          allProductsList is empty
          thisProduct is empty
          recommendedList is empty
 
FOR every product in product List:
                   ADD to thisProduct:
                             id = Get this product id
                             likes = Number of likes for this product
                             dislikes = Number of dislikes for this product
                             rating = Calculate the average rating for this product
                             purchased = Number of times this product has been purchased
                             viewed = Number of times this product has been viewed by the current user
 
                   ADD this Product to allProductsList
ENDFOR
 
SORT allProductsList in the following orders:
          purchased in descending order
          likes in descending order
          rating in descending order
          viewed in descending order
          dislikes in ascending order
 
allProductsList = Id’s of the first 30 product from allProductsList
IF User is logged in:
          likedByUser = Products id’s liked by this user
          dislikedByUser = Products id’s disliked by this user
          ratedByUser = Products id’s that has been highly rated by this user
          viewedByUser = Products id’s viewed by user
 
          Remove dislikedByUser id’s from allProductsList
          recommendedList = Merge of all
end
The system parameters involve a list of lists, which contains the features for all the products. Each item in this list is a list that contains parameters to compute the features that are used to classify the products (like, dislike, view, rate, and purchase). Thus, each product has a unique identifier that is used to retrieve it and retrieve the list of product parameters. These features or parameters are used to build the customer preference matrix for each client depending on computing and analyzing the customer behavior and will be saved in the customer database. With each customer login to the system, the customer preference matrix is retrieved for that customer depending on their identifier and is updated if there are any changes in the customer behavior.
At the same time, these features are used to classify the products preferences and are used to build the product preferences matrix, which is a global matrix that involves all the products and contains the calculations for the features for each product. This matrix is saved in the products database and is updated if there are any changes to the features.
There are several entities that are used to generate recommendation lists, which involve:
  • Customer behavior.
  • Product features.
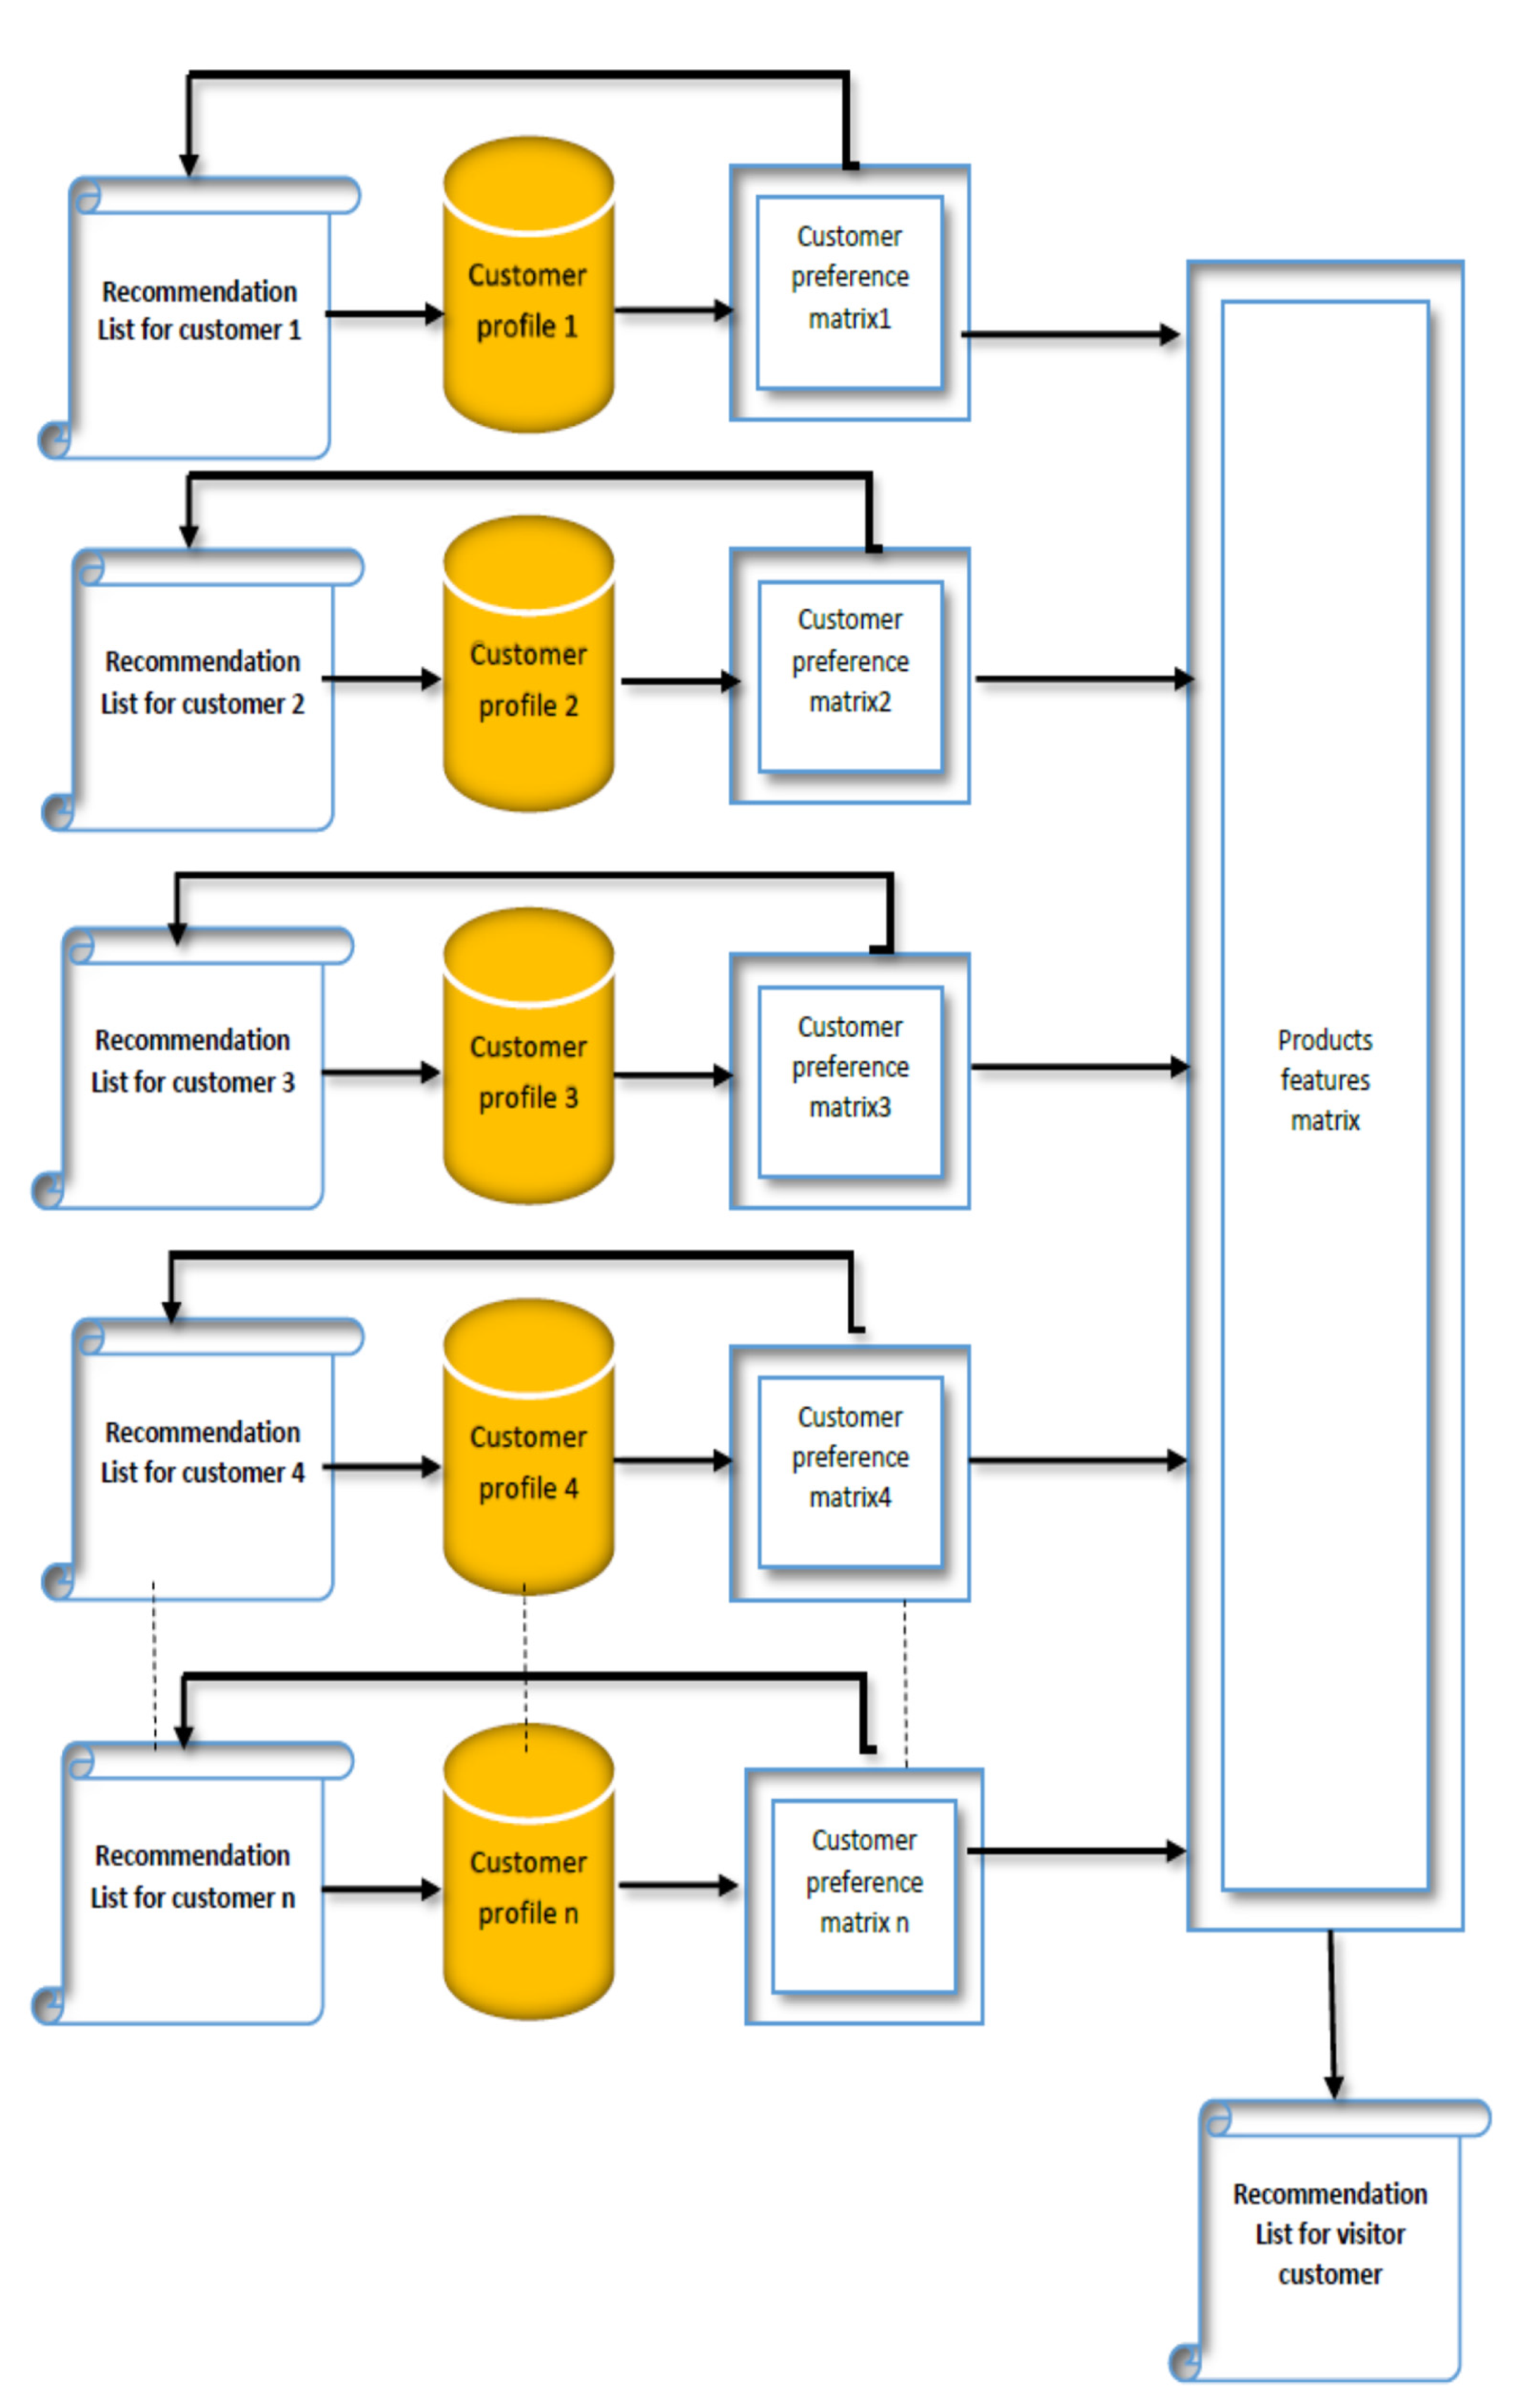
  • Customer preference matrix.
  • Product feature matrix.
Customer behavior can be defined as several actions that are performed normally by the customers when they are visiting any commercial site. These actions or features include: (like, dislike, rating, view, and purchase), which are the expected activities that are performed on an e-commerce website.
Taking into account that not all customers may have an account in the e-commerce site, the process of the recommendation algorithm is dividing customers into two main classes
  • Customers that have accounts in the system.
  • Customers that have no accounts in the system.
All products on the website will be arranged into a list called the AllProductList.
Each item in this list consists of an array that represents the product features according to the client’s behavior. The array represents counters for each one of the previous features depending on the product Id, for example.
Table 1 represent a sample of the features that are used for each product to generate the recommendation list depending on, while Table 2 explains the meaning of the abbreviations that are mentioned in Table 1.
These features are used to measure product popularity among customers (has or does not have an account) depending on customers’ behavior.
Each product will be added to the AllProductList by Id depending on how many users like, dislike, rate, purchase, view this product. For each feature, there will be a counter increased every time any customers trigger the regarding button or perform an action that represents the specific feature.
There will be an array for each product to represent these features with the corresponding counter for each one. These counters will be updated continuously depending on customers’ behavior. These counters are used to evaluate each product.
Then all these arrays for all products will be added to the AllProductList list. Now the two situations mentioned before will be discussed in the next sections.
Figure 1 describes a general data flow between system entities to generate a recommendation list for each customer according to the customers and the products information.
Figure 2 and Figure 3 explain, in detail, how to start computing actions for each customer, how to update customer and the product databases, and how to generate the recommendation list for each customer.
Figure 2 shows that the process starts when a customer logs in to their account, and when performing any of the five actions (like, dislike, view, rate, and purchase) depending on the customer’s ID, their information will be retrieved from the customers’ database (the customer preference matrix CPM). Any action for any product will be added to CPM and will always be updated in the database. Then depending on CPM and the recommendation system, the recommendation list will be generated for the customer.
For the customers that have no account on the website, the same procedure is performed depending on the visitor actions but using the products database as described in Figure 3.

3.2. The Customer Does Not Have an Account

In case that the customer does not have an account, then the products will be recommended to the user by sorting the AllProductList into the following form, shown in Table 3:
Then the first thirty products’ IDs will be put in the AllProductList. Then the recommended list will be built depending on the AllProductList.

3.3. The Customer Has an Account

If the user has an account and is logged in it, the rating depends on the client behavior according to the features mentioned previously using the AllProductList.
Customer behavior means that the product is liked, disliked, rated, purchased, and viewed by the customer, adding the product Id for each list. Each product disliked by the customer will be removed from AllProductList. All other products the customer acts positively towards will be added (merged) to the recommendation list as follows.
Duplicated product Ids will be deleted from the recommendation list and then shuffled to prevent customer boring (every time there will be a new order of recommendation list that appears to the customer).

3.4. Preference Matrix Generating

For each customer, the preference degree must be computed. This is done depending on the building of the preference matrix, which computes the preference products for each customer depending on their action, as shown in Table 4 below.
This matrix is computed for each customer and updated according to the last accessed time by comparing the last access with the latest one to measure preference degree since the last access. If there are any changes in product preferences, then the customers’ preference degree is updated.
The update can be done by comparing the products for any action from the last access time with the ones from the newest one as follows:
New = A(p)an − A(p) an−1
where
  • New = new products to be added to the favorite products
  • A = action (like, dislike, rate …… etc.)
  • P = product
  • an = current access
  • an−1 = last access
Then new will be merged into the recommendation list. The favorites for the customer are:
Cn   =   [ like ( p )     purchase ( p )     rate ( p )     view ( p ) ]   dislike ( p )
where:
  • like(p) = products are liked by the customer
  • purchase(p) = products are Purchased by the customer
  • rate(p) = products are rated by the customer
  • view(p) = products are viewed by the customer
  • dislike(p) = products are disliked by the customer
For each action, the preference degree is computed using the following equation:
PD ( Pn ) = 2 π   ×   arctan ( N ( A ) T ( Ac ) )
where
  • PD = preference degree of customer
  • Pn = product number n
  • N(A) = number of action frequency
  • T(Ac) = total access times
  • 2 π   is used to perform normalization into interval [0, 1].
For example, for customer C1, suppose that for a new access to the system, customer C1 liked new product p53, such that the table will be as shown in Table 5:
Then c1 preference is updated as follows:
New = [P1,p7,p12,p3,p9,p8] − [P1,p7,p12,p3,p9,p8,p53] = p53, which will added to recommendation list
Furthermore, for each customer, the preferences are found in most of or all of the actions of the customer, for c1, as an example, the most preferred is found as follows, using the following equation:
C 1   =   [ ( P 1 , p 7 , p 12 , p 3 , p 9 , p 8 ,   p 53 )     ( P 12 , p 30 , p 7 )     ( P 23 , p 1 , p 3 )     ( P 8 , p 23 , p 17 , p 7 , p 11 , p 13 , p 25 ) ]     ( P 2 , p 5 , p 6 ) = ( p 7 ,   p 12 )
Dislike is used because there is a situation where the user may buy a product, but after using it, they find they do not like it; therefore, they may change their rating of it to dislike.

3.5. Product Feature Matrix

There will be another matrix for products that can be used to generate a recommendation list for the customer that has no account on the e-commerce site. For each product, there will be a counter for each feature to compute how much the product is liked, purchased, viewed, disliked, and rated. Then the product will be classified according to the highest so that p1, for example, is the most liked product, p2 is the most rated, and so no. Dislike is used to remove the most disliked. This matrix will be updated according to customers’ activities.
As shown from the previous matrix that P1 is the most liked product, P2 is the most rated product, P3 is the most viewed product, P5 is the most disliked product, and P6 is the most purchased product. According to these results, P1, P2, P3, and P6 are added to the recommendation list for customers that have no account because their preferences are not known to the system, and this will make a prediction of their preferences difficult. This method will help to solve the cold-start problem. Moreover, it depends on realistic information because it is elicited from real customers of the same e-commerce site. This fact will make predictions more accurate and make sure to satisfy customers and ensure their return. By this means, the system performance is increased, and more commercial benefits are made.
After each access by a customer, the numbers in Table 6 are changed according to the customers’ actions and behavior. For each product, the preference degree is computed using the equations as follows:
PD ( Pn ) = 2 π   ×   arctan ( N ( A ) T ( Ac ) )
PDL ( Pn ) =   2 π   ×   arctan ( N ( like ) T ( Ac ) )
PDR ( Pn ) =   2 π   ×   arctan ( N ( rate   ) T ( Ac ) )
PDV ( Pn ) =   2 π   ×   arctan ( N ( view   ) T ( Ac ) )
PDB ( Pn ) =   2 π   ×   arctan ( N ( buy ) T ( Ac ) )
Then the average of previous results for each product is computed because all these features construct a preference degree for the product.

3.6. The Recommended Products

Using Equations (4)–(8), a preference degree is calculated for each product. Depending on the result, the recommendation list will be generated for each client according to their preferences. For a sample of size seven products out of 200 samples, the computed results are shown in Table 7 below:
Notice that the preference degree increased after each access, which facilitates collecting more information about the clients’ preferences. Depending on the customers’ behavior and collected information, the top items will be recommended for users. The highest products at access time will be recommended to the customers.
Table 8 represents the experimental results of the proposal. Precision, recall, and F1 function are the most familiar indices used for recommendation systems. Suppose that R(P) represents the recommended products, I(P) interesting products, then the definition of these functions are as follow:
Precision = | R ( P ) I ( P ) | | R ( P ) |
Recall = | R ( P ) I ( P ) | | I ( P ) |
F 1 = 2 × Precision × Recall Precision + Recall

4. Results

The following section discusses the results of the proposed system in comparison with other systems and methods.

4.1. Experimental Results

The precision, recall, and F1 functions were used to test the effectiveness of UIBB, and the results were compared against the following algorithms using the same sample of consumers.
Traditional CF based on users (CFUB): The number of common goods purchased by the users is used by CFUB to calculate the users’ similarity.
CFIB is a type of CF that is based on things. The number of common consumers who purchased the same item is used by CFIB to determine the item’s similarity.
FPP creates a rating matrix exclusively based on the users’ purchase data. FPP incorporates both CF-based and SPA-based recommendations.
(UIBB) = user item behavior-based, the proposed method.
Figure 4, Figure 5 and Figure 6 show that CFUB and CFIB have lower precision, recall, and F1, which is due to the fact that they treat all behaviors as one type and choose the nearest neighbors based on the entire user and item set. Because the FPP only analyzes the user’s purchase data and ignores information from clicking, adding, and collecting, the recommendation quality suffers. In terms of precision and recall, the UIBB technique outperformed the others since it took into account not just the user’s purchasing behavior but also other behaviors (like, dislike, rate, and view), which enhanced the forecast accuracy.
As seen in Figure 4, Figure 5 and Figure 6, the results of precision, recall, and F1 functions of CFUB and CFIB are inferior; this is because they considered all activities of user behavior as one type. The FPP considers only the purchase information of the customers and ignores other activities, which reduces the recommendation quality. The proposed method considers all the activities and updates the customer information regularly according to them; therefore, the results are better than the other methods.

4.2. System Performance Evaluation

The proposed system is evaluated by comparing it with traditional recommendation systems using some metrics. These metrics are mean absolute error (MAE),x and root mean square error (RMSE), which measure differences between predicted and actual preferences of customers over time. These metrics are measured using the following equations:
MAE = ij   | P ij P ij | N
RMSE = ij ( P ij P ij ) 2 N
where:
  • Pij = the real preference of customer i on product j
  • P′ij = the predicted preferences of customer i on product j
  • N = number of preferences.
The resulting values of these metrics indicate that the prediction results of the recommender systems are better, as the error value is smaller.
Table 9 shows the comparison between the user-based collaborative filtering and the proposed system by measuring MAE and RMSE. The results showed that there are improvements in the proposed system in MAE by 0.2296 and in RMSE by 0.8859 on average.
Table 10 shows the comparison between the item-based collaborative filtering (CFIB) and the proposed system by measuring MAE and RMSE. The results showed that there is an improvement in the proposed system in MAE by 0.0925 and in RMSE by 0.2934 on average.
Table 11 shows the comparison between the FPP and the proposed system by measuring MAE and RMSE. The results showed that there is an improvement in the proposed system in MAE by 0.3868 and in RMSE by 0.3999 0n average.

4.3. Experiment

This is an example of real customers of the e-commerce website. The customers are referred to as Cn. There are two samples of the customers, Table 12 represents the recommendation list for the customers that have an account on the website. While Table 13 represents customers that have no account on the website. The recommended items are referred to by their Ids. For each customer, there will be seven recommended items depending on their behavior.
The red items represent the products that are purchased by the customer. The results show that some of the customers have four red items (C1,C3,C5,C8,C9), others have three red items (C6,C10), others have two red items (C2), C4 has one red item, and C7 has five red items. The differences come from a difference in login times for each customer. More login times give a more accurate recommendation list.
Table 13 represents recommended items for visitors (the customers that have no account on the e-commerce site). In this case, the database of the website has no information about this customer, so the recommendations will depend on the preference matrix of the product; this will recommend the most highly-preferred items. The sample visits the website at different times. The visitors are referred to as Vn.

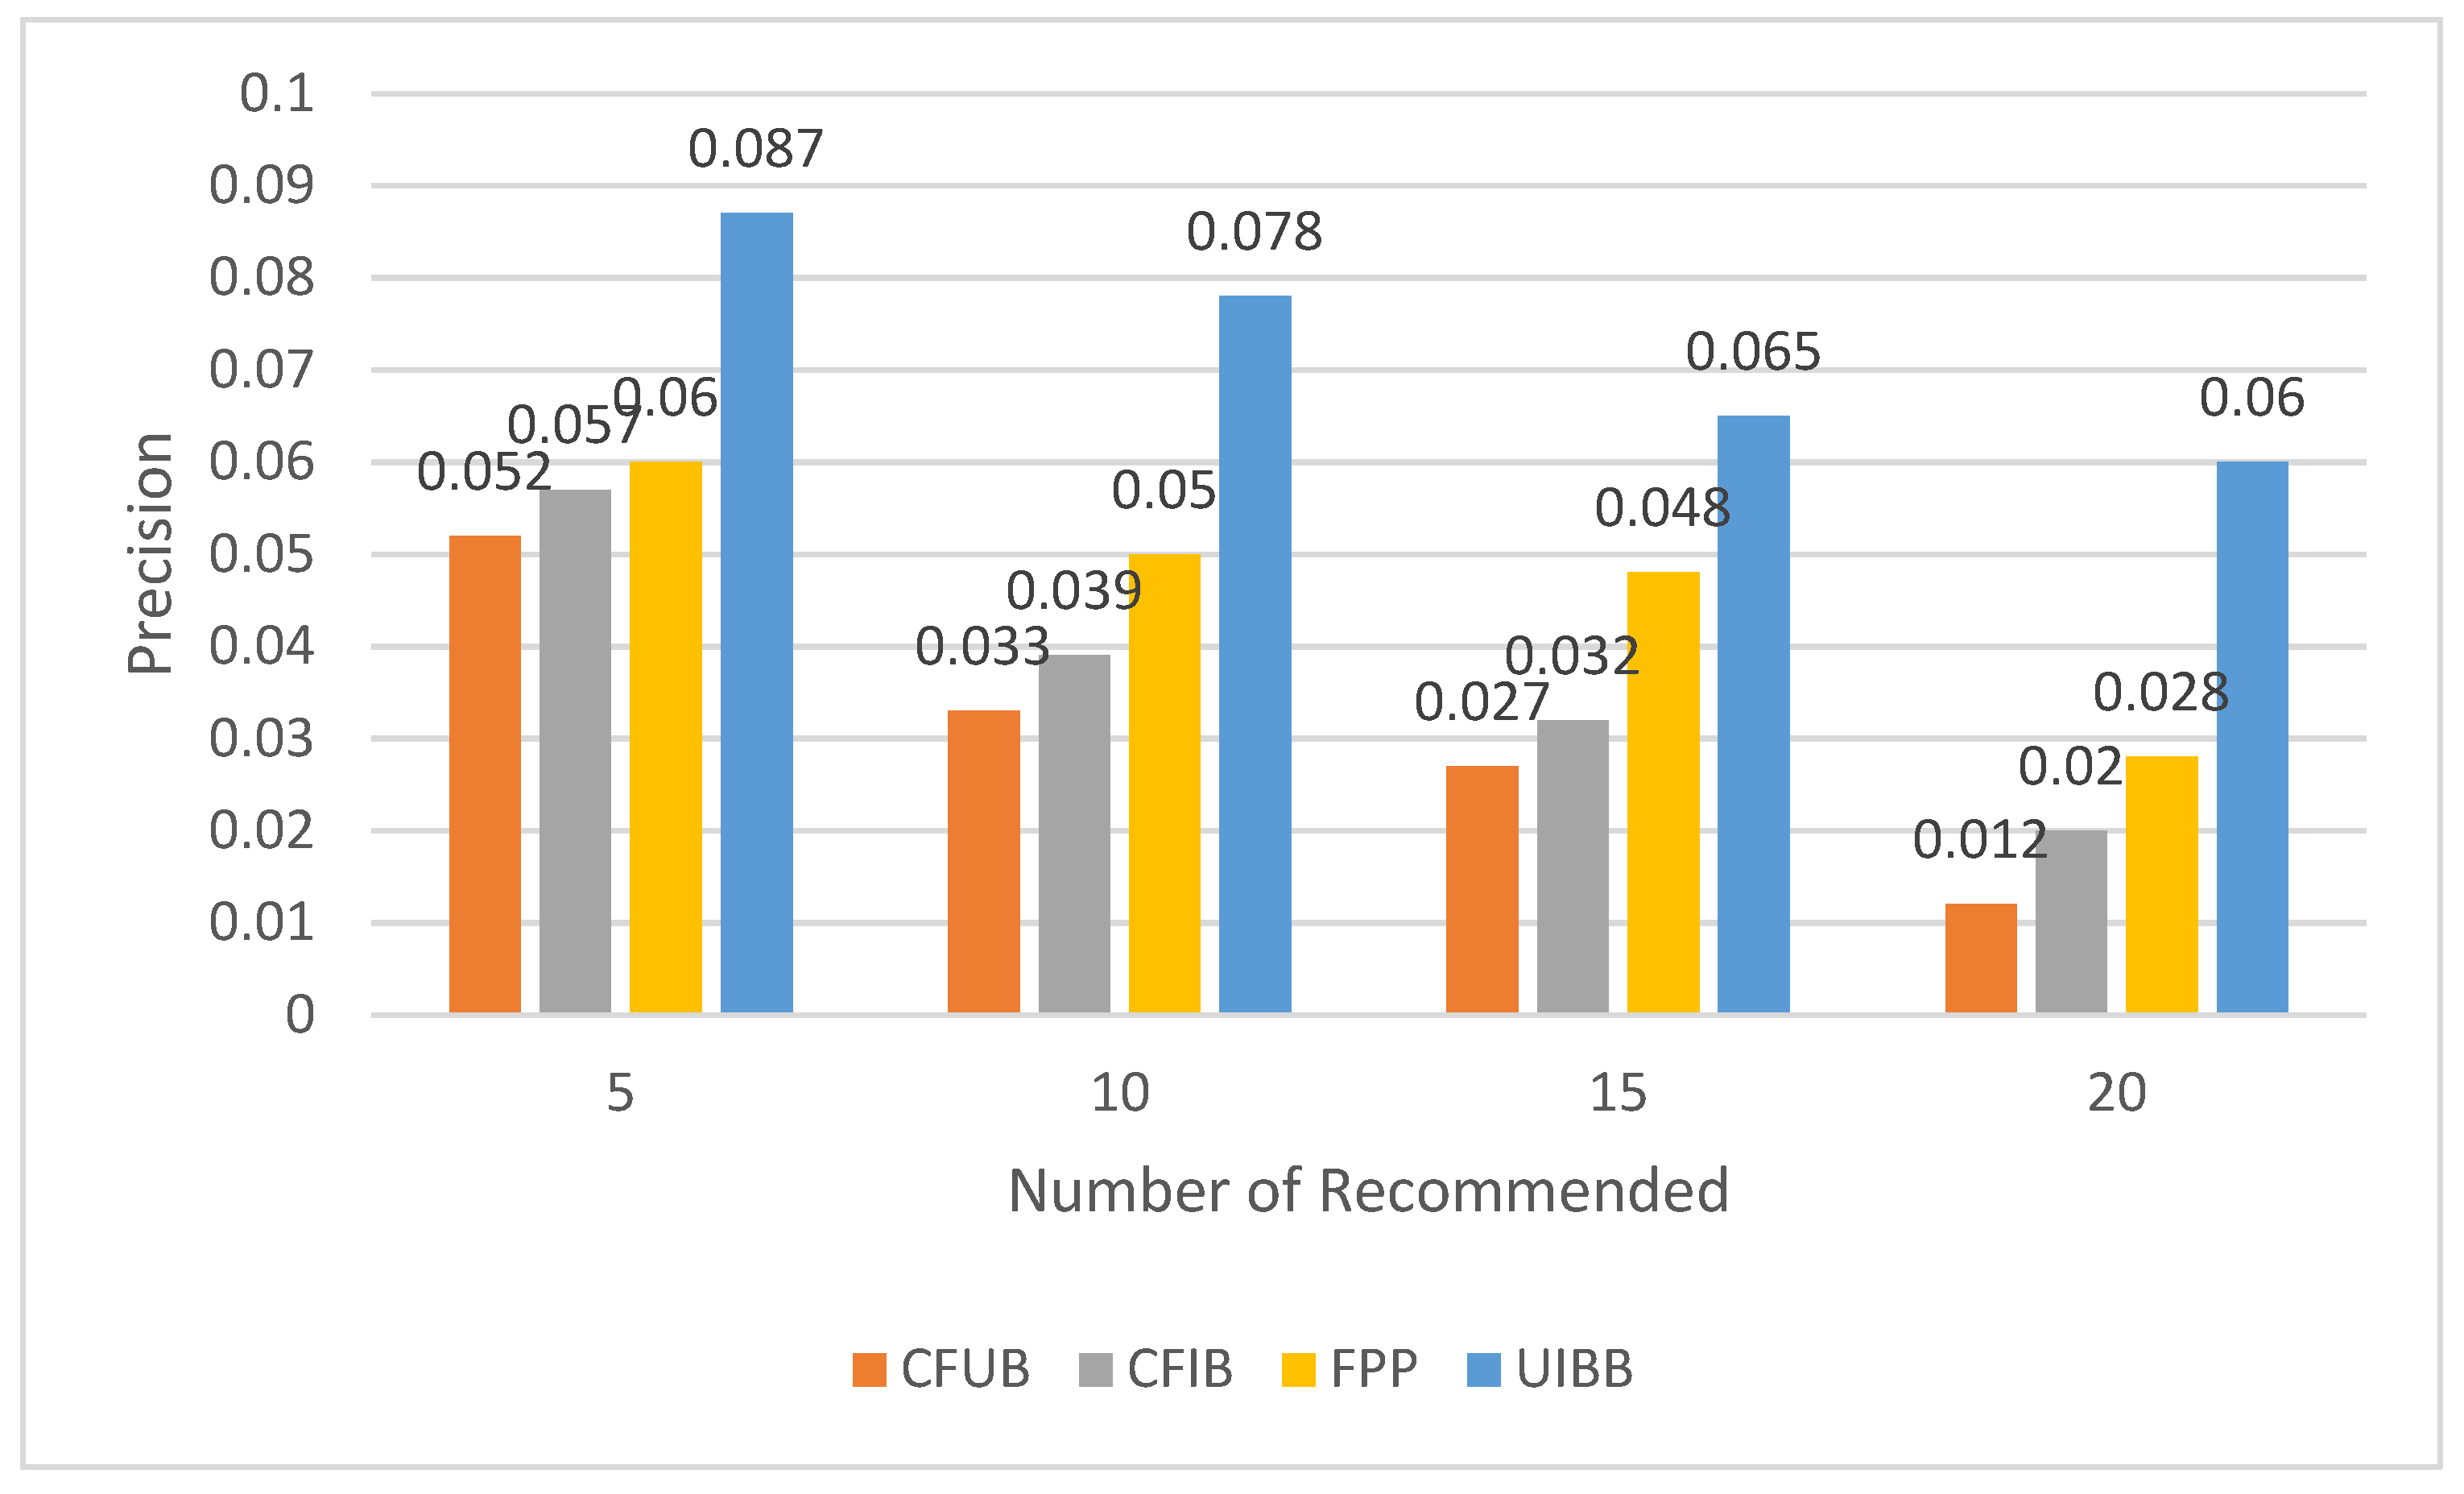
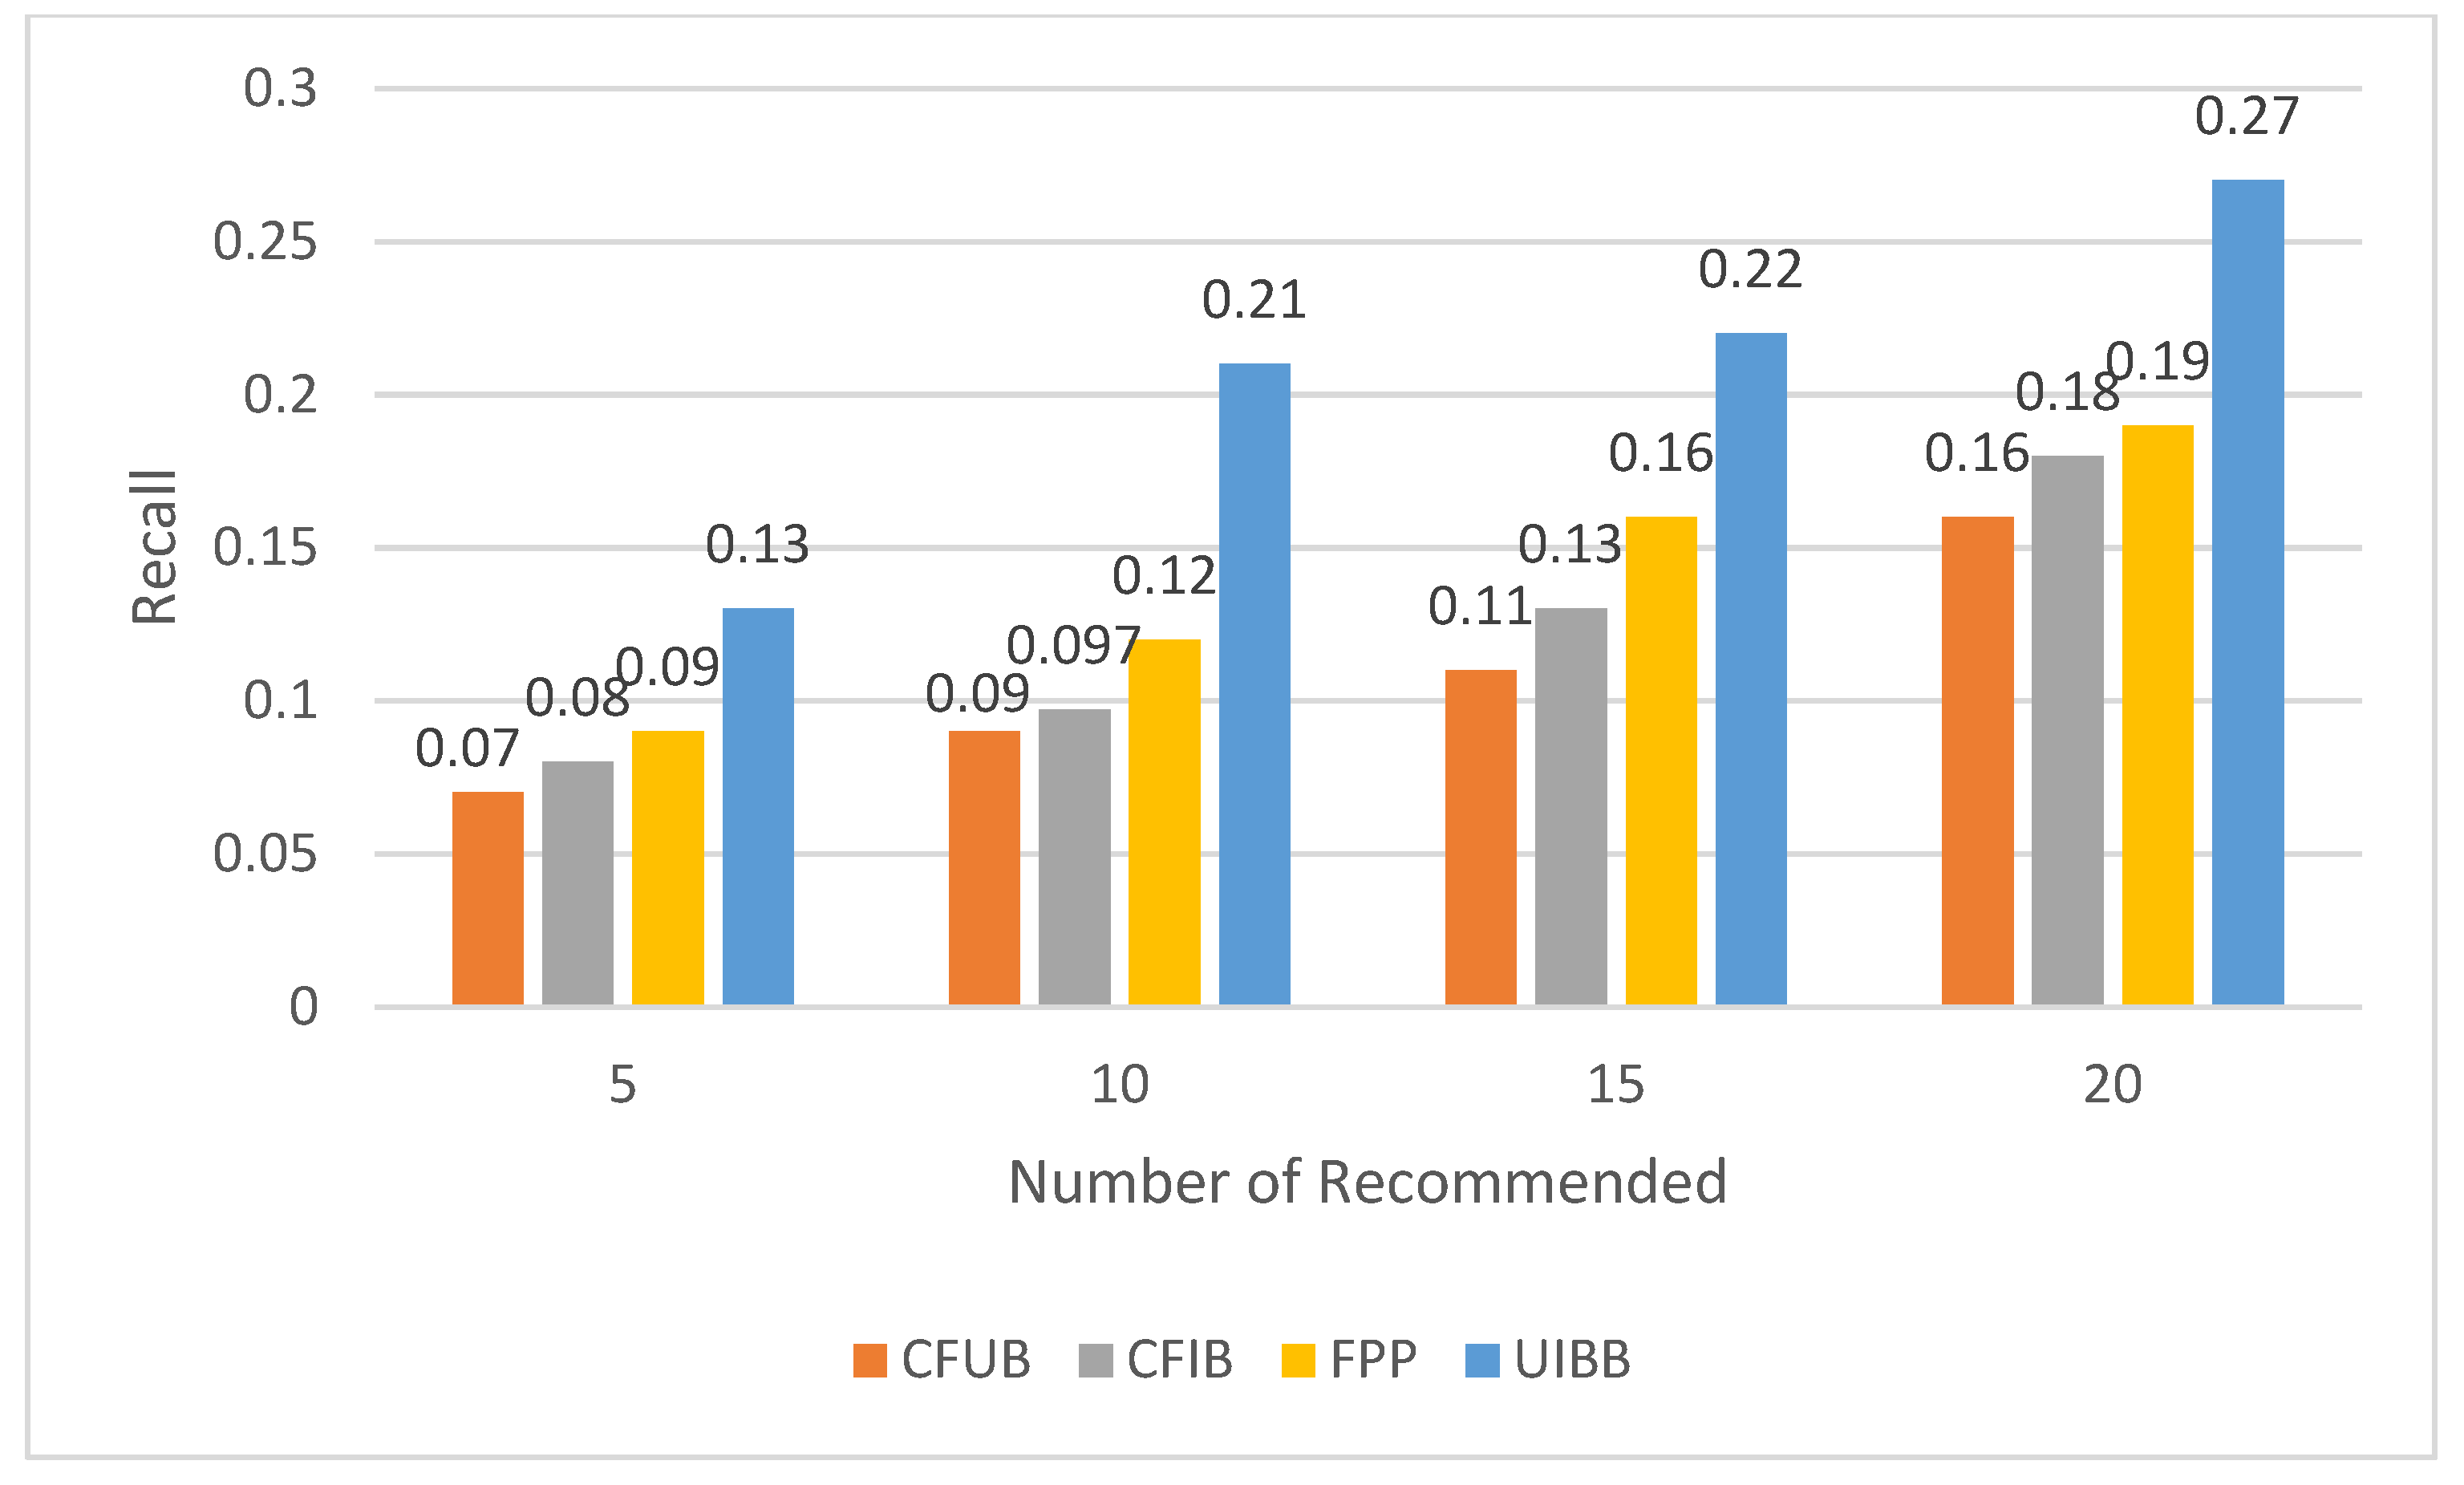
4.4. Comparision Analysis

Table 14 contains the comparison between the related work and the proposed system depending on the recommendation system challenges. The problems that are solved by each paper are indicated by the (√) symbol in the table, while the problems that are not solved are indicated by (×).

5. Discussion

The proposed RS system is employed on an e-commerce website that is a specialist in selling computers and their peripheral instruments, so it is possible to say that diversity and scalability problems are controlled. In larger e-commerce environments that involve various categories, such as clothes, electric devices, and cosmetics, these problems can be solved by using additional parameters classified according to the products categories to use statistical methods efficiently. The parameters that are used in the proposed system support the system performance because they distinguish between the different activities and did not consider these five actions as one type. That gives more information about all the different preferences of the different customers. On the other hand, for the customers that are visitors and have no accounts, there is not enough information about their preferences; however, the recommendation list is not generated randomly. The recommendation list is generated depending on the product preference matrix that collects the information about the most preferred products depending on the different activities of different customers who have accounts on the website. In general, the collected information is real information elicited from the customers’ behavior and reflects their real trends. The experimental results show that the proposed system has better performance than the traditional method by measuring system performance using precision, recall, F-function, RMSE, and MAE.

6. Conclusions

This paper presents a recommendation system that is used to solve the RS challenges. These challenges involve cold-start, sparsity, diversity, and scalability. As presented in related works, this paper treats some of these challenges but not all of them. The proposed system employs statistical methods and analysis to compute several features (customer behavior) to build a recommendation list that provides recommendations close to the customers’ preferences. The experimental results showed, in comparison with other systems, a better performance. As future work, a questionnaire could be used to collect the customers’ opinion after purchasing a product by asking the customers several directed questions that could help to improve the website performance and provide good feedback for the recommendation system.

Author Contributions

Conceptualization, F.T.A.H.; methodology, F.T.A.H.; software, F.T.A.H.; validation, F.T.A.H.; formal analysis, F.T.A.H.; investigation, F.T.A.H.; resources, F.T.A.H.; data curation, F.T.A.H.; writing—original draft preparation, F.T.A.H.; writing—review and editing, F.T.A.H.; visualization, F.T.A.H.; supervision, A.M.S.R. and H.B.A.; project administration, F.T.A.H., A.M.S.R. and H.B.A. All authors have read and agreed to the published version of the manuscript.

Funding

This research received no external funding.

Institutional Review Board Statement

Not applicable.

Informed Consent Statement

Not applicable.

Data Availability Statement

Not applicable.

Conflicts of Interest

The authors declare no conflict of interest.

References

  1. Lee, H.I.; Choi, I.Y.; Moon, H.S.; Kim, J.K. A Multi-Period Product Recommender System in Online Food Market based on Recurrent Neural Networks. Sustainability 2020, 12, 969. [Google Scholar] [CrossRef] [Green Version]
  2. Archana, K.; Saranya, K.G. Crop Yield Prediction, Forecasting and Fertilizer Recommendation using Voting Based Ensemble Classifier. SSRG Int. J. Comput. Sci. Eng. 2020, 7, 1–4. [Google Scholar]
  3. Adadi, A. A survey on data-efficient algorithms in big data era. J. Big Data 2021, 8, 1–54. [Google Scholar] [CrossRef]
  4. Elahi, E.; Chandrashekar, A. Learning Representations of Hierarchical Slates in Collaborative Filtering. In Proceedings of the Fourteenth ACM Conference on Recommender Systems, Virtual Event, Brazil, 22–26 September 2020; pp. 703–707. [Google Scholar]
  5. Abbas, A.R. An Adaptive E-commerce: Applying of Psychological Testing Method to Improve Buying Decision Process. Eng. Technol. J. 2015, 33, 222–234. [Google Scholar]
  6. Bortko, K.; Bartków, P.; Jankowski, J.; Kuras, D.; Sulikowski, P. Multi-criteria Evaluation of Recommending Interfaces towards Habituation Reduction and Limited Negative Impact on User Experience. Procedia Comput. Sci. 2019, 159, 2240–2248. [Google Scholar] [CrossRef]
  7. Gheraibia, M.Y.; Gouin-Vallerand, C. Intelligent mobile-based recommender system framework for smart freight transport. In Proceedings of the 5th EAI International Conference on Smart Objects and Technologies for Social Good, Valencia, Spain, 25–27 September 2019; pp. 219–222. [Google Scholar]
  8. Jankowski, J.; Hamari, J.; Watróbski, J. A gradual approach for maximising user conversion without compromising experience withhigh visual intensity website elements. Internet Res. 2019, 29, 194–217. [Google Scholar] [CrossRef]
  9. Jun, H.J.; Kim, J.H.; Rhee, D.Y.; Chang, S.W. “SeoulHouse2Vec”: An Embedding-Based Collaborative Filtering Housing Recommender System for Analyzing Housing Preference. Sustainability 2020, 12, 6964. [Google Scholar] [CrossRef]
  10. Lee, D.; Hosanagar, K. How Do Recommender Systems Affect Sales Diversity? A Cross-Category Investigation via Randomized Field Experiment. Inf. Syst. Res. 2019, 30, 239–259. [Google Scholar] [CrossRef] [Green Version]
  11. Shareef, S.M.; Hashim, S.H. Proposed Hybrid Classifier to Improve Network Intrusion Detection System using Data Mining Techniques. Eng. Technol. J. 2020, 38, 6–14. [Google Scholar] [CrossRef]
  12. Zhang, H.; Kong, X.; Zhang, Y. Selective Knowledge Transfer for Cross-Domain Collaborative Recommendation. IEEE Access 2021, 9, 48039–48051. [Google Scholar] [CrossRef]
  13. Sharma, R.S.; Shaikh, A.A.; Li, E. Designing Recommendation or Suggestion Systems: Looking to the future. Electron. Mark. 2021, 31, 243–252. [Google Scholar] [CrossRef]
  14. Mohammed, M.A.; Gunasekaran, S.S.; Mostafa, S.A.; Mustafa, A.; Abd Ghani, M.K. Implementing an agent-based multi-natural language anti-spam model. In Proceedings of the 2018 International Symposium on Agent, Multi-Agent Systems and Robotics (ISAMSR), The Everly Putrajaya, Malaysia, 27–28 August 2018; pp. 1–5. [Google Scholar]
  15. Hanafizadeh, P.; Firouzabadi, M.B.; Vu, K.M. Insight monetization intermediary platform using recommender systems. Electron. Mark. 2021, 31, 1–9. [Google Scholar] [CrossRef]
  16. Shafqat, W.; Byun, Y.C. A Context-Aware Location Recommendation System for Tourists Using Hierarchical LSTM Model. Sustainability 2020, 12, 4107. [Google Scholar] [CrossRef]
  17. Hsu, P.Y.; Lei, H.T.; Huang, S.H.; Liao, T.H.; Lo, Y.C.; Lo, C.C. Effects of sentiment on recommendations in social network. Electron. Mark. 2018, 28, 1–10. [Google Scholar] [CrossRef]
  18. Ghani, M.K.A.; Mohammed, M.A.; Ibrahim, M.S.; Mostafa, S.A.; Ibrahim, D.A. Implementing an efficient expert system for services center management by fuzzy logic controller. J. Theor. Appl. Inf. Technol. 2017, 95, 3127–3135. [Google Scholar]
  19. Kang, L.; Liu, S.; Gong, D.; Tang, M. A personalized point-of interest recommendation system for O2O commerce. Electron. Mark. 2021, 31, 253–267. [Google Scholar] [CrossRef]
  20. Khan, Z.A.; Chaudhary, N.I.; Zubair, S. Fractional stochastic gradient descent for recommender systems. Electron. Mark. 2019, 29, 275–285. [Google Scholar] [CrossRef]
  21. AL_Obaidy, A.T.; Al_Doori, M.M.S. The Future for Adaptive Software Development in Cloud computing environment Using Multi Agent System. Eng. Technol. J. 2015, 33, 25–36. [Google Scholar]
  22. Wang, Y.; Sharma, R. Design of front-end for recommendation systems: Towards a hybrid architecture. In Proceedings of the 18th International Conference on Electronic Business, Guilin, China, 2–6 December 2018; pp. 211–220. [Google Scholar]
  23. Xia, H.; Wei, X.; An, W.; Zhang, Z.J.; Sun, Z. Design of electronic-commerce recommendation systems based on outlier Mining. Electron. Mark. 2020, 31, 1–10. [Google Scholar] [CrossRef]
  24. Li, G.L.; Zhu, T.; Hua, J.; Qiu, D.D.; Wu, R.Z.; Zhang, H.B.; Ji, D.H. Hybrid recommendation system for tourist spots based on hierarchical sampling statistics and Bayesian personalized ranking. J. Cent. China Normal Univ. Nat. Sci. 2019, 53, 214–221. [Google Scholar]
  25. Zihayat, M.; Ayanso, A.; Zhao, X.; Davoudi, H.; An, A. A utility-based news recommender system. Decis. Support Syst. 2019, 117, 14–27. [Google Scholar] [CrossRef]
  26. Lin, J. Neural hype and comparisons against weak baselines. SIGIR Forum 2019, 52, 40–51. [Google Scholar] [CrossRef]
  27. Guo, Y.; Yin, C.; Li, M.; Ren, X.; Liu, P. Mobile e-Commerce Recommendation System Based on Multi-Source Information Fusion for Sustainable e-Business. Sustainability 2018, 10, 147. [Google Scholar] [CrossRef] [Green Version]
  28. Fayyaz, Z.; Ebrahimian, M.; Nawara, D.; Ibrahim, A.; Kashef, R. Recommendation Systems: Algorithms, Challenges, Metrics, and Business Opportunities. Appl. Sci. 2020, 10, 7748. [Google Scholar] [CrossRef]
  29. Moscato, V.; Picariello, A.; Sperli, G. An Emotional Recommender System for music. IEEE Intell. Syst. 2020, 1, 1–12. [Google Scholar] [CrossRef]
  30. Aysha, K.; Ali, R. Recommender System Based on OSN Data Analytics. In Information and Communication Technology for Intelligent Systems, Proceedings of the ICTIS 2018, Padang, Indonesia, 25–26 July 2018; Springer: Singapore, 2018; p. 2. [Google Scholar]
  31. Zhuang, Y.; Kim, J. A BERT-Based Multi-Criteria Recommender System for Hotel Promotion Management. Sustainability 2021, 13, 8039. [Google Scholar] [CrossRef]
  32. Mwinyi, I.H.; Narman, H.S.; Fang, K.; Yoo, W. Predictive self-learning content recommendation system for multimedia contents. In Proceedings of the 2018 Wireless Telecommunications Symposium (WTS), Phoenix, AZ, USA, 18–20 April 2018; IEEE: Piscataway, NJ, USA, 2018; pp. 1–6. [Google Scholar]
  33. Pavlidis, G. Recommender systems, cultural heritage applications, and the way forward. J. Cult. Herit. 2019, 35, 183–196. [Google Scholar] [CrossRef]
  34. Su, X.; Sperlì, G.; Moscato, V.; Picariello, A.; Esposito, C.; Choi, C. An edge intelligence empowered recommender system enabling cultural heritage applications. IEEE Trans. Ind. Inform. 2019, 15, 4266–4275. [Google Scholar] [CrossRef]
  35. Kulkarni, N.H.; Srinivasan, G.N.; Sagar, B.M.; Cauvery, N.K. Improving Crop Productivity through a Crop Recommendation System Using Ensembling Technique. In Proceedings of the 2018 3rd International Conference on Computational Systems and Information Technology for Sustainable Solutions (CSITSS), Bangalore, India, 20–22 December 2018; IEEE: Piscataway, NJ, USA, 2018; pp. 114–119. [Google Scholar]
  36. Bangaru Kamatchi, R.S. Improvement of Crop Production Using Recommender System by Weather Forecasts. Procedia Comput. Sci. 2019, 165, 724–732. [Google Scholar] [CrossRef]
  37. Lacasta, J.; Lopez-Pellicer, F.J.; Espejo-García, B.; Nogueras-Iso, J.; Zarazaga, F.J.-S. Agricultural recommendation system for crop protection. Comput. Electron. Agric. 2018, 152, 82–89. [Google Scholar] [CrossRef] [Green Version]
  38. Jaiswal, S.; Kharade, T.; Kotambe, N.; Shinde, S. Collaborative Recommendation System For Agriculture Sector. ITM Web Conf. 2020, 32, 03034. [Google Scholar] [CrossRef]
  39. Santosh Kumar, M.B.; Balakrishnan, K. Development of a Model Recommender System for Agriculture Using Apriori Algorithm. In Cognitive Informatics and Soft Computing; Springer: Singapore, 2019; pp. 153–163. [Google Scholar]
  40. Singh, P.K.; Pramanik, P.K.D.; Dey, A.K.; Choudhury, P. Recommender systems: An overview, research trends, and future directions. Int. J. Bus. Syst. Res. 2021, 15, 14–52. [Google Scholar] [CrossRef]
  41. Iwendi, C.; Khan, S.; Anajemba, J.H.; Bashir, A.K.; Noor, F. Realizing an E_cient IoMT-Assisted Patient Diet Recommendation System through Machine Learning Model. IEEE Access 2020, 8, 28462–28474. [Google Scholar] [CrossRef]
  42. Amelie Gyrard, A.S. IAMHAPPY: Towards an IoT knowledge-based cross-domain well-being recommendation system for everyday happiness. Smart Health 2020, 15, 100083. [Google Scholar] [CrossRef]
  43. Almeida, J.R.; Monteiro, E.; Silva, L.B.; Sierra, A.P.; Oliveira, J.L. A Recommender System to Help Discovering Cohorts in Rare Diseases. In Proceedings of the 2020 IEEE 33rd International Symposium on Computer-Based Medical Systems (CBMS), Rochester, MN, USA, 28–30 July 2020; pp. 25–28. [Google Scholar]
  44. Kashinath, S.A.; Mostafa, S.A.; Mustapha, A.; Mahdin, H.; Lim, D.; Mahmoud, M.A.; Mohammed, M.A.; Al-Rimy, B.A.S.; Fudzee, M.F.M.; Yang, T.J. Review of Data Fusion Methods for Real-Time and Multi-Sensor Traffic Flow Analysis. IEEE Access 2021, 9, 51258–51276. [Google Scholar] [CrossRef]
  45. Wang, D.; Liang, Y.; Xu, D.; Feng, X.; Guan, R. A content-based recommender system for computer science publications. Knowl. Based Syst. 2018, 157, 1–9. [Google Scholar] [CrossRef]
  46. Mohammed, M.A.; Ibrahim, D.A.; Salman, A.O. Adaptive intelligent learning approach based on visual anti-spam email model for multi-natural language. J. Intell. Syst. 2021, 30, 774–792. [Google Scholar] [CrossRef]
  47. Sahoo, A.K.; Pradhan, C.; Barik, R.K.; Dubey, H. DeepReco: Deep learning based health recommender system using collaborative filtering. Computation 2019, 7, 25. [Google Scholar] [CrossRef] [Green Version]
  48. Hamid, K. Personalized Healthcare System Based on Ontologies. In Proceedings of the International Conference on Advanced Intelligent Systems for Sustainable Development (AI2SD’2018), Tangiers, Morocco, 12–14 July 2018; p. 185. [Google Scholar]
  49. Mostafa, S.A.; Gunasekaran, S.S.; Mustapha, A.; Mohammed, M.A.; Abduallah, W.M. Modelling an adjustable autonomous multi-agent internet of things system for elderly smart home. In International Conference on Applied Human Factors and Ergonomics; Springer: Cham, Switzerland, 2019; pp. 301–311. [Google Scholar]
  50. Madhusree, K.; Rath, B.K.; Mohanty, S.N. Crop Recommender System for the Farmers using Mamdani Fuzzy Inference Model. Int. J. Eng. Technol. 2018, 7, 277–280. [Google Scholar]
  51. Sulikowski, P.; Zdziebko, T. Deep Learning-Enhanced Framework for Performance Evaluation of a Recommending Interface with Varied Recommendation Position and Intensity Based on Eye-Tracking Equipment Data Processing. Electronics 2020, 9, 266. [Google Scholar] [CrossRef] [Green Version]
  52. Srifi, M.; Oussous, A.; Ait Lahcen, A.; Mouline, S. Recommender Systems Based on Collaborative Filtering Using Review Texts—A Survey. Information 2020, 11, 317. [Google Scholar] [CrossRef]
  53. Guo, W.-W.; Liu, F. Application Research Of Hadoop’s Weibo Recommendation System Prototype Based On Customer Dynamic Behavior. In Proceedings of the 3rd International Conference on Smart City and Systems Engineering (ICSCSE), IEEE Xplore, Xiamen, China, 29–30 December 2018; pp. 1–5. [Google Scholar]
  54. Park, C.; Kim, D.; Yang, M.C.; Lee, J.T.; Yu, H. Click-aware Purchase Prediction with Push at the Top. Inf. Sci. 2020, 521, 350–364. [Google Scholar] [CrossRef]
  55. Li, X.; Xing, J.; Wang, H.; Zheng, L.; Jia, S.; Wang, Q. A Hybrid Recommendation Method Based on Feature for Offline Book Personalization. arXiv 2018, arXiv:1804.11335. [Google Scholar]
  56. Jiao, M.H.; Chen, X.F.; Su, Z.H.; Chen, X. Research on personalized recommendation optimization of E-commerce system based on customer trade behavior data. In Proceedings of the Chinese Control and Decision Conference (CCDC), Yinchuan, China, 28–30 May 2016; pp. 6506–6511. [Google Scholar]
  57. Li, D.; Zhao, G.; Wang, Z.; Ma, W.; Liu, Y. A Method of Purchase Prediction Based on User Behavior Log. In Proceedings of the IEEE 15th International Conference on Data Mining Workshops, Atlantic City, NJ, USA, 14–17 November 2015; pp. 1031–1039. [Google Scholar]
  58. Xu, J.; Wang, J.; Tian, Y.; Yan, J.; Li, X.; Gao, X. SE-stacking: Improving user purchase behavior prediction by information fusion and ensemble learning. PLoS ONE 2020, 15, 1–17. [Google Scholar] [CrossRef]
  59. Seippel, H.S. Customer Purchase Prediction through Machine Learning. Master’s Thesis, University of Twente, Enschede, The Netherlands, March 2018; pp. 1–95. [Google Scholar]
  60. Hu, Y.; Ogihara, M. Nextone Player: A Music Recommendation System Based on User Behavior. In Proceedings of the 12th International Society for Music Information Retrieval Conference (ISMIR 2011), Miami, FL, USA, 24–28 October 2011; pp. 103–108. [Google Scholar]
  61. Salehi, M. An effective recommendation based on user behaviour: A hybrid of sequential pattern of user and attributes of product. Int. J. Bus. Inf. Syst. 2013, 14, 480–496. [Google Scholar] [CrossRef]
  62. Lin, D.; Su, J. A Recommender System Based on Contextual Information of Click and Purchase Data to Items for E-commerce. In Proceedings of the 3rd International Conference On Cyberspace Technology (Cct 2015), IEEE Xplore, Beijing, China, 17–18 October 2015; pp. 1–6. [Google Scholar]
  63. Wang, B.; Ye, F.; Xu, J. A Personalized Recommendation Algorithm Based on the User’s Implicit Feedback in E-Commerce. Future Internet 2018, 10, 117. [Google Scholar] [CrossRef] [Green Version]
  64. Ferraro, A.; Bogdanov, D.; Choi, K.; Serra, X. Using offline metrics and user behavior analysis to combine multiple systems for music recommendation. In Proceedings of the RecSys’18, REVEAL Workshop, Vancouver, BC, Canada, 2–7 October 2018; pp. 1–6. [Google Scholar]
  65. Wang, K.; Zhang, T.; Xue, T.; Lu, Y.; Na, S.G. E-Commerce Personalized Recommendation Analysis by Deeply-learned Clustering. J. Vis. Commun. Image Represent. 2020, 71, 1–7. [Google Scholar] [CrossRef]
Figure 1. Information and data flow among system entities to generate the recommendation list.
Sustainability 13 10786 g001
Figure 2. Describes collecting, updating, and retrieving the customer actions to be used in generating a recommendation list for him/her; these operations are performed for the customers who have accounts on the e-commerce site.
Sustainability 13 10786 g002
Figure 3. Describes collecting, updating, and retrieving the customer actions to be used in generating a recommendation list for him/her; these operations are performed for the customers who have accounts on the e-commerce site.
Sustainability 13 10786 g003
Figure 4. Precision measure.
Sustainability 13 10786 g004
Figure 5. Recall measure.
Sustainability 13 10786 g005
Figure 6. F1 function.
Sustainability 13 10786 g006
Table 1. Sample of product features that are used to generate the recommendation list.
Product IdLikesDislikesRatesViewsPurchases
0132533
0221436
035827237
043013145
0530969
PnLnDnRnVnPUn
Table 2. Explains abbreviations that are used in Table 1.
PnLnDnRnVnPun
Product numberLikes numberDislike numberRates numberViews numberPurchase number
Table 3. Feature arrangement order.
FeaturePurchaseLikeRateViewDislike
Arrangement orderDescendingDescendingDescendingDescendingAscending
Table 4. Preference matrix is generated depending on customer behavior.
CustomerLikeDislikePurchaseRateView
C1P1,p7,p12,p3,p9,p8P2,p5,p6P12,p30P23,p1,p3P8,p23,p17,p7,p11,p13,p25
C2P11,p4,p5,p12,p7,p9P1,p10P23,p11,p8-P11,p4,p18,p22,p15
C3P22,p23,p3,p9-P9,p1,p6 - P22,p47
C4P3,p21,p35,p--P21,p34,pP6
C5P4,p8P1P5P2,p17-
C6 - - P58,p29,p12P5,p7,p9,p19P19,p25
C7 - P78,p79P23,p13,p55,p38,p19 - P3,p5,p9
CnPnPnPnPnPn
Where: C = customer, P = product.
Table 5. Updating preference matrix is generated depending on customer behavior.
CustomersLikeDislikePurchaseRateView
C1P1,p7,p12,p3,p9,p8, p53P2,p5,p6P12,p30, p7P23,p1,p3P8,p23,p17,p7,p11,p13,p25
C2P11,p4,p5,p12,p7,p9P1,p10P23,p11,p8-P11,p4,p18,p22,p15
C3P22,p23,p3,p9-P9,p1,p6 - P22,p47
C4P3,p21,p35,p--P21,p34,pP6
C5P4,p8P1P5P2,p17-
C6 - - P58,p29,p12P5,p7,p9,p19P19,p25
C7 - P78,p79P23,p13,p55,p38,p19 - P3,p5,p9
CnPnPnPnPnPn
Table 6. Representative number of actions for each product for access time n.
ProductsLikedDislikedRatedViewedPurchased
P1229------------14514289
P2178------------20567245
P34522621454
P410619634
P53350397
P667109368265
PnLnDnRnVnPn
Table 7. Representative reference degree of the products for a sample size of seven across several access times.
Access No.P1P2P3P4P5P6P7
10.56730.52370.43700.26720.23380.15070.1404
20.65640.61350.55660.34110.29010.19050.2089
30.70180.68700.60040.37060.32150.24980.2601
40.73990.69550.64090.42020.43340.31300.3405
50.75990.69900.65670.52210.52210.33220.4354
60.77760.76790.67980.56520.56510.47530.5720
70.85070.80430.75190.58990.59010.53560.5900
80.87900.86060.78580.61090.60040.66200.6561
90.90270.88900.79860.76080.63140.67480.7682
100.91080.90660.83090.77710.65980.74850.7899
Table 8. The proposed method performance.
Access No.Interested ItemRecommended ItemsPrecisionRecallF1
1P1,p2,p3,p4---------------------------------------
2P1,p2P1,p2,p3,p41/21 2/3
3P1,p5P1,p2,p3,p41/21/21/2
4P1,p6P1,p2,p3,p41/21/21/2
5P1,p6,p7P1,p2,p3,p41/41/3 2/7
6P6P1,p2,p3,p70 0 0
7P5,p7P1,p2,p3,p51/41/21/3
8P6,p5P1,p2,p3,p61/41/21/3
The second column (interested items) represents the item that is under customer interest (like, purchase, view, and rate) of one or more of these actions.
Table 9. MAE and RMSE comparison between the proposed system and the traditional collaborative filtering user-based (CFUB) recommendation system.
Access TimeTraditional RS Rating(CFUB)Proposed RS Rating
TestMAERMSEMAERMSE
12.45013.62912.23093.1635
22.37923.52042.22743.0534
32.36333.51892.21433.0344
42.21853.41012.15152.8116
52.34033.51442.14572.7011
62.343.50712.152.6422
72.343.5032.13022.578
82.2993.5032.122.511
92.29833.522.4178
Avg.2.38163.50632.1522.6204
Table 10. MAE and RMSE comparison between the proposed system and the traditional collaborative filtering item-based (CFIB) recommendation system.
Access TimeTraditional RS Rating(CFIB)Proposed RS Rating
TestMAERMSEMAERMSE
12.26332.83612.1862.6428
22.20122.83322.17052.6322
32.18252.81862.09062.6261
42.17332.78232.08112.5119
52.16082.76422.08622.5021
62.15062.76382.06212.5
72.14982.76292.05032.4821
82.14972.76212.04372.4627
92.14742.76172.04212.3629
Avg.2.15672.77152.06422.4781
Table 11. MAE and RMSE comparison between the proposed system and the FPP recommendation system.
Access TimeFPPProposed RS Rating
TestMAERMSEMAERMSE
11.87622.69181.63312.3509
21.87412.68621.62492.3432
31.8632.68331.60192.331
41.85812.67451.58662.31
51.84662.66871.54132.288
61.85632.66871.53782.2721
71.85552.66851.52292.26
81.85692.6681.47012.2505
91.85372.66711.44332.2463
Avg.1.86342.67061.51432.2707
Table 12. Recommendation results for the customers that have an account.
Customer No.Recommended Items
C1001230,003452,005000,002221,000105,000098,000388
C2000671,000453,002030,009001,000009,000076,000119
C3000029,000840,000337,000662,000009,000500,001114
C4002978,001932,001013,004532,003275,005003,000067
C5002890,000347,001111,0011760,000668,000811,000022
C6003811,002966,000007,000912,000110,001048,003228
C7003456,000034,000751,000659,000398,0004421,000968
C8001298,000298,002871,002666,000923,000657,000238
C9001199,001899,000561,000054,000019,002981,001982
C10002110,002933,000698,000989,000544,000198,000089
The numbers colored with red in Table 12 and Table 13 represent the recommended products that are really bought by the customers who are recommended for them.
Table 13. The recommended items for the visitors (have no account).
Customer No.Recommended Items
V1000342,000681,000342,000093,000046,000011,001657
V2000546,000301,000980,000344,002761,002444,000442
V3000888,000340,000548,003760,003889,000941,000848
V4000110,002198,002265,002948,000265,000773,000665
V5004338,003956,001652,002937,003194,000936,008174
V6000829,000709,000094,000082,000491,000438,000692
V7003919,004927,004855,000778,000872,000938,002914
V8002929,003915,004827,004991,000395,000720,000666
V9000910,000300,000451,000994,000761,000619,000844
V10003999,000773,000610,000440,000003,000087,000602
Table 14. Representative comparison analysis between the related works and the proposed system based on the challenges of the RS.
No.PaperCold-StartDiversityScalabiliySparsity Time Complexity
1Yajie Hu, Mitsunori Ogihara, 2011××High
2Mojtaba Salehi, 2013×××High
3Duo Lin, Su Jingtao, 2015×××High
4Bo Wang et al., 2018××High
5Andres Ferraro et al., 2018××High
6Kai Wang et al., 2019××High
7The proposed systemMedium
Publisher’s Note: MDPI stays neutral with regard to jurisdictional claims in published maps and institutional affiliations.

