Article

The Effect of Innovative Entrepreneurial Vitality on Economic Resilience Based on a Spatial Perspective: Economic Policy Uncertainty as a Moderating Variable

1
School of Economics and Management, Xinjiang University, Urumqi 830047, China
2
Center for Innovation Management of Xinjiang, Xinjiang University, Urumqi 830047, China
3
Key Laboratory of Sustainable Development of Historical and Cultural Tourism in Xinjiang, Urumqi 830047, China
*
Authors to whom correspondence should be addressed.
These authors contributed equally and should be considered co-first authors.
Sustainability 2021, 13(19), 10677; https://doi.org/10.3390/su131910677
Submission received: 31 July 2021 / Revised: 16 September 2021 / Accepted: 23 September 2021 / Published: 26 September 2021

Abstract

:
This study measured the economic resilience of 269 prefecture-level cities in China by constructing an indicator evaluation system for the resilience, adjustment, and responsiveness of the economic system under external shocks. A dynamic spatial Durbin model and a moderating mediation model were employed to analyze empirically the impact of economic policy uncertainty and innovative entrepreneurial vitality on economic resilience using prefecture-level panel data from 2004 to 2018. The statistical results revealed that there were significant “snowball” effects and spatial spillover characteristics of economic resilience. Under the moderating effect of economic policy uncertainty, innovative entrepreneurial vitality was found to have a significant positive effect on economic resilience. Furthermore, innovative entrepreneurial vitality was found to enhance economic resilience significantly by upgrading the industrial structure, alleviating the income gap, and guiding economic agglomeration in the context of economic policy uncertainty. Moreover, the impacts of innovative entrepreneurial vitality and economic policy uncertainty on economic resilience, respectively, showed significant heterogeneities in terms of the cities’ regions and economic sizes. The above-mentioned results were found to be valid even after a series of robustness tests were carried out.

1. Introduction

Economic crises are commonplace in modern economic operations. Between 1970 and 2011 alone, there were approximately 200 systemic currency crises and 150 financial crises in the world, which eventually evolved into global economic crises [1]. After the 2008 financial crisis, China entered a crucial period of replacing old drivers of growth with new ones and transforming its economic structure. During this time, international geopolitical risks were rising, and international trade and investment remained weak. All regions also faced external shocks, such as resource depletion, health crises, and natural disasters. Facing the increasingly complex economic and political situation while enhancing crisis resilience and adaptive capacity became a crucial issue for macroeconomic policy formulation by the Chinese government. Correspondingly, economic resilience—which denotes the ability of a regional economic system to absorb, learn from, and resolve crises by transforming the structure and functioning of the economy to achieve renewed economic growth after external shocks and disruptions (e.g., climate change, war, and economic crises) [2,3]—has emerged as a frontier topic in the field of regional studies, with a strong persuasive value in explaining how economic systems cope with economic crises, dissipate external shocks, and achieve economic recovery. The core of the study of economic resilience is explaining why some regions can overcome crises while others gradually go into recession. Therefore, it is essential to explore resilient economic growth in the context of economic globalization, as this will not only help policymakers move away from crude, traditional economic development models but also be significant for the formulation of long-term development strategies and economic recovery plans.
Innovation and entrepreneurship were also emphasized during the period of China’s economic system transformation. Since the Chinese government first proposed an innovation strategy in 2012 and launched the slogan “Mass Entrepreneurship, Mass Innovation” in 2015, innovation and entrepreneurship have been used as new driving forces for economic transformation and key nodes for improving the quality and efficiency of the economy. The Chinese economy must achieve resilient development by maintaining a steady increase in, and stimulating the economic benefits of, innovative entrepreneurial vitality. Concepts related to innovative entrepreneurial vitality were first introduced in Schumpeter’s theory of innovation. Schumpeter and Nichol (1934) explored innovation theory by suggesting that the “creative” destruction activities of entrepreneurs contribute to economic growth [4]. In his book Innovation and Entrepreneurship, Peter Drucker introduced the concept of the entrepreneurial economy, which is innovation-driven, possesses knowledge spillover, and is in line with world diversification trends. Porter outlined the idea that entrepreneurship can be a key instrument for economic growth, employment, national and regional productivity, and even social problem-solving. Based on this, we incorporated theories that are related to innovation and entrepreneurship, as well as considered innovative entrepreneurial vitality as the degree of innovation and entrepreneurial activities in a country or a region that are active in the socio-economy, which is a reflection of regional economic development potential and the ability to attract and utilize production factors. Based on the creativity and innovation of entrepreneurs while taking entrepreneurial enterprises as potential targets, innovative entrepreneurial vitality realizes the spiritual and knowledge values of entrepreneurs at the microlevel and promotes the development of a new economic model of the country at the macrolevel.
On the one hand, the boom in innovative entrepreneurial vitality spawns new enterprises and industries, thus enhancing market competition and the metabolism of old and new enterprises and broadening the market size and factor demand. The expansion of the market scale triggers the growth in factor supply and product innovation, which ultimately have impacts on urban economic resilience [5]. On the other hand, the new innovative and entrepreneurial enterprises that are generated by an increased innovative entrepreneurial vitality are often set around original enterprises, gradually forming a cluster of homogeneous and complementary enterprises. The agglomeration effect that is caused by enterprises can accelerate the application, promotion, and commercialization of new technologies, which force enterprises not only to create technology but also derive new industries. The development of new industries and the diversification of industrial categories also contribute to the diversified development of industries, which, in turn, affects economic resilience [6,7]. Therefore, as an important starting point for accelerating the transformation of driving forces in economic development, strengthening the cultivation of innovative entrepreneurship vitality has become not only an objective requirement for injecting new energy into economic growth and improving the overall efficiency of society but is also an effective choice for realizing innovation-driven development and enabling economic resilience.
An innovation entrepreneurship policy is undeniably one of the measures that requires the government to adopt the “invisible hand” to regulate and control the market actively. This is achieved by tailoring various policies to cope with macroeconomic fluctuations that may be caused by external shocks. However, the frequent and active actions that were taken by the government to smooth out economic fluctuations continuously to promote quality economic development have also led to an increase in economic policy uncertainty. Economic policy uncertainty refers to the risk of decision making that is caused by the inability of subjects of economic activity to perceive and anticipate economic changes brought about by the government’s economic policy formulation and adjustment [8]. In addition to government macro-regulation, the promotion mechanism of officials under the Chinese-style decentralized system is an important factor in the increased uncertainty of regional economic policies. To improve their political performance, local officials actively guide and interfere with enterprise decision making through the formulation of policies [9,10]. However, local officials are subject to many factors, such as age, ability, and concept, all of which magnify the differences in policymaking and increase the uncertainty of economic policy [11].
Therefore, this study focused on the impact mechanism of innovative entrepreneurial vitality on economic resilience. We needed to solve the following problems: Does the improvement in innovative entrepreneurial vitality effectively enhance economic resilience? If an economic policy cannot be perceived as “positive” or “negative”, that is, when economic policy uncertainty increases, is innovative entrepreneurial vitality a driving or resistant force for the enhancement of economic resilience? Simultaneously, under economic policy uncertainty, what is the internal mechanism of innovative entrepreneurial vitality regarding economic resilience? Given their importance in policy implementation and risk response, exploring the relationship between economic policy uncertainty, innovative entrepreneurial vitality, and economic resilience at the urban level is of great reference significance and marginal empirical value for the formulation of policies related to entrepreneurial innovation and the path to improving economic resilience.
We conducted our research as follows. First, a dynamic spatial Durbin model was applied to analyze the impact of economic policy uncertainty and innovative entrepreneurial vitality on economic resilience. Simultaneously, a mediated moderation effects model was employed to explain the mechanism of economic policy uncertainty and innovative entrepreneurial vitality on economic resilience further from the triple perspective of industrial structure, income gap, and economic agglomeration, which may provide a new direction for future research. Second, we fully considered the geographical location and economic scale heterogeneity that characterize the impact of innovative entrepreneurial vitality and economic policy uncertainty on economic resilience, which could refine research on relevant topics. Finally, our study was based on a sample at the prefecture level, which allowed the findings of this study to be more generalizable and likewise allows for a more precise marginal experience for policymakers who utilize these findings.
The structure and main findings of this paper are organized as follows. Section 2 introduces research that is relevant to economic resilience, as well as research on the relationship between innovative entrepreneurial vitality, economic policy uncertainty, and economic resilience. Section 3 provides the model setting, variables selection, and data sources of this paper. Specifically, we first measured economic resilience using an improved panel entropy method and then constructed an indicator of innovative entrepreneurial vitality using the China Regional Innovation and Entrepreneurship Index based on the joint publication of Peking University’s Enterprise Big Data Research Center and Longxin Data Research Institute. Then, a dynamic spatial Durbin approach and a moderated mediation effects approach were employed to analyze the impact of innovative entrepreneurial dynamism and economic policy uncertainty on economic resilience, with a combination of the China Urban Statistical Yearbook database and 269 prefecture-level cities used as the research sample. Section 4 provides the empirical results of the analysis and the associated discussion. We found that there were significant time lags and spatial spillover characteristics of economic resilience; innovative entrepreneurial vitality significantly enhanced economic resilience; and economic policy uncertainty strengthened the positive impact of innovative entrepreneurial vitality on economic resilience. Moreover, under economic policy uncertainty, innovative entrepreneurial vitality promoted economic resilience by upgrading industrial structures, alleviating income disparity, and promoting economic agglomeration. Finally, the effects of innovative entrepreneurial vitality and economic policy uncertainty on economic resilience showed significant differences across city sizes and agglomerations. The last section presents the research conclusions and policy implications.

2. Literature Review

Due to the impact of economic globalization, countries around the world are exposed to the risk of economic losses caused by the spread of economic crises. Therefore, improving the ability to cope with economic crises has become one of the most important issues facing governments around the world. Holling (1973) first introduced the concept of resilience from an ecological perspective. Subsequently, the connotation of resilience gradually shifted from concepts of traditional equilibrium-based engineering and ecological resilience to evolutionary resilience based on evolutionary theory [12]. In particular, economic resilience research is gradually becoming a geographic and spatial economics hot research area. Some scholars argued that resilient economic systems have the capacity for structural transformation, minimizing the degree of disturbance, and even achieving transformation by exploiting external shocks [13,14]. Martin et al. (2015) provided a more specific definition of economic resilience: the ability to reconfigure the structure of an economy and maintain sustainable growth in output, employment, and wealth [3]. The resilience of a regional economy to recessionary shocks should include four aspects, namely, resistance (the degree of sensitivity and response of the regional economy to recessionary shocks), resilience (the speed and degree of recovery of the regional economy from recessionary shocks), readjustment capacity (the ability of the regional economy to readjust the structure of industries, technology, labor, etc. in the face of recessionary shocks), and the ability to create economic growth paths (the ability of the regional economy to suffer and open a new stable growth path after a shock). This definition has been adopted by many scholars, such as Gong et al. (2017) and Kitsos et al. (2019) [15,16].
As the definition of the concept of economic resilience has continued to become clearer, many scholars have begun to measure economic resilience based on the abovementioned economic resilience analysis framework [17,18,19]. They measured the economic resilience of EU member states, the United States, Canada, Australia, and other regions in response to economic crises over time using data on output, employment, and foreign trade; research approaches include the sensitivity coefficient and indicator system methods [2,20,21,22]. Regarding the factors influencing economic resilience, some scholars argued that regional economic resilience is determined by the influence of a complex set of factors that jointly determine the vulnerability of a region to economic crises and the system’s ability to sustain, adapt, and recover [23,24,25]. Brakman et al. (2014), for example, explored the importance of urbanization and specialization for economic resilience and found that EU regions with relatively large shares of the population in commuting areas are relatively more resilient [26]. Furthermore, Martin (2016) suggested a more comprehensive framework for the analysis of factors influencing economic resilience in terms of industrial structure, labor force, finance, and institutions [27]. Moreover, scholars have empirically studied the influencing factors of economic resilience in terms of locational conditions, regional vulnerability, adaptive capacity, resource abundance, and policy systems [28,29,30]. For example, Xiao (2018) found that knowledge exchange and spillovers between industries can lead to significant differences in economic resilience due to internal and external environmental influences [31]. Palaskas et al. (2015) confirmed that the interconnectedness of industrial specialization and surrounding cities mitigates economic crises and may act as a stabilizer to support economic recovery [32]. By using a sample of 85 cities in the UK as a survey sample, Martin and Gardiner (2019) revealed that differences in the resilience of cities to major shocks may have an impact on their long-term growth [33].
However, research regarding the effect of innovative entrepreneurial vitality on economic resilience has mostly specialized in analyzing the importance of innovation in regional economic resilience, and it was argued that innovation enables regional industrial and technological structures to adapt to changes in economic patterns over time [34,35,36,37]. NESTA (2009), a leading innovation agency, explicitly stated that “innovation is essential to enable economies to recover from recession”, and the UK government’s Department for Business, Innovation, and Skills similarly argues that “innovation can build resilient and dynamic economies”. Bristow and Healy (2018) provided important insights into an evolutionary approach for theorizing the relationship between innovation and economic resilience in their analysis of differences in the speeds of recovery of European regional economies from the 2008 economic crisis; they found that regions that were identified as innovation leaders at the time of the crisis were more likely to resist the crisis or recover more quickly than other regions [35]. In addition, Simmie and Martin (2010) and Isaksen et al. (2014) argued that innovation is key to enabling regions to expand existing specialized industrial sectors and develop more diversified economies continuously so that innovative firms are more competitive and adaptive to shocks in the face of economic crises [2,6]. Nevertheless, there are opposing views on the role of innovation in economic resilience. For example, Sunley (2013) questioned whether there is a lack of evidence showing that economies that are perceived to be innovative are more resilient and that they can resist and quickly recover when a crisis does occur [38]. Thus, the relationship between innovation and economic resilience is more of an implicit assumption than a fact [39].
In addition, it was shown that economic policy uncertainty has a slowing and delaying effect on business investment that inhibits business innovation [8]. However, some scholars argued that economic policy uncertainty provides incentives for firms to innovate, generating a positive Research and Development risk premium that ultimately drives firm growth [40,41,42]. Furthermore, innovation can increase the operational risk of a firm while creating opportunities for firms to increase their investment in innovation for future growth options in terms of real options theory [9,43]. If the benefit that is produced by such risky innovation investment is greater than the option value produced by the delay and slowdown effect, enterprises will further increase Research and Development investment to improve their innovation ability and seize the future market under economic policy uncertainty [44,45]. Thus, economic policy uncertainty would be an engine for increases rather than decreases in regional innovation output.
In summation, previous studies have provided relevant theoretical and empirical experiences for the analysis undertaken in this study, but there are still some research defects. First, few scholars have analyzed the impact of innovative entrepreneurial vitality on economic resilience from the perspective of economic policy uncertainty. Second, there is great heterogeneity in the geographical locations and economic scales of various prefecture-level cities, but few studies have examined the effects of economic policy uncertainty and innovative entrepreneurial vitality on economic resilience by considering the characteristics of heterogeneous cities. Finally, few studies have explained the spatial agglomeration characteristics, dynamic influence mechanism, and spillover effects of economic resilience from the perspective of prefecture-level cities.

3. Method

3.1. Economic Strategies

The studies that have been conducted mainly explored innovative entrepreneurial vitality, economic policy uncertainty, and economic resilience in a non-spatial architecture, which ignores spatial interactions [46,47]. However, economic systems are interconnected; therefore, their stability and resilience may also be influenced by the economic systems of surrounding areas. This is incompatible with the framework of traditional measurement methods that is supported by many scholars [48,49]. For example, LeSage and Pace (2009) noted the existence of the spatial dependence of dependent variables among spatial units when spatial sample data were formed, as well as noting that characteristic variables in one region were positively or negatively influenced by characteristic variables in neighboring regions [48]. Therefore, referring to Le Sage and Pace (2009), we introduced spatial effects into a general linear model and combined spatial lags and spatial error models to form a spatial Durbin model to verify spatial effects among target variables [48]. Further, to minimize the systematic bias that may be caused by static models that do not consider spatio-temporal effects, we added a one-period lag term of the dependent variable to the regression model to construct a dynamic spatial Durbin model as follows [49]:
E R E i t = α 0 + ρ j = 1 n W i j t E R E i t + α 1 E R E i t 1 + α 2 I E V i t + α 3 i j N W i j t I E V i t + k = 1 6 δ i t x i t + μ i + θ t + ε i t
where i represents the city; t represents the year; E R E represents economic resilience; E R E i t 1 represents the lag term of economic resilience; I E V represents the innovative entrepreneurial vitality; and X represents a series of control variables that affect economic resilience, namely, human capital ( H U M ) , infrastructure development ( R O A ) , informatization technology ( I N T ) , and openness ( F D I ) . Specifically, we used the ratio of the number of students enrolled in general higher education schools to the total urban population to represent human capital ( H U M ) ; we chose the total exports and imports of cities as a share of GDP to characterize external openness ( F D I ) ; we measured infrastructure development ( R O A ) as the area of roads per capita; and we measured informatization technology ( I N T ) as the number of international internet users per 10,000 people. ρ is the spatial spillover coefficient of economic resilience; α 0 , , α n are the parameters to be estimated; W is the spatial weight matrix; μ i and θ t are the individual fixed effect and time fixed effect, respectively; and ε i t is the disturbance term. We discuss the reasons for the selection of the variables and how the variables were measured in more detail in Section 3.4. Besides, some of the variables were taken as logarithms in order to maintain the smoothness of the data.
To investigate the moderating effect of economic policy uncertainty on economic resilience further, the moderating term was introduced into the dynamic spatial Durbin model. The model is set up as follows:
E R E i t = α 0 + ρ j = 1 n W i j t E R E i t + α 1 E R E i t 1 + α 2 I E V i t + α 3 E P U i t + α 4 i j N W i j t I E V i t + α 5 i j N W i j t E P U i t + α 6 I E V i t × E P U i t + k = 1 6 δ i t x i t + μ i + θ t + ε i t
where E P U represents economic policy uncertainty. All variables of Equation (2) are defined in the same way as Equation (1), except for E P U .
Additionally, under the intensification of economic policy uncertainty, innovative entrepreneurial vitality may contribute to economic resilience by promoting industrial structure upgrading, narrowing the income gap, and enhancing economic agglomeration. To verify these three pathways, with reference to Yang et al. (2021), a mediated moderating effect model was established to explain whether the conduction mechanism exists [50]. The model was set as follows:
E R E i t = c 0 + ρ Σ j = 1 n W i j t E R E i t + c 1 E R E i t 1 + c 2 I E V i t + c 3 E P U i t + c 4 Σ i j N W i j t I E V i t + c 5 Σ i j N W i j t E P U i t + c 6 I E V i t × E P U i t + Σ k = 1 6 δ i t x i t + μ i + θ t + ε i t
M I D i t = a 0 + ρ j = 1 n W i j t E R E i t + a 1 E R E i t 1 + a 2 I E V i t + a 3 E P U i t a 4 i j N W i j t I E V i t +   a 5 i j N W i j t E P U i t + a 6 I E V i t × E P U i t + k = 1 6 δ i t x i t + μ i + θ t + ε i t    
E R E i t = c 0 ' + ρ j = 1 n W i j t E R E i t + c 1 ' E R E i t 1 + c 2 ' I E V i t + c 3 ' E P U i t + c 4 ' i j N W i j t I E V i t + c 5 ' i j N W i j t E P U i t + c 6 ' I R V i t × E P U i t + b 1 M I D i t + b 2 M I D i t × E P U i t + k = 1 6 δ i t x i t + μ i + θ t + ε i t
where the mediation variable ( M I D ) comprises industrial structure upgrading ( I N D ) , the income gap ( G A P ) ,   and economic agglomeration ( E C O ) . The criteria of the mediated moderation effect were as follows: If the moderating term estimation coefficient ( a 6 ) in Equation (4) and the mediation variable estimation coefficient ( b 1 ) in Equation (5) were both significant, there was a mediating effect. On this basis, if the moderating term estimation coefficient ( c 6 ' ) in Equation (5) was less than the moderating term estimation coefficient ( c 6 ) in Equation (3) and was not significant, the moderating effect was fully mediated; under the opposite conditions, the moderating effect was partially mediated.

3.2. Spatial Weight Matrix Setting

3.2.1. Geographical Distance Weighting Matrix (W1)

According to the first law of geography, the degree of connection between two things is proportional to the distance. The geographical distance matrix is measured as the inverse of the squared distance between two regions. Our spatial weight matrix was constructed as follows:
W 1 = { 0 , i = j 1 / d i j 2 , i j
where d i j represents the geographical distance between city i and city j .

3.2.2. Economic Geography Weighting Matrix (W2)

The economic resilience of two regions is influenced not only by their geographical distance but also by their economic development. Therefore, we constructed an economic geographic weighting matrix by combining both geographic and economic dimensions. The specific matrix was set up as follows:
W a = { 1 ,                                                     i = j 1 | r g d p i r g d p j | + 1 , i j
W b = { 0 ,                         i = j 1 / d i j 2 ,     i j
W 2 = W a × W b
where W a represents the economic weight matrix; r g d p i and r g d p j represent the annual GDP per capita of cities i   and j , respectively; W b represents the geographical weight matrix; and W 2 represents the economic geographical weight matrix.

3.3. Spatial Correlation Tests

Before performing the spatial Durbin model estimation, we needed to determine whether the variables were spatially correlated. We applied the global Moran’s I index to test the spatial dependence characteristics of the variables. The value of Moran’s I index ranges from −1 to 1. If the Moran’s I index is less than zero and significant, there is a high and low clustering effect of the variable. If Moran’s I index is equal to zero and significant, there is no spatial effect, and the variable is randomly distributed. If Moran’s I is greater than zero, there is a high-high or low-low clustering effect of the variable. The formula for calculating Moran’s I index is as follows:
M o r a n ' s I = i = 1 N j = 1 N W i j ( Y i Y ¯ ) ( Y j Y ¯ ) S 2 i = 1 N j = 1 N W i j
where S 2 = 1 N i = 1 N ( Y i Y ¯ ) 2 and Y ¯ = 1 N i = 1 N Y i ; Y i denote the measured variable for city i ; N denotes the total number of samples; and W i j denotes the spatial weight matrix.

3.4. Variables Selection

3.4.1. Dependent Variable

In previous studies, many scholars used the GDP increase and variable rates to reflect economic resilience, but a single indicator is not sufficient to reflect the economic resilience of a region. Multi-indicator measures of economic resilience tend to cover more comprehensive and integrated information; therefore, they are favored by most scholars [51]. For example, Berkes et al. (2003) and Foster (2007) measured regional economic resilience using four dimensions: prediction, preparedness, response, and recovery [52,53]. Moreover, Boschma (2015) argued that regional economic resilience should not only include the ability to face short-term crises but also to resume long-term economic growth [36]. Therefore, to ensure the reasonableness and normality of index selection, we constructed a comprehensive evaluation index system of economic resilience based on the pressure-state-response model from the three aspects of an economic system’s resilience, regulation capacity, and recovery response capacity after drawing on the research of Martin et al. (2016) and Feng et al. (2020) [27,54]. Resistance ability indicates the ability of a region to integrate social resources and maintain the stable operation of life and production after an economic shock that is caused by sudden shocks and disruptive events, and it is characterized by urban economic strength, industrial development, foreign investment dependence, and residents’ consumption capacity. Regulating ability refers to a series of economic and social state changes in the process of an economic system facing pressure disturbances in a certain time stage of shock and destruction, and it is characterized by consumption potential, urbanization level, employment pressure, and financial support. Responsiveness refers to the remedial measures that are taken by the government, society, enterprises, or individuals to mitigate, prevent, or deter economic damage to allow for maintaining or repairing an economic system, and it is measured using the scales of investment; government support; industrial diversification; and expenditure in science, education, and the environment.
Additionally, after drawing on the work of Cao et al. (2021) and Xie et al. (2018) [55,56], an improved panel entropy method was employed to measure the level of economic resilience by city and year. Specifically, we adopted the information entropy principle to determine the weights, which could objectively and accurately evaluate the research object. Meanwhile, in order to realize the comparison between different years, we improved the entropy method by adding the time variable and finally formulated the panel entropy method that was applied in this study to rationalize the analysis results better. The specific indicators are selected as shown in Table 1. The measurement of economic resilience of each prefecture-level city was conducted as follows.
The selected indicators were standardized:
Positive indicators :   O α i j = x α i j x m i n x m a x x m i n
Negative indicators :   O α i j = x max x α i j x m a x x m i n
where x m a x and x m i n denote the maximum and minimum values of the j th indicator, respectively ;   x α i j and O α i j represent the standardized pre-treatment and post-treatment values of the j th indicator, respectively.
The indicators were normalized as follows:
G α ij = O α i j α = 1 m i = 1 s O α i j
The entropy value was calculated using:
E j = s 1 α = 1 m i = 1 s G α i j ln G α i j
where s 1 = 1 l n ( m × s ) ;   m and k represent the year and the number of prefecture-level cities, respectively.
The redundancy of each indicator was calculated as follows: Y j = 1 E j .
The weight of each indicator was calculated as follows: W j = Y j j = 1 n Y j .
The economic resilience indicator of each prefecture-level city was calculated as follows: E R E α j = G α i j × W j .

3.4.2. Core Explanatory Variable

Most studies were conducted to measure indicators that are related to innovative entrepreneurial vitality based on input-output indicators, such as Research and Development expenditure and the number of patents. However, in reality, some enterprises misrepresent their Research and Development expenditure and unilaterally pursue several patents to obtain government tax subsidies and innovation policy support. If only the abovementioned indicators are used to measure innovative entrepreneurial vitality, one may ignore the mutually reinforcing relationship between innovation and entrepreneurship. Moreover, the abovementioned indicators have not yet incorporated multi-dimensional innovation and entrepreneurship data, including those of human, capital, and technology, into a unified analysis framework. Therefore, we used the Longxin Innovation Entrepreneurship Index, which was jointly published by Peking University’s Enterprise Big Data Research Center and Longxin Data Research Institute to measure innovative entrepreneurial vitality ( I E V ) , which is based on more than 50 million data records that are contained in an industrially and commercially registered enterprise database, patent and trademark databases, etc. This index has the following advantages. The index focuses on the actual output rather than the input of innovation entrepreneurship within enterprises, which makes the index more objective and authentic. Besides, the evaluation results are comprehensive and complete due to their use of the full range of data from all industries and sizes of enterprises, including start-ups and micro-, small-, and medium-sized enterprises with high levels of innovation activity. Moreover, the integrated multi-domain data on human, investment, and technology are uniformly divided from a corporate perspective so that they cover different aspects of innovation and entrepreneurship, reflecting the scientific and multi-dimensional nature of the evaluation results.

3.4.3. Moderation Variables

The economic policy uncertainty ( E P U ) index that was constructed by Baker et al. (2016) was selected to measure economic policy uncertainty [57]. The index was obtained by counting the keywords that are related to the characterization of economic policy uncertainty in the South China Morning Post (SCMP), which is a major English language newspaper in Hong Kong, China, and dividing the frequency of keyword occurrences by the total number of articles published in the SCMP in the same month. The index, which covers a wide range of industrial, fiscal, and monetary policies of the central and local governments, is not only reasonably good in terms of time variability and continuity but also more accurately reflects the variability in China’s economic policies, since the index comprises monthly data that are converted into annual data via arithmetic averaging.

3.4.4. Mediation Variables

Referring to Wu et al. (2021) and Ren et al. (2021), we transformed the industrial structure rationalization and upgrading index into an industrial structure upgrading index ( I N D ) [58,59]. The ratio of per capita disposable income of urban residents to the net income of rural residents was used to represent the income gap ( G A P ) [60]. Following Huang et al. (2021), economic agglomeration ( E C O ) was characterized using the GDP per square kilometer [61].

3.4.5. Control Variables

To analyze the impact of innovative entrepreneurial vitality and economic policy uncertainty on economic resilience more accurately, we also added the following variables that could affect economic resilience. Abundant human capital helps cities to develop innovative activities and new industries during post-crisis adjustment periods, which is a key source of maintaining economic resilience [62]. The ratio of the number of students enrolled in general higher education institutions to the total urban population was used to characterize human capital ( H U M ) . A well-developed infrastructure allows the economic development of a region to capitalize on the physical resources of other regions, which, in turn, provides a favorable environment for economic resilience [63]. Infrastructure development was expressed in terms of the area of roads per capita in a city ( R O A ) . The improvement of an informatization level can allow information resources to achieve effective dissemination and stimulate the information dividend of using subjects, thus contributing to the improvement in economic resilience [64]. In this study, the number of international internet users per 10,000 people was used to measure informatization technology ( I N T ) . External shocks are likely to be largely transmitted from international markets; as such, the more open an economy is compared to a closed one, the more vulnerable it is to the negative effects of shocks [65]. In this study, the city’s total imports and exports as a proportion of the GDP were chosen to measure openness ( F D I ) .

3.5. Data Sources

We selected panel data from 269 prefecture-level cities in China from 2004 to 2018 for the empirical analysis. We mainly used data from the China Regional Economic Statistical Yearbook, the China City Statistical Yearbook, the statistical yearbooks of each city, statistical bulletins, and the EPS statistical database. The descriptive statistics of the variables are shown in Table 2.

4. Results and Discussion

4.1. Spatial Correlation Results

Based on the geographical distance weight matrix and the economic geography weight matrix, Moran’s I index method was employed to test the spatial correlation of economic resilience (see Table 3). Additionally, we used Moran scatter plots to visually portray the spatial correlates of economic resilience better (Figure 1 and Figure 2). Table 3 shows that the Moran’s I index values for economic resilience in China were all significantly positive at the 1% level. Figure 1 and Figure 2 illustrate the concentration of scattered points toward quadrants one and three, respectively, indicating that there was a significant positive spatial correlation and that there were clustering characteristics of economic resilience at a region-wide scale and that the enhancement of urban economic resilience had a significant radiating and driving effect on the economic resilience of surrounding and neighboring cities. Therefore, the Chinese government needs to develop connecting links further for factors such as production, distribution, circulation, and consumption; promote the domestic cycle; and form a resilient economic cycle system of inter-regional sustainable development.

4.2. Analysis of the Direct and Moderating Effects

As individual differences and cross-period factors in cities may lead to biases in the estimation of results, a dynamic spatial Durbin model with both time and individual fixation was used as the initial model, and LR and Wald tests were conducted to verify the model’s applicability. The relevant results are displayed in Table 4 and show that the dynamic spatial Durbin model with both time and individual fixation passed the LR and Wald tests at the 1% level of significance; therefore, it was reasonable to use the dynamic spatial Durbin model with both time and individual fixation to study economic resilience. Regarding the explanatory variables, economic resilience was found to pass the significance test at the 1% level with a positive coefficient; that is, each 1% increase in the level of economic resilience increases the economic resilience in the later period by 0.7647%, indicating that the time lag effect of economic resilience exists. Economic resilience showed clear path dependence, indicating that the accumulation of economic resilience by the virtuous economic activities of cities in the previous period had a “snowball” effect on their economic resilience. We also found that the coefficient of   ρ was significantly positive at the level of 1%, which means that there were significant characteristics of interregional interaction in economic resilience, i.e., the improvement in local economic resilience had positive impacts on the economic resilience of neighboring regions. These results provide marginal empirical support for the construction of economic interconnections between cities to withstand external shocks.
Columns (1) and (3) show that the coefficient of I E V was significantly positive, indicating that innovative entrepreneurial vitality could significantly enhance economic resilience; that is, for every 1% increase in I E V , E R E will increase by 0.0127%. This is similar to the findings obtained by Williams et al. (2013) and Bristow and Healy (2018) [35,66]. Su and Zhao (2020) reported that entrepreneurial vitality significantly increases economic resilience, and the effect of entrepreneurial vitality on economic resilience gradually strengthens with an expanding city size [7]. An increase in innovative entrepreneurial vitality generates new firms and industries that not only enhance market competition and the metabolism of old and new firms but also expand the market size and factor demand. Expanding both market size and demand leads to growth in factor supply and product innovation, which, in turn, has positive impacts on economic resilience [5,6]. In addition, an increase in innovative entrepreneurial vitality also promotes the development of new industries and the diversification of industrial categories, which together promote the diversification of industrial structures and undoubtedly enhance economic resilience [67].
The moderating effect of economic policy uncertainty on innovative entrepreneurial vitality and economic resilience was verified, as shown in columns (2) and (4), where the moderating term between innovative entrepreneurial vitality and economic policy uncertainty was significantly positive at the 1% level; i.e., each 1% increase in urban innovative entrepreneurial vitality moderated by economic policy uncertainty will increase economic resilience by 0.0140%, indicating that economic policy uncertainty positively moderates the relationship between innovative entrepreneurial vitality and economic resilience. The findings of Roper and Tapinos (2016) and Yuan and Li (2021) support our view that, for example, firms and other subjects can still actively take the risk of technological innovation under conditions of economic policy uncertainty, mainly because innovation can provide firms with a first-mover advantage, which makes them market leaders and is also beneficial for economic resilience [68,69]. In addition, increased economic policy uncertainty also provides opportunities for entrepreneurial and innovative firms to a certain extent, motivating them to take advantage of their emergence to capture market shares and expand their market power to create a broader development space. The abovementioned behavior of this type of enterprise has positive impacts on the market, consequently improving economic resilience.

4.3. Mediated Moderation Mechanism Test

The previous results confirmed the specific effect of innovative entrepreneurial vitality on economic resilience in the context of economic policy uncertainty. However, a question remains: how does innovative entrepreneurial vitality affect economic resilience under economic policy uncertainty? To address the abovementioned query, we analyzed the impact of innovative entrepreneurial vitality on economic resilience under economic uncertainty scenarios in terms of three paths: upgrading industrial structure, alleviating income disparity, and guiding economic aggregation. The results are shown in Table 5. Column 2 shows that the moderating effect between innovative entrepreneurial vitality and economic policy uncertainty significantly promoted industrial structure upgrading. Column 3 shows that, under economic policy uncertainty, innovative entrepreneurial vitality enhanced economic resilience through upgrading industrial structures. It is not difficult to understand that with an increase in innovative entrepreneurial vitality, different types of entrepreneurial activities increase and penetrate multiple fields, thus leading to new business models and sectors that promote industrial convergence and enable the full utilization of production factors. Moreover, the growth of innovative entrepreneurial vitality means that technologies, products, and knowledge are being iterated and updated, thus accelerating business development and industrial upgrades. Meanwhile, innovation and entrepreneurial behavior can coalesce various industries’ knowledge into “technology pools” that, in turn, facilitate the absorption of knowledge by different industries and provide a way for regions to enhance their economic resilience through industrial transformation [19]. Furthermore, the narrowing of the income gap inhibits the polarization of consumption among income groups, which is an important factor in stabilizing a society and is undoubtedly conducive to the improvement in economic resilience.
Column 4 shows that the moderating effect between innovative entrepreneurial vitality and economic policy uncertainty significantly narrowed the local income gap. Column 5 shows the comprehensive effect of the income gap; i.e., under the adjustment of economic policy uncertainty, innovative entrepreneurial vitality could improve economic resilience by reducing the local income gap. Innovative entrepreneurship is a process of resource integration and factor clustering. Policymakers in many countries have been considering innovation and entrepreneurship as important ways to raise income levels and reduce income disparities. The income growth effect of increased innovative entrepreneurial vitality can directly provide more employment opportunities for low-income groups, which can consequently raise the wages of low-income groups [70]. For example, the labor demand that is generated by entrepreneurship and start-up activities can absorb the surplus labor of the low-income group, promote the diversification of the income sources of low-income workers, and increase the income of low-income workers [71]. Similarly, a narrower income gap discourages the shift of low-level labor to the growth poles, and thus the areas from which the labor force shifts do not become a burden on the city’s economic development due to labor shortages; ultimately, the economic resilience of the city is strengthened.
Column 6 shows that the moderating effect between innovative entrepreneurial vitality and economic policy uncertainty significantly promoted economic agglomeration. Column 7 reflects the comprehensive effect of economic agglomeration, which implies that under the adjustment of economic policy uncertainty, innovative entrepreneurial vitality could improve economic resilience by guiding economic agglomeration. Cities with high innovative entrepreneurial vitality absorb a large amount of capital to support the production and operation of new enterprises, thus leading to economic agglomeration. The advantages of specialization that are caused by economic agglomeration are conducive to productivity improvements and economies of scale. Moreover, the high-end talent, technology, and resources that are created by economic agglomeration can cause resource allocation and sharing effects, such as positive externalities; following external shocks, an economic system can again rapidly integrate internal resources, adjust industry structures to manage risks, effectively improve its toughness, and enhance a city’s economic system’s ability to adapt.

4.4. Heterogeneity Analysis

4.4.1. Urban Agglomeration Heterogeneity Analysis

It was shown that urban agglomerations lead to multilevel differences in resistance and resilience when managing external shocks due to their location and uneven development. Therefore, we further discuss the impact of innovative entrepreneurial vitality on the economic resilience of different urban agglomerations under economic policy uncertainty. With reference to Yang et al. (2021) [50], the whole sample was divided into 11 urban agglomerations, such as the Yangtze River Delta, Pearl River Delta, Beijing-Tianjin-Hebei, and Ha-Chang. Through the model applicability test, the dynamic spatial Durbin model with both individual and time fixation was again selected for analysis. The relevant results are shown in Table 6 (due to space limitations, we only report the regression results for the economic geography weight matrix). Overall, the directivity and significance of the main variables in different urban agglomerations were found to be different to a certain extent. Regarding the explanatory variables, the forms of economic resilience were all found to be significantly positive at the 1% level with a one-period lag implemented. The spatial effect was insignificant in the Beijing-Tianjin-Hebei and Middle Yangtze River urban agglomerations, but it was significant in the remaining urban agglomerations. These results indicate that the path dependence effect and spatial spillover effect of urban economic resilience were differentiated among the 11 urban agglomerations; i.e., we found significant spatial and temporal differences in the cumulative effect of economic resilience among different urban agglomerations. Regarding the core explanatory variables, for every 1% increase in innovative entrepreneurial vitality ( p < 0.1 ), the economic resilience of Chengdu-Chongqing and Central Plains urban agglomerations increases by 0.0316% and 0.1039%.
However, in the Yangtze River Delta, Pearl River Delta, Beijing-Tianjin-Hebei, Ha-Chang, South-Central Liaoning, Shandong Peninsula, and Guanzhong urban agglomerations, innovative entrepreneurial vitality did not play a significant role in promoting economic resilience. The innovative entrepreneurial vitality inhibited the economic resilience of urban agglomerations on the west banks of the straits and the middle reaches of the Yangtze River, but the inhibition effect was not significant. The abovementioned results show that there is great heterogeneity in the impact of innovative entrepreneurial vitality on economic resilience. The moderating effect between innovative entrepreneurial vitality and economic policy uncertainty also shows significant multilateral differences in space. Under the moderation of economic policy uncertainty, for each 1% increase in innovative entrepreneurial vitality, the economic resilience of Shandong Peninsula and the Yangtze River Delt can significantly increase by 0.1517% and 0.0238%, while the economic resilience of Chengdu-Chongqing and Central Plains urban agglomerations significantly decreases by 0.0250% and 0.1435%, respectively. For the Pearl River Delta, Beijing-Tianjin-Hebei, Ha-Chang, South-Liaoning, and Guanzhong urban agglomerations, the contribution of innovative entrepreneurial vitality to economic resilience is not significant under the moderation of economic policy uncertainty. For the Yangtze River Delta and the west coast of the Taiwan Straits urban agglomerations, the dampening effect of innovative entrepreneurial vitality on economic resilience, moderated by economic policy uncertainty, is not significant.
It is not difficult to understand that under the intensification of economic policy uncertainty, even if local governments introduce various supporting policies to encourage innovation and entrepreneurship, the anti-risk ability of most innovative start-up enterprises is poor. Innovation ability is still not enough. In addition, we found a big gap in the environment of innovation and entrepreneurship among urban agglomerations. It is difficult to integrate and match innovative entrepreneurial vitality with the actual situation of a region. The industry-university-research system of innovative start-up enterprises is disjointed due to external shocks, which makes it difficult for innovation output to play its role in promoting economic resilience. Finally, the government’s “GDP tournament” leads to an “innovation cult” that leads to a patent bubble. In addition, it is hard for enterprises to “cheat subsidies” by using low-quality innovation patents; therefore, economic resilience cannot be effectively improved [72].

4.4.2. Economic Scale Heterogeneity Analysis

Additionally, based on the classification of prefecture-level cities in China by the China Business Economics Research Institute, we divided prefecture-level cities into first-, second-, third-, and fourth-tier cities to explore the heterogeneous effects of innovative entrepreneurial vitality and economic policy uncertainty on economic resilience under different city levels. The statistical results are shown in Table 7 (due to space limitations, we only report the regression results for the economic geography weight matrix). Table 7 reports that the dynamic improvement path and spatial spillover effects of urban economic resilience still existed after the heterogeneity analysis was conducted. Columns (1), (3), (5), and (7) show that the coefficient of I E V was significantly positive within the 5% level; i.e., for every 1% increase in innovative entrepreneurial vitality, the economic resilience of first-, second-, third-, and fourth-tier cities improves by 0.9160%, 0.2594%, 0.0402%, and 0.0160%, respectively, indicating that innovative entrepreneurial vitality significantly improved the economic resilience of first-, second-, third-, and fourth-tier cities. Furthermore, we also found that the promoting effect of innovative entrepreneurial vitality on economic resilience gradually increased with the increase in urban level.
Because the proportion of surviving innovative start-up enterprises was too high, and the proportion of opportunity innovative start-up enterprises was too low in areas with low levels of economic development, the knowledge spillover effect was weakened, thus ultimately affecting economic resilience. In areas with high economic development, innovation and entrepreneurship activities were encouraged and protected by the government more, which not only provided a good basis for expanding the external spillover effects of local innovation and entrepreneurship but also helped to improve urban economic resilience. Regarding the coefficient of the moderating term, with an increase in economic policy uncertainty, innovative entrepreneurial vitality inhibited the economic resilience of first- and second-tier cities, but this effect was not significant for first-tier cities. Innovative entrepreneurial vitality significantly improved the economic resilience of third- and fourth-tier cities, but this promoting effect on third-tier cities was not significant. The abovementioned results show that the heterogeneous impact of innovative entrepreneurial vitality and economic policy uncertainty on economic resilience still existed at the urban level after the heterogeneity analysis was conducted.

4.5. Robustness Test

To test the robustness of our empirical results, the following three robustness tests were performed. First, the explained variables and core explanatory variables were re-estimated. With reference to Faggian et al. (2018) [73], the rate of change in the GDP was adopted to measure economic resilience, and the number of regional patent grants was selected to represent innovative entrepreneurial vitality. Second, the weight matrix was changed. The GDP of each city was used to construct the economic weight matrix as a new weight matrix. Third, the endogenesis of the model was considered. We used the lag of innovative entrepreneurial vitality as a tool variable. Moreover, officials’ replacement was used as a tool variable in this study. We adopted the two-stage least square method (2SLS) for the endogenesis test. The robustness test results are shown in Table 8. We found that there was no significant change in the significance and coefficient direction of the main variables after changing the measurement form of variables, changing the spatial weight matrix, and considering endogenous problems, indicating that the empirical results of this study are robust and reliable.

5. Conclusions and Policy Recommendations

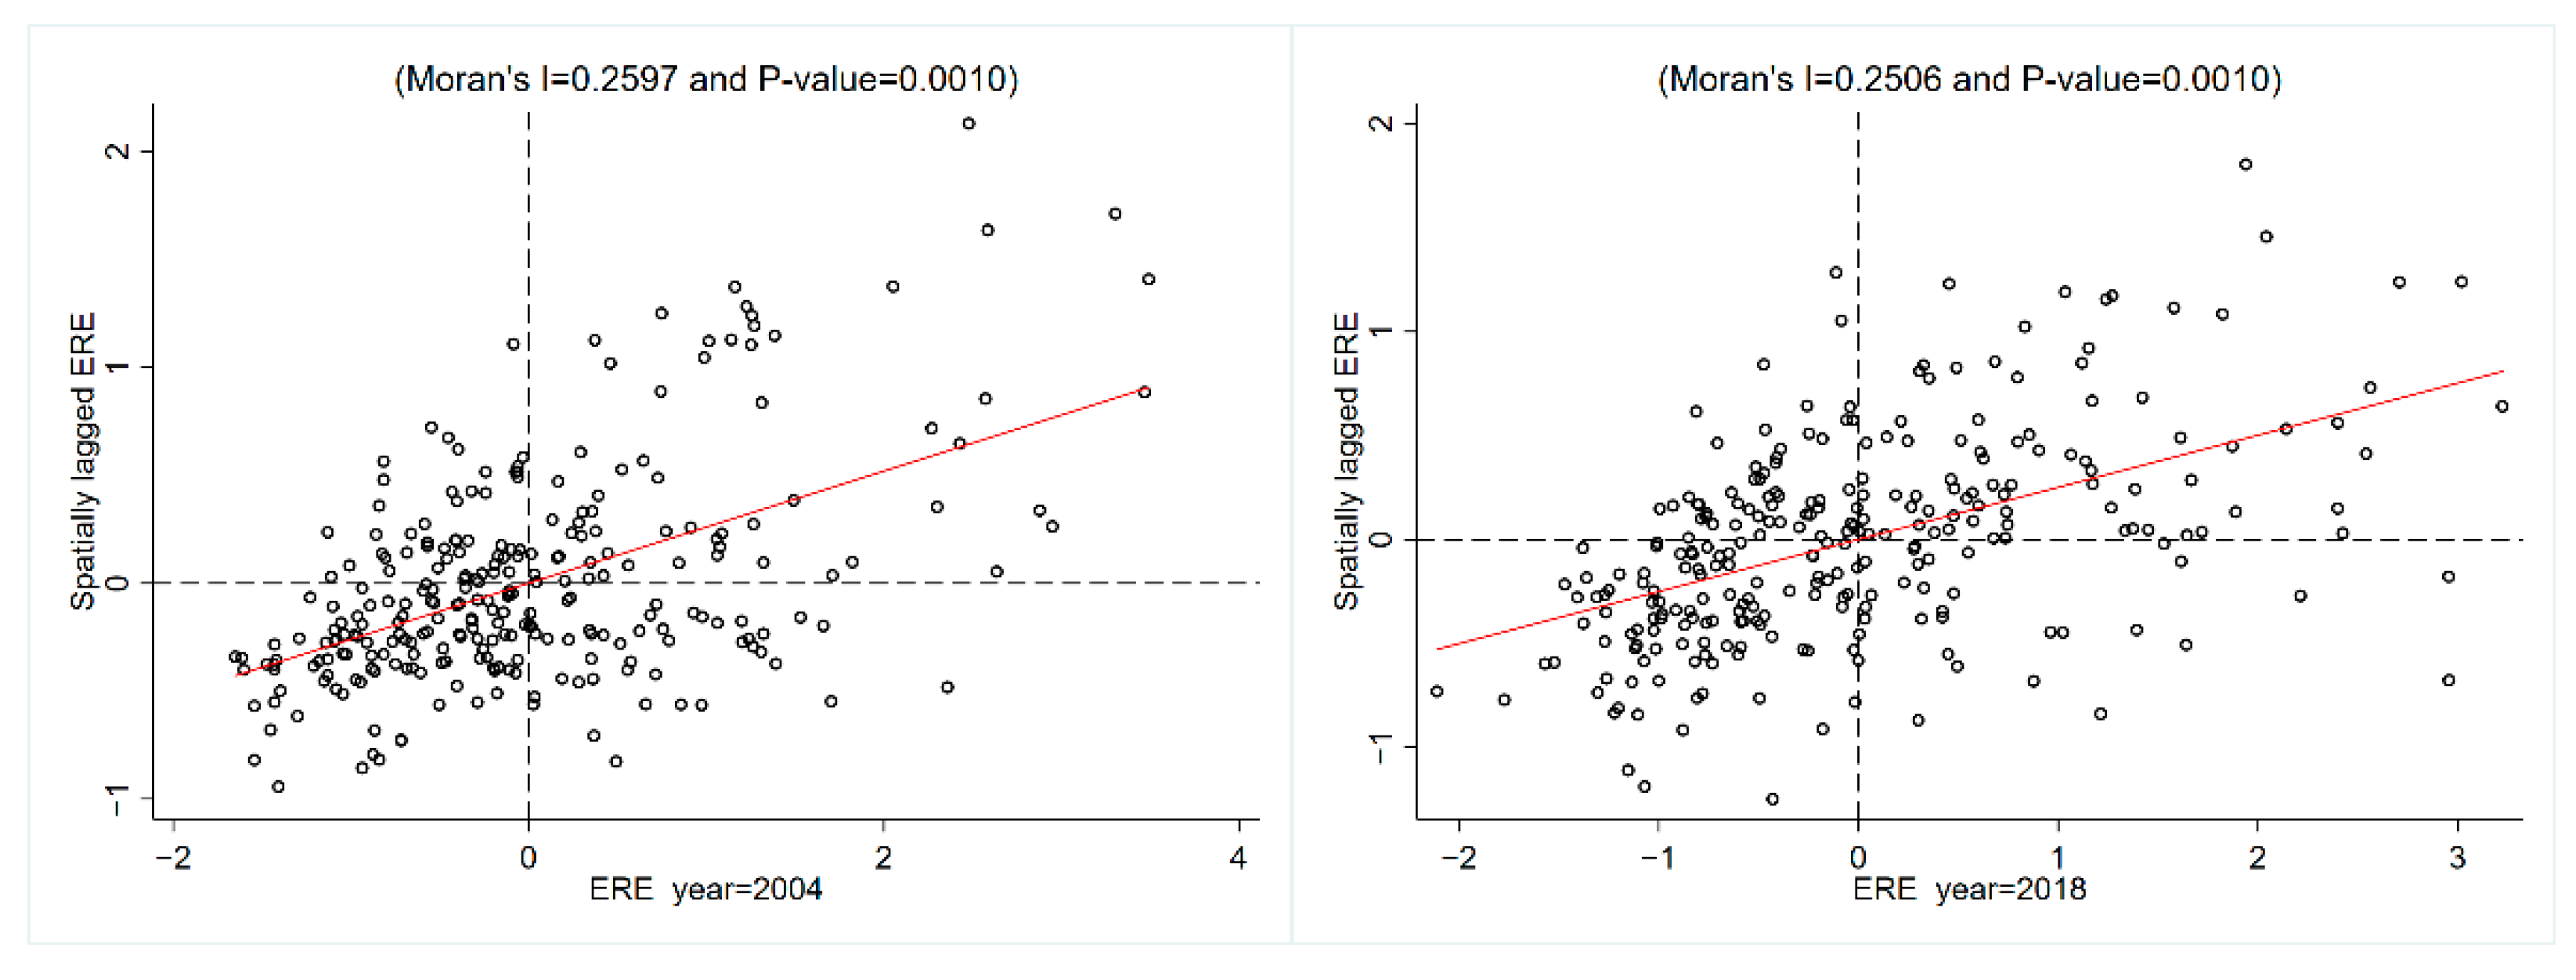
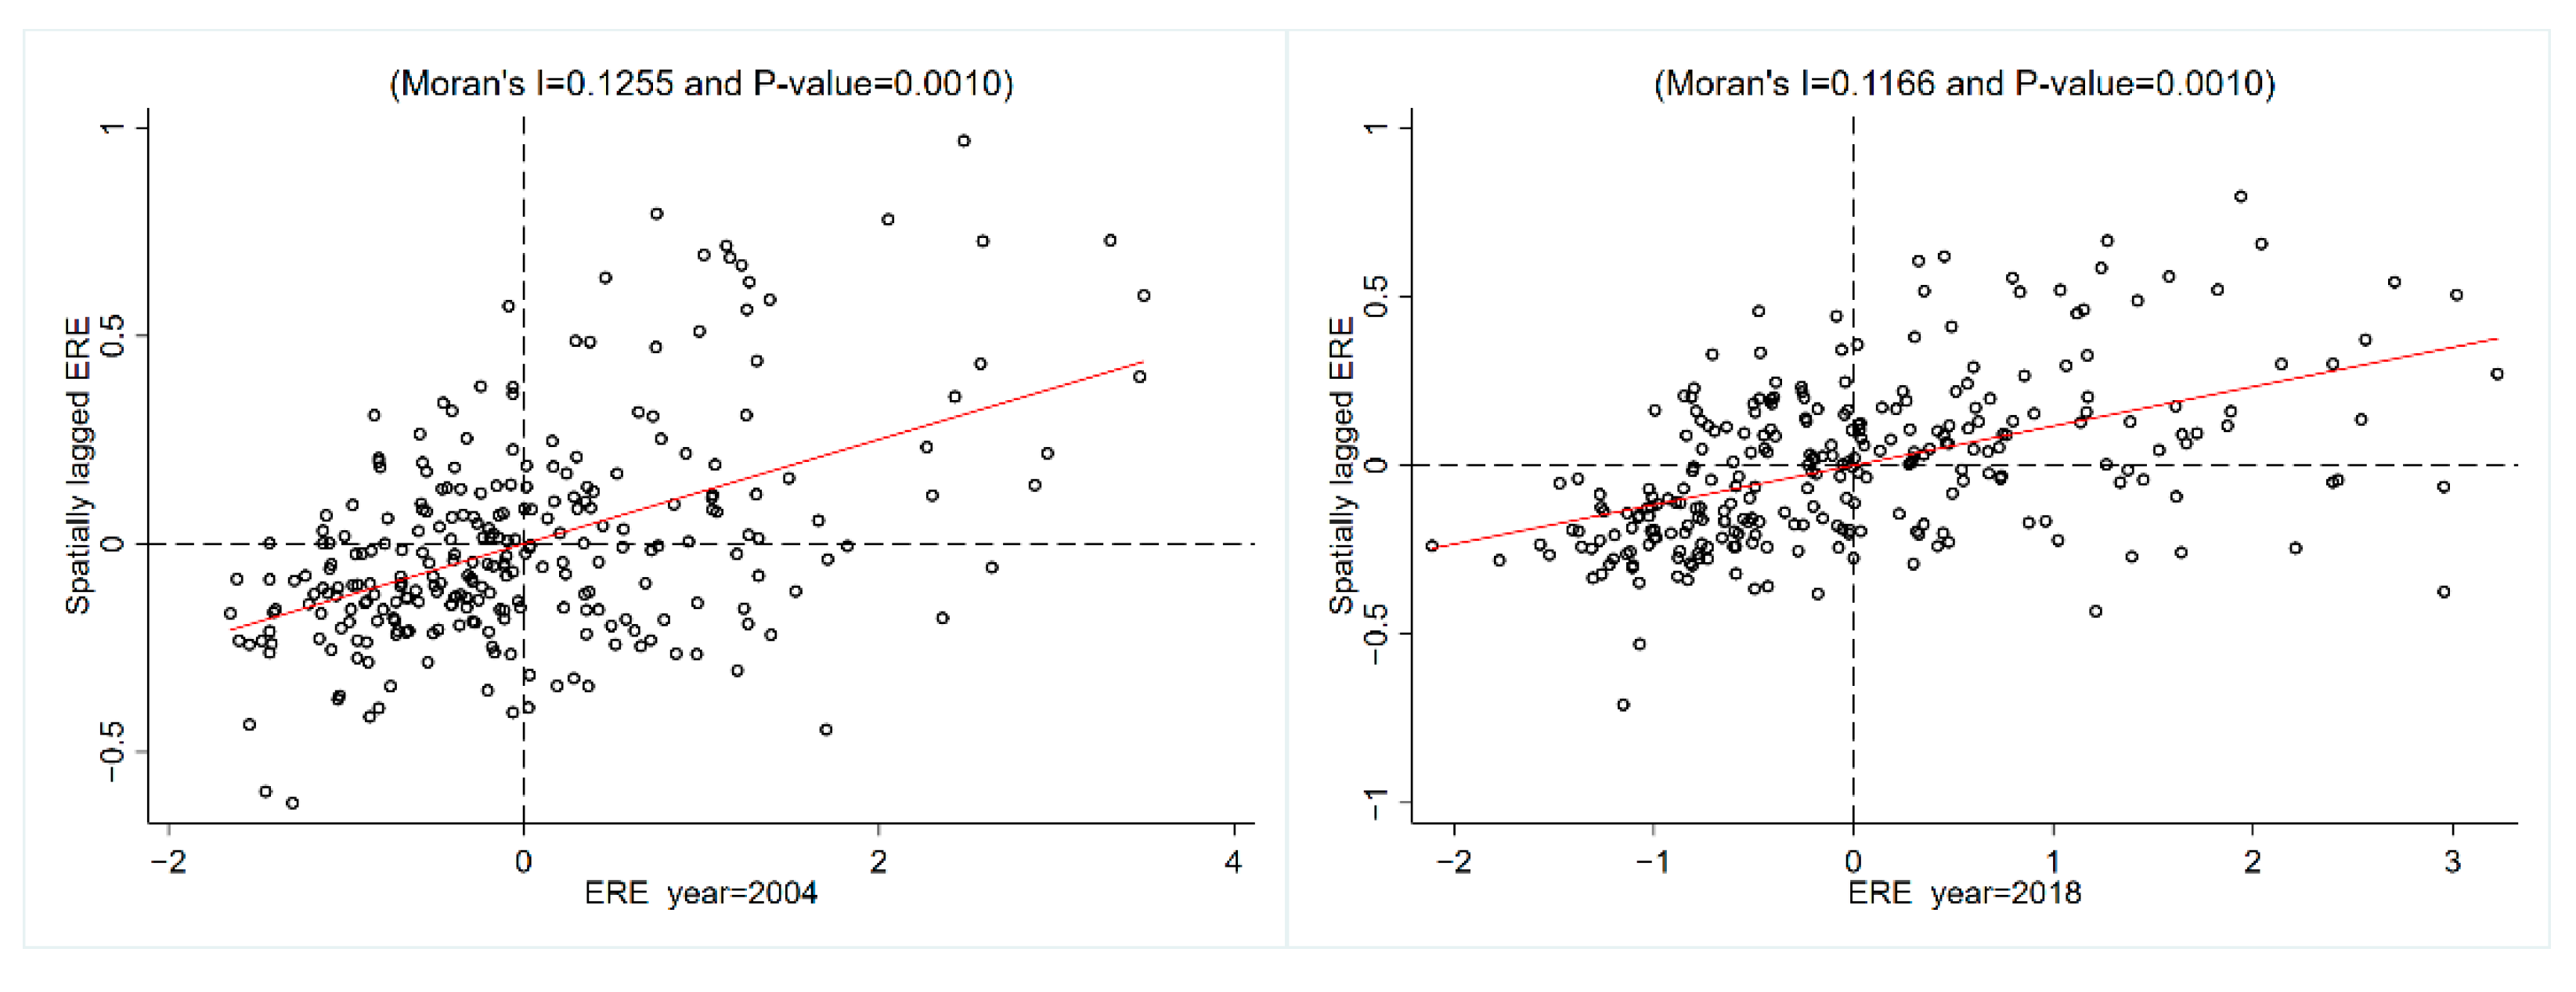
Based on urban panel data from 269 prefecture-level cities in China from 2004 to 2018, we empirically investigated the impacts of innovative entrepreneurial vitality and economic policy uncertainty on economic resilience by constructing two spatial weighting matrices for economic and geographical attributes using a dynamic spatial Durbin model. The statistical results showed that there were significant spatial spillover effects and path-dependent mechanisms of economic resilience. Innovative entrepreneurial vitality had a significant positive impact on economic resilience. Under the moderating effect of economic policy uncertainty, innovative entrepreneurial vitality significantly contributed to economic resilience by promoting industrial structure upgrades, narrowing the income gap, and guiding economic agglomeration. Additionally, due to regional differences and the economic development scale gap, the impacts of innovative entrepreneurial vitality and economic policy uncertainty on economic resilience presented significant heterogeneity characteristics. Based on these research conclusions, to enhance economic resilience via innovative entrepreneurial vitality under economic policy uncertainty further, the following specific actions should be implemented.
Against the backdrop of economic globalization, many external shocks, such as climate change and public health emergencies, have come one after another, posing huge challenges to social stability and governance. Therefore, policymakers should consider building a resilient economic structure to be an important strategic component. This can be accompanied by a highly internationalized division of labor in the industrial chain. With economic policy uncertainty, external shocks can easily create a global butterfly effect that could have an unprecedented global impact that may eventually lead to unprecedented challenges for all countries. Therefore, China, as a globally important and externally oriented economy, is at a critical stage of economic transformation and needs to make economic resilience a long-term strategy at the macroeconomic policy level, aiming at sustainable development and building a more resilient economic system to lead the transformation of social development concepts and models.
Policymakers should stimulate innovative and entrepreneurial behavior, and they should protect innovative entrepreneurial vitality. Specifically, policymakers should create a favorable business environment for innovative and entrepreneurial enterprises, as well as guide the implementation of innovative and entrepreneurial achievements and enhance the survival rate of innovative and entrepreneurial enterprises by focusing on solving the problems of capital shortage, technology shortage, and market demand for innovative and entrepreneurial activities. Additionally, under increased economic policy uncertainty, policymakers should actively integrate innovative entrepreneurial vitality with industry, expand industrial competitiveness, and promote industrial structural upgrades. Furthermore, by improving public services, preferential policies should be tilted toward low-income groups to narrow the income gap. Lastly, economic resilience should be enhanced by further strengthening economic agglomeration through the rational guidance of industrial clustering.
Policymakers should combine vocational and economic characteristics to enhance the economic resilience of cities by adopting differentiated and dynamic incentives for innovation and entrepreneurship. Policymakers should not only promote integrated regional development and seek cooperation to enhance joint response capabilities in the face of external shocks but also focus on their characteristics and city-specific policies to capitalize on locational and economic advantages. Specifically, in economically developed regions where innovation and entrepreneurship are more dynamic but riskier, the government needs to strengthen support and encouragement for innovation and entrepreneurship enterprises further to increase their risk tolerance and lower their survival threshold. In less economically developed regions where innovative entrepreneurial vitality is lower but relatively stable, the government should guide innovation and entrepreneurship enterprises toward a high-quality development path and play its role in boosting economic resilience.
Our study had certain limitations that should be considered when researching this area. First, we did not make distinctions between types of innovation and entrepreneurship. For example, entrepreneurship can be divided into opportunity entrepreneurship and survival entrepreneurship, each of which may have different inputs and attitudes toward innovation. Second, we only considered the results of heterogeneity in terms of city clusters and city economic sizes. In fact, there are differences in the Chinese government’s policy support for innovation and entrepreneurship in different regions, and local governments have different policy formulations for local innovative and entrepreneurial enterprises. Therefore, in future studies, researchers can appropriately consider the role of policy shocks on economic resilience. Finally, economic policy uncertainty could be added to the two abovementioned under-researched frameworks for analysis, which may be useful for regionally differentiated policy formulations and policy effect evaluations.

Author Contributions

Conceptualization, W.W. and X.Y.; methodology, W.W. and B.C.; software, J.W.; validation, W.W., X.Y. and B.C.; formal analysis, X.Y.; investigation, W.W.; resources, X.Y.; data curation, X.Y. and B.C.; writing—original draft preparation, X.Y.; writing—review and editing, W.W.; supervision, S.W. All authors have read and agreed to the published version of the manuscript.

Funding

This research has been funded by the Project of National Social Science Foundation of China (19XJY018), the Key Project of Key Laboratory for Sustainable Development of Historical and Cultural Tourism in Xinjiang (LY2020-03), and the Graduate Research and Innovation Project of Xinjiang University (XJ2019G005, XJ2020G020, XJ2021G014). The usual disclaimer applies.

Institutional Review Board Statement

Not applicable.

Informed Consent Statement

Not applicable.

Data Availability Statement

All data generated or analyzed during this study are included in this published article.

Conflicts of Interest

The authors declare no conflict of interest.

References

  1. Laeven, L.; Valencia, F. The real effects of financial sector interventions during crises. J. Money Credit. Bank. 2013, 45, 147–177. [Google Scholar] [CrossRef]
  2. Simmie, J.; Martin, R. The economic resilience of regions: Towards an evolutionary approach. Camb. J. Reg. Econ. Soc. 2010, 3, 27–43. [Google Scholar] [CrossRef] [Green Version]
  3. Martin, R.; Sunley, P.; Tyler, P. Local growth evolutions: Recession, resilience and recovery. Camb. J. Reg. Econ. Soc. 2015, 8, 141–148. [Google Scholar] [CrossRef] [Green Version]
  4. Schumpeter, J.A.; Nichol, A.J. Robinson’s economics of imperfect competition. J. Political Econ. 1934, 42, 249–259. [Google Scholar] [CrossRef]
  5. Vorley, T.; Williams, N. Fostering entrepreneurship and economic growth: Pathways to economic resilience in Kosovo. World Rev. Entrep. Manag. Sustain. Dev. 2017, 13, 159–177. [Google Scholar] [CrossRef] [Green Version]
  6. Isaksen, A. Industrial development in thin regions: Trapped in path extension? J. Econ. Geogr. 2014, 15, 585–600. [Google Scholar] [CrossRef]
  7. Su, R.-G.; Zhao, X.-L. Manufacturing Development, Entrepreneurial Vitality, and Urban Economic Resilience. Financ. Econ. Sci. 2020, 9, 79–92. [Google Scholar]
  8. Gulen, H.; Ion, M. Policy uncertainty and corporate investment. Rev. Financ. Stud. 2016, 29, 523–564. [Google Scholar] [CrossRef]
  9. Phan, D.H.B.; Iyke, B.N.; Sharma, S.S.; Affandi, Y. Economic policy uncertainty and financial stability–Is there a relation? Econ. Model. 2021, 94, 1018–1029. [Google Scholar] [CrossRef]
  10. Makosa, L.; Sun, J.; Bonga, W.G.; Jachi, M.; Sitsha, L. Does economic policy uncertainty aggravate financial constraints? S. Afr. J. Account. Res. 2021, 35, 151–166. [Google Scholar]
  11. Gouvea, R.; Girardi, D. Partisanship and local fiscal policy: Evidence from Brazilian cities. J. Dev. Econ. 2021, 150, 102637. [Google Scholar] [CrossRef]
  12. Holling, C.S. Resilience and stability of ecological systems. Annu. Rev. Ecol. Syst. 1973, 4, 1–23. [Google Scholar] [CrossRef] [Green Version]
  13. Ramlogan, R.; Metcalfe, J.S. Restless capitalism: A complexity perspective on modern capitalist economies. In Complexity and Co-Evolution: Continuity and Change in Socio-Economic Systems; Edward Elgar: Cheltenham, UK, 2016; pp. 115–146. [Google Scholar]
  14. Pendall, R.; Foster, K.A.; Cowell, M. Resilience and regions: Building understanding of the metaphor. Camb. J. Reg. Econ. Soc. 2010, 3, 71–84. [Google Scholar] [CrossRef] [Green Version]
  15. Gong, H.; Hassink, R. Exploring the clustering of creative industries. Eur. Plan. Stud. 2017, 25, 583–600. [Google Scholar] [CrossRef]
  16. Kitsos, A.; Carrascal-Incera, A.; Ortega-Argilés, R. The role of embeddedness on regional economic resilience: Evidence from the UK. Sustainability 2019, 11, 3800. [Google Scholar] [CrossRef] [Green Version]
  17. Schwarz, A.M.; Béné, C.; Bennett, G.; Boso, D.; Hilly, Z.; Paul, C.; Andrew, N. Vulnerability and resilience of remote rural communities to shocks and global changes: Empirical analysis from Solomon Islands. Glob. Environ. Chang. 2011, 21, 1128–1140. [Google Scholar] [CrossRef]
  18. Eraydin, A. Attributes and characteristics of regional resilience: Defining and measuring the resilience of Turkish regions. Reg. Stud. 2016, 50, 600–614. [Google Scholar] [CrossRef]
  19. Cellini, R.; Torrisi, G. Regional resilience in Italy: A very long-run analysis. Reg. Stud. 2014, 48, 1779–1796. [Google Scholar] [CrossRef] [Green Version]
  20. Courvisanos, J.; Jain, A.K.; Mardaneh, K. Economic resilience of regions under crises: A study of the Australian economy. Reg. Stud. 2016, 50, 629–643. [Google Scholar] [CrossRef]
  21. Dubé, J.; Polèse, M. Resilience revisited: Assessing the impact of the 2007–09 recession on 83 Canadian regions with accompanying thoughts on an elusive concept. Reg. Stud. 2016, 50, 615–628. [Google Scholar] [CrossRef]
  22. Sensier, M.; Bristow, G.; Healy, A. Measuring regional economic resilience across Europe: Operationalizing a complex concept. Spat. Econ. Anal. 2016, 11, 128–151. [Google Scholar] [CrossRef]
  23. Andreoni, V.; Duriavig, M. Economic resilience and land use: The cocoa crisis in the rio Cachoeira catchment, Brazil. Environ. Policy Gov. 2013, 23, 118–129. [Google Scholar] [CrossRef]
  24. Lee, N. Grim down South? The determinants of unemployment increases in British cities in the 2008–2009 recession. Reg. Stud. 2014, 48, 1761–1778. [Google Scholar] [CrossRef]
  25. Capello, R.; Caragliu, A.; Fratesi, U. Spatial heterogeneity in the costs of the economic crisis in Europe: Are cities sources of regional resilience? J. Econ. Geogr. 2015, 15, 951–972. [Google Scholar] [CrossRef]
  26. Brakman, S.; Garretsen, H.; van Marrewijk, C. The Crisis and Regional Resilience in Europe: On the Importance of Urbanization and Specialization. Available online: http://hdl.handle.net/10419/96904 (accessed on 23 September 2021).
  27. Martin, R.; Sunley, P.; Gardiner, B.; Tyler, P. How regions react to recessions: Resilience and the role of economic structure. Reg. Stud. 2016, 50, 561–585. [Google Scholar] [CrossRef] [Green Version]
  28. Brakman, S.; Garretsen, H.; van Marrewijk, C. Regional resilience across Europe: On urbanisation and the initial impact of the Great Recession. Camb. J. Reg. Econ. Soc. 2015, 8, 225–240. [Google Scholar] [CrossRef] [Green Version]
  29. Mason, C.; Brown, R.; Hart, M.; Anyadike-Danes, M. High growth firms, jobs and peripheral regions: The case of Scotland. Camb. J. Reg. Econ. Soc. 2015, 8, 343–358. [Google Scholar] [CrossRef] [Green Version]
  30. Pike, A.; Marlow, D.; McCarthy, A.; O’Brien, P.; Tomaney, J. Local institutions and local economic development: The Local Enterprise Partnerships in England, 2010–. Camb. J. Reg. Econ. Soc. 2015, 8, 185–204. [Google Scholar] [CrossRef] [Green Version]
  31. Xiao, J.; Boschma, R.; Andersson, M. Resilience in the European Union: The effect of the 2008 crisis on the ability of regions in Europe to develop new industrial specializations. Ind. Corp. Chang. 2018, 27, 15–47. [Google Scholar] [CrossRef] [Green Version]
  32. Palaskas, T.; Psycharis, Y.; Rovolis, A.; Stoforos, C. The asymmetrical impact of the economic crisis on unemployment and welfare in Greek urban economies. J. Econ. Geogr. 2015, 15, 973–1007. [Google Scholar] [CrossRef]
  33. Martin, R.; Gardiner, B. The resilience of cities to economic shocks: A tale of four recessions (and the challenge of Brexit). Pap. Reg. Sci. 2019, 98, 1801–1832. [Google Scholar] [CrossRef]
  34. Iacobucci, D.; Perugini, F. Entrepreneurial ecosystems and economic resilience at local level. Entrep. Reg. Dev. 2021, 1–28. [Google Scholar] [CrossRef]
  35. Bristow, G.; Healy, A. Innovation and regional economic resilience: An exploratory analysis. Ann. Reg. Sci. 2018, 60, 265–284. [Google Scholar] [CrossRef] [Green Version]
  36. Boschma, R. Towards an evolutionary perspective on regional resilience. Reg. Stud. 2015, 49, 733–751. [Google Scholar] [CrossRef] [Green Version]
  37. Wolfe, D.A.; Bramwell, A. Innovation, creativity and governance: Social dynamics of economic performance in city-regions. Innovation 2008, 10, 170–182. [Google Scholar] [CrossRef] [Green Version]
  38. Sunley, P. Innovation, global change and territorial resilience. Reg. Stud. 2013, 47, 644–645. [Google Scholar] [CrossRef]
  39. Bristow, G.I.; Healy, A.; Norris, L.; Wink, R.; Kafkalas, G.; Kakderi, C.; Carey, H. ECR2. Economic Crisis: Regional Economic Resilience; ESPN: Bristol, CT, USA, 2014. [Google Scholar]
  40. Marcus, A.A. Policy uncertainty and technological innovation. Acad. Manag. Rev. 1981, 6, 443–448. [Google Scholar]
  41. York, J.G.; Venkataraman, S. The entrepreneur–Environment nexus: Uncertainty, innovation, and allocation. J. Bus. Ventur. 2010, 25, 449–463. [Google Scholar] [CrossRef]
  42. Yen, K.C.; Cheng, H.P. Economic policy uncertainty and cryptocurrency volatility. Financ. Res. Lett. 2021, 38, 101428. [Google Scholar] [CrossRef]
  43. Huang, H.; Liu, H.; Yang, B. Economic policy uncertainty and executive turnover. China J. Account. Res. 2021, 14, 83–100. [Google Scholar] [CrossRef]
  44. Cui, X.; Wang, C.; Liao, J.; Fang, Z.; Cheng, F. Economic policy uncertainty exposure and corporate innovation investment: Evidence from China. Pac. -Basin Financ. J. 2021, 67, 101533. [Google Scholar] [CrossRef]
  45. Ongsakul, V.; Treepongkaruna, S.; Jiraporn, P.; Uyar, A. Do firms adjust corporate governance in response to economic policy uncertainty? Evidence from board size. Financ. Res. Lett. 2021, 39, 101613. [Google Scholar] [CrossRef]
  46. Paelinck, J.H.; Klaassen, L.H.; Ancot, J.P.; Verster, A.C.P. Spatial Econometrics; Saxon House: London, UK, 1979. [Google Scholar]
  47. Anselin, L. Lagrange multiplier test diagnostics for spatial dependence and spatial heterogeneity. Geogr. Anal. 1988, 20, 1–17. [Google Scholar] [CrossRef]
  48. LeSage, J.; Pace, R.K. Introduction to Spatial Econometrics; Chapman and Hall/CRC: Boca Raton, FL, USA, 2009. [Google Scholar]
  49. Yang, X.; Wu, H.; Ren, S.; Ran, Q.; Zhang, J. Does the development of the internet contribute to air pollution control in China? Mechanism discussion and empirical test. Struct. Chang. Econ. Dyn. 2020, 56, 207–224. [Google Scholar] [CrossRef]
  50. Yang, X.; Zhang, J.; Ren, S.; Ran, Q. Can the new energy demonstration city policy reduce environmental pollution? Evidence from a quasi-natural experiment in China. J. Clean. Prod. 2021, 287, 125015. [Google Scholar] [CrossRef]
  51. Davies, S. Regional resilience in the 2008–2010 downturn: Comparative evidence from European countries. Camb. J. Reg. Econ. Soc. 2011, 4, 369–382. [Google Scholar] [CrossRef]
  52. Berkes, F. Can cross-scale linkages increase the resilience of social-ecological systems. In Proceedings of the RCSD International Conference, Politics of the Commons, Chiang Mai, Thailand, 11–14 July 2003; pp. 1–14. [Google Scholar]
  53. Foster, K.A. A Case Study Approachto Understanding Regional Resilience; The State University of New York: New York, NY, USA, 2007. [Google Scholar]
  54. Feng, Y.; Nie, C.; Zhang, D. Measurement and Analysis of Economic resilience of Urban agglomeration in China–shift-share decomposition based on Economic resilience. Shanghai Econ. Res. 2020, 5, 60–72. [Google Scholar] [CrossRef]
  55. Xie, W.; Rose, A.; Li, S.; He, J.; Li, N.; Ali, T. Dynamic economic resilience and economic recovery from disasters: A quantitative assessment. Risk Anal. 2018, 38, 1306–1318. [Google Scholar] [CrossRef]
  56. Cao, J.; Law, S.H.; Samad, A.R.B.A.; Mohamad, W.N.B.W.; Wang, J.; Yang, X. Impact of financial development and technological innovation on the volatility of green growth—Evidence from China. Environ. Sci. Pollut. Res. 2021, 28, 1–17. [Google Scholar] [CrossRef]
  57. Baker, S.R.; Bloom, N.; Davis, S.J. Measuring economic policy uncertainty. Q. J. Econ. 2016, 131, 1593–1636. [Google Scholar] [CrossRef]
  58. Wu, H.; Hao, Y.; Ren, S.; Yang, X.; Xie, G. Does internet development improve green total factor energy efficiency? Evidence from China. Energy Policy 2021, 153, 112247. [Google Scholar] [CrossRef]
  59. Ren, S.; Hao, Y.; Xu, L.; Wu, H.; Ba, N. Digitalization and energy: How does internet development affect China’s energy consumption? Energy Econ. 2021, 98, 105220. [Google Scholar] [CrossRef]
  60. Li, L.; Zeng, Y.; Ye, Z.; Guo, H. E-commerce development and urban-rural income gap: Evidence from Zhejiang Province, China. Pap. Reg. Sci. 2021, 100, 475–494. [Google Scholar] [CrossRef]
  61. Huang, K.; Dallimer, M.; Stringer, L.C.; Zhang, A.L.; Zhang, T. Does Economic Agglomeration Lead to Efficient Rural to Urban Land Conversion? An Examination of China’s Metropolitan Area Development Strategy. Sustainability 2021, 13, 2002. [Google Scholar] [CrossRef]
  62. Hao, Y.; Ba, N.; Ren, S.; Wu, H. How does international technology spillover affect China’s carbon emissions? A new perspective through intellectual property protection. Sustain. Prod. Consum. 2021, 25, 577–590. [Google Scholar] [CrossRef]
  63. Sun, C.; Zhang, W.; Luo, Y.; Li, J. Road construction and air quality: Empirical study of cities in China. J. Clean. Prod. 2021, 319, 128649. [Google Scholar] [CrossRef]
  64. Meng, Y.; Liu, L.; Wang, J.; Ran, Q.; Yang, X.; Shen, J. Assessing the Impact of the National Sustainable Development Planning of Resource-Based Cities Policy on Pollution Emission Intensity: Evidence from 270 Prefecture-Level Cities in China. Sustainability 2021, 13, 7293. [Google Scholar] [CrossRef]
  65. Wu, H.; Ren, S.; Yan, G.; Hao, Y. Does China’s outward direct investment improve green total factor productivity in the “Belt and Road” countries? Evidence from dynamic threshold panel model analysis. J. Environ. Manag. 2020, 275, 111295. [Google Scholar] [CrossRef]
  66. Williams, N.; Vorley, T.; Ketikidis, P.H. Economic resilience and entrepreneurship: A case study of the Thessaloniki City Region. Local Econ. 2013, 28, 399–415. [Google Scholar] [CrossRef]
  67. Brown, L.; Greenbaum, R.T. The role of industrial diversity in economic resilience: An empirical examination across 35 years. Urban Stud. 2017, 54, 1347–1366. [Google Scholar] [CrossRef]
  68. Roper, S.; Tapinos, E. Taking risks in the face of uncertainty: An exploratory analysis of green innovation. Technol. Forecast. Soc. Chang. 2016, 112, 357–363. [Google Scholar] [CrossRef] [Green Version]
  69. Yuan, B.-L.; Li, C. A study on innovation-driven high-quality development of China’s economy-the moderating effect of economic policy uncertainty. Macro Qual. Res. 2021, 1, 45–57. [Google Scholar] [CrossRef]
  70. Fritsch, M.; Mueller, P. Effects of new business formation on regional development over time. Reg. Stud. 2004, 38, 961–975. [Google Scholar] [CrossRef] [Green Version]
  71. Warning, M.; Key, N. The social performance and distributional consequences of contract farming: An equilibrium analysis of the Arachide de Bouche program in Senegal. World Dev. 2002, 30, 255–263. [Google Scholar] [CrossRef]
  72. Ganau, R.; Grandinetti, R. Disentangling regional innovation capability: What really matters? Ind. Innov. 2021, 28, 749–772. [Google Scholar] [CrossRef]
  73. Faggian, A.; Gemmiti, R.; Jaquet, T.; Santini, I. Regional economic resilience: The experience of the Italian local labor systems. Ann. Reg. Sci. 2018, 60, 393–410. [Google Scholar] [CrossRef]
Figure 1. Scatter diagram of economic resilience under geographical inverse distance matrix.
Sustainability 13 10677 g001
Figure 2. Scatter diagram of economic resilience under the economic geography matrix.
Sustainability 13 10677 g002
Table 1. Economic resilience indicator system.
VariablesFirst-Level IndicatorsSecond-Level IndicatorsIndicator Definitions
Economic resilienceResistance abilityEconomic strengthRegional gross domestic product
Industrial developmentTotal industrial output to GDP ratio
Foreign capital dependenceAmount of actual foreign investment utilized
Consumption abilityTotal retail sales of consumer goods
Regulating abilityConsumption potentialAverage wage of employees
Urbanization levelThe ratio of the non-agricultural population to the total resident population
Employment pressureRegistered urban unemployment rate
Financial supportRatio of year-end deposit and loan balances of financial institutions to GDP
ResponsivenessInvestment scaleInvestment in fixed assets
Government supportFiscal expenditure to GDP ratio
Industrial diversificationHerfindahl–Hirschman Index
Scientific and educational environmentExpenditure on science and technology
Table 2. Descriptive statistics.
Variable TypesVariablesVariablesObsMinMaxMeanStd. Dev
Dependent variable E R E Economic resilience 40350.58784.26861.98090.6379
Core explanatory variable I E V Innovative entrepreneurial vitality40350.02364.60523.75740.7683
Moderating variables E P U Economic policy uncertainty40354.17386.13225.01160.6021
Control variables H U M Human capital40350.006413.11241.65402.2498
R O A Infrastructure development40350.31484.09552.59370.4658
I N T Informatization technology40352.05979.89686.82881.0231
F D I Openness40350.000221.86411.96712.1059
Table 3. Moran’s I index result.
YearsMorlan’s I
W1Z-ValueW2Z-Value
20040.260 ***9.9700.125 ***16.265
20050.263 ***10.0770.126 ***16.291
20060.264 ***10.1520.127 ***16.447
20070.274 ***10.5260.133 ***17.179
20080.260 ***9.9830.123 ***15.926
20090.252 ***9.6620.119 ***15.392
20100.249 ***9.5800.117 ***15.156
20110.237 ***9.1210.109 ***14.220
20120.227 ***8.7360.102 ***13.314
20130.220 ***8.4610.099 ***12.886
20140.218 ***8.3930.096 ***12.547
20150.227 ***8.7200.102 ***13.345
20160.231 ***8.8790.104 ***13.507
20170.239 ***9.1740.107 ***13.983
20180.251 ***9.6130.117 ***15.135
Note: *** indicate passing the significance test at 1% levels.
Table 4. Direct and interactive effect results.
VariablesW1W2
(1)(2)(3)(4)
L . E R E 0.7647 ***0.7483 ***0.7724 ***0.7731 ***
(83.97)(80.85)(86.07)(84.43)
I E V 0.0127 ***–0.0581 ***0.0132 ***–0.0470 ***
(4.22)(–4.60)(4.41)(–3.81)
E P U 0.0054 ** 0.0062 **
(2.05) (2.25)
I E V × E P U 0.0140 *** 0.0122 ***
(5.78) (5.14)
H U M 0.00240.00080.00070.0009
(1.25)(0.40)(0.38)(0.47)
R O A 0.00350.00490.00030.0002
(0.76)(1.08)(0.06)(0.04)
I N T 0.00260.00490.0052 *0.0078 **
(0.84)(1.57)(1.70)(2.52)
F D I 0.0192 ***0.0199 ***0.0188 ***0.0198 ***
(22.15)(22.94)(22.17)(23.34)
ρ 0.2333 ***0.2399 ***0.6200 ***0.1956 ***
(15.62)(15.45)(21.39)(6.38)
σ 2 0.0033 ***0.0033 ***0.0033 ***0.0033 ***
(46.57)(46.49)(45.42)(46.32)
L o g _ L 5485.76055520.99675435.59655521.7859
L R ( l a g ) 249.74 ***120.00 ***86.15 ***124.95 ***
L R ( e r r o r ) 290.94 ***134.72 ***78.01 ***137.37 ***
W a l d ( l a g ) 235.08 ***124.25 ***92.51 ***130.26 ***
W a l d ( e r r o r ) 226.51 ***127.03 ***84.61 ***128.45 ***
Other variables
Individual effectYESYESYESYES
Year effectYESYESYESYES
R 2 0.97610.97230.97010.9689
N 3766376637663766
Note: *, **, and *** indicate passing the significance test at 10%, 5%, and 1% levels, respectively.
Table 5. Mediated moderation mechanism test results.
Variables(1)(2)(3)(4)(5)(6)(7)
Upgrading the Industrial StructureNarrowing the Income GapGuiding the Economic Agglomeration
I E V –0.0470 ***0.2268 ***–0.0641 ***–0.2278 **–0.0306 **0.2233 **–0.0454 ***
(–3.81)(3.46)(–5.06)(–2.22)(–2.47)(2.20)(–3.65)
E P U –0.1110 **1.1734 ***–0.5756 ***0.3243 ***0.0190 ***1.7199 ***–0.1465 ***
(–2.39)(21.34)(–8.07)(3.01)(5.60)(87.72)(–3.06)
I E V × E P U 0.0122 ***0.0111 ***0.0016 ***–0.0944 ***0.0086 ***0.0229 ***0.0119 ***
(5.14)(3.74)(6.42)(–3.20)(3.62)(22.80)(4.99)
I N D 0.2051 ***
(5.11)
I N D × E P U 0.0336 ***
(4.37)
G A P –0.0280 *
(–1.75)
G A P × E P U –0.0042 ***
(–3.26)
E C O 0.0053 ***
(5.63)
E C O × E P U 0.0008
(0.17)
ρ 0.1956 ***1.0794 ***0.1871 ***1.3287 ***0.9220 ***0.1929 ***0.1645 ***
(6.38)(114.36)(6.10)(35.27)(26.26)(32.08)(4.80)
σ 2 0.0033 ***0.0053 ***0.0032 ***0.0203 ***0.0031 ***0.0007 ***0.0033 ***
(46.32)(45.31)(46.37)(45.79)(44.75)(54.88)(46.42)
Other variablesYESYESYESYESYESYESYES
Individual effectYESYESYESYESYESYESYES
Year effectYESYESYESYESYESYESYES
R 2 0.96890.58640.97550.86410.96870.97170.9657
N 3766376637663766376637663766
Note: *, **, and *** indicate passing the significance test at 10%, 5%, and 1% levels, respectively.
Table 6. Urban agglomeration heterogeneity results.
VariablesEastern Urban AgglomerationCentral and Western Urban Agglomeration
Yangtze River DeltaPearl River DeltaBeijing-Tianjin-HebeiHa-ChangSouth-Central LiaoningShandong Peninsulathe West Coast of the Taiwan StraitsMiddle Reaches of Yangtze RiverChengdu and ChongqingCentral PlainsGuanzhong
Direct effect L . E R E 0.8230 ***0.8676 ***0.7527 ***0.6940 ***0.5961 ***0.5494 ***0.7888 ***0.8260 ***0.8129 ***0.7109 ***0.8408 ***
(34.35)(20.44)(19.01)(11.10)(11.36)(12.09)(27.05)(19.04)(21.59)(14.30)(15.93)
I E V 0.01990.01050.01220.01850.00910.0682–0.0079–0.00070.0316 ***0.1039 ***0.0073
(0.99)(0.81)(0.67)(0.65)(1.39)(1.23)(–0.71)(–0.04)(2.96)(3.92)(0.15)
ρ 0.5952 ***0.3485 ***0.04420.1723 **0.1893 **0.0022 ***0.2020 ***0.02460.5261 ***0.1484 *0.1903 **
(18.71)(8.68)(0.55)(2.05)(2.26)(8.00)(4.94)0.37(8.14)(1.85)(2.46)
L o g _ L 513.9755334.9673238.3556139.0698171.3746184.6079449.7486309.3516277.4636202.9980140.8306
Moderating effects L . E R E 0.7696 ***0.8427 ***0.7698 ***0.6789 ***0.6018 ***0.5325 ***0.8012 ***0.7742 ***1.7360 ***0.7237 ***0.8035 ***
(29.70)(20.05)(19.67)(9.98)(11.41)(11.38)(27.21)(16.41)(44.44)(14.19)(12.96)
I E V × E P U –0.02000.01610.02130.01580.02600.1517 ***–0.00960.0238*–0.0250 **–0.1435 ***0.0013
(–1.23)(1.43)(0.97)(0.59)(1.30)(2.97)(–0.62)(1.67)(–2.27)(–4.81)(0.10)
ρ 0.3608 ***0.3001 ***0.07910.1885 **0.1972 **0.3654 ***0.1994 ***0.05735.5363 ***0.02840.1300
(10.86)(5.63)(1.07)(2.08)(2.27)(5.19)(4.88)(0.82)(72.70)(0.34)(1.63)
L o g _ L 627.0920337.6399254.2883139.5673173.1693191.4944448.2550312.8078−98.3435184.2727142.8633
Other variablesYESYESYESYESYESYESYESYESYESYESYES
Individual effectYESYESYESYESYESYESYESYESYESYESYES
Year effectYESYESYESYESYESYESYESYESYESYESYES
N 3501961129812611225218219611298
Note: *, **, and *** indicate passing the significance test at 10%, 5%, and 1% levels, respectively.
Table 7. Heterogeneity of economic scale result.
VariablesFirst-Tier CitiesSecond-Tier, CitiesThird-Tier CitiesFourth-Tier Cities
(1)(2)(3)(4)(5)(6)(7)(8)
L . E R E 0.6657 ***1.0451 ***0.7144 ***0.7446 ***0.5887 ***0.6901 ***0.7683 ***0.7663 ***
(21.41)(33.17)(26.94)(28.17)(30.11)(35.09)(48.10)(47.48)
I E V 0.9160 ***1.2994 ***0.2594 **1.0222 **0.0402 ***–0.00610.0160 ***–0.0652 **
(3.32)(3.76)(2.52)(2.42)(4.38)(–0.11)(3.13)(–1.99)
E P U 0.6329 *** –1.0896 –0.2218 * 0.0307
(4.31) (–1.31) (–1.70) (0.27)
I E V × E P U –0.0623 –0.1726 ** 0.0101 0.0165 **
(–0.26) (–2.05) (0.93) (2.55)
ρ 0.5059 ***6.4451 ***0.2924 ***0.2574 ***1.6873 ***0.5989 ***0.1432 ***0.0812
(9.60)(117.68)(6.35)(5.27)(36.33)(12.56)(2.82)(1.38)
L o g _ L 304.0685321.0525680.3130686.97191384.25621391.53311831.37471837.0832
R 2 0.59940.32710.94760.96520.80870.92010.95680.9588
Other variablesYESYESYESYESYESYESYESYES
Individual effectYESYESYESYESYESYESYESYES
Year effectYESYESYESYESYESYESYESYES
N 21021042042093893811621162
Note: *, **, and *** indicate passing the significance test at 10%, 5%, and 1% levels, respectively.
Table 8. Robustness test results.
VariablesReplacement VariablesReplacement Spatial Weight MatrixConsidering Endogeneity
W1W2W32SLS
(1)(2)(3)(4)(5)(6)(7)(8)
L . E R E 0.0913 ***0.0913 ***0.0924 ***0.0926 ***0.8623 ***0.9045 ***0.9756 ***0.9745 ***
(5.61)(5.60)(5.68)(5.68)(107.00)(109.40)(267.38)(249.82)
I E V 0.0057 *–0.00590.0044–0.00630.0131 ***0.00130.0184 ***0.1557 **
(1.80)(–0.45)(1.54)(–0.52)(4.26)(0.11)(7.92)(2.17)
E P U –0.0013 –0.0171 0.0590 *** –0.0266 *
(–1.21) (–0.96) (5.86) (–1.91)
I E V × E P U 0.0001 *** 0.0003 *** 0.0020 *** 0.1140 **
(3.02) (4.16) (2.84) (2.16)
ρ 0.04350.04370.13930.15230.1570 ***0.2534 ***
(1.39)(1.40)(1.43)(1.54)(19.08)(30.09)
σ 2 1.9418 ***1.9415 ***1.9426 ***1.9419 ***0.0036 ***0.0035 ***
(46.49)(46.49)(46.49)(46.49)(46.37)(45.69)
L o g _ L –6477.4062–6477.1478–6478.2703–6477.70245252.00834828.6266
Other variablesYESYESYESYESYESYESYESYES
Individual effectYESYESYESYESYESYESYESYES
Year effectYESYESYESYESYESYESYESYES
R 2 0.00910.00100.00090.00050.97680.95760.98830.9879
N 37663766376637663766376637663766
Note: *, **, and *** indicate passing the significance test at 10%, 5%, and 1% levels, respectively.
Publisher’s Note: MDPI stays neutral with regard to jurisdictional claims in published maps and institutional affiliations.

