1. Introduction
Global warming has become a critical issue for the welfare of our planet over the past few decades. The total CO
2 emissions in the world doubled in the period from 1971 to 2010. This increase in the CO
2 emissions in the atmosphere is one of the main causes of global warming. To protect our environment, it is essential to reduce CO
2 emissions. Correspondingly, the European Commission (EC) has set the target of reducing CO
2 emissions by 20% by 2020 compared to 1990. The major sources of CO
2 emissions are conventional power sources, such as coal, deiseal, fuel oil, etc. These sources have been replaced mainly with wind turbines and solar PV. According to the International Energy Agency (IEA), the CO
2 emissions from transportation is the second main cause of global CO
2 emissions, which was around 22% of the world’s CO
2 emissions in 2010. This mainly comes from public transport vehicles due to long operating time, which is up to 18 h/day, compared to less than 1 h/day for commercial ones. The CO
2 emissions of heavy-duty transportation vehicles is about 80% of those of commercial ones. Moreover, the number of HD vehicles is expected to increase in the coming years [
1,
2]. The vast majority of HD vehicles in operation across Europe run on diesel (97.8% of trucks; 94.5% of buses) [
3].
Electrified vehicle technology is emerging as a leading technology to achieve the above-mentioned objectives, more so than conventional internal combustion engine vehicles (ICEVs). The production numbers of electrified vehicles remain slightly low due to the high additional cost of the electric powertrain and storage system. Hence, heavy-duty (HD) and medium-duty (MD) vehicle manufacturers have a strong trend of reducing the total cost of ownership (TCO) in order to improve the business case to comply with EU regulations, cities, and end users’ needs for clean transport [
4,
5].
MD and HD electric transport vehicles have made a significant improvement in energy management optimization and efficiency enhancement over the past few years, thanks to H2020 projects such as ZeEUS, ORCA, EBSF_2, 3iBS, HCV, etc. Bus fleets had precedence for testing alternative fuels and public transport electrification (PTE), which ranges from 40 to 50%. Moreover, PTE, in combination with renewable energy sources (RES), may further enhance the green energy transition. The competitiveness of European urban HD, MD, and light-duty vehicle manufacturers and component/system suppliers is based on technological leadership. This is true in general, and in particular for the new incoming technologies, such as electrified powertrain-based solutions for which future wide-scale diffusion depends largely on improvements to electrochemical energy storage systems, further powertrain optimization, fast-charging technologies, and simplifications. As a consequence, the continued strength of the European urban HD, MD, and light-duty industry will relate directly to the remaining competitiveness in this area [
6,
7].
In this scenario, maintaining and reinforcing the strategic leading position of the European industry across the entire value chain of urban HD and MD vehicles represents one of the key EU challenges. The enabling technologies (i.e., energy storage, fast (and superfast) charging technologies, energy management optimization, power-train simplifications, and higher energy efficiency) will support the development of new higher range and performance of the future advanced electrified HD and MD vehicles. These technologies can solve the problem of noxious CO
2 emissions in urban areas and help ensure good air quality. For bus operators in the long-term perspective, urban HD and MD electric transport vehicles can also be cost-effective. Therefore, a bunch of new vehicle concepts have been proposed over the past few years that relate to energy management and storage technologies. Some of these concepts are being tested and demonstrated in public transport fleets and it is expected to have a considerable contribution in smart grid operation in the near future [
1].
The real-life demo presented in this work is part of the ASSURED project. This project is one of several projects concerning HD vehicles, such as the ZeEUS project. In the ZeEUS project, several demos were launched, such as Barcelona, Bonn, Cagliari, Eindhoven, London, Münster, PILSEN, STOCKHOLM, and WARSAW. The demo descriptions are listed in
Table 1 [
8].
In the ASSURED project, there were several use case (UC) demos related to the HD vehicles with fast charging technologies that have been developed and tested in terms of functionality and interoperability (see
Table 2). In this work, we present the real-life demo in Jaworzno.
In Jaworzno, an electric bus (e-bus) fleet of 23 HD vehicles was demonstrated in real-life operation for public transport. The e-buses had three various lengths, 8.9 m, 12 m, and 18 m. The e-buses were equipped with plug-in (for overnight charging) and pantograph-up (for opportunity charging) charging technologies and with different battery size capacities.
In the ASSURED project, standards related to automated connection devices (ACDs) based on pantograph charging technologies were introduced. Type A charging technology in ASSURED refers to a top-down pantograph (ACD installed in the infrastructure mast). Type B technology refers to a bottom-up pantograph (ACD installed on the vehicle roof). The Jaworzno e-buses were equipped with a bottom-up pantograph (Type B) and CCS2 (Combo 2).
In order to minimize the TCO and improve the operational cost of the e-buses, the buses were equipped with a specially optimized battery configuration. The available battery pack capacity enabled the e-buses to reach their destination safely since there are some fast-charging solutions available on the e-bus paths. In this work, the NC and FC solutions are presented. The NC is mostly used when the e-buses are in an off-work period since it takes a long time (in a range of hours) and usually the energy price is low, whereas the FC solution is done when the e-buses are in a work period where the buses have stopped for a short time, e.g., when collecting passengers. The FC has an impact on the grid due to the high power demand, operational cost due to energy price during the day, and battery life due to high charging current rate.
Generally, the traction batteries are one of the most significant EV components that decisively affect the vehicle price, range, efficiency, and operational costs. It is expected to be the major restriction on EV sales. However, although a wide range of battery technology is available, a having a comprehensive battery technology option is what characterizes the manufacturers. Due to the characteristic features of Li-ion batteries, among others, it is expected to be the most used in portable and handheld electronics as well as in EVs. Some EVs use this battery technology, such as Tesla, Nissan Leaf, VW E-Golf, Solaris e-buses, and some other e-buses listed in
Table 1. The charging and discharging current must be keep within the operational limits of the Li-ion batteries, otherwise the lifetime of the traction of the battery system may significantly decrease. Therefore, a battery management system (BMS) is indispensable to control and manage the battery cells and keep them working within safe operating limits, particularly in case of e-buses, where fast charging and discharging happen frequently [
10].
From the power grid perspective, distribution system operator (DSO) grids worldwide are designated to supply residential loads. In recent years, due to climate change concerns, EV integration has become a necessity. EVs need to be charged frequently via various charging solutions that are fed from the DSO grids. Although the charging solutions must respect the system operator network code, there are still some impacts on the grid. These impacts are represented by the following factors:
Load profile, which impact the capacity of the existing DSO equipment;
Energy price, due to the increase in demand;
Power quality;
Congestion;
Voltage stress.
Generally, the impact of EVs charging on DSO networks depends on many factors, such as the number of EVs charging simultaneously as well as the charging pattern, unbalance, coordination, location, rate, and time [
11]. In this work, the impact of e-bus integration on the grid was studied. The study included the impact of charging stations on transformer ratings, line ratings, and voltage stress. A grid network similar to the one in the depot charging station and pantograph solutions in Jaworzno were simulated in a Python environment based on pandapower library. In this work, real data from e-buses were used to model the charger and the e-buses.
This paper is organized as follows.
Section 2 presents an overview of the e-bus fleet demo, description, objectives, and charging infrastructure in Jaworzno.
Section 3 investigates the impact of the e-bus fleet on the DSO grid.
Section 4 analyzes the demo operation based on the data collected from the logging devices that were installed in the e-buses.
Section 5 presents the e-bus fleet’s impact on the environment.
Section 6 explains the adopted e-bus management system.
Section 7 contains the conclusion of this work.
2. e-Bus Fleet Demo
In this section, the baseline e-bus and e-bus demos are described in detail, including the adopted optimization techniques in the e-bus demos. The charging infrastructure that powered the e-buses is described as well.
2.1. Baseline Vehicle
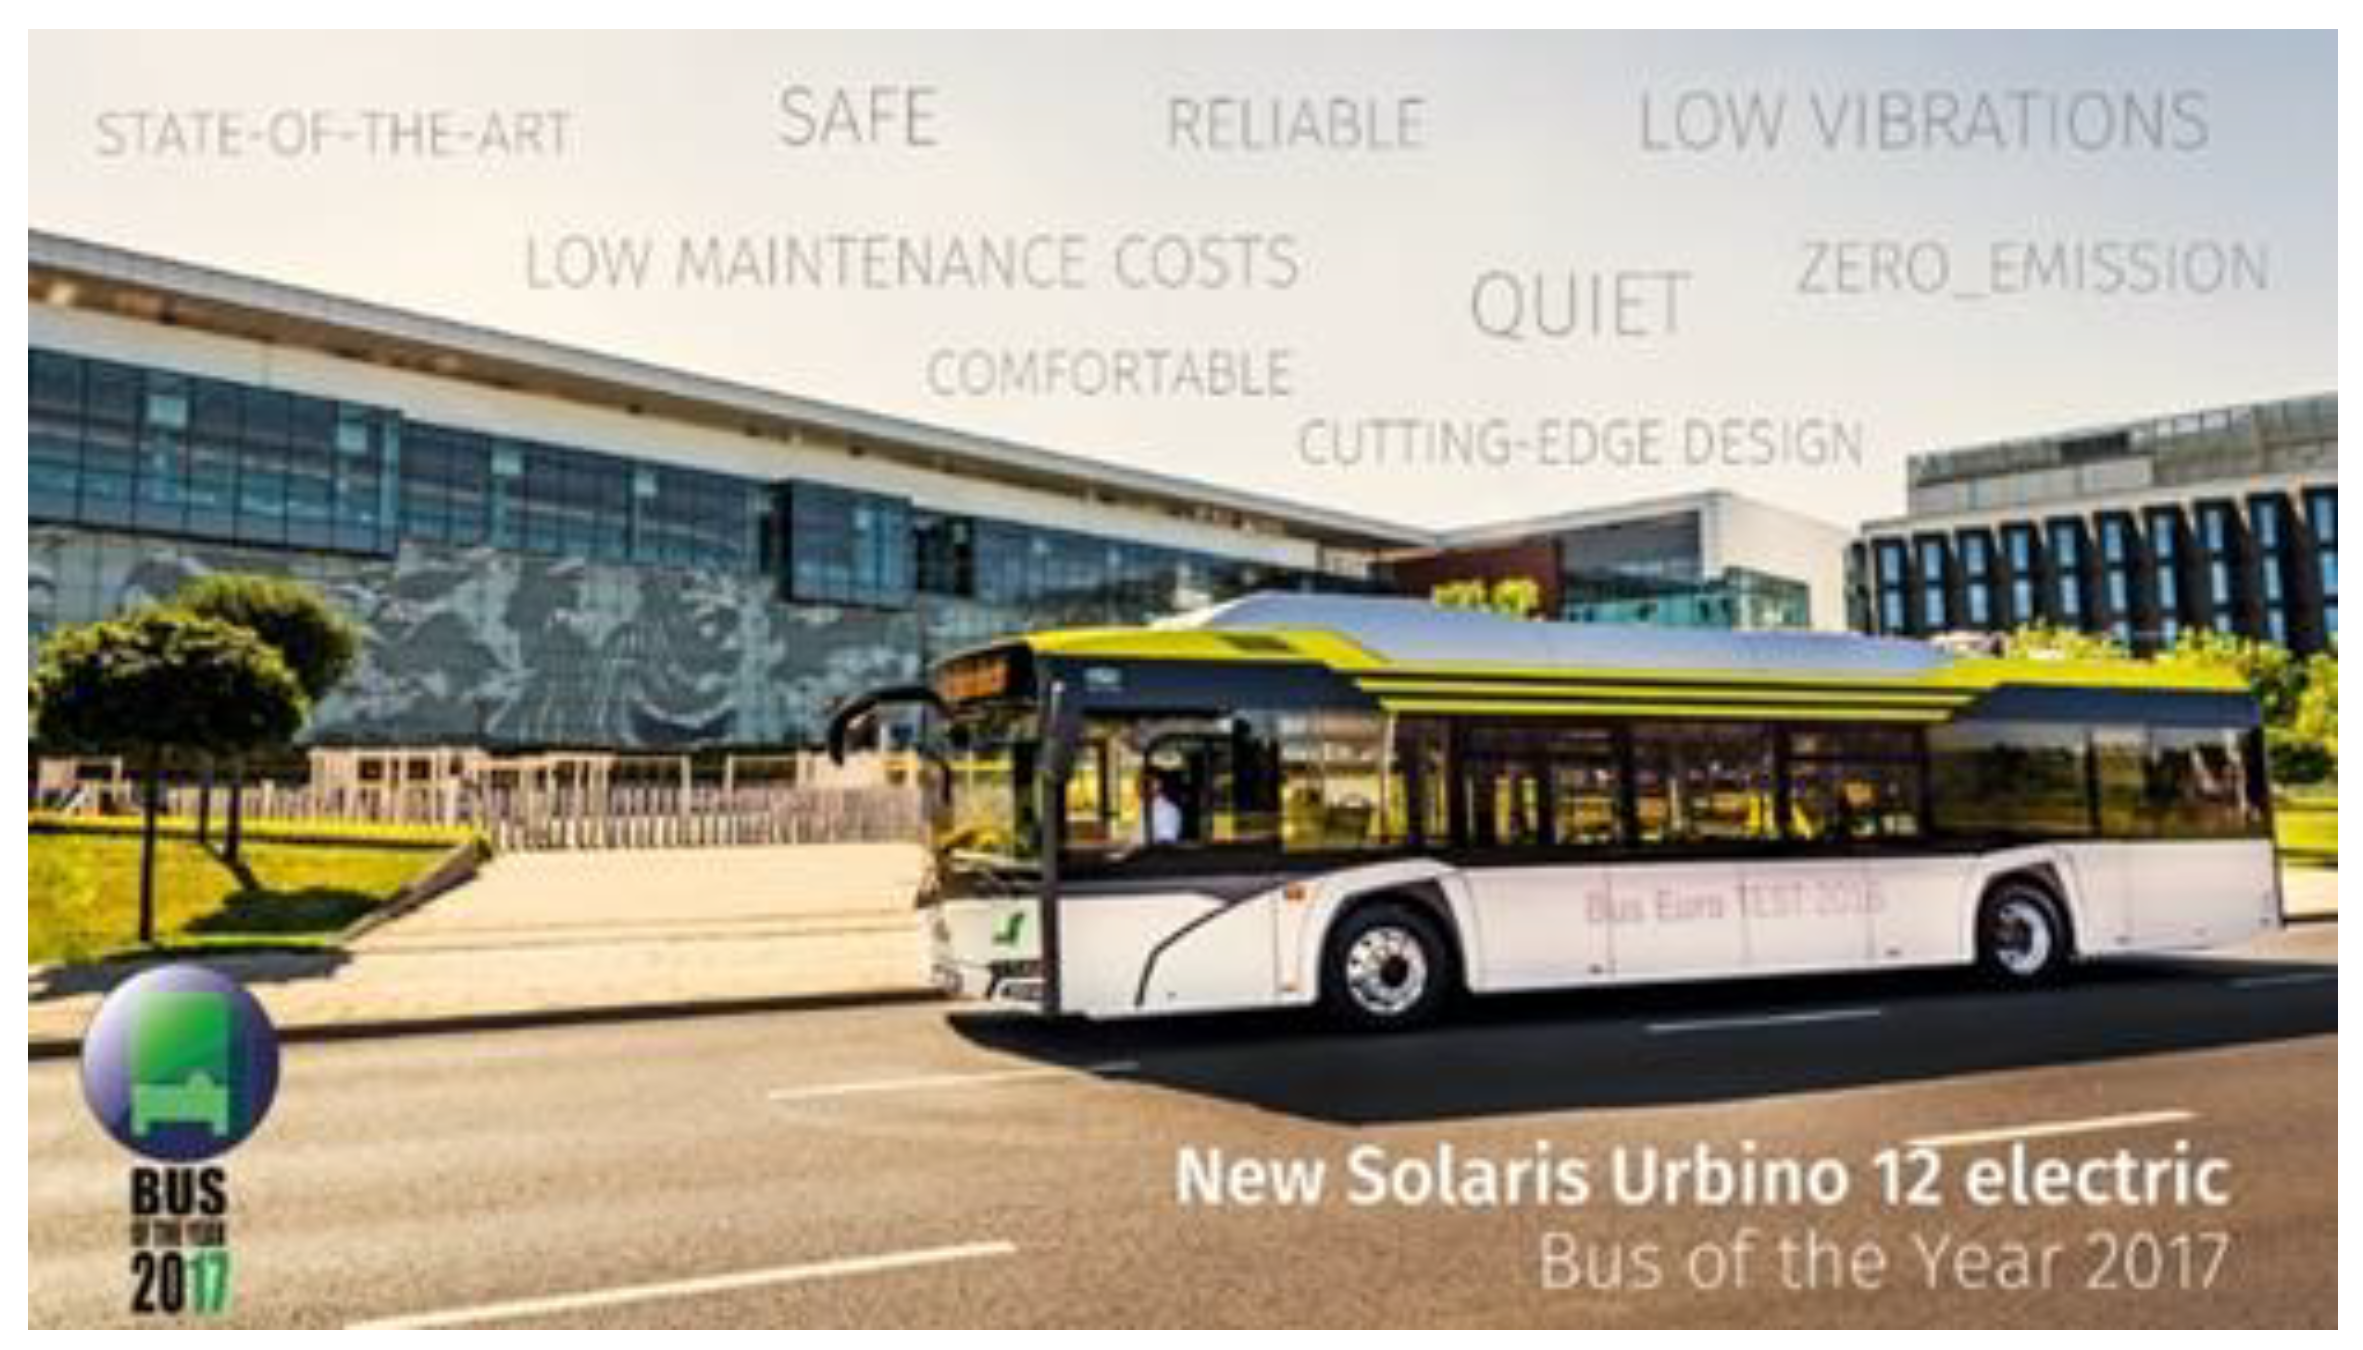
The baseline demonstrator is the Solaris Urbino electric bus, TRL 9, manufactured by Solaris Bus & Coach sp. z o. o, Poland (see
Figure 1). Due to innovation, equipment, and modern solutions tailored to each vehicle for individual clients, the Solaris Urbino electric was named the baseline bus and the “Bus of the Year 2017.” The bus achieved very good results in energy consumption compared to previous editions and other e-buses from different manufactures.
2.2. Demo Description
The goal of the 23 e-bus fleet demo is to optimize the vehicle operation process, including the power consumption, and provide an improved version of the baseline vehicle. The demo resulted in overall operational cost reduction compared to the baseline vehicle.
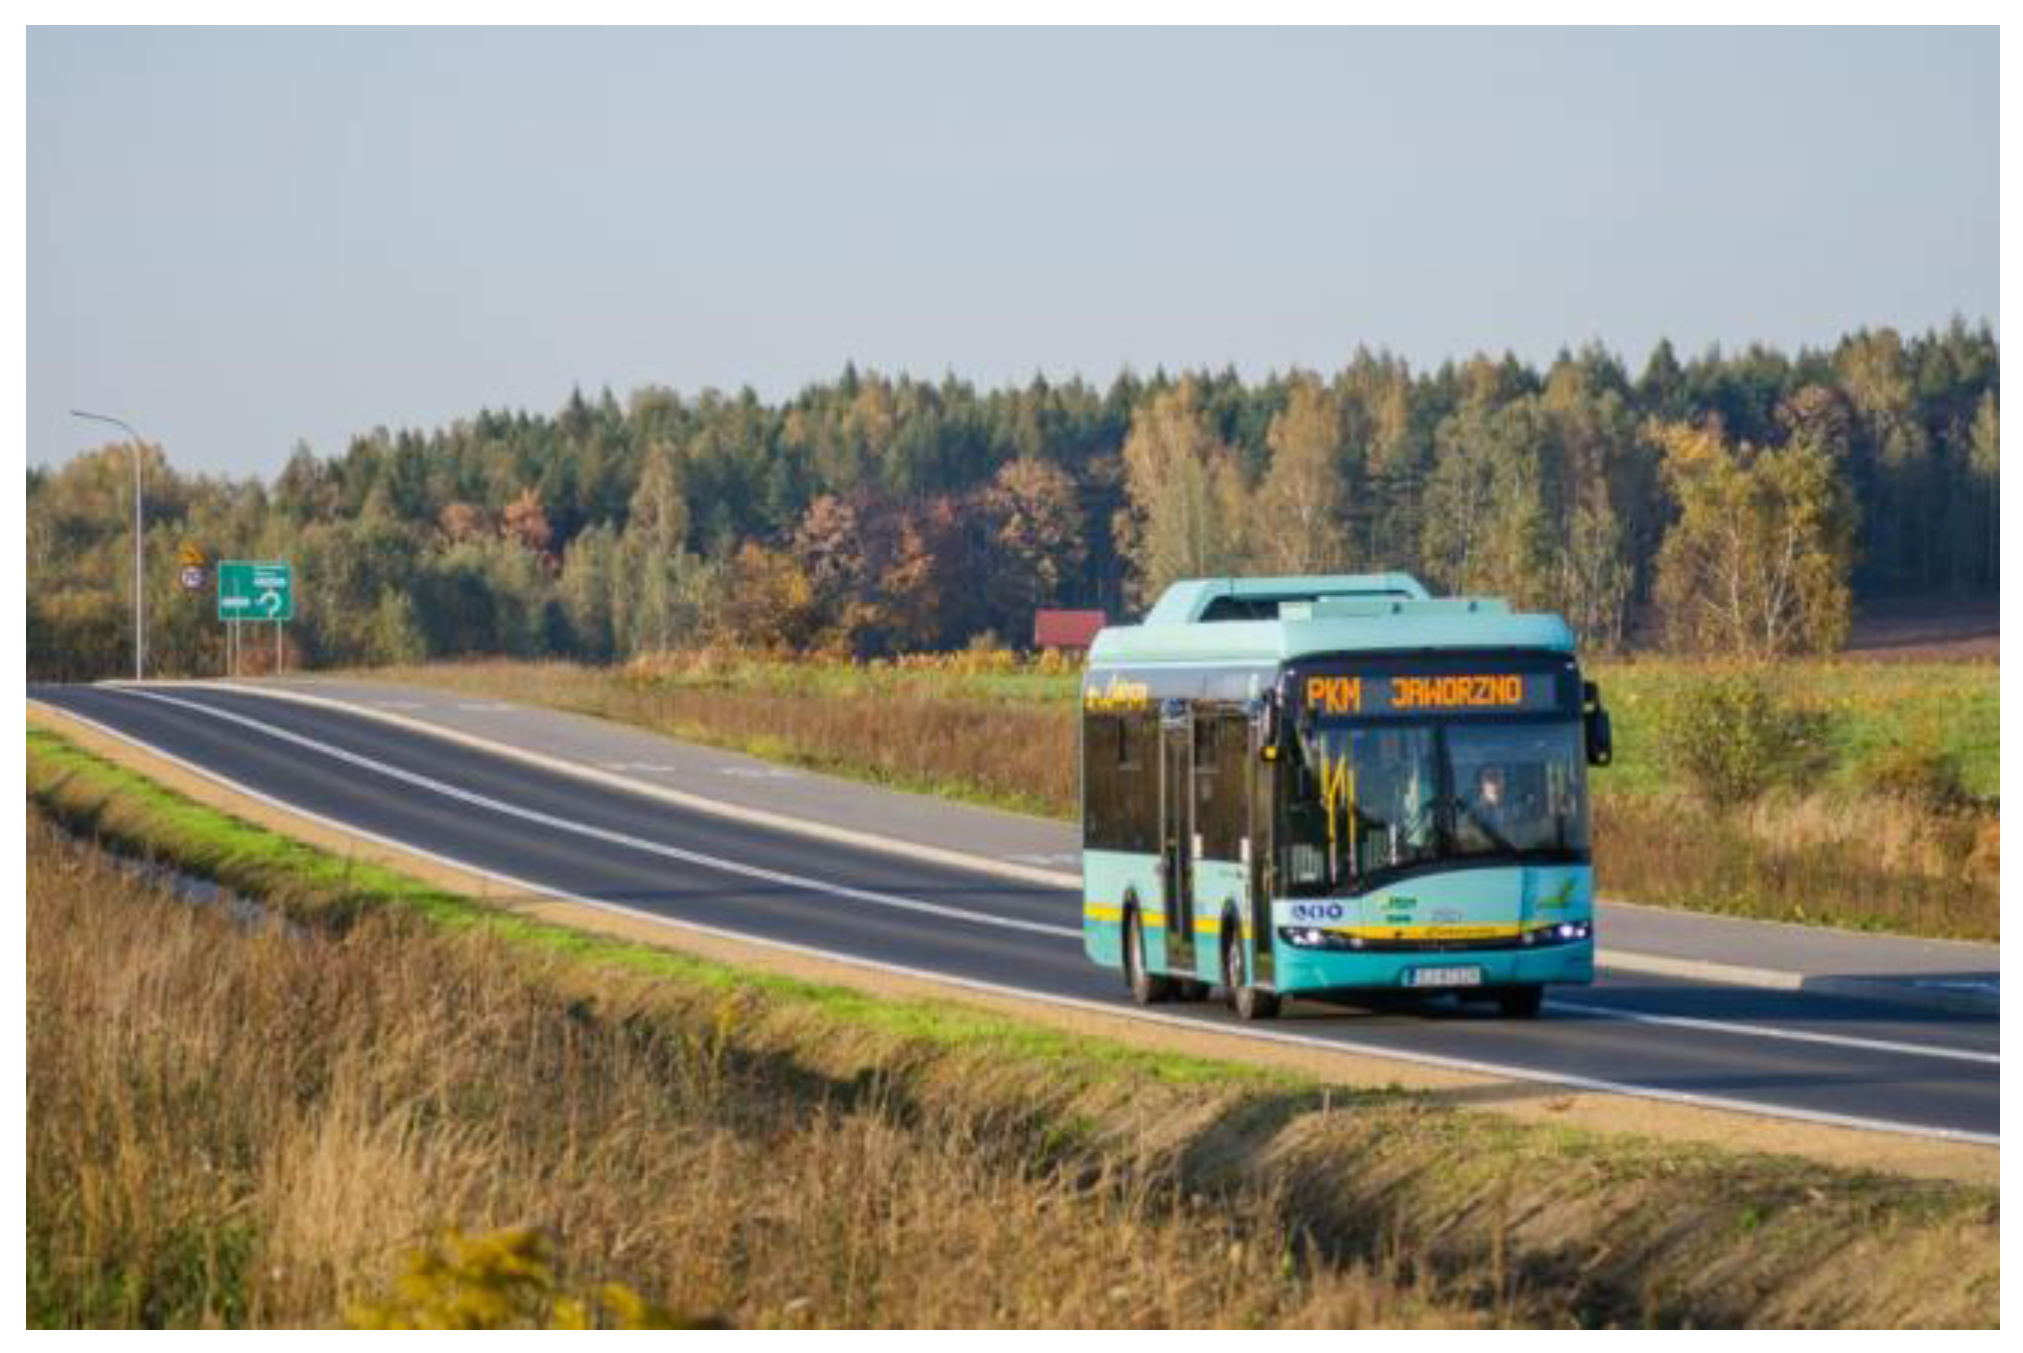
The e-bus fleet demo is in real-life operation in Jaworzno, which has a population of around 90,000 and medium traffic congestion. The e-bus fleet in Jaworzno includes three models: one low-entry (LE) Urbino 8.9 LE electric model, two low-floor (LF) Urbino 12 electric model, and the articulated Urbino 18 electric. The numbers in the model names refer to the e-bus length, i.e., 8.9 m, 12 m, and 18 m.
In Jaworzno, there are 23 e-buses operated by PKM Jaworzno. There are 4 units of 8.9 m e-buses, 10 units of 12 m e-buses, and 9 units of 18 m articulated e-buses. The e-buses are equipped with standard charging solutions, which are plug-in charging with a Combined Charging System (CCS2) connector and pantographs (Type B). The e-buses have no on-board charger (OBC), so both charging solutions provide a DC power to the e-bus batteries.
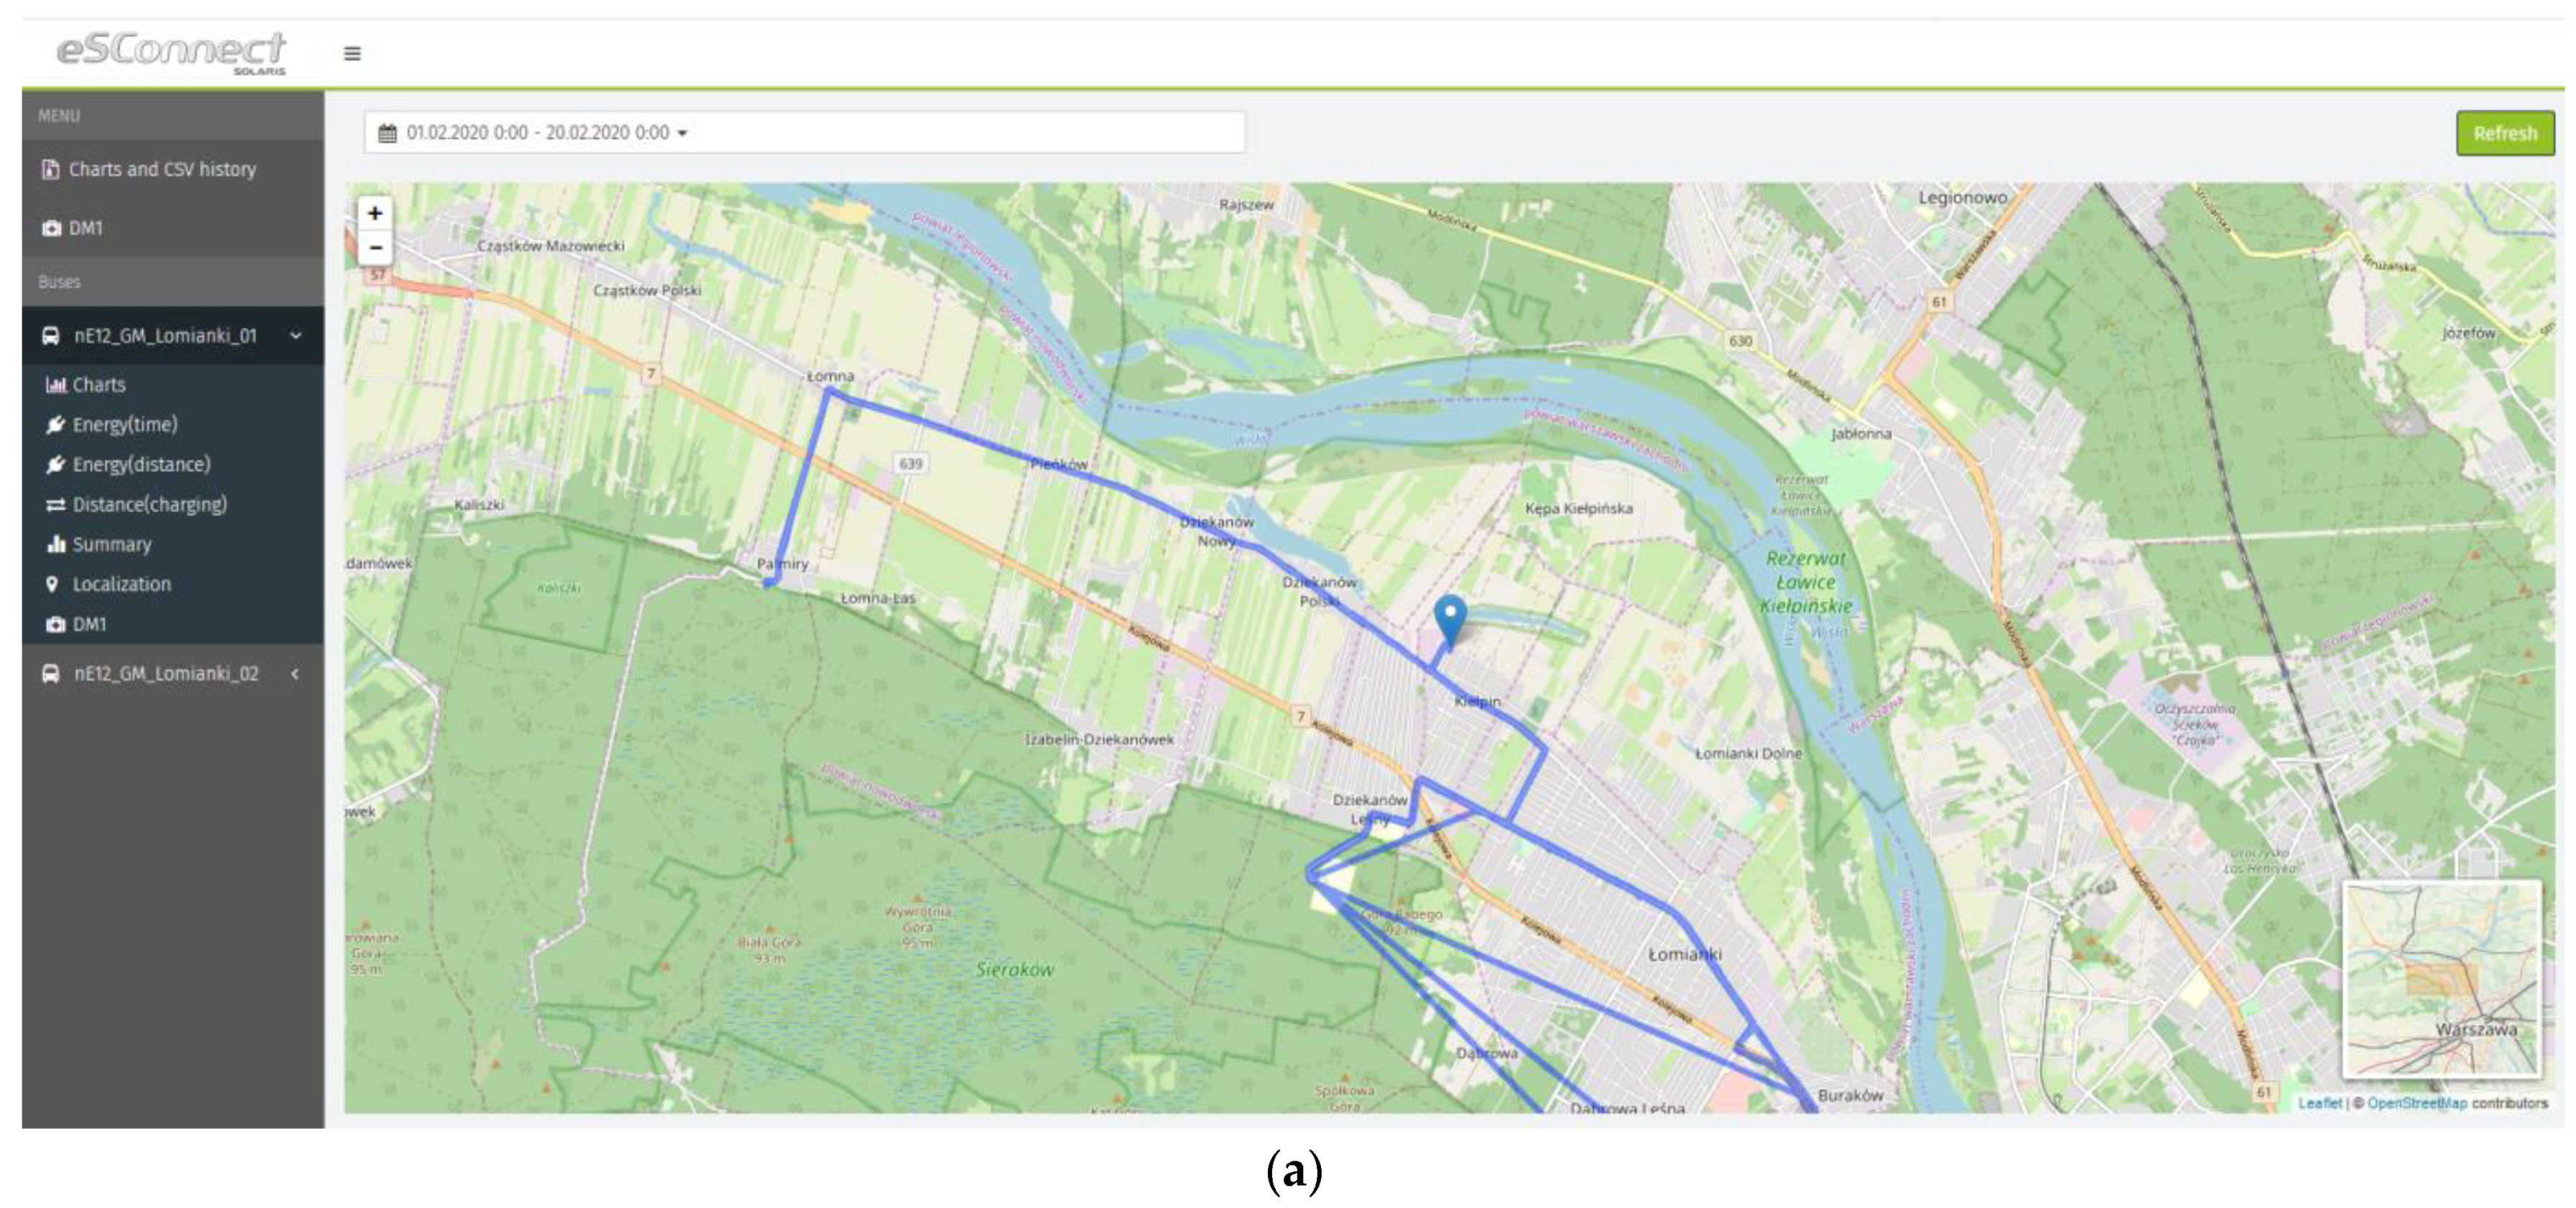
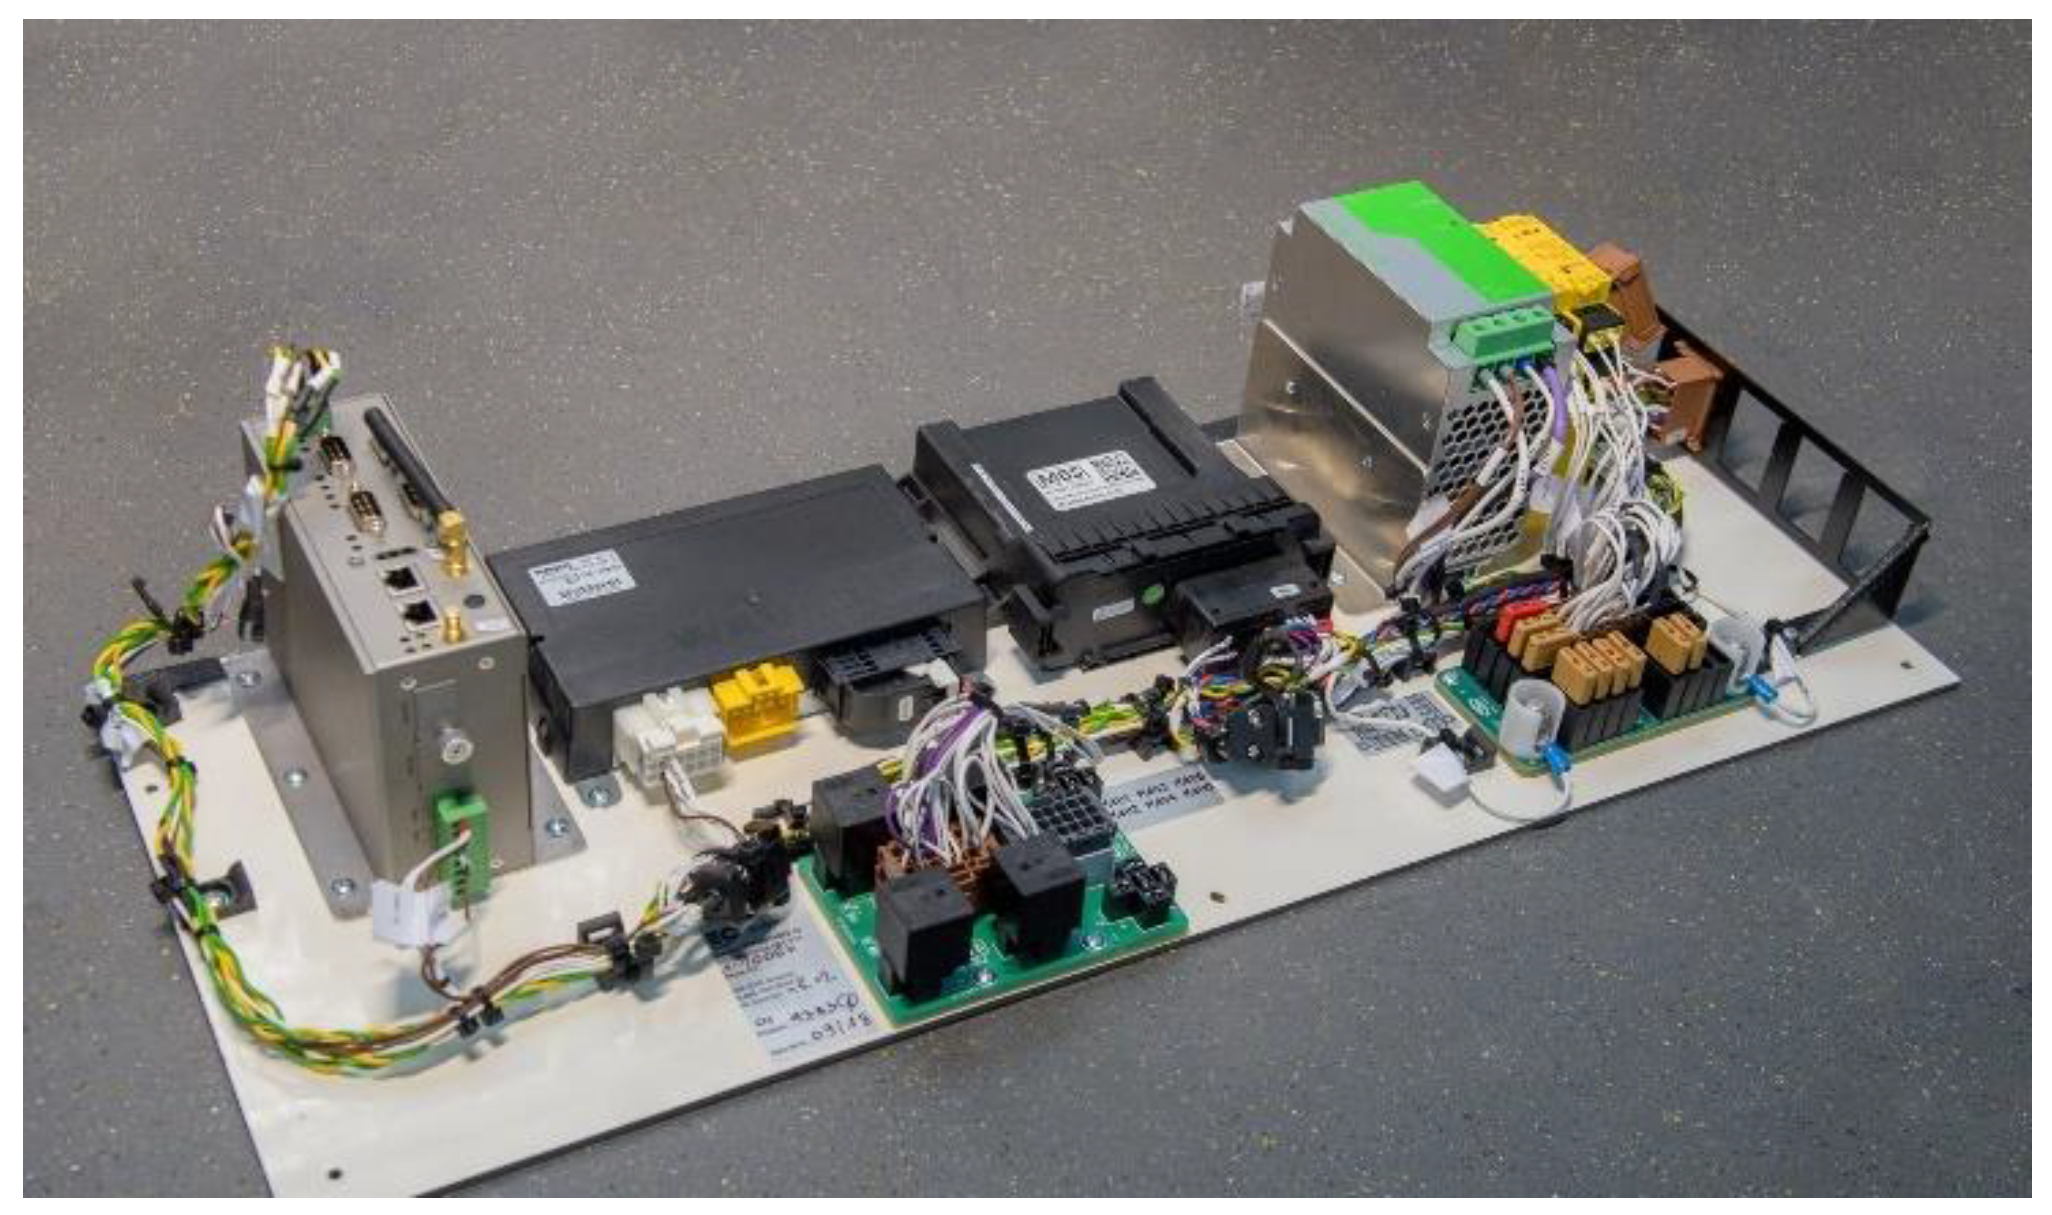
The e-buses are equipped with eSConnect data logging devices (
Figure 2), which offer some extra software modification and features than what was equipped in the baseline vehicles in order to achieve the objectives of the demo. This device is responsible for data acquisition and communicating with the servers.
The eSConnect unit is an embedded system with a low-power processor and is designed to withstand harsh environmental temperatures ranging from −40 to 70 °C. The system can withstand 1G vibration (7–50 Hz), humidity ≤ 95%, and is electromagnetic compatibility (EMC) compliant, according to UN ECE R10.05. The system is equipped with data-logging capability from a Controller Area Network (CAN) bus. Thanks to its properties and software, it can remotely log signals from different components connected to a powertrain CAN-bus and transmit them in real time to a server for monitoring, optimization, and control purposes. The e-buses are equipped with systems that allow the number and weight of passengers to be detected. Then, the measured signals are sent to the eSconnect device. In total, there are over 46 parameters/signals that are measured/registered and saved with the eSconnect device, such as pressure sensors, external temperature, internal temperature, passenger flow, total mileage range, vehicle speed, date and time stamps, start of charging, end of charging, battery state-of-charge (SoC), recuperated power, etc.
2.2.1. 8.9 m e-Bus
The PKM Jaworzno bus operator has 4 units of Solaris Urbino 8.9 LE (see
Figure 3) electric composed of Solaris high-energy lithium-ion batteries boasting a capacity of 160 kWh. PKM is the e-bus operator in Jaworzno, Poland.
The driveline in use is a central electric asynchronous motor with 160 kW of power. The buses are fitted with an air conditioner with 24 kW. The heating unit in use is an electric boiler of 25 kW. Moreover, the Urbino 8.9 LE electric is equipped with a 24 V electric installation, serving as a power source for the driver’s panel and for the electric power steering pump.
On account of the battery weight, it is crucial to arrange them correctly in the bus in order to distribute the weight evenly. In the Solaris Urbino 8.9 LE e-bus, the electric batteries are located in two areas: Two packs of 40 kWh each are placed in the rear of the bus, and two more on the roof, just before the second axle.
The roof layout of the Urbino 8.9 LE electric is as follows: A traction container is placed in the front, followed by an air-conditioning unit and then two 40 kWh battery packs. The pantograph is installed above the second axle, over the roof hatch. The braking resistor is located next to the pantograph closest to the right edge of the roof.
2.2.2. 12 m e-Bus
The PKM Jaworzno bus operator has 10 units of Solaris Urbino 12 electric (see
Figure 4). The 12 m e-buses use a TSA traction motor of 160 kW, equipped with high-energy 160 kWh lithium-ion batteries and standard electrical installation based on the CAN-Bus system. The applied solution in regard to air conditioning is a 24 kW full-vehicle air-conditioning, whereas for heating, the e-buses use a 25 kW electric boiler. Moreover, Solaris 12 m e-buses are fitted with a 24 V electric installation, serving as a power source for the driver’s panel.
On account of the weight of the batteries, it is crucial to arrange them correctly on the bus. In Solaris’ e-buses the batteries are located in two areas: two packs of 40 kW at the rear of the vehicle and two on its roof over the front axle. On the roof of the new Urbino 12 electric are the traction batteries; behind those is the air conditioning, followed by the traction container. A pantograph is located above the second axle. A braking resistor is fitted into the rear part of the roof.
2.2.3. 18 m e-Bus
The 18 m e-bus (see
Figure 5) uses a storage facility composed of a 240 kWh high-energy Li-ion battery. The driveline in use is a TSA central electric asynchronous motor of 240 kW. The e-buses also have standard electrical installation based on the CAN-Bus system.
The air-conditioning system for the buses uses two devices of 24 kW each. The heating involves an electric boiler of 37.5 kW. Moreover, the buses are fitted with a 24 V electric installation, serving as a power source among others for the driver’s panel and for the electric power steering pump.
On account of the battery weight, it is crucial to arrange them correctly in the bus. In the articulated Solaris Urbino 18 electric bus, the batteries are located in two areas: Three packs of 40 kWh each are placed in the rear of the bus, and three more on the roof between the first and the second axle.
The roof layout of the buses is as follows: The first unit of air conditioning is placed over the first compartment, and right behind it are the battery packs and then the Schunk pantograph. A traction container, the second unit of air conditioning, and the braking resistor are placed above the second compartment, with the latter device converting surplus braking power into heat. As a standard, the socket of the plug-in systems is located behind the front door, right over the first axle.
In summary, the three main characteristics of the e-buses are listed in
Table 3.
2.3. Demo Objectives
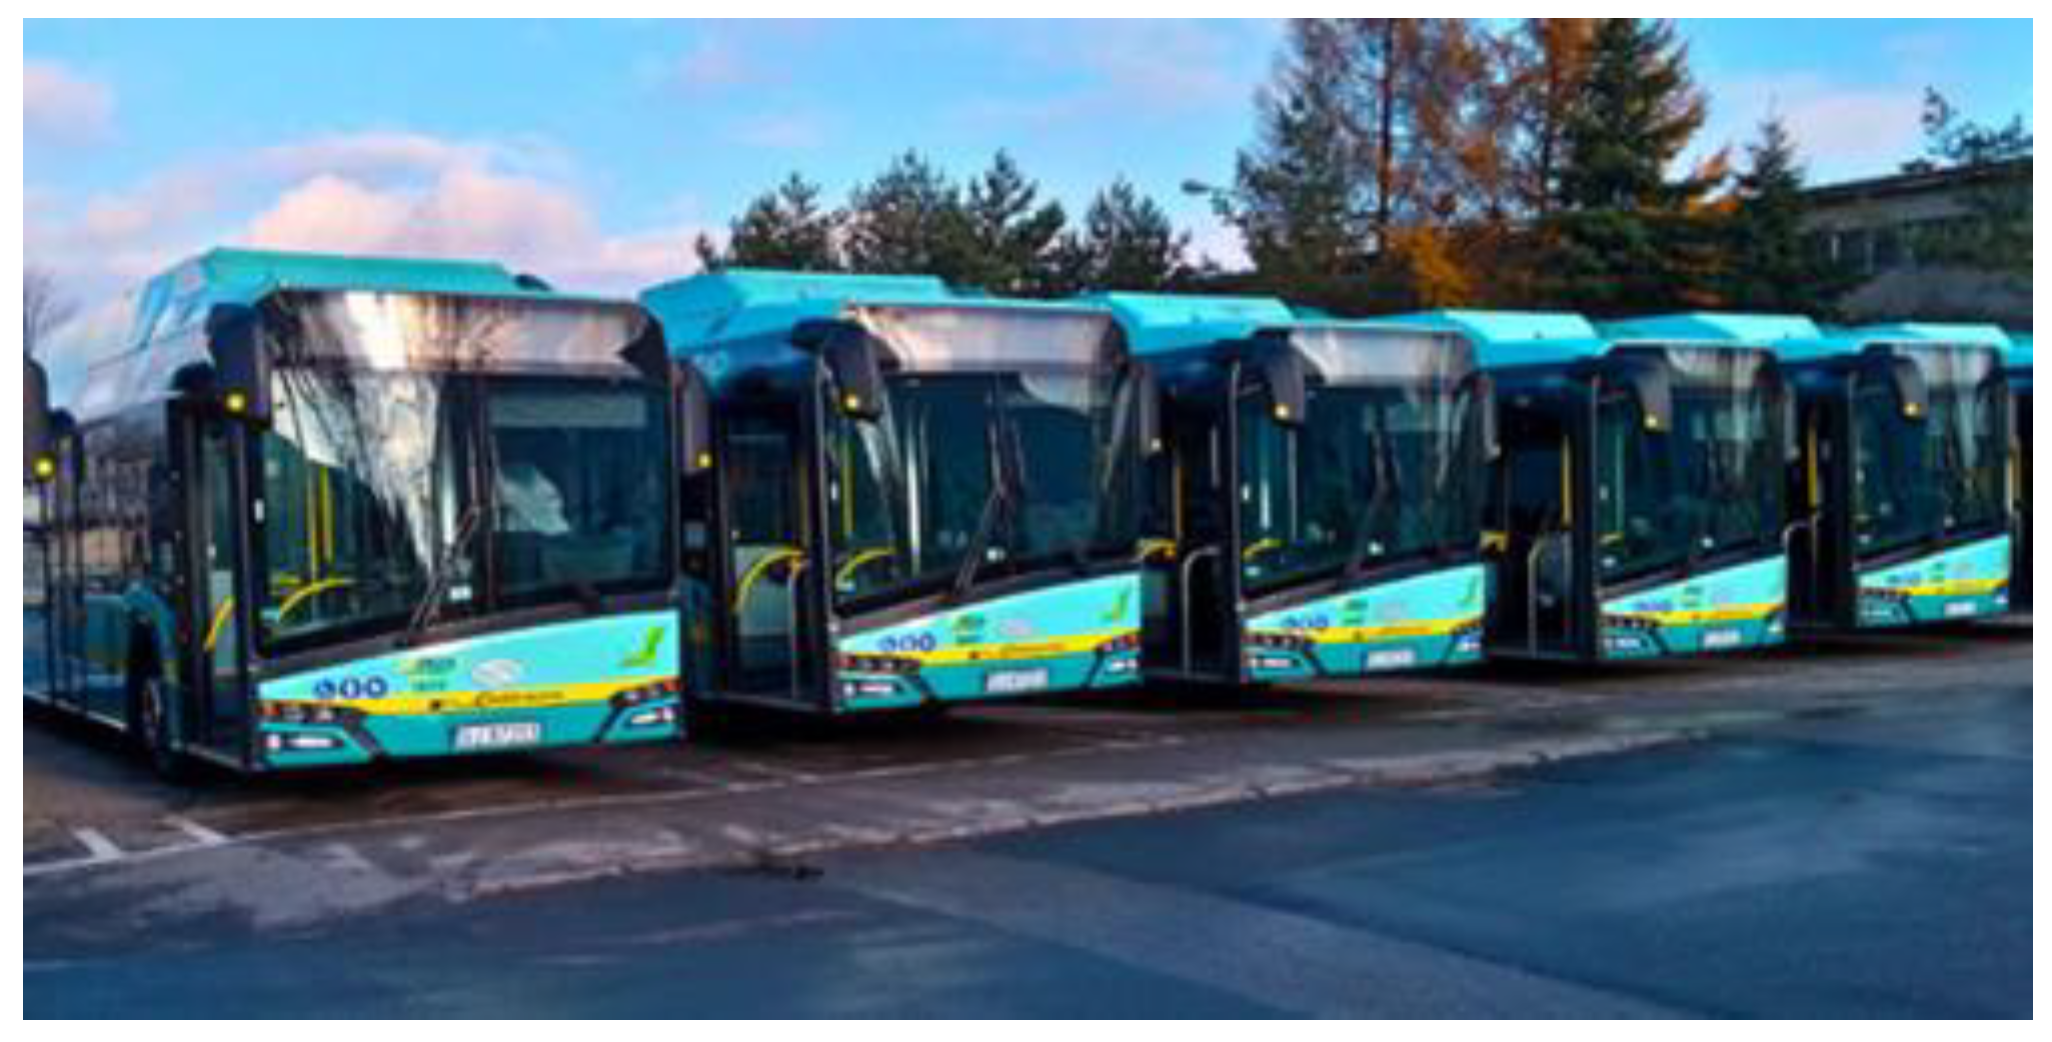
The demo aims to reduce the CO
2 emission in Jaworzno, reduce city noise, and optimize operational costs. To achieve these goals, a 23-bus fleet of electric urban buses for public transport were demonstrated in real-life operation (see
Figure 6), and there is a plan to upscale the fleet to over 40 e-buses. Pursuing these goals, several improvements on the current baseline demonstration vehicle were performed. Coordinated charging could be adopted to lessen the impact on the power grid.
2.4. Charging Infrastructure
Charging stations are regarded as the point of fueling EVs. Cords, connectors, and interfaces with the power grid are the key equipment of a charging station. The charging infrastructure stations are one of the key factors for the deployment of EVs. Generally, the EVs charging can be static, stationary, or dynamic. Static charging refers to the charging of a vehicle that is not moving and that is expected to stay in the same position for a long time, e.g., when the EV is parked in the depot. Stationary or opportunity charging (OppCharge) could also be done when the EV is stopped for a short time, and thus the charging should start automatically. On the other hand, dynamic charging means that the vehicle is charging while it is moving in normal traffic.
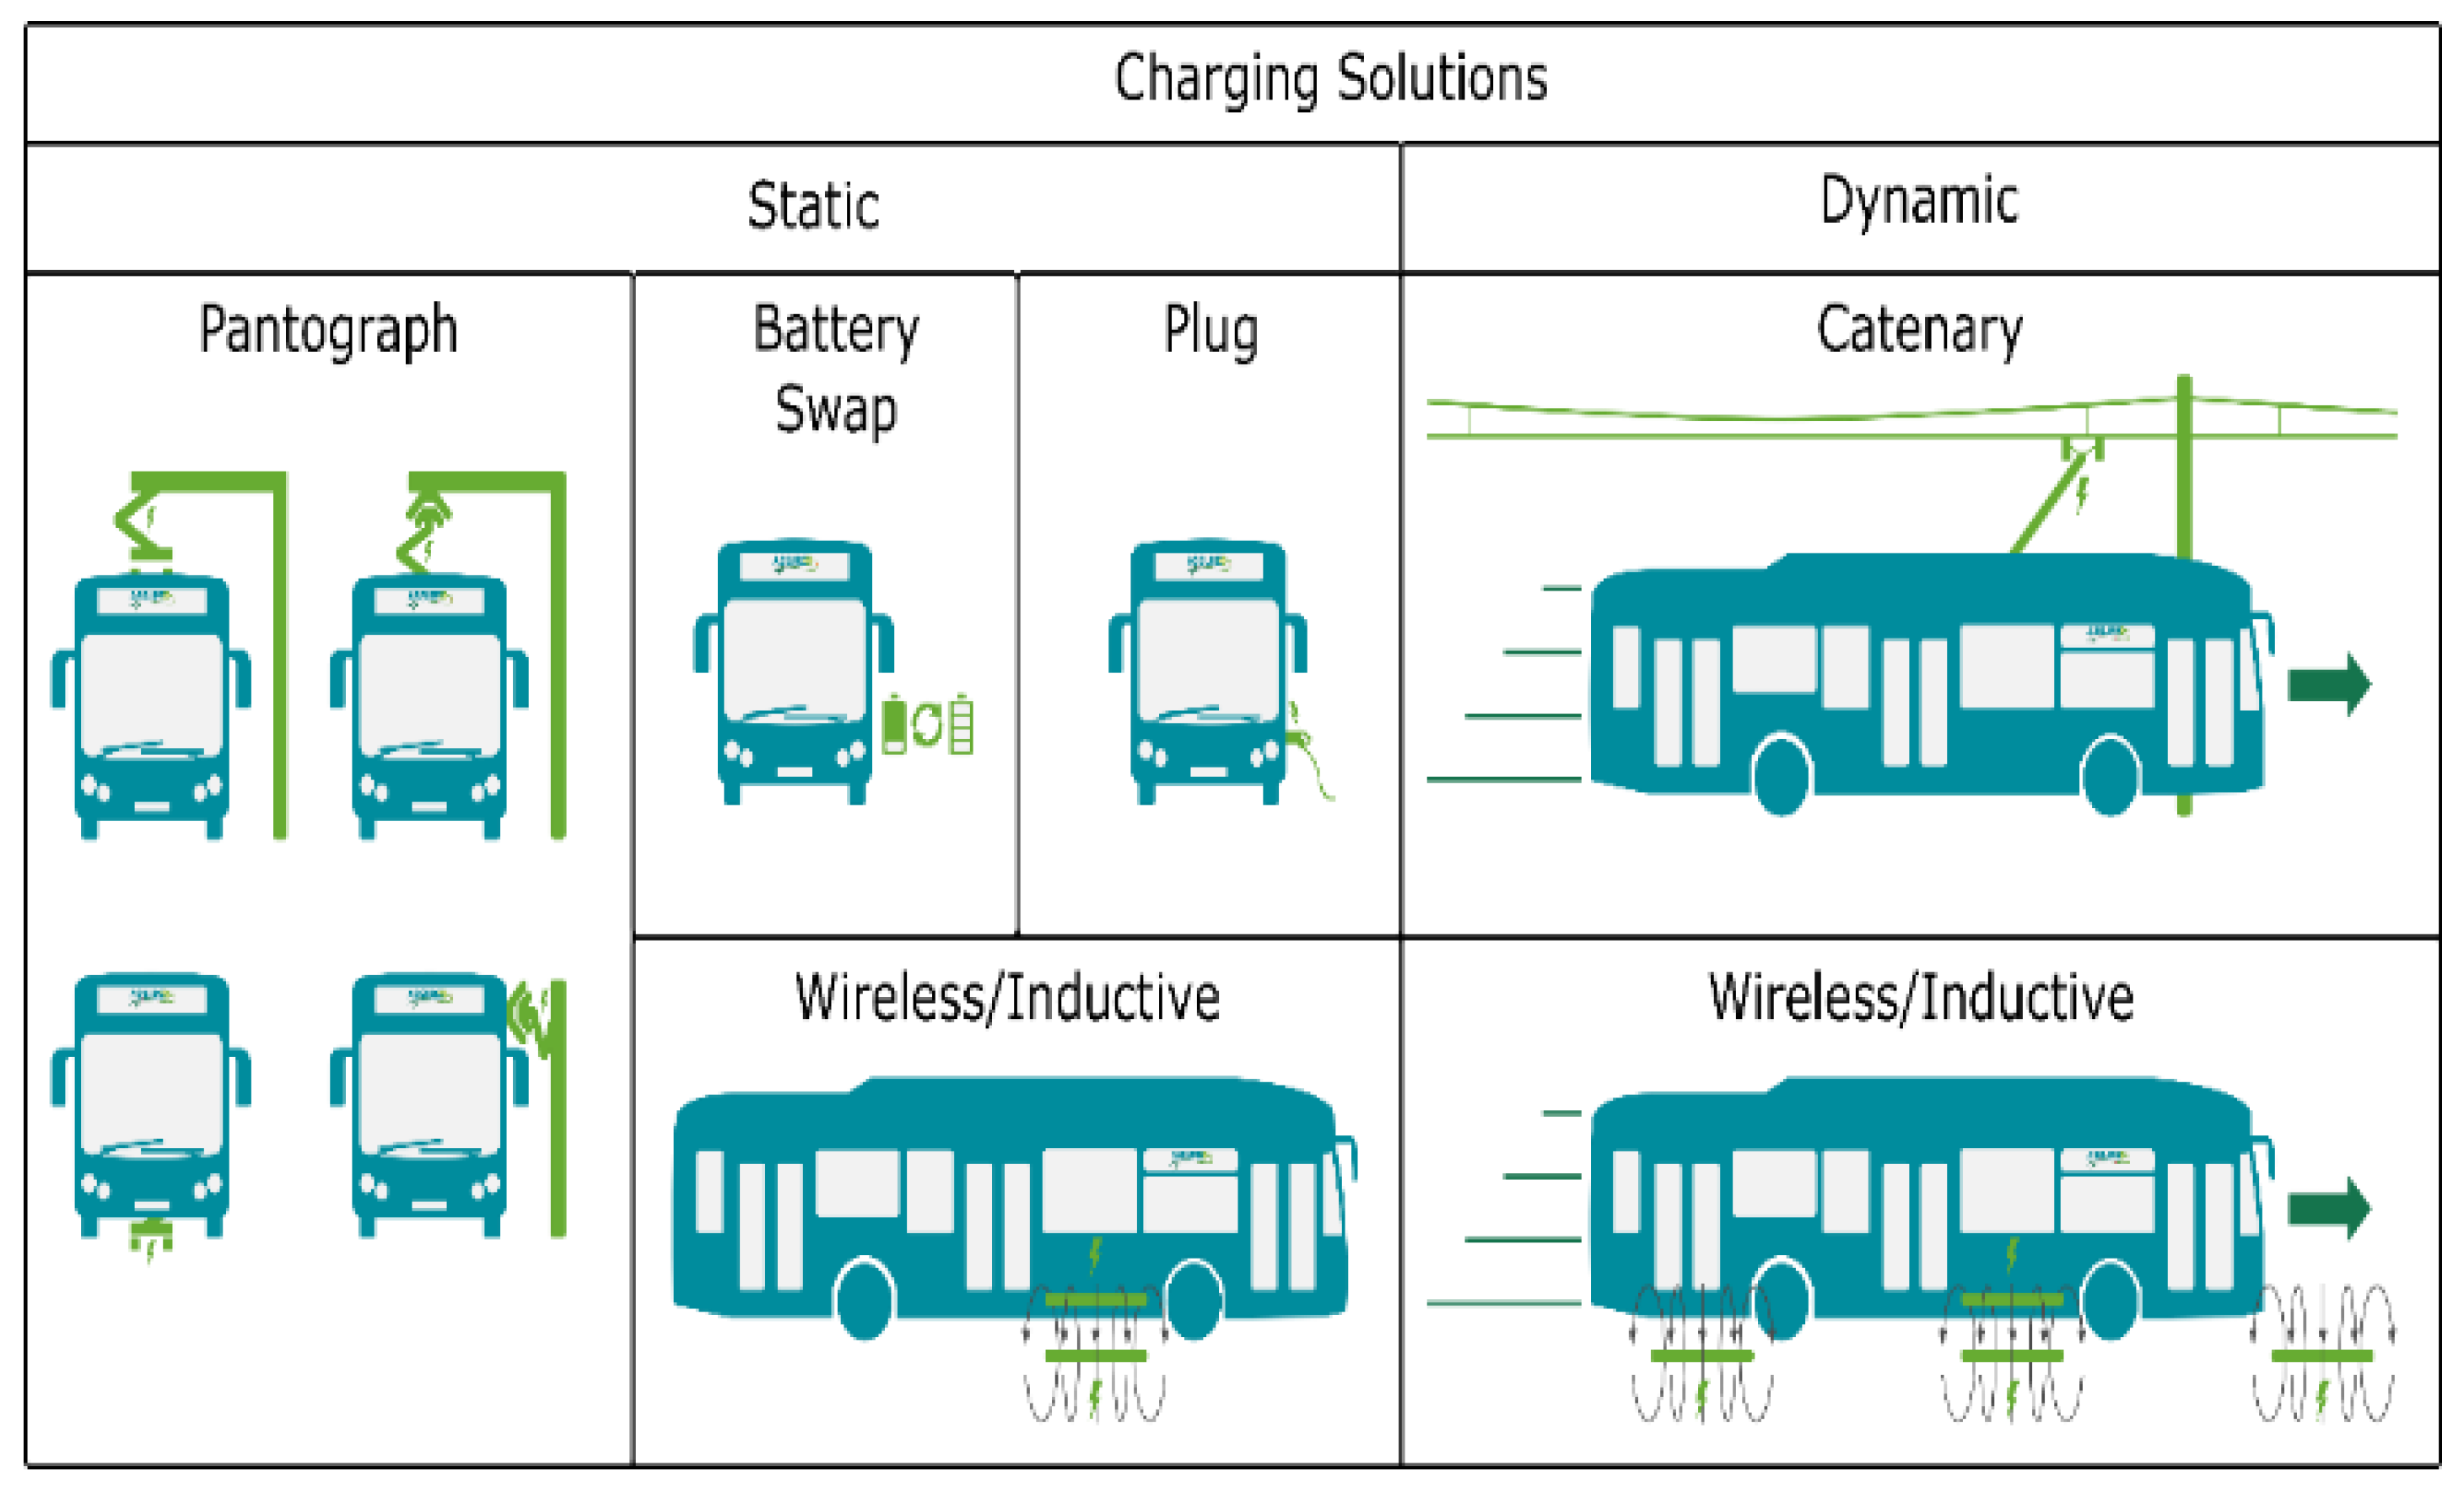
Based on the type of energy transfer and charging infrastructure, there are several solutions available for EV charging, which are categorized into the following types (see
Figure 7):
The charging infrastructure is one of the major issues of the widespread use of EVs. As the battery pack capacity on the vehicle is restricted due to vehicle weight, the batteries should always have enough stored energy to allow the e-bus to reach its destination conveniently. Normally, the vehicle charges through normal charging at the depot at night, and fast charging solutions must be available on a journey path (OppCharge). Due to the limited stopping/parking time during the journey, OppCharge is a fast-charging solution. Fast-charging solutions minimize the needed battery capacity, which minimizes the onboard vehicle weight and thus optimizes the operational cost.
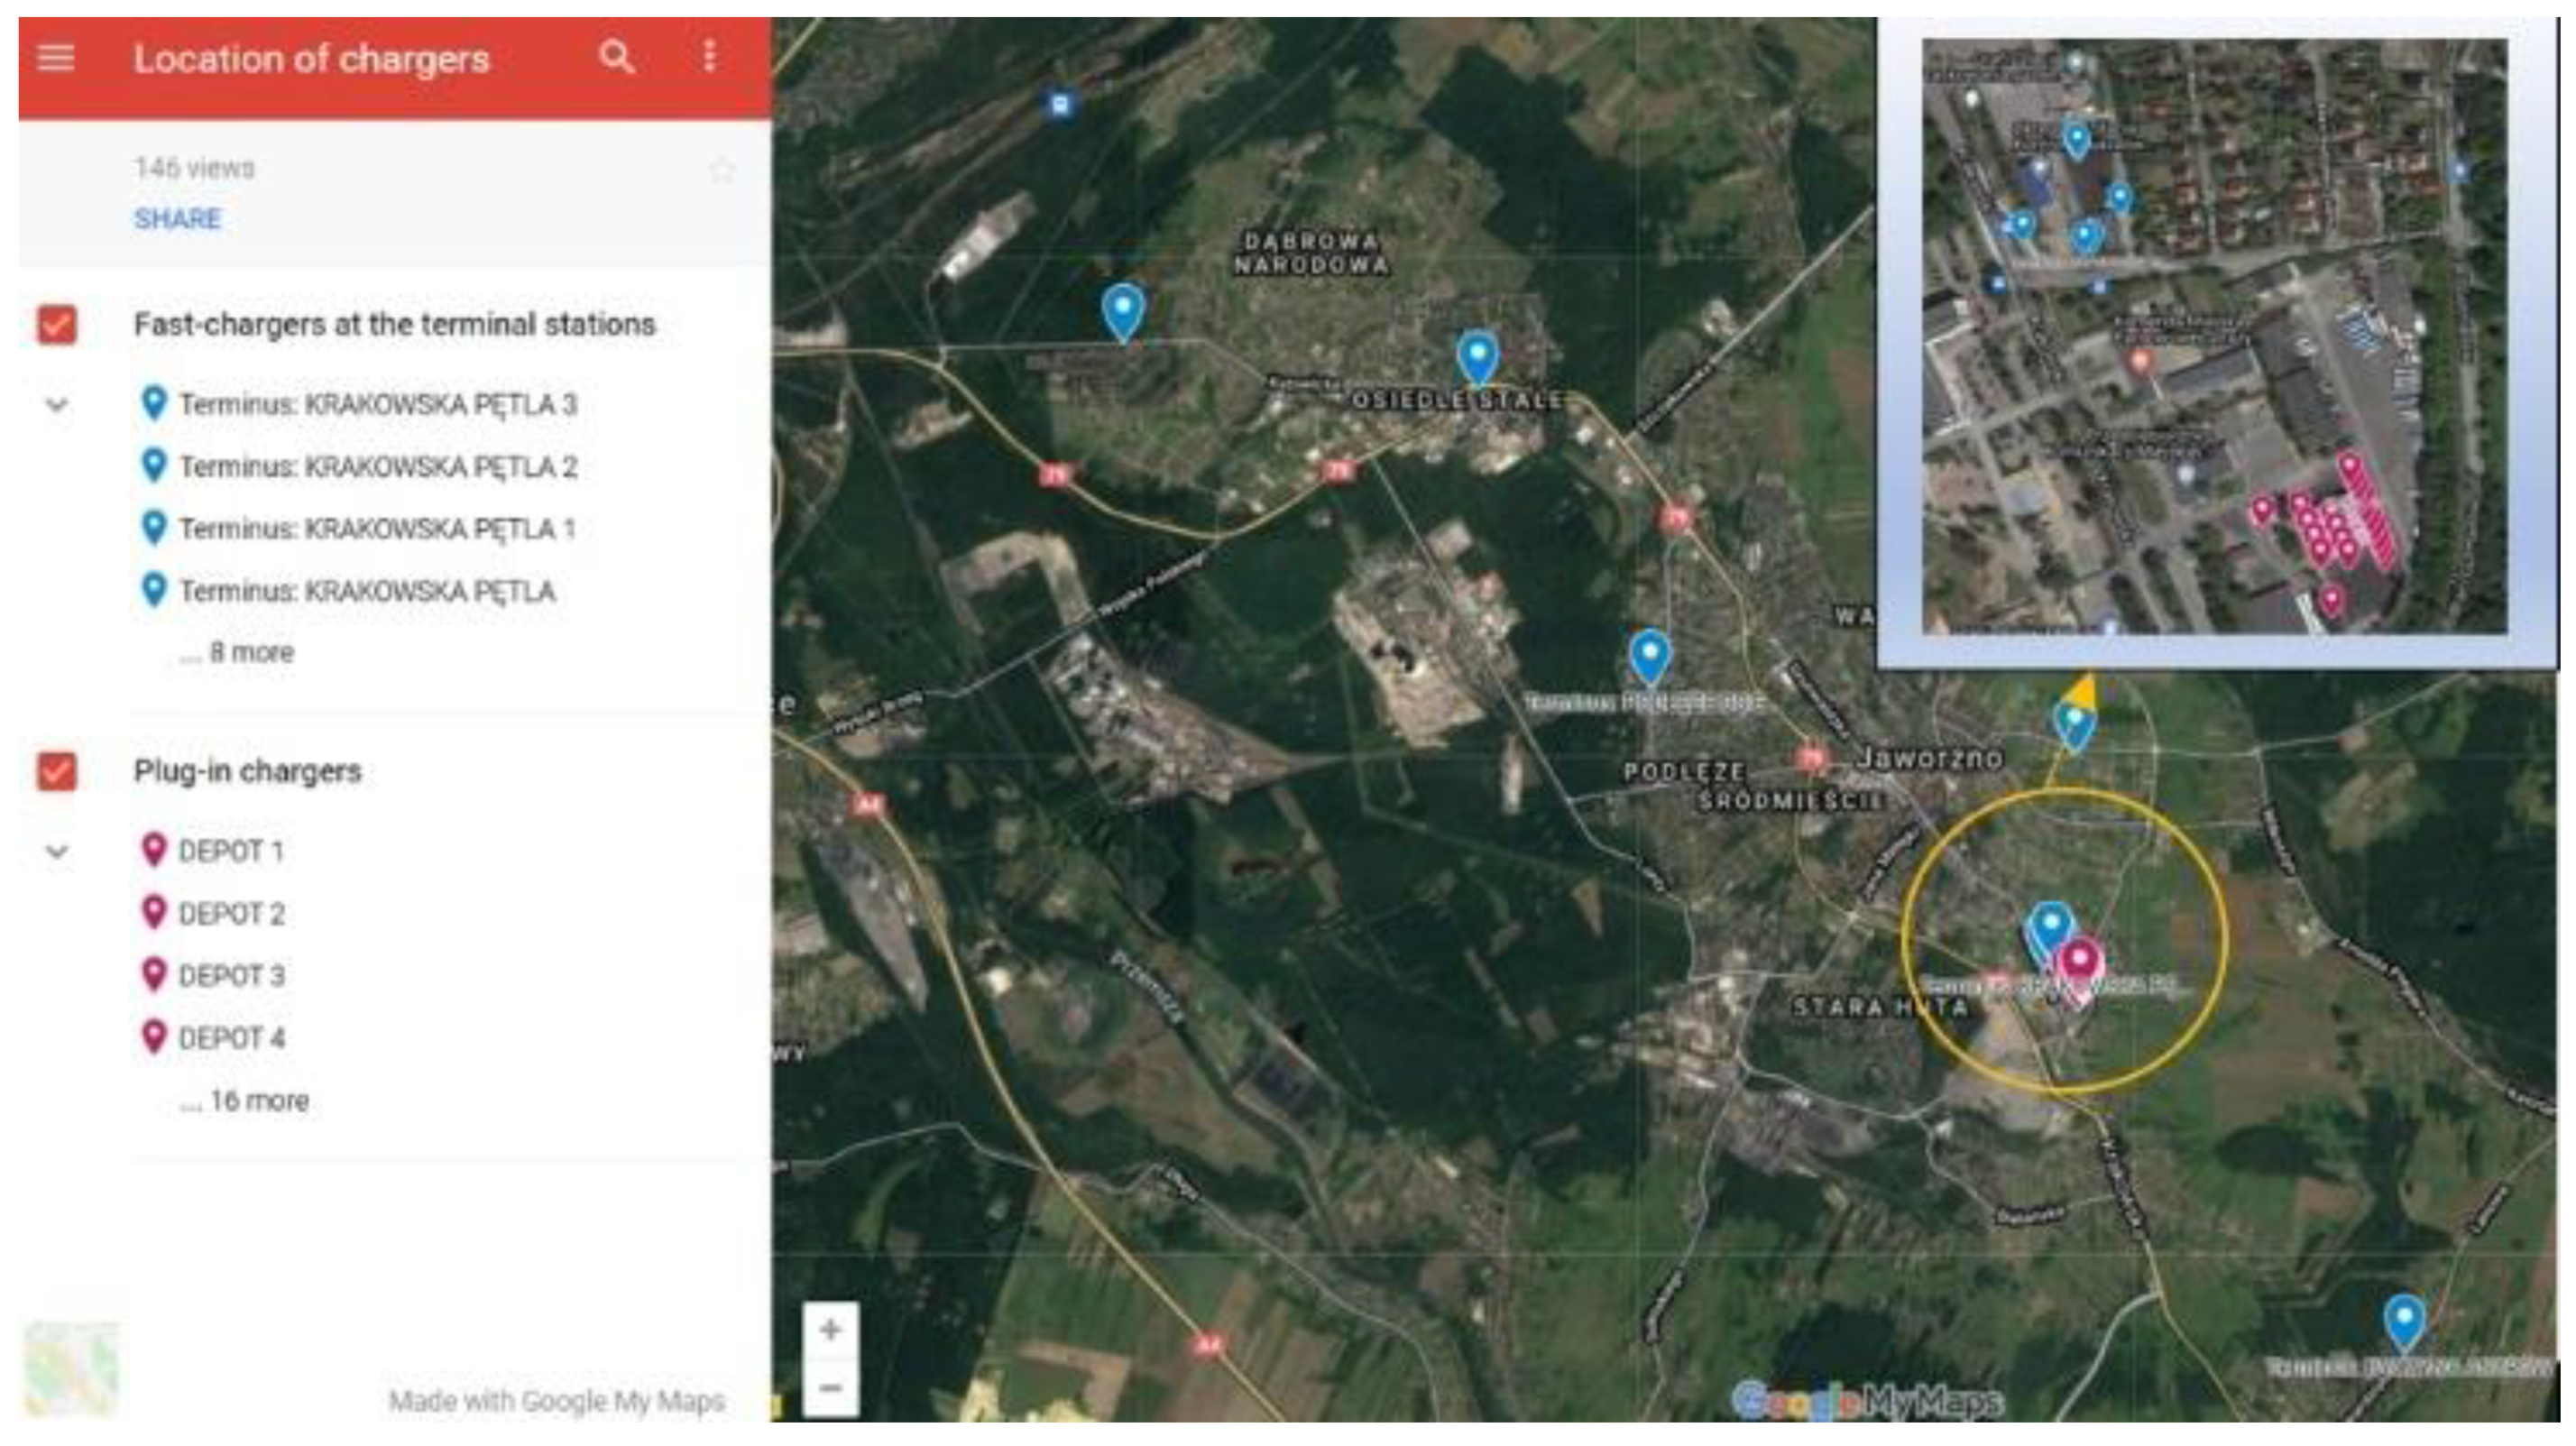
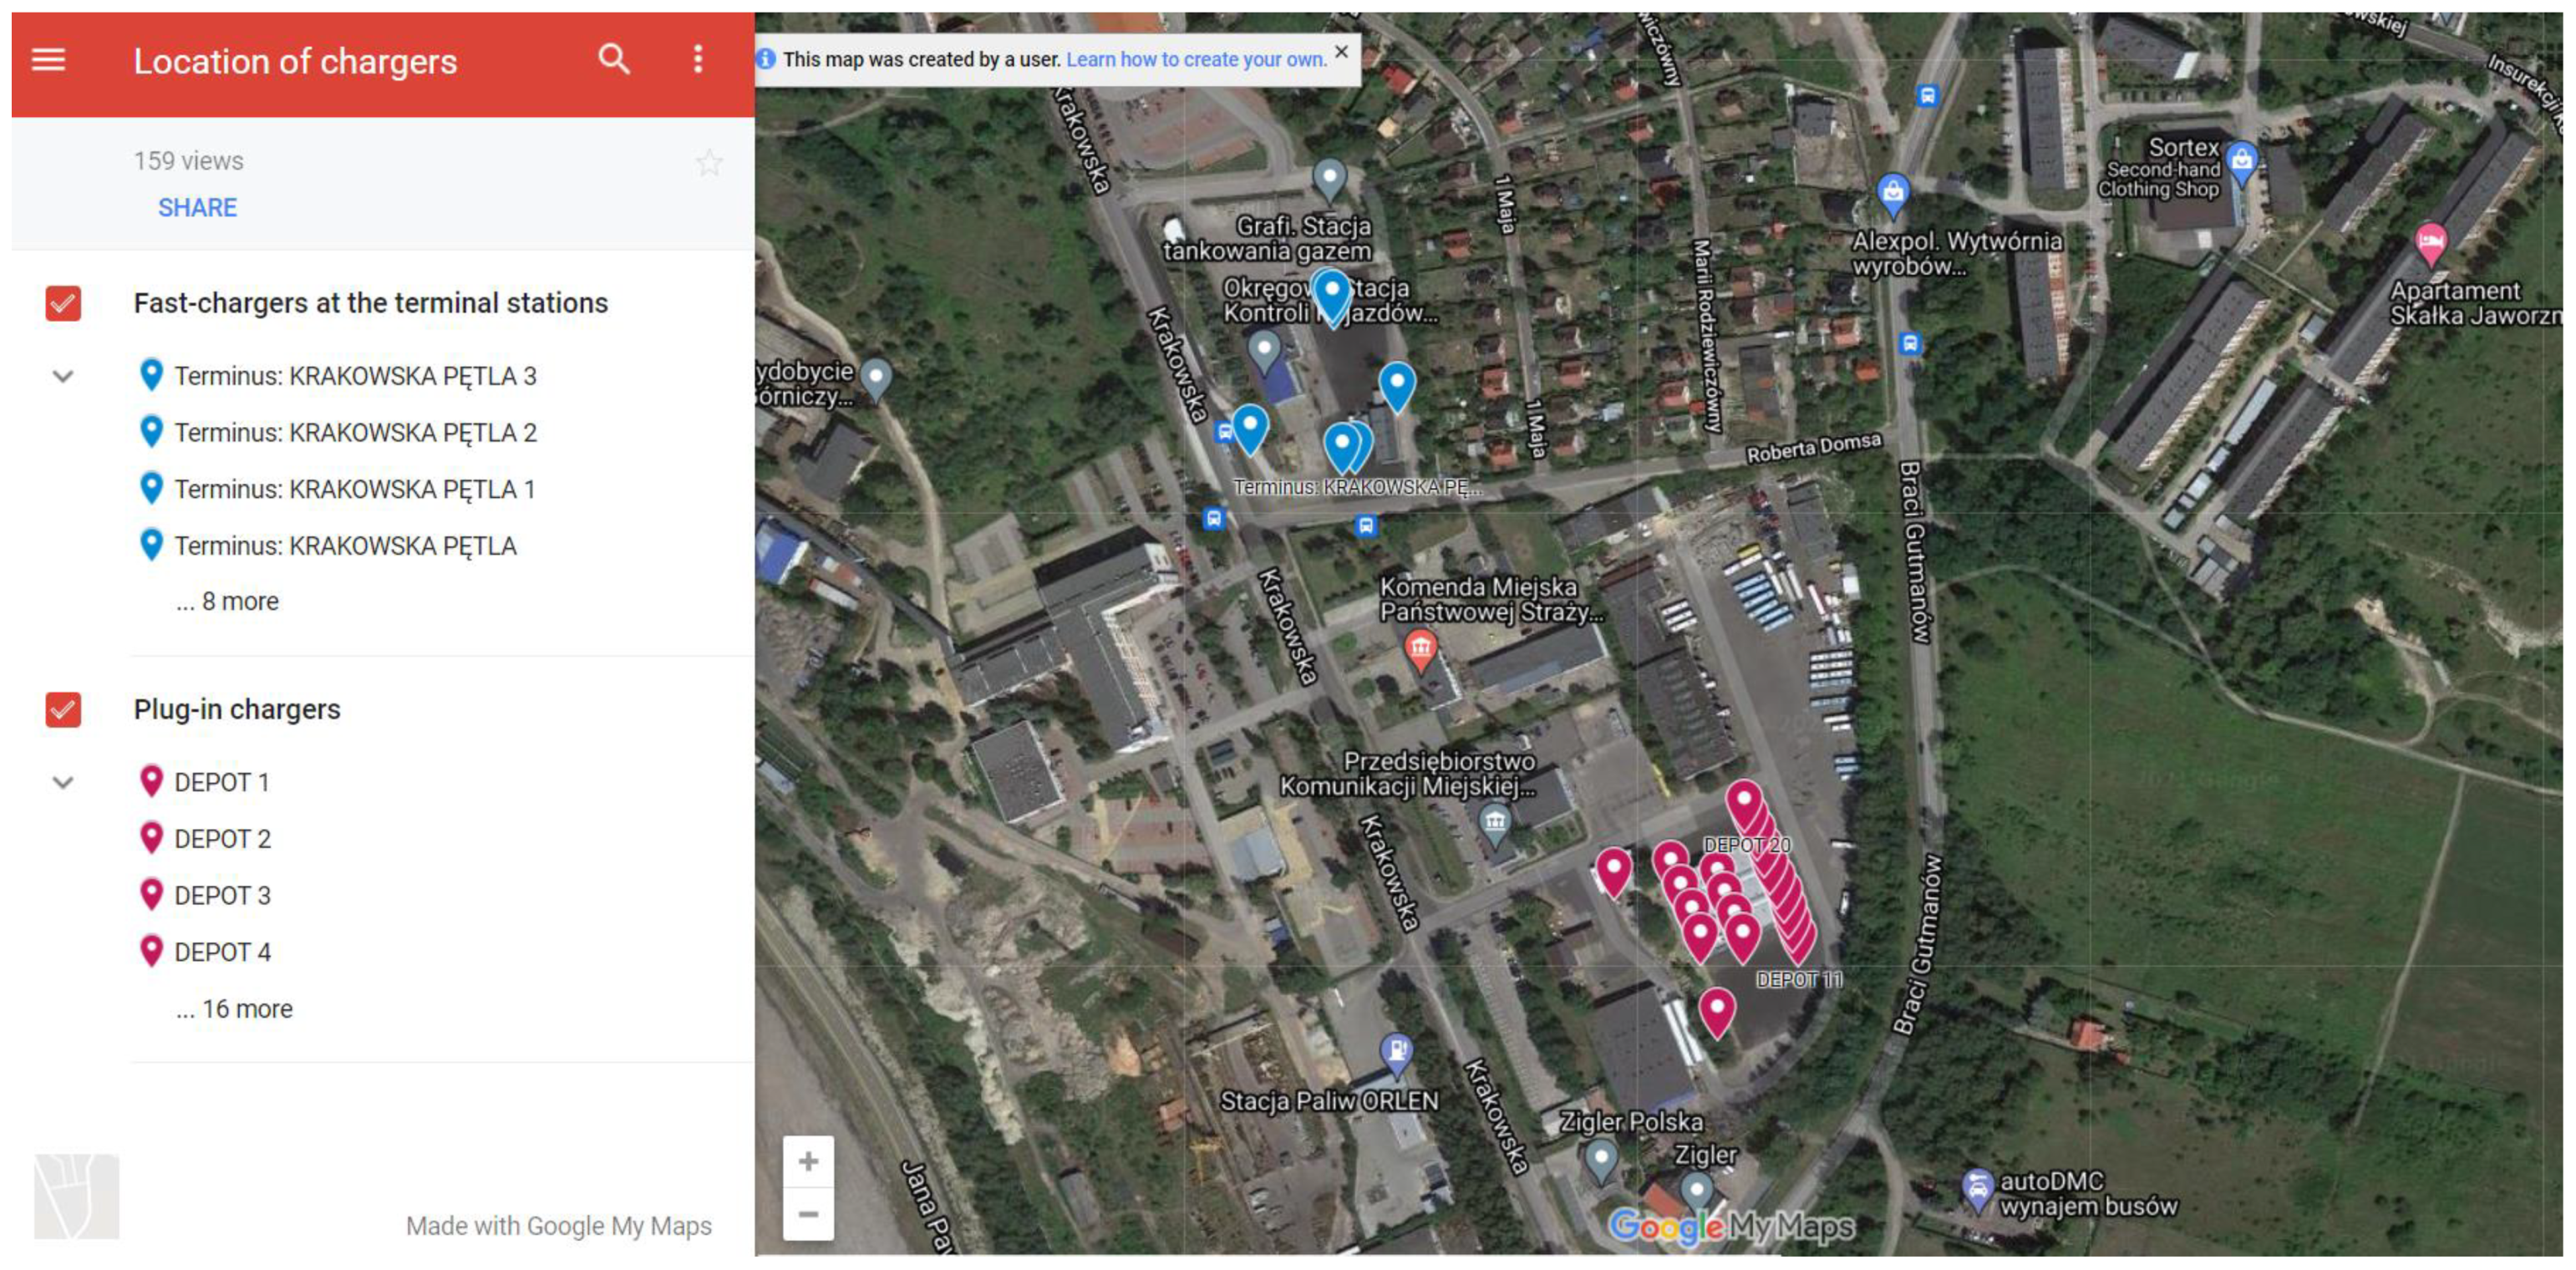
The Jaworzno demo e-buses are equipped with two charging technologies: plug-in and a pantograph. In Jaworzno, there are 20 plug-in chargers located in the depot, and 12 pantograph chargers are allocated along the e-bus line paths, as can be seen in
Figure 8, with a spot area (terminal station) of 20 plug-in chargers and 7 pantograph chargers connected to the same DSO connection point.
2.4.1. Depot Charging
Depot charging allows e-buses to be connected and charged while parked at the e-bus depot (PKM depot). The vehicles are connected to charging equipment typically using plugs and cables, but automated connection devices are also used in some depots. The energy transfer capacity depends on the power handling capacity of the cable and the connector connecting the charger to the vehicle. The charging concept aims to gently charge the entire e-bus fleet where the on-board battery of the e-bus is usually within a capacity range of 200–500 kWh.
The battery pack of an EV can only be charged by DC power. The power source available from the grid is AC and hence needs to be converted to DC before it reaches the battery pack. In the case of an AC charge point, the AC is converted to DC by equipment in the vehicle (on-board charger). Space and weight considerations tend to limit the power of chargers built into the vehicle. The DC charging points convert AC to DC outside the vehicle and thus bypass the onboard charger. A DC charging point is not limited to any significant degree by space or weight, meaning that it is able to accommodate much higher charging currents and the charging times for the batteries can be much shorter compared to AC charging. In addition to high-power DC chargers, there are also low-power DC depot chargers available on the market.
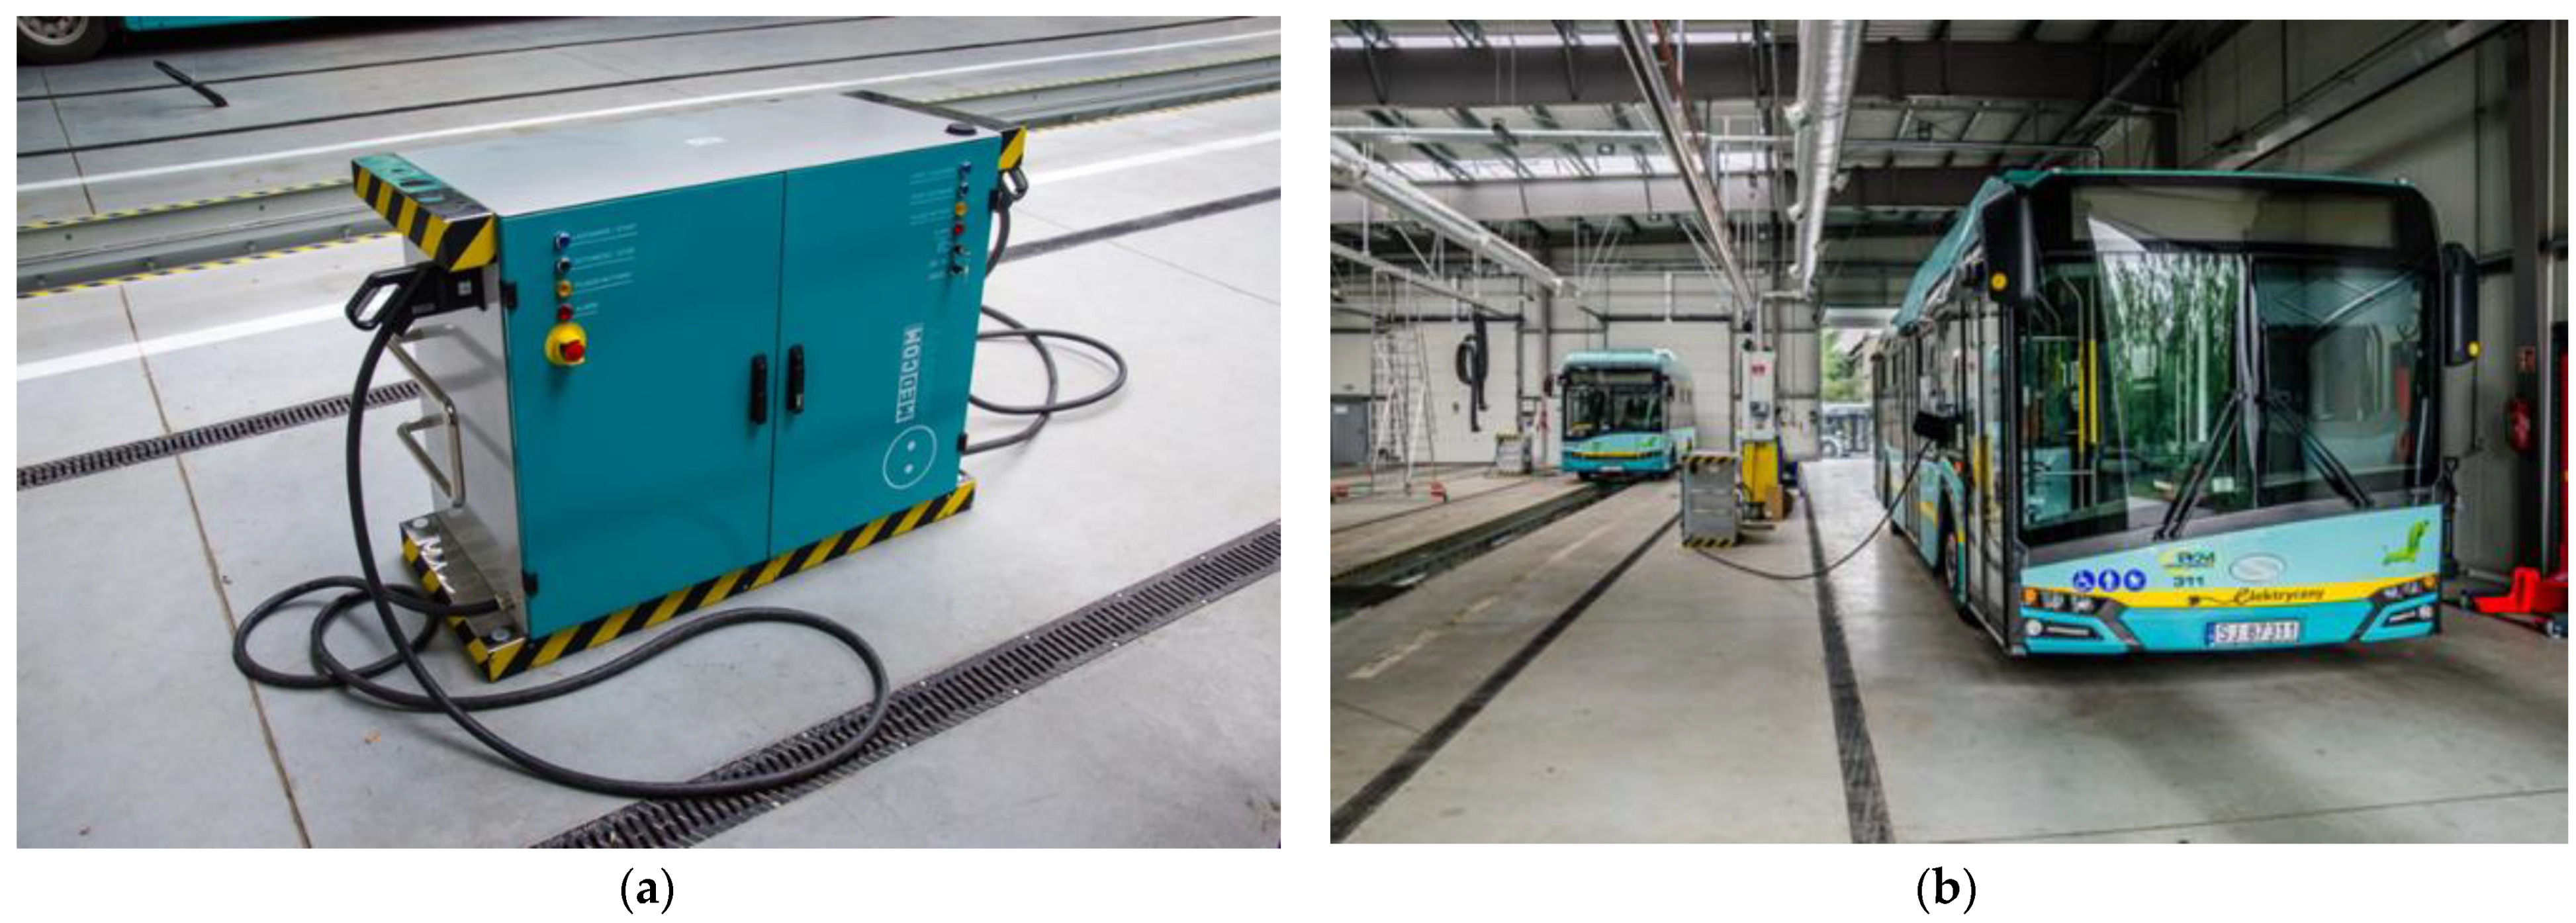
In the PKM depot charging station, there are 20 plug-in charging stations. These chargers are supplied from the utility supply with AC voltage 3-phase 400 V, 50 Hz. The power is converted into DC with a charging voltage range of 500–800 V (see
Figure 9). Each charger has two output ports. The effective charging power is 120 kW if the charger is used to charge one e-bus, or 60 kW if the charger used to charge two e-buses simultaneously. The charging interface is the Phoenix Contact plug-in, CCS Type 2, Mode 4, according to the IEC62196 standard. The depot charger characteristics are listed in
Table 4.
2.4.2. Pantograph Opportunity Charger
In opportunity charging, the vehicle is connected to the high voltage charging equipment with the help of an ACD, typically a pantograph. When the vehicle reaches the charging location, the ACD starts the charging setup. The communication between the vehicle and the charging equipment is set by means of power line communication (PLC) or Wi-Fi, depending on the type of ACD. The energy transfer is done in few minutes with the help of control devices and electronics that are gathered in a heavy-duty cabinet placed in suitable housing. Underground cabling connects it to the pylon where the charging contact device (ACD) is mounted.
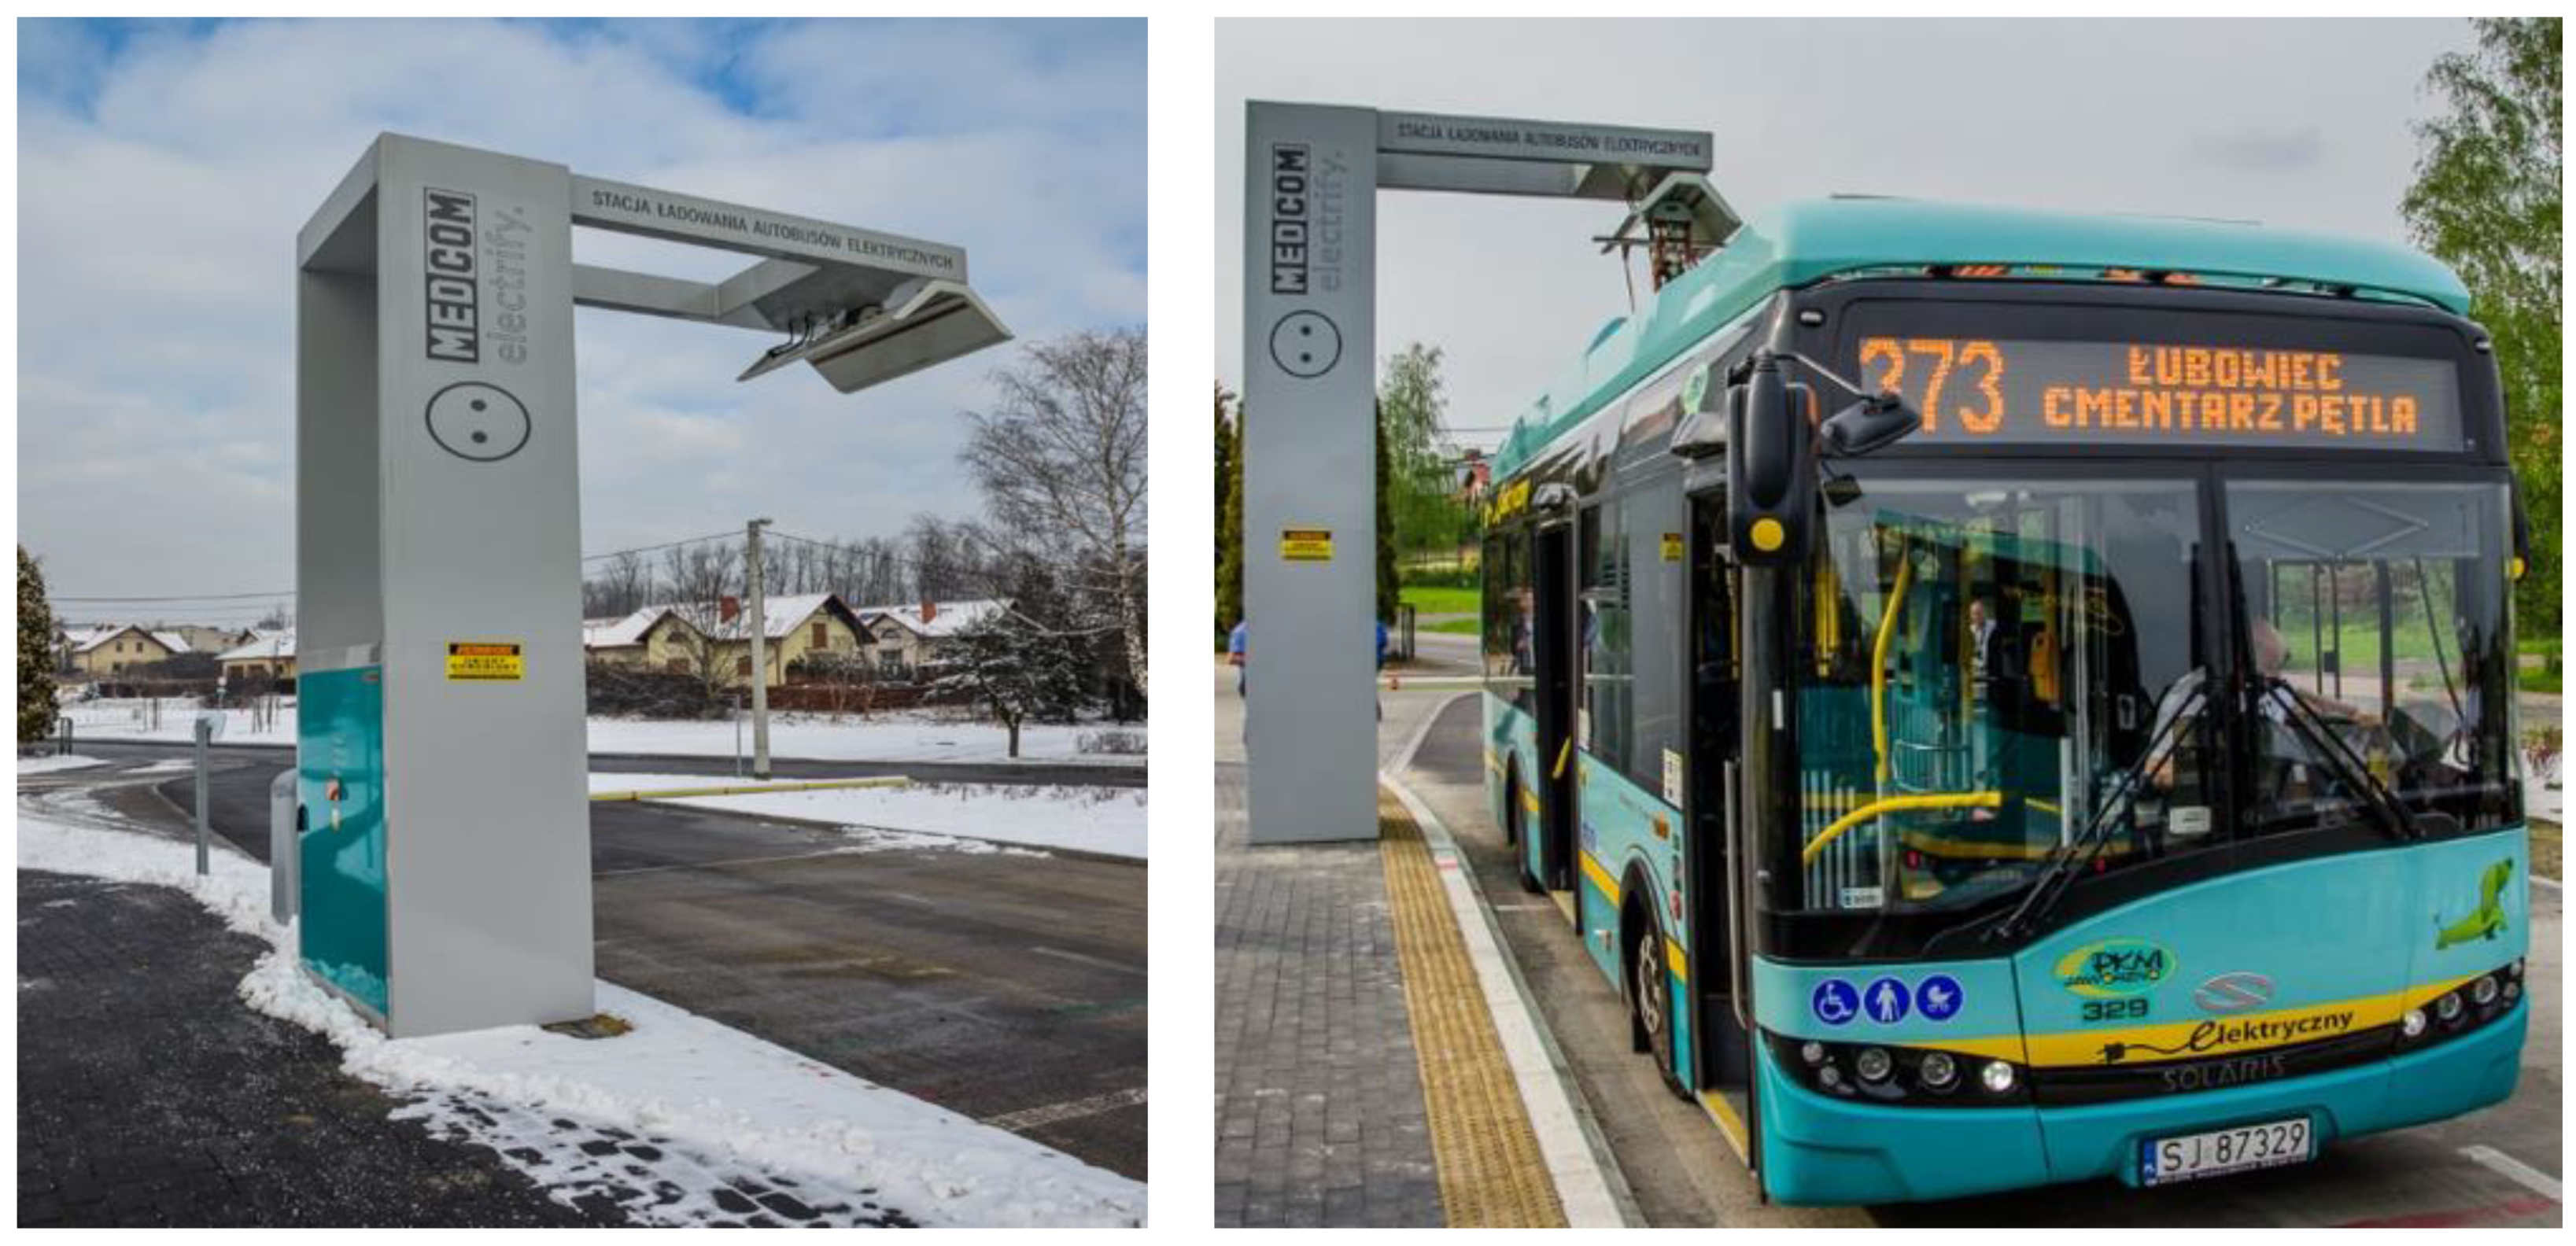
In Jaworzno, there are 12 pantograph fast-charging solutions with Type B technology dispersed along the e-bus routes in such a way that the e-buses can reach their destination conveniently.
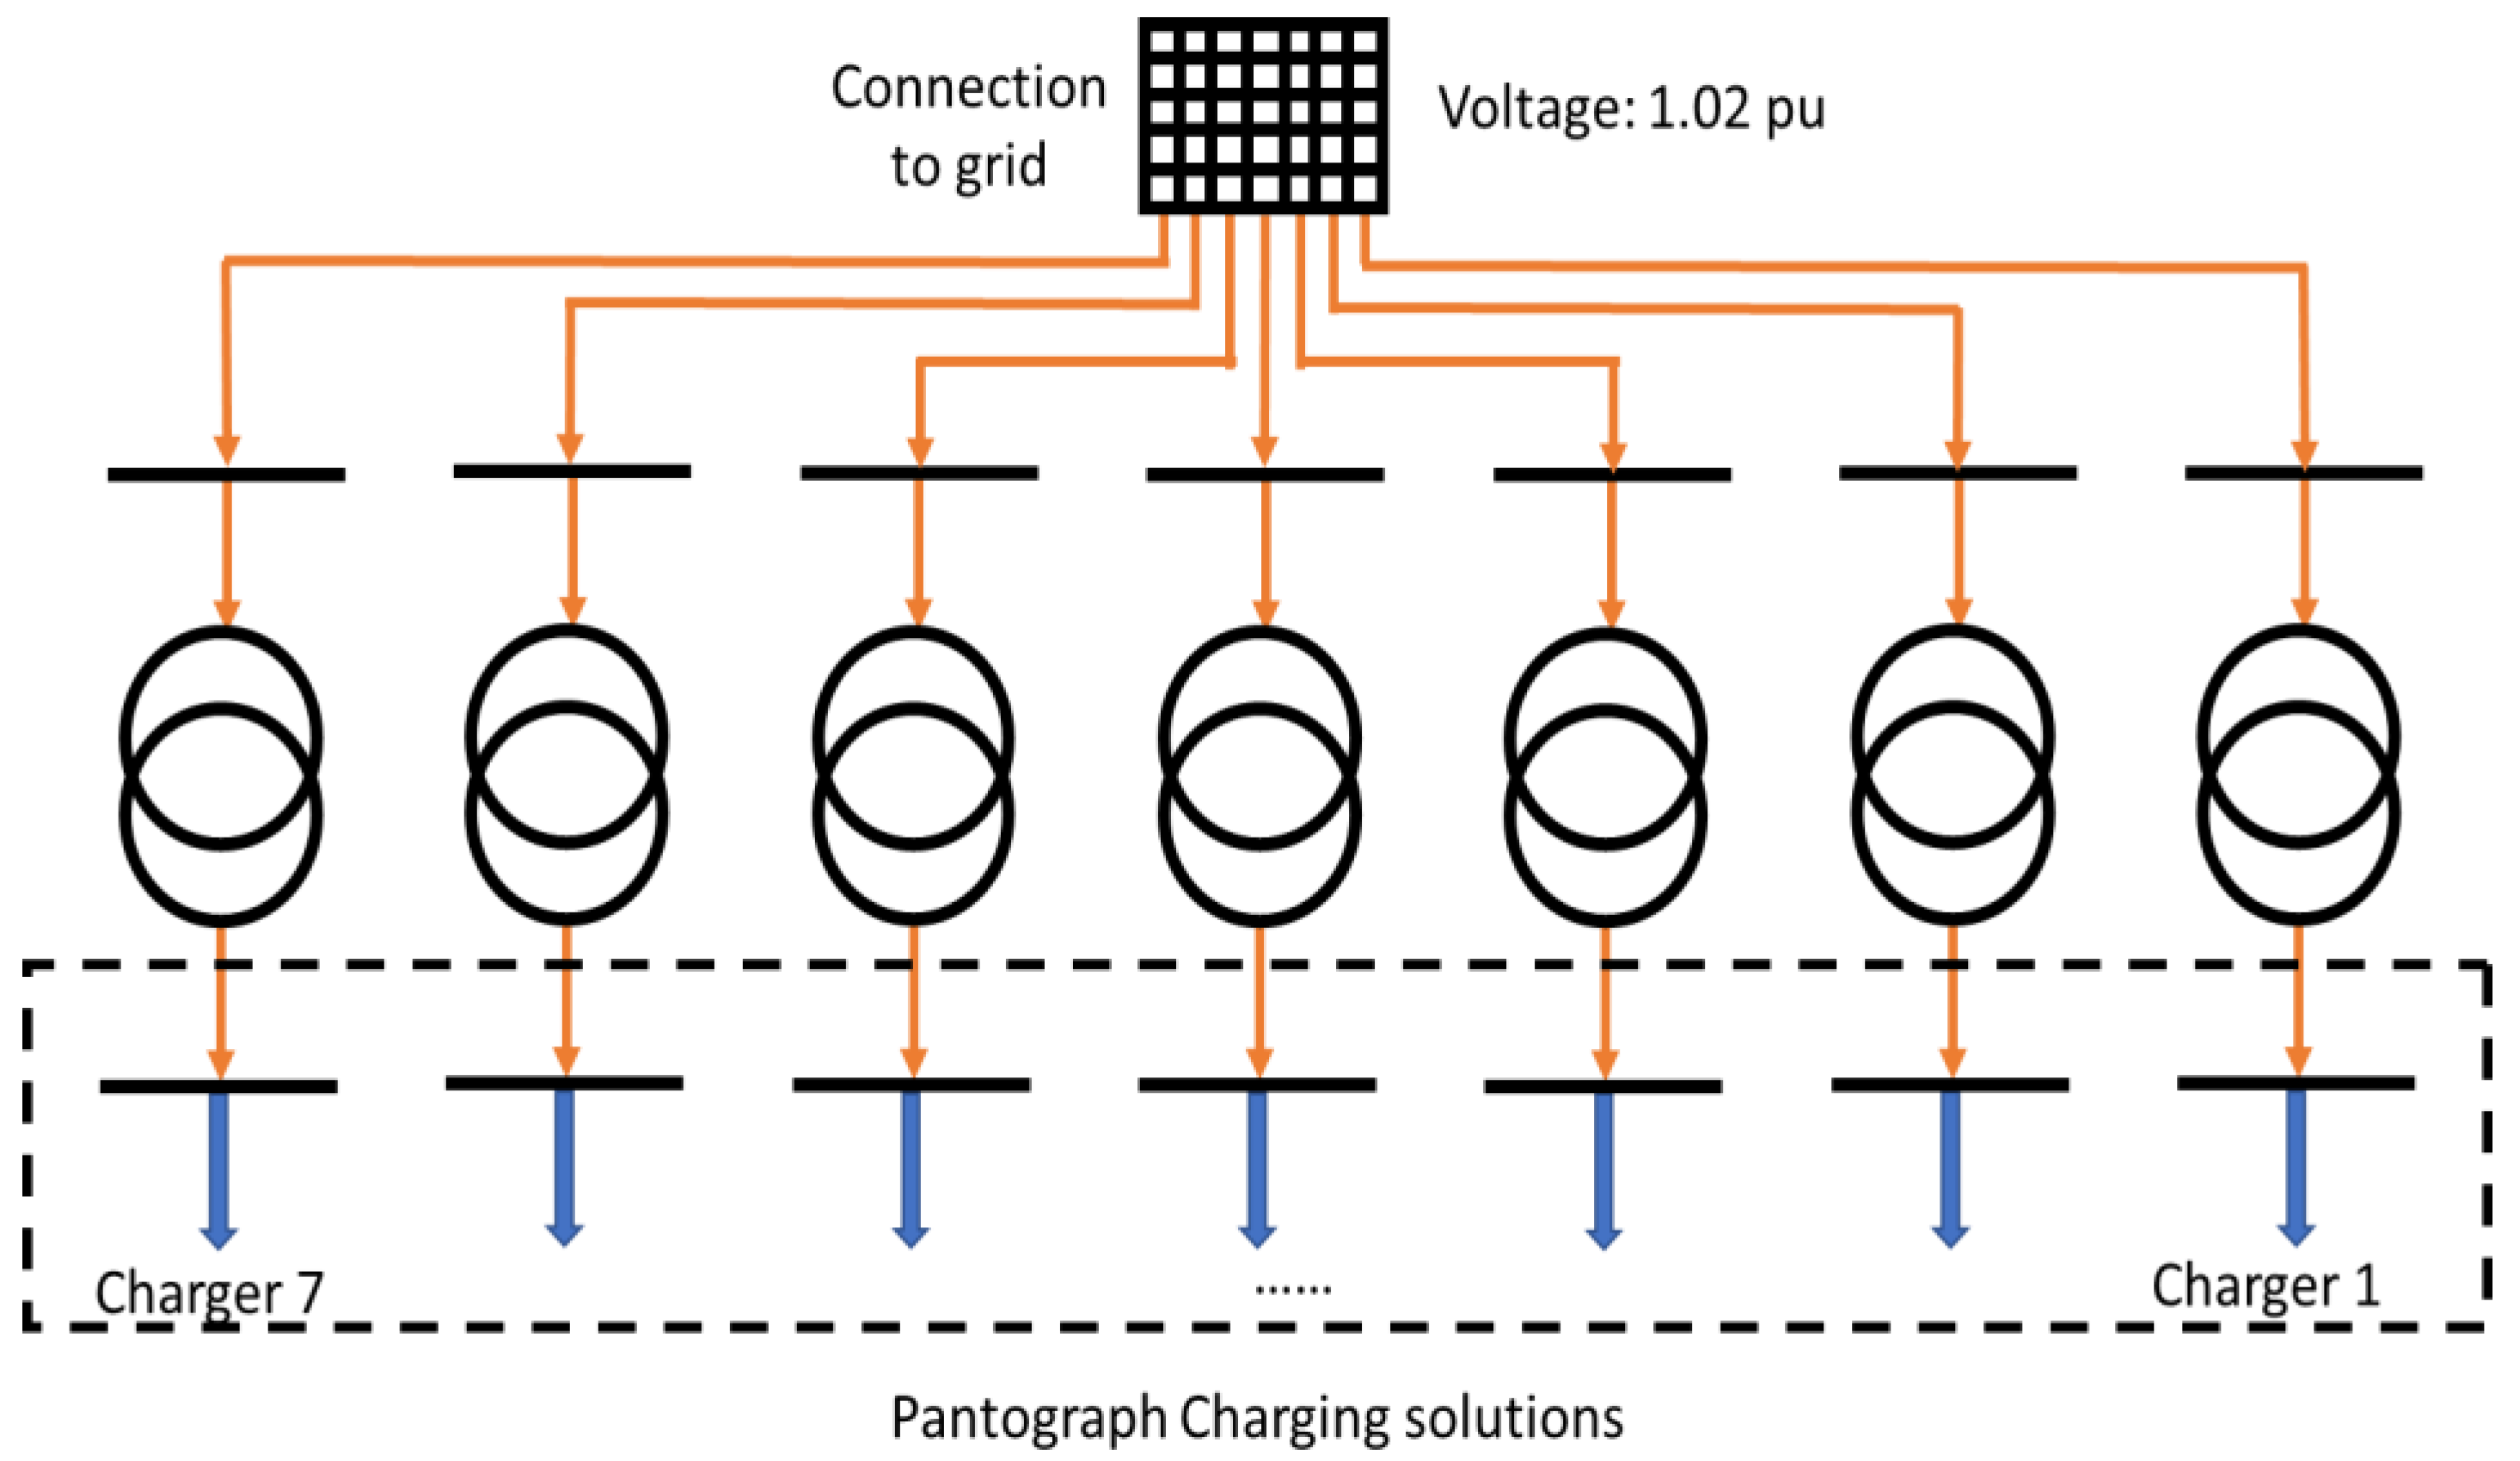
The pantograph chargers are connected to the AC utility supply of voltage 3-phase 400 V, 50 Hz with a connection power of 320 kVA and effective charging power of 300 kW. The charging platform was supplied by Schunk (see
Figure 10). The pantograph charger characteristics are listed in
Table 5.
3. e-Bus Fleet Impact on the Power Grid
EV integration has increased enormously in the past few years. Generally, EVs’ impact on the grid depends on the grid infrastructure. In some grids, a 20% EV penetration has no impact on the DSO networks. On the other hand, some grids tolerate no more than 10% uncoordinated load charging, which could reach 40% in the case of coordinated charging [
1,
11]. In reality, it appears that every DSO grid is a special case requiring an autonomous study to explore the issues and limits of EV charging load [
11]. In some countries like the Netherlands, EV integration reaches the limit in most of the DSO connection points [
12,
13,
14]. In the ASSURED project, among several demos, there are more than 43 HD e-buses integrated in the Eindhoven demo, which will be upscaled to 200 HD e-buses [
9]. Smart charging, besides RES, is a promising solution to address the congestion in the DSO grid and maintain the reliability and security of supply with some financial benefits, which could be a motivation to adopt this technology. In [
15], a demo in the Netherlands focused on the impact of EVs on the electricity network and the possibility to use RES as much as possible while keeping the energy grid in balance.
In this work, the single-phase subsystem was simulated based on the pandapower library in Python software to examine various factors that affect the charging infrastructure on the system capacity and the ability to host the EVs’ loads. The e-buses were simulated as variable loads based on SoC. The findings of this use case study, as reported in this paper, can be used as signals to forewarn utilities on asset management, system planning, and boundaries of acceptable operation [
11].
In order to show the impact of conventional normal charging and fast charging on the DSO grid, a small spot (terminal e-bus stop) that includes both charging solutions (see
Figure 11) was modeled and simulated. This spot area had 20 plug-in charging solutions and 7 pantograph charging stations with a distance between them of less than 350 m.
In this study, multiple scenarios were modeled and evaluated. These scenarios were separated into two main categories: uncoordinated charging (standard charging) evaluation and coordinated charging (smart charging) evaluation. For the large-scale evaluation, the grid was evaluated for different charging scenarios. The load profiles of the e-buses were based on real data measurements.
Since both charging solutions operate with a minimum power factor of 0.9, the reactive power was assumed in a simulation of 10% of the active power. The active power varied between 70 and 130 kW for the plug-in charging solution, and for OppCharge, the active power varied between 200 and 320 kW. Accordingly, the reactive power varied between 7 and 13 kVAR for plug-in charging, and for OppCharge, the power change varied between 20 and 32 kVAR.
Two scenarios were investigated here. Scenario 1 was based on uncoordinated charging, which includes depot and pantograph charging solutions, and Scenario 2 included coordinated charging based on the depot charging solution. Depot charging happens when the e-buses parked for several hours, usually at night. Pantograph charging usually happens when the e-buses are stopped for short time, 5–7 min for passenger collection or a bit longer according to their working schedule.
3.1. Uncoordinated Charging (Standard Charging)
Uncoordinated charging is where e-buses connect to the charger to be charged with the maximum allowed power by the connector/charger until fully charged (100% SoC) without taking into account the number of e-buses that are connected simultaneously to the chargers and their impact on the grid infrastructure. In the case of a high number of e-buses connected to be charged simultaneously, there would be a high impact on the grid in terms of the voltages on the bus bars, DSO transformer load profile, and line rating. In addition, uncoordinated charging has an impact on the operational cost of the e-buses since the energy price in peak loads is higher than the price in off-peak hours according to the DSO grid load profile. Furthermore, as a high peak achieved, the distribution capacity price increases accordingly, as mentioned in Equation (1).
3.1.1. Depot Charging Scenario
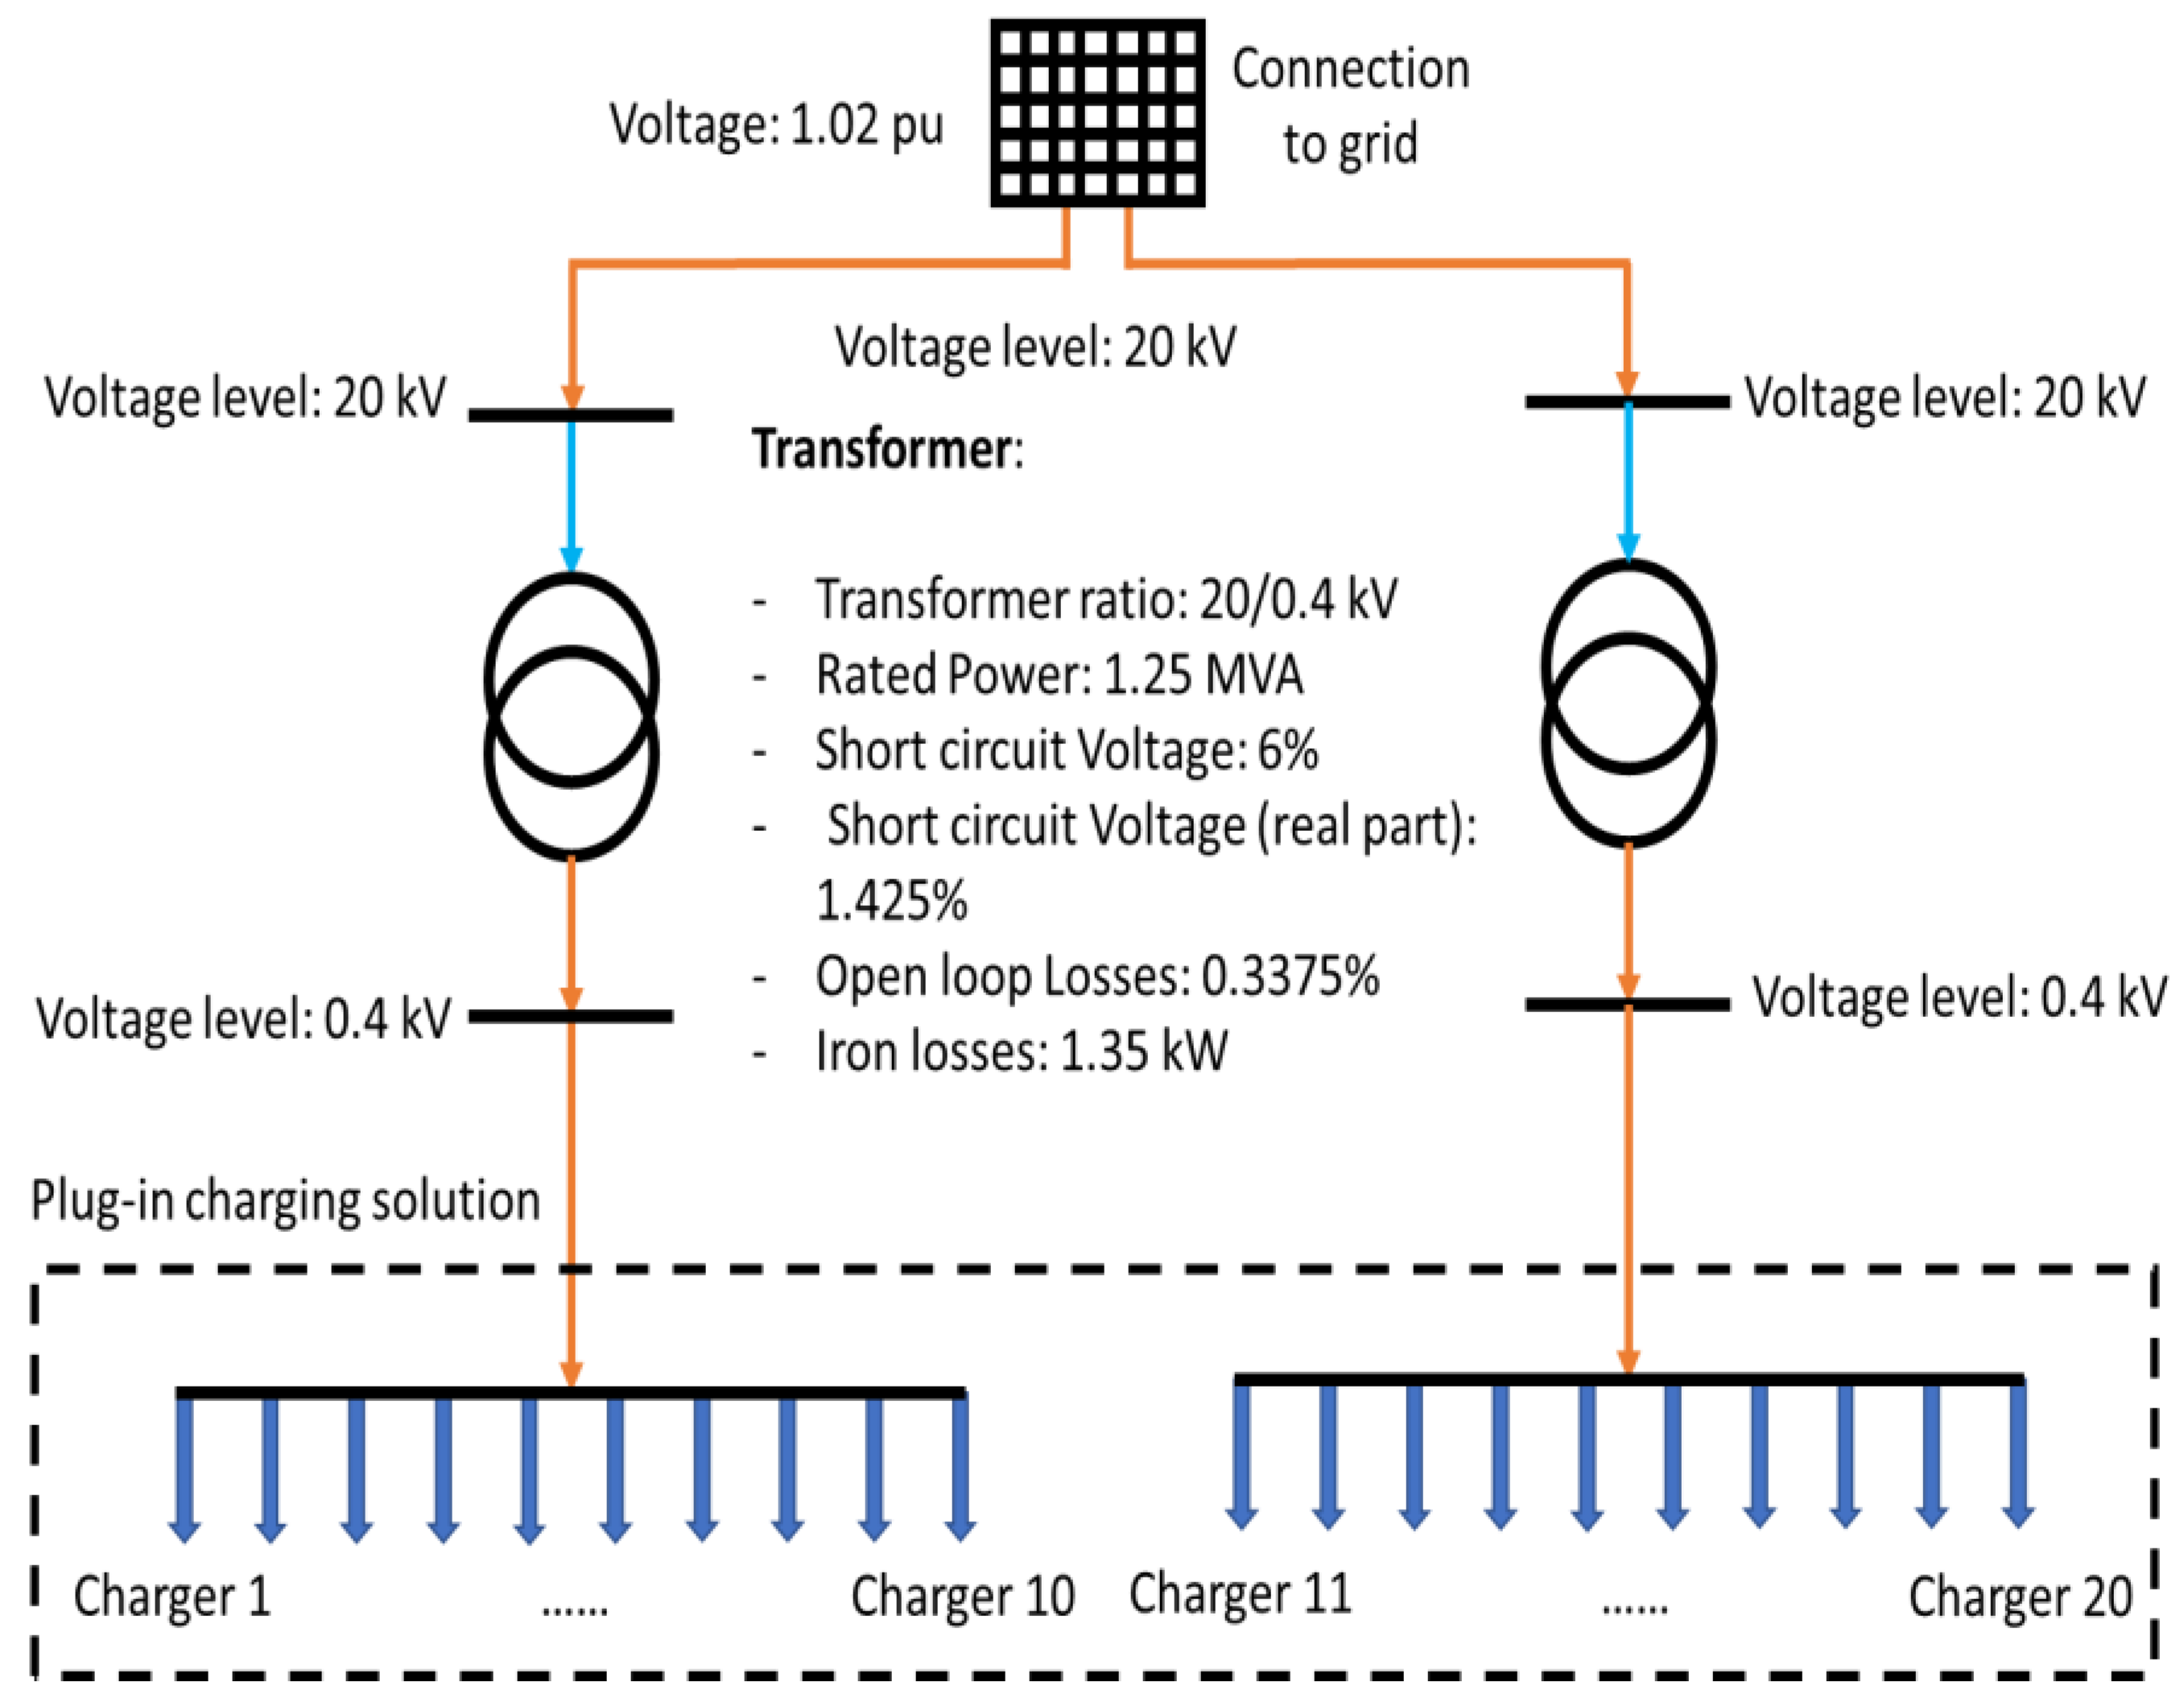
In the depot of the e-bus fleet, there are 20 plug-in chargers. These chargers are connected to the grid in the way described in
Figure 12. The blue lines in
Figure 12 were modelled as power transmission lines “NAYY 4 × 50 SE.” The transformer parameters are also shown in the figure.
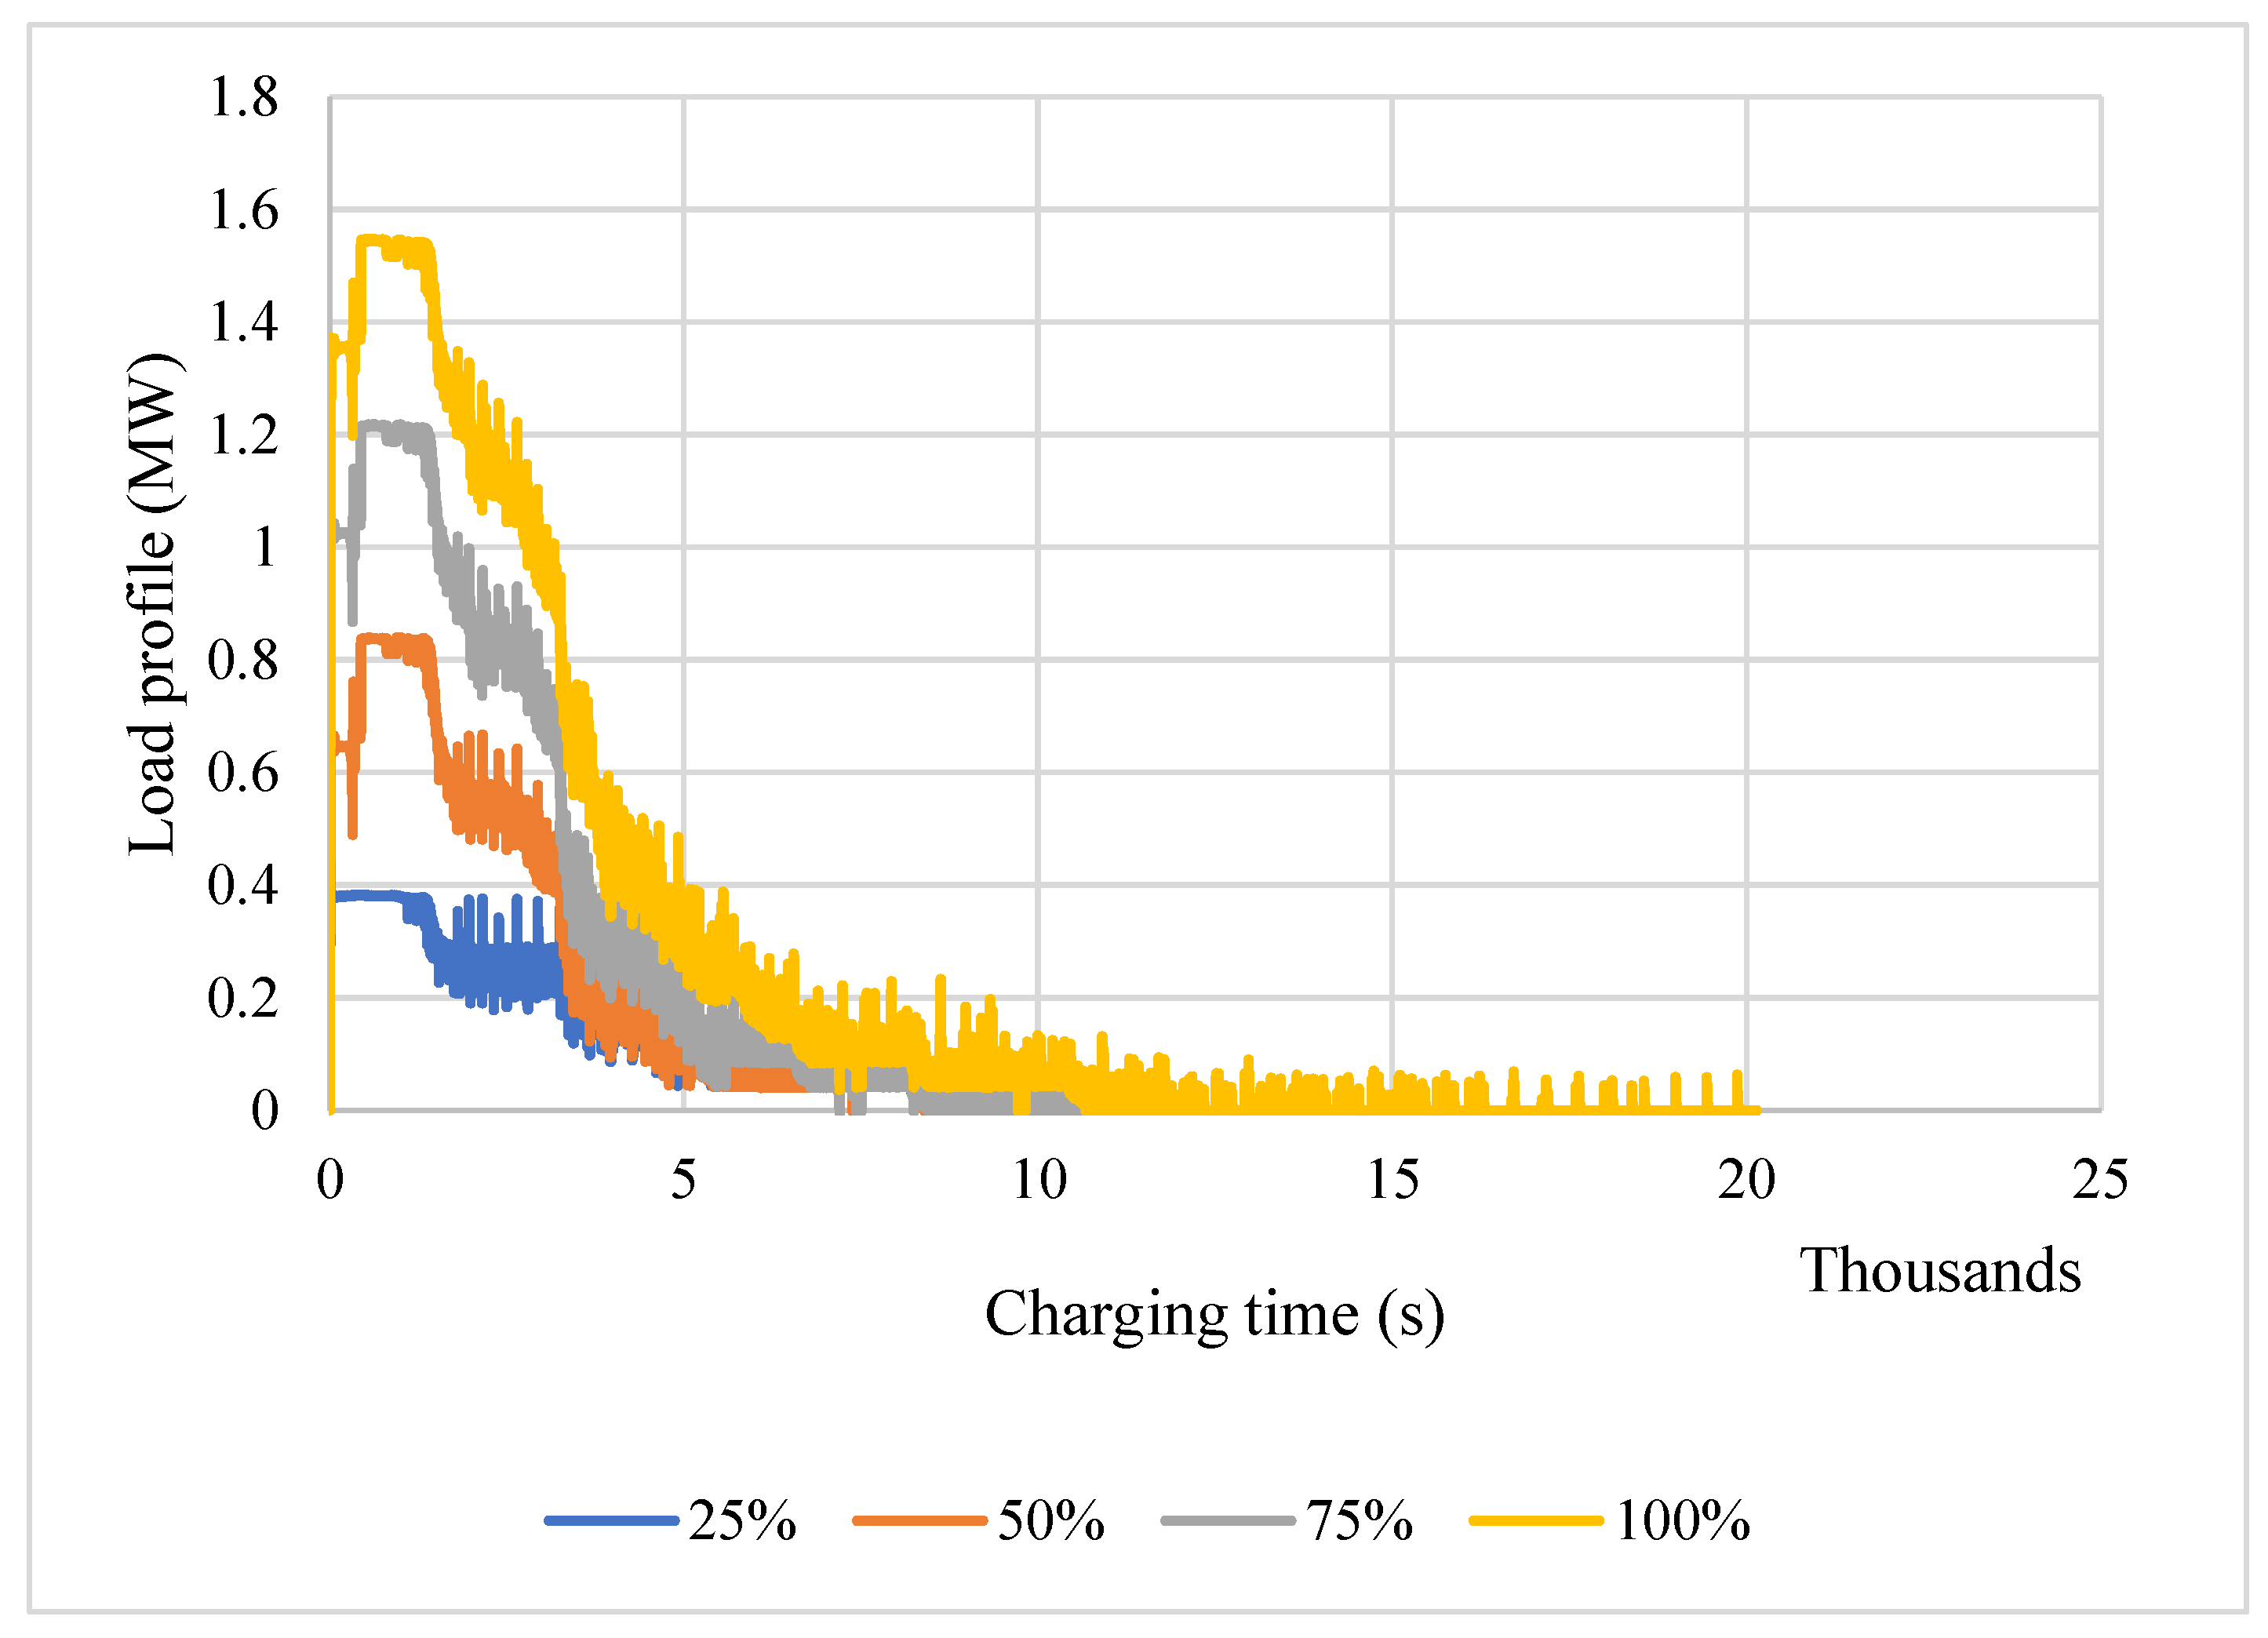
In this scenario, four integration charging profiles were considered, which were 25%, 50%, 75%, and 100% of the e-buses, which corresponds to 5, 10, 15, and 20 EV chargers, respectively. The simulation aimed to reveal the impact on the DSO grid. The impacts include the bus bar voltage variation, and transformer load profile.
The real data of the load profile were simulated for various integration rates of e-buses to investigate the impact of the e-bus integration in the DSO grid. The load data are shown in
Figure 13. This figure also shows the impact of the e-buses on the transformer and transmission loading profiles, where the transformer loading profile and line ratings increase at the same rate as the e-bus load profile. Besides the residential loads, the load of the transformer could reach its critical limits. For the transmission lines, the single contingency (N-1) could be lost.
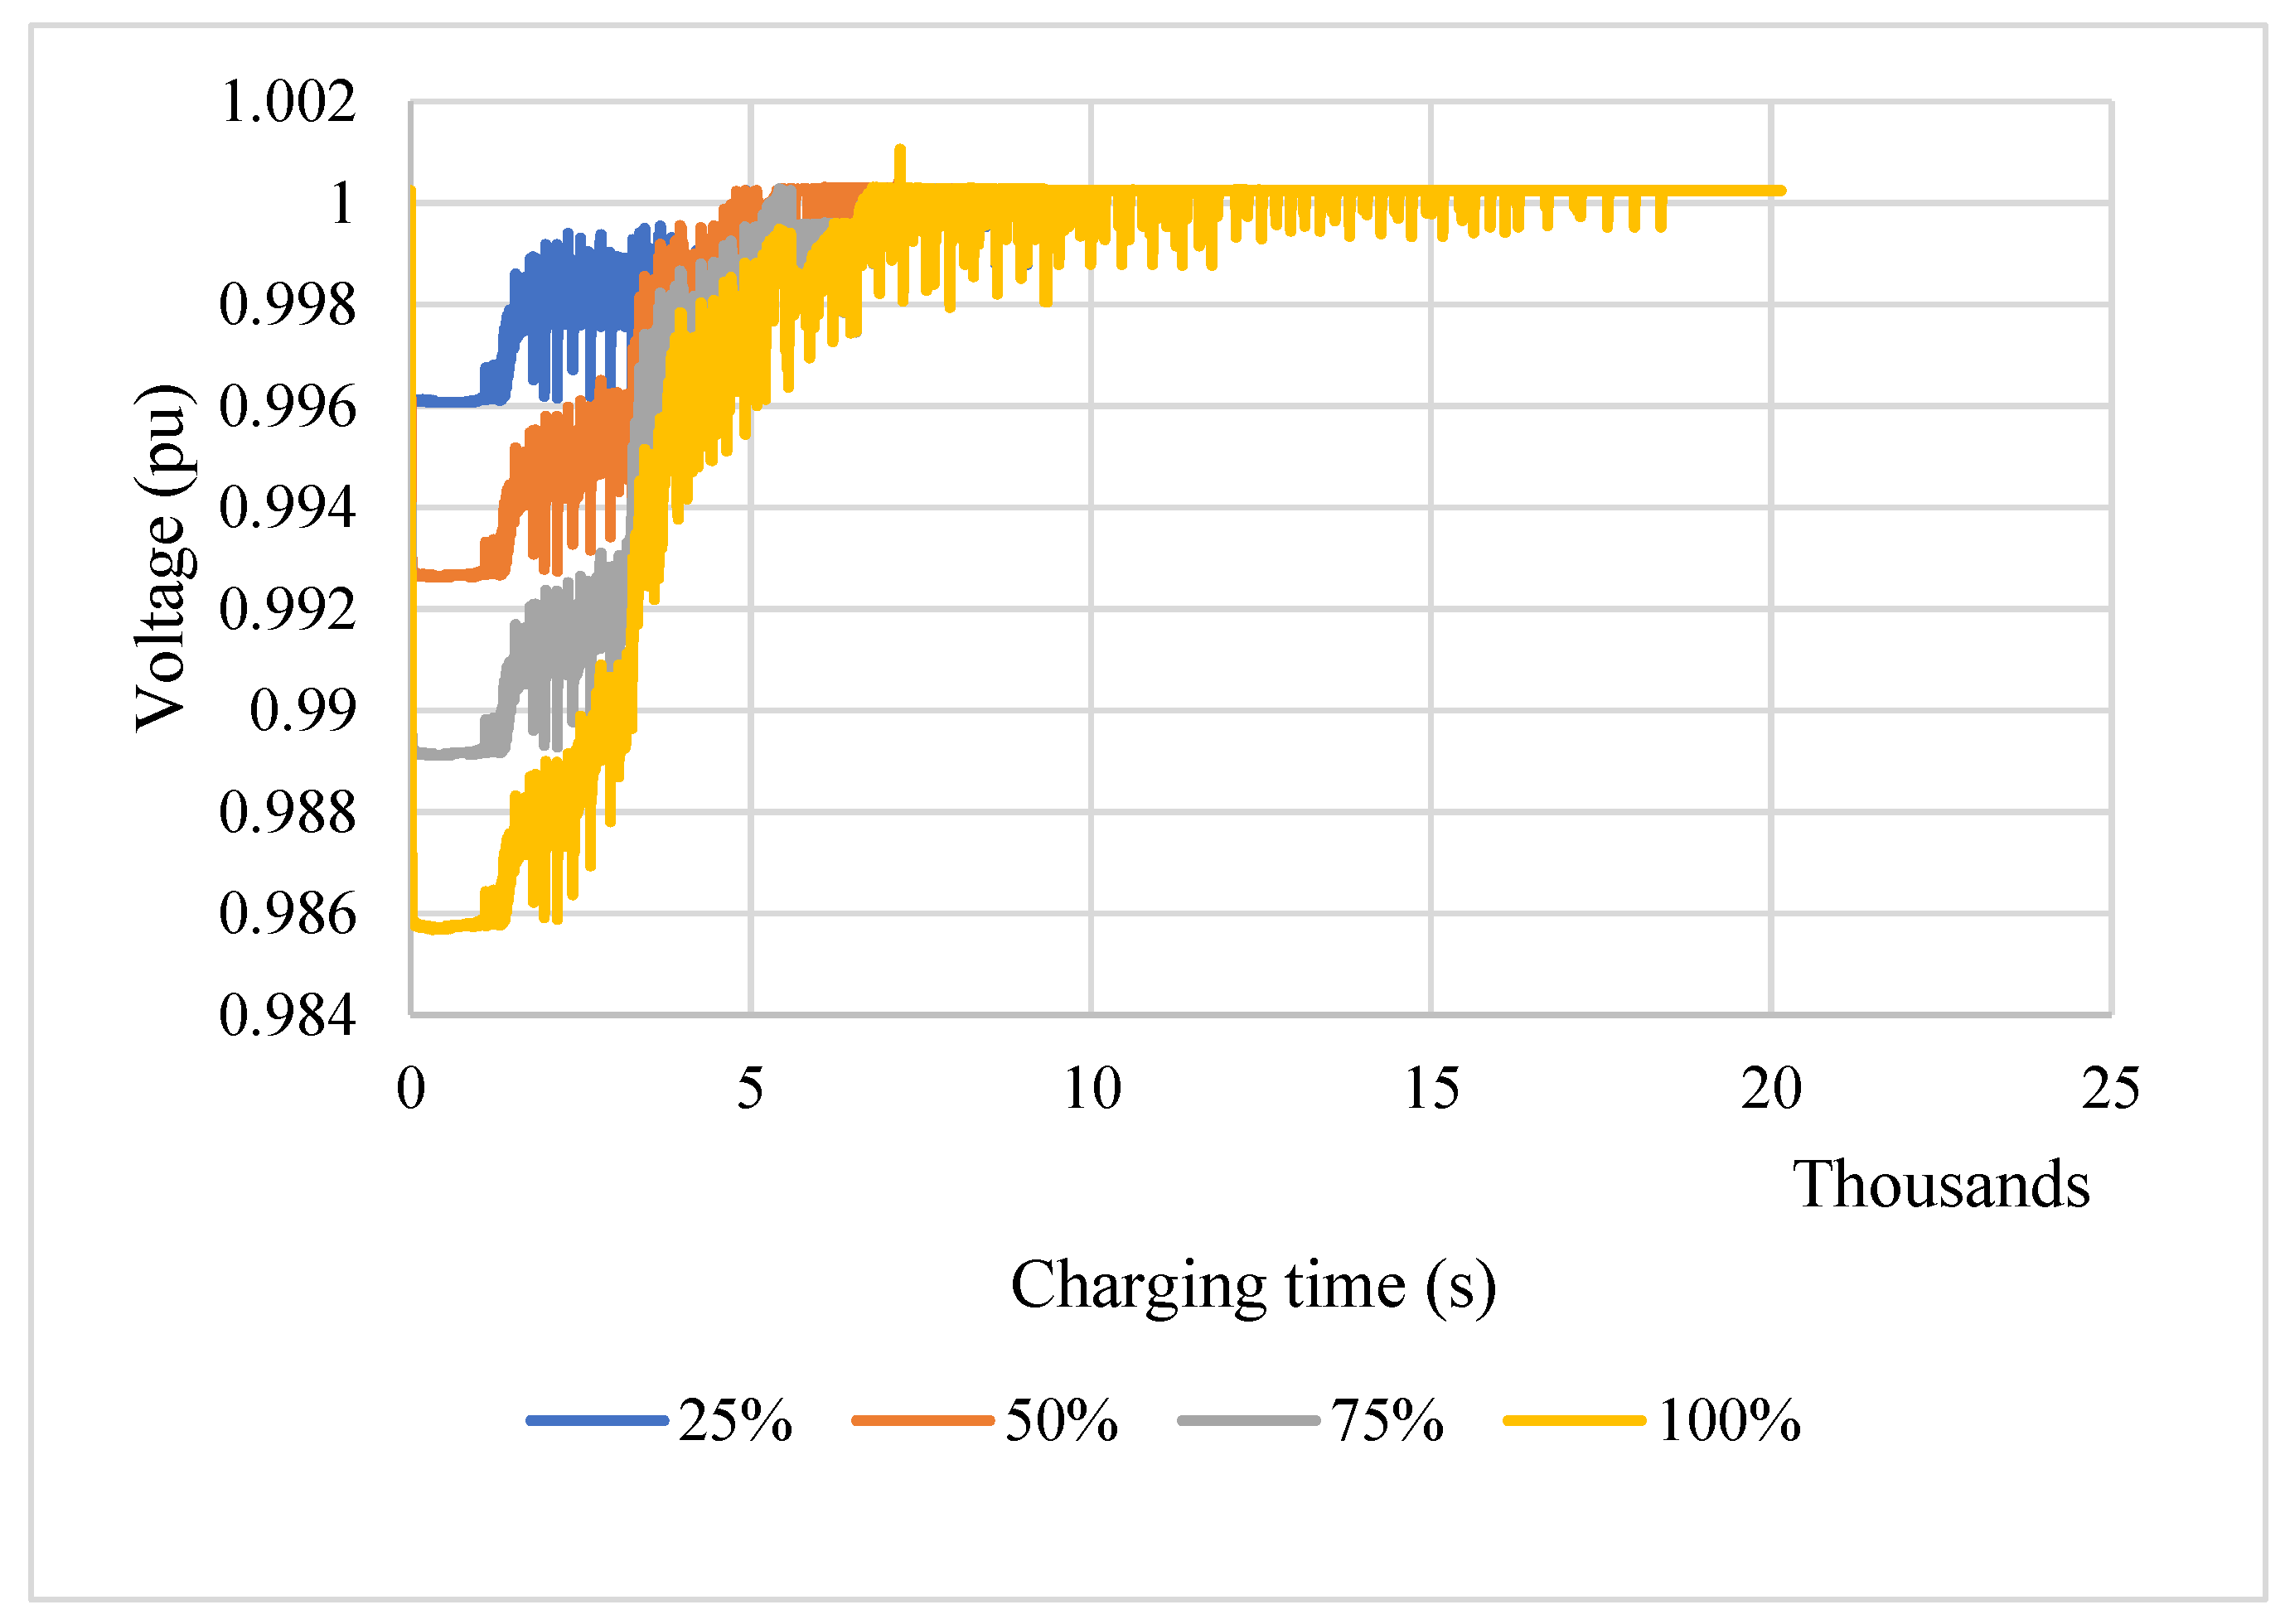
The e-buses’ impact on the bus bars voltage profile is shown in
Figure 14, and as can be seen, as the e-bus integration increases, the voltage of the bus bars declines, although the chargers are equipped with power factor compensation to limit the reactive power to a maximum of 10% of the active power. As can be seen, since the charging is uncoordinated, where the e-buses connect to the grid without taking into consideration the other factors, the voltage drop at the beginning is high, and then gradually decreases back to its normal value when all e-buses finish their charging.
3.1.2. OppCharge Scenario
There are 12 pantograph charging solutions dispersed in Jaworzno for e-bus fast charging. As can be seen in
Figure 11, 7 out of 12 are in the same spot. These 7 chargers are connected to the same DSO transformer. These charging solutions were modeled (
Figure 15) and simulated to investigate the impact of the fast-charging solution on the grid.
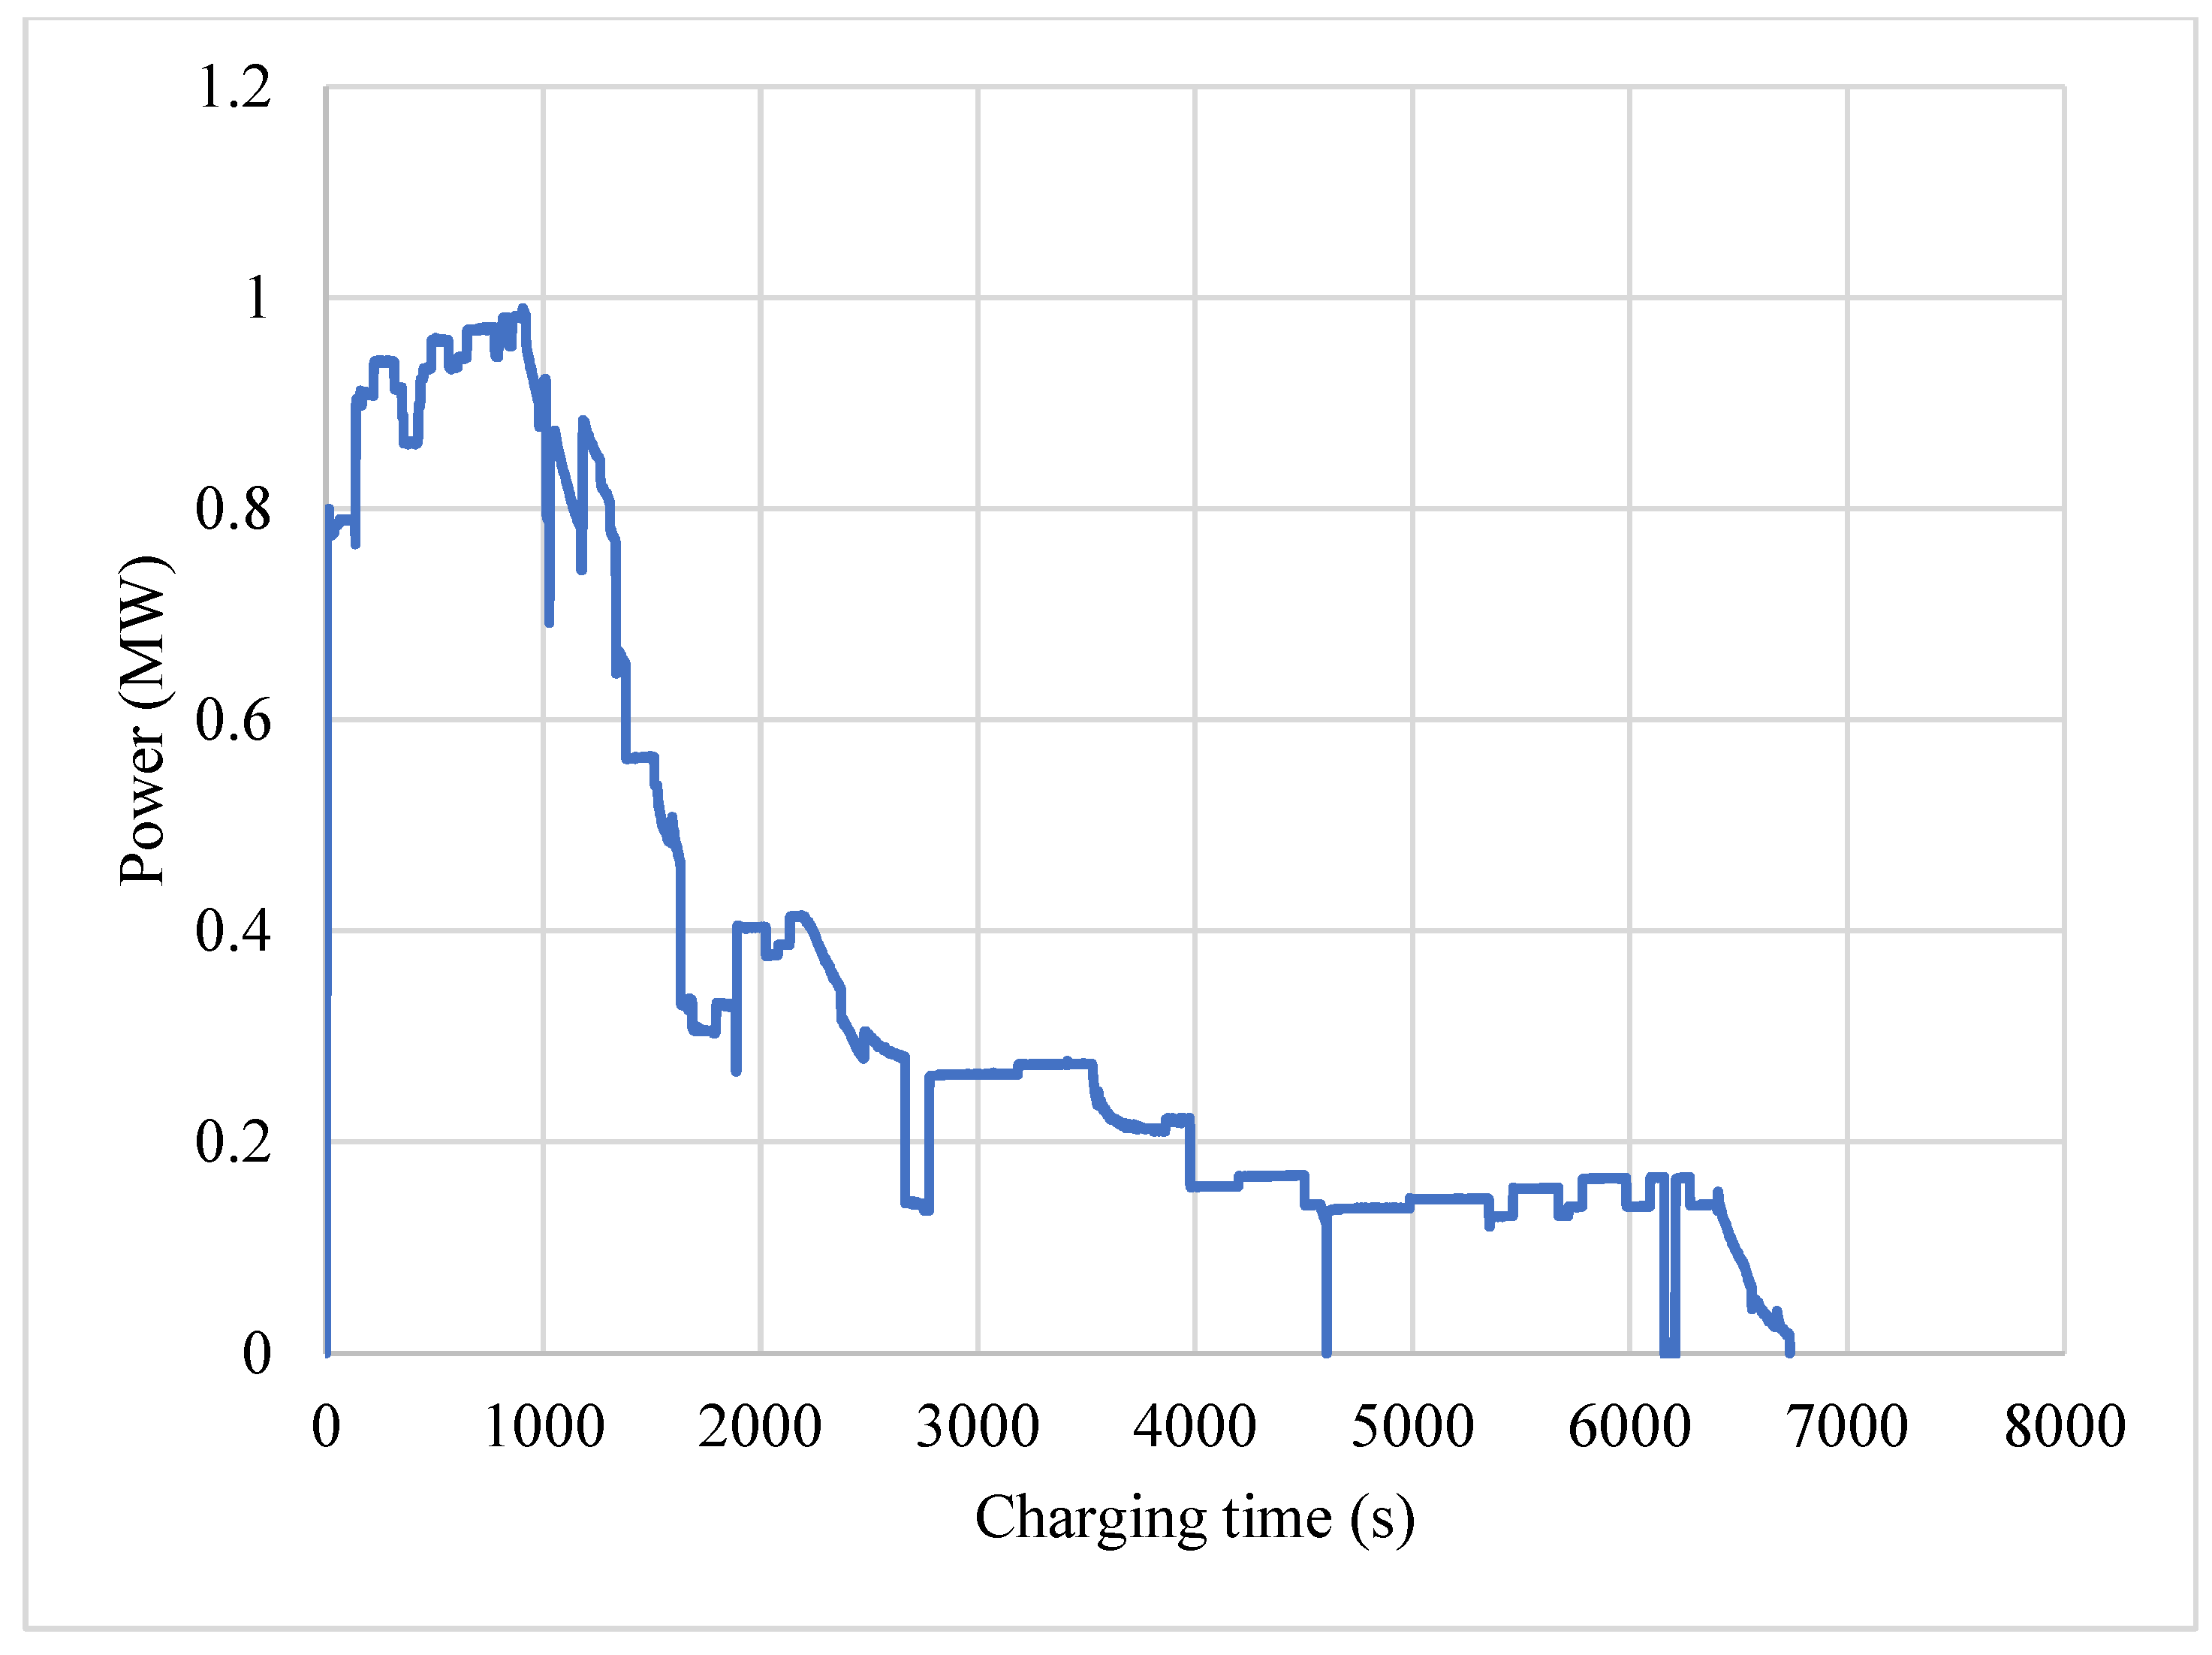
The real data of 7 e-bus charging loading profiles (see
Figure 16) were simulated to study the impact of a fast-charging solution for e-bus fleet integration on the DSO power grid. This figure also shows the impact of the e-buses on the transformer and transmission line loading profiles.
Comparing
Figure 16 to
Figure 13 for plug-in charging solutions, only 7 pantograph fast-charging solutions could have an impact on the grid, almost the same as 15 plug-in charging solutions (75% e-bus integration). That means that the single pantograph charging solution has an impact on the grid equivalent to almost two plug-in charging solutions. As can be observed from
Figure 16, when all vehicles are connected to the grid simultaneously, the loading on the DSO transformers and transmission lines is high and would have an impact on the grid infrastructure, and possibly the reliability of the supply as well. The impact on the grid decreases slightly as some vehicles finish their charging before others mainly due to differences in battery SoC.
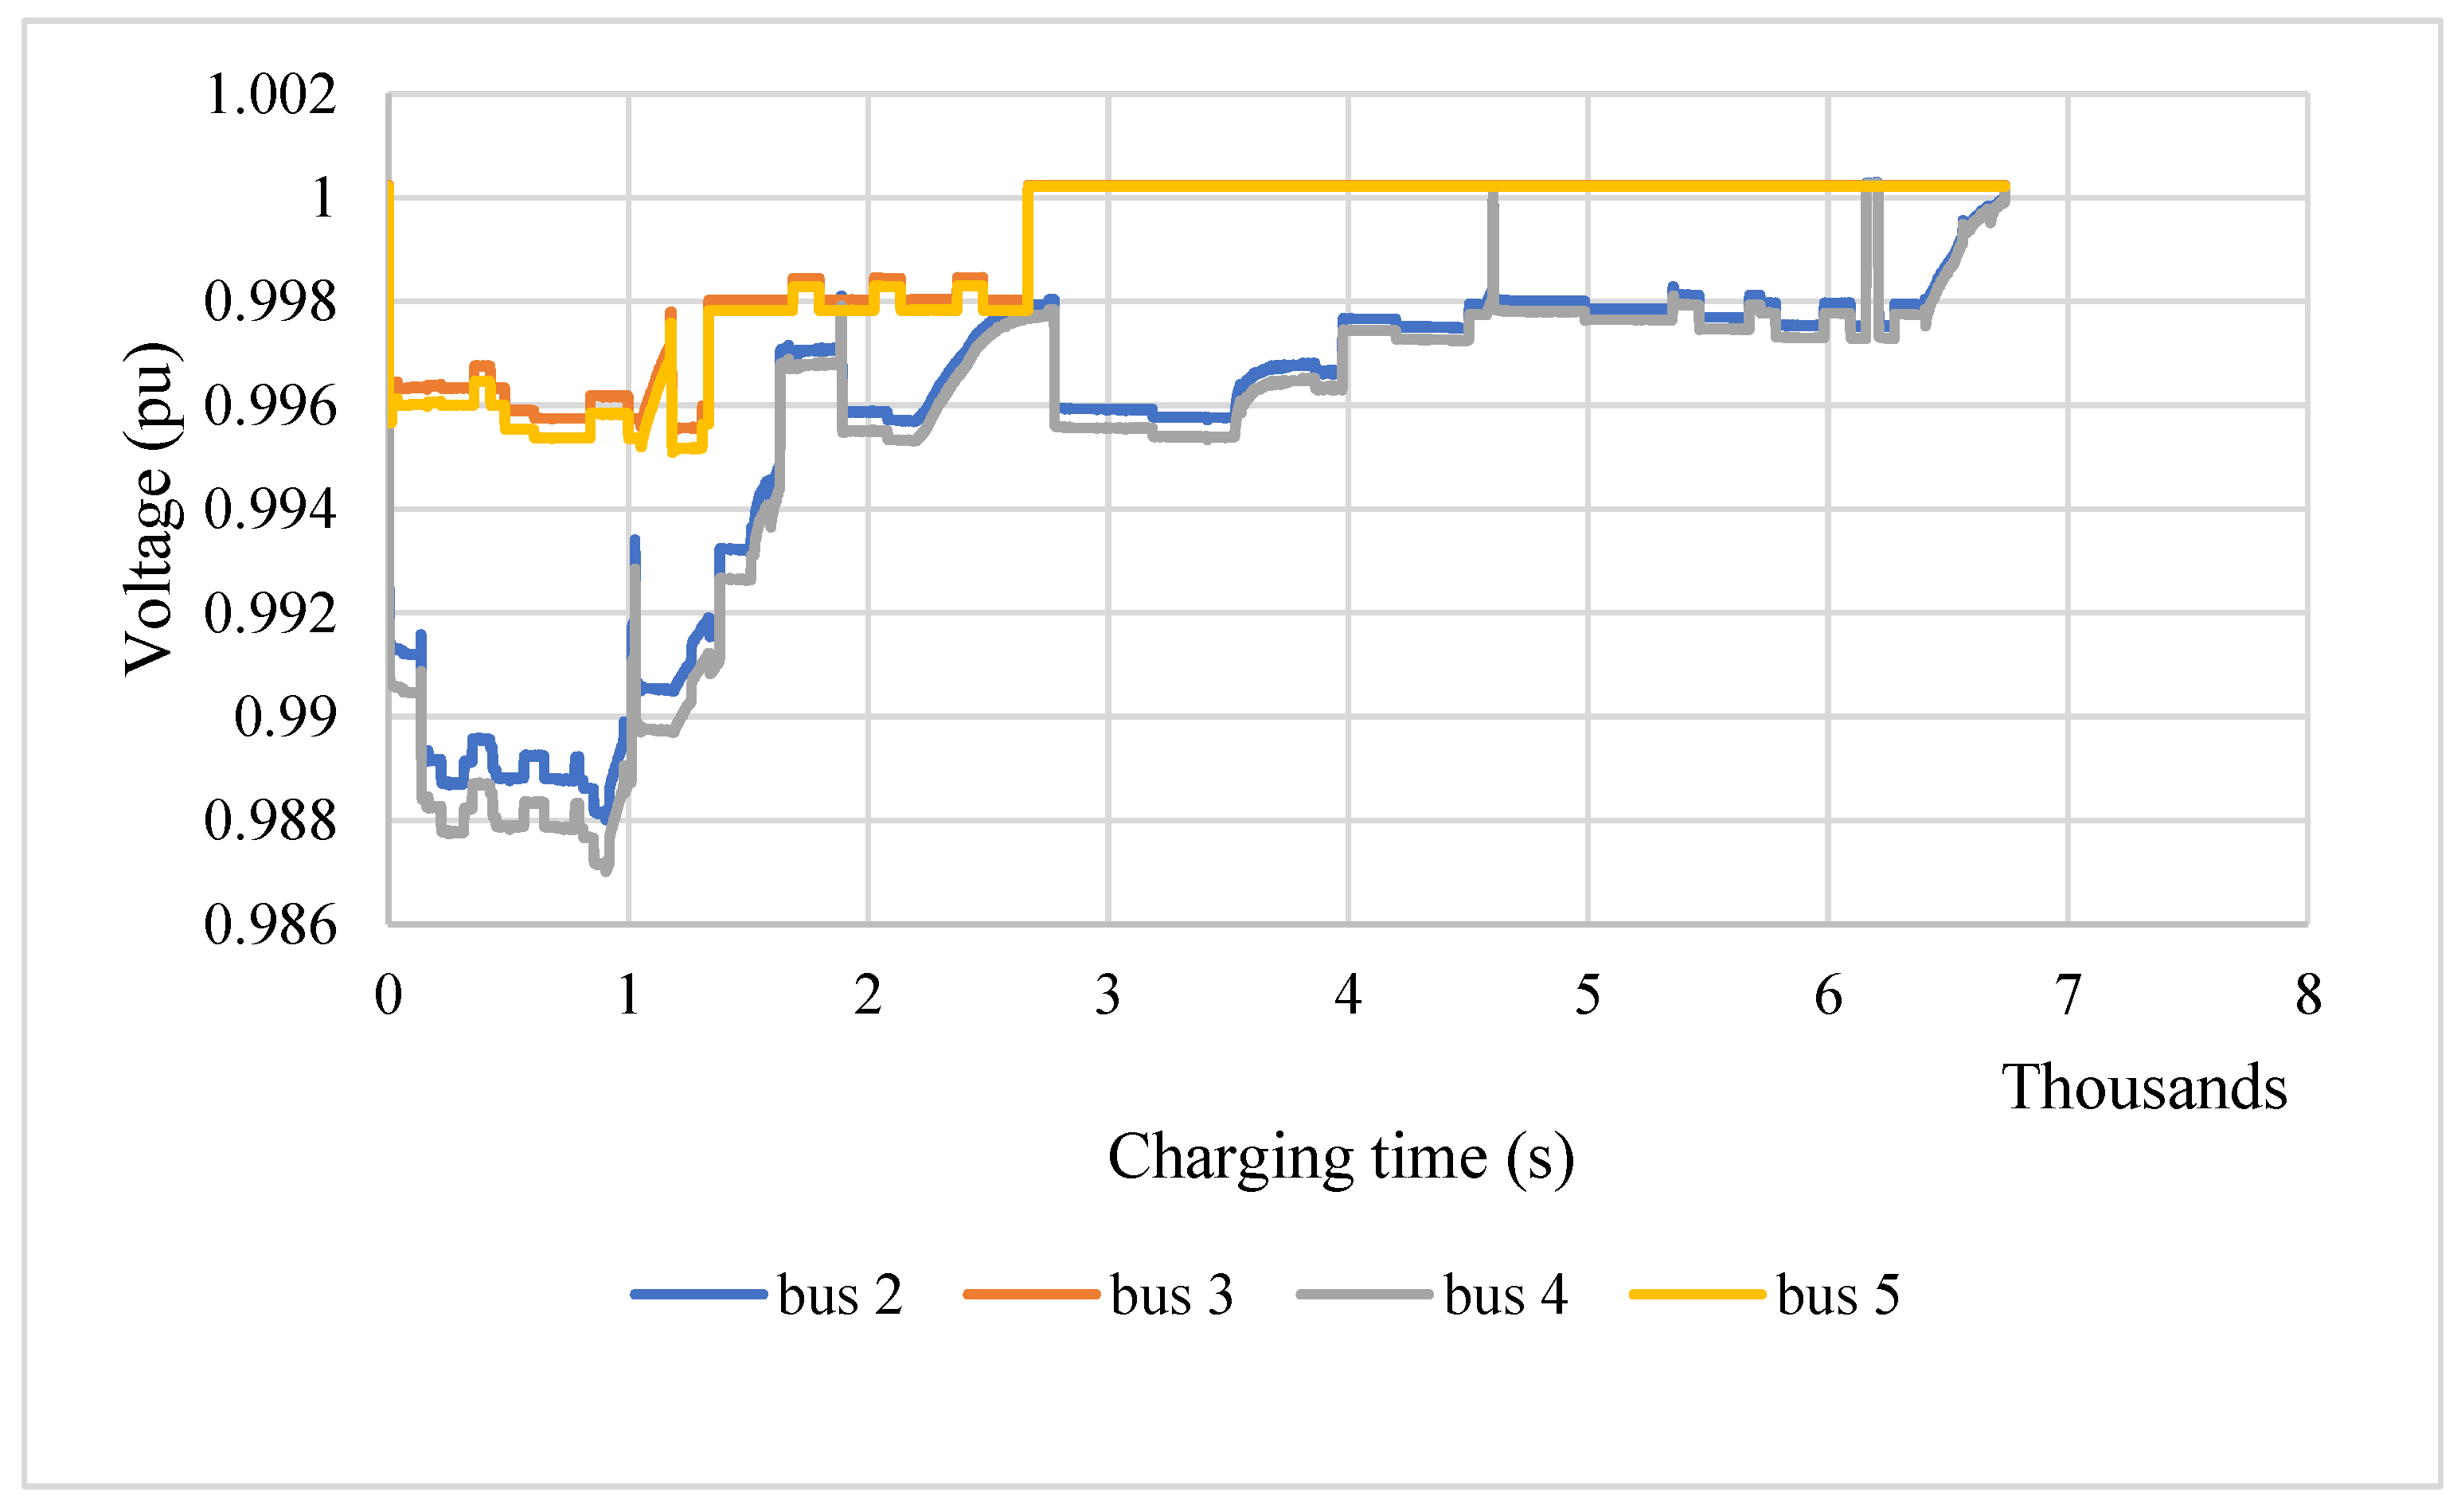
The impact of e-bus fleet integration on the bus bar voltage profiles was studied (see
Figure 17). The voltage profiles for some bus bars are presented. The results show that the impact on the bus bar voltage profile for 7 pantograph charging solutions is quite similar to the 15 plug-in charger solutions (75% integration). As can be seen in
Figure 17, e-buses that consume less power from the chargers have less impact on the bus bar voltage profile than the e-buses that consume more power.
3.2. Coordinated Charging (Smart Charging)
Smart charging of e-buses could be done based on load shaving, which mainly depends on the shift of e-bus charging in order to minimize its impact on the DSO grid. This could easily be done based on the e-bus fleet management system and the eSConnect device, which is installed in the e-buses. Based on the data collected by this device, we could know the number of e-buses connected simultaneously to the chargers, the driving patterns, and the current SoC of the e-buses to estimate the needed charging time and power, and then manage the power level and number of e-buses connected to the grid in order to minimize their impacts.
The aim of smart charging is to flatten the load profile. This practice offers direct and indirect benefits to the DSO utilities in generation of costs, line and transformer loss reduction, and voltage support. Form the EV owners’ perspective, it could increase revenue by providing ancillary services to the grid, optimizing the consumption, minimizing the electricity bill, etc.
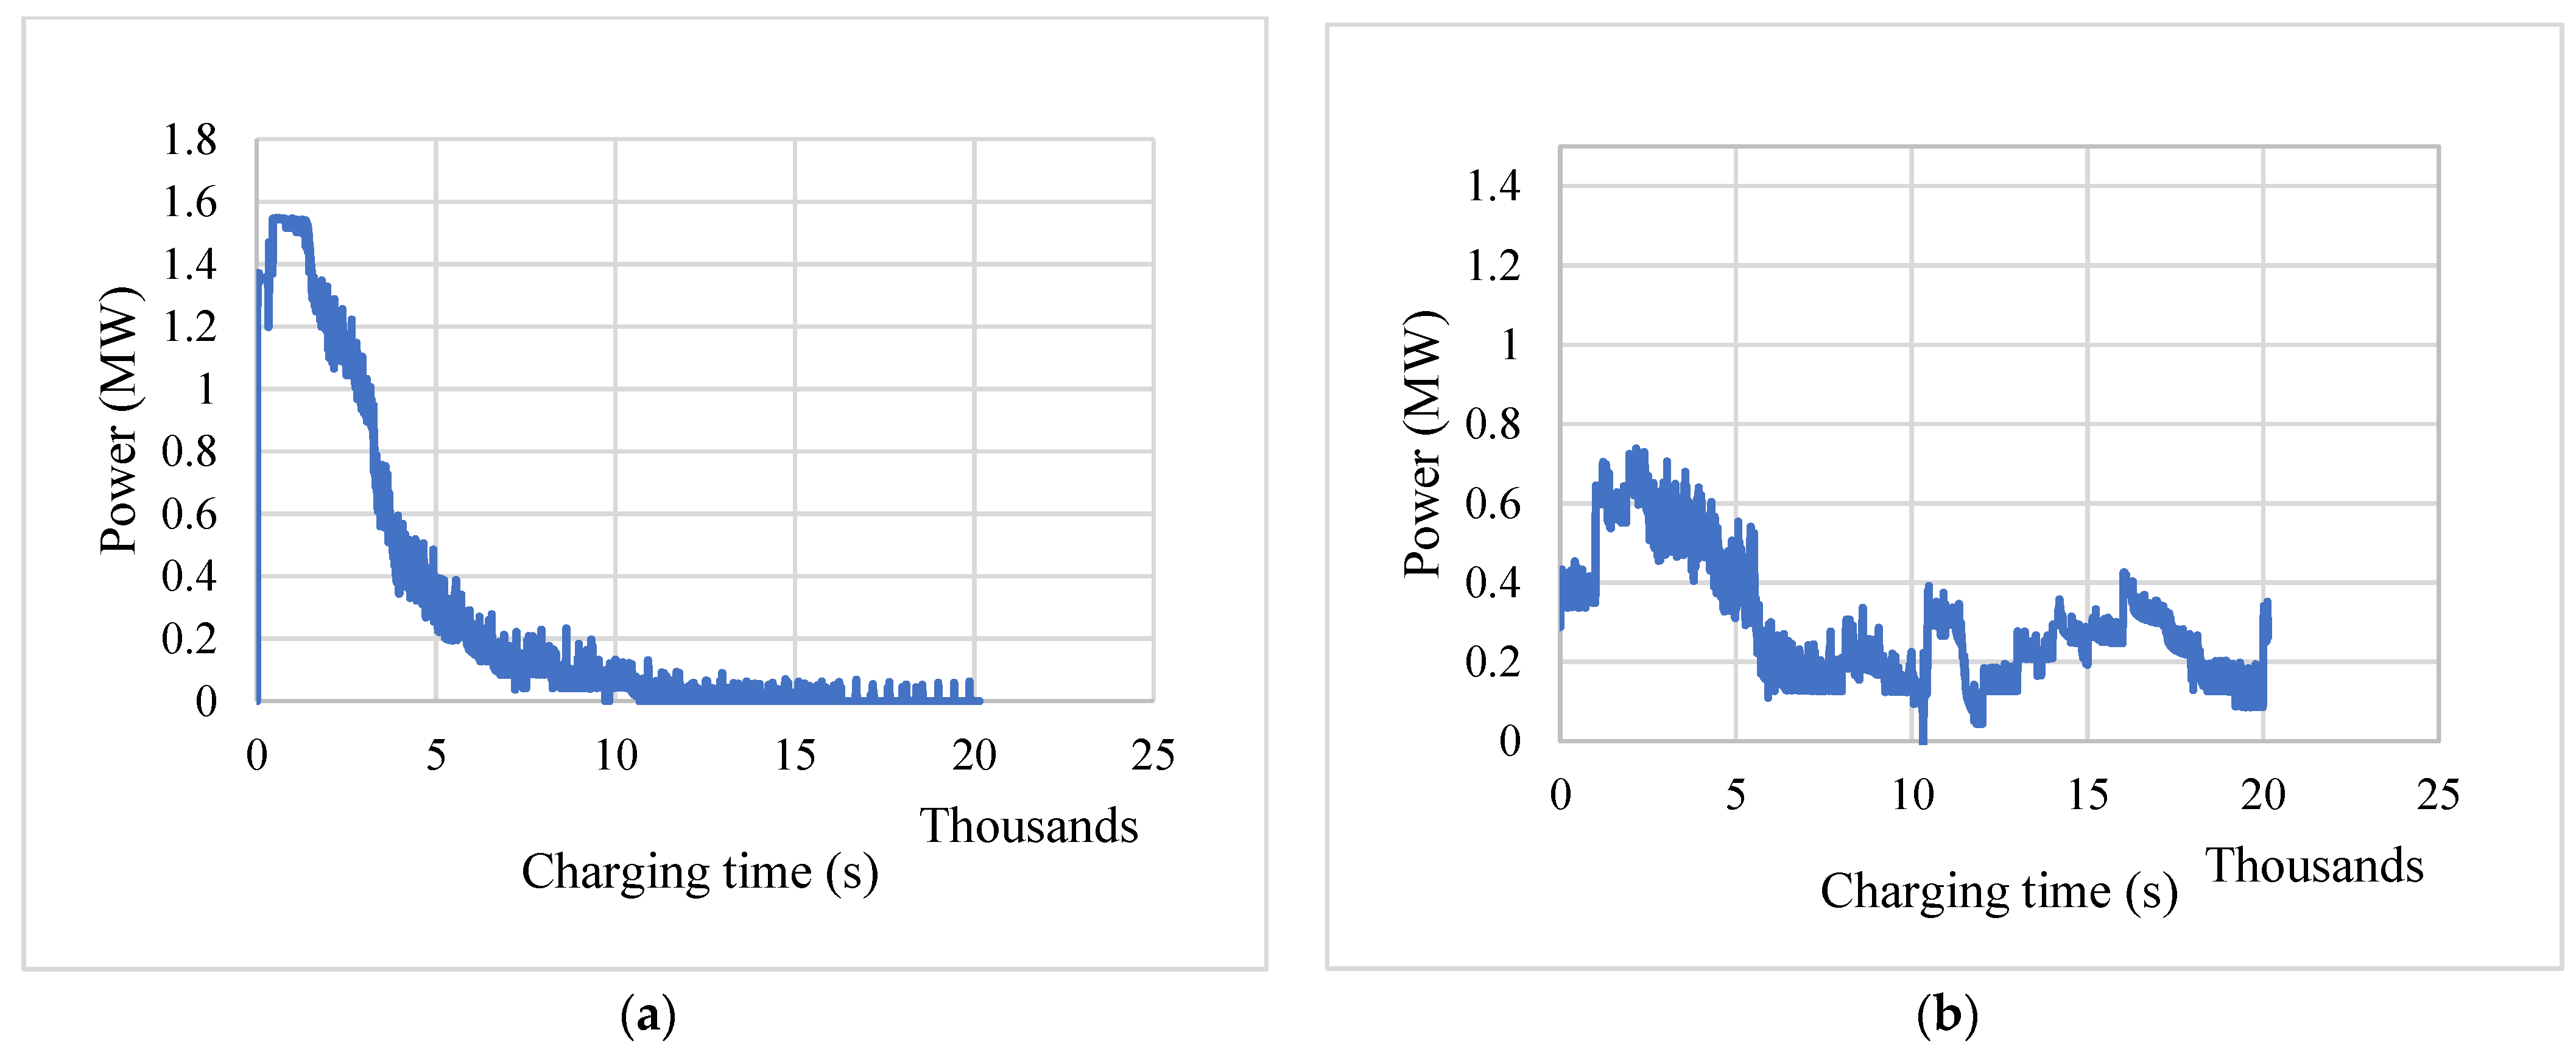
In this section, real data were used to simulate smart and standard charging with 100% e-bus integration in the PKM depot charging station. The uncoordinated/standard charging load profile is shown in
Figure 18a, and the same data we used for coordinated charging with load shifting are shown in
Figure 18b. Based on both figures, in the case of uncoordinated charging, there is a peak and valley of the load profile. This results in a huge impact on the grid during a period of time and no impact during a different period. To minimize the impact on the grid, coordinated/smart charging could be adopted, where the e-buses connect to the grid to be charged and take into account the other factors that have an impact on the grid.
The load profile data for 20 plug-in chargers in the PKM depot charging station were used for coordinated charging simulation, as shown in
Figure 18b. This figure shows how the charging load profile could be coordinated to lessen the impact on the grid by flattening the load profile instead of having some peaks and valleys. In the uncoordinated charging, the e-buses connect to the depot chargers to be charged without taking into consideration the number of e-buses connected to be charged at the same spot, the load of the DSO transformers, or the line ratings. As we can see, the load reaches a peak in one region of the figure and diminishes in the other regions. Such an approach could increase the stress on the grid. In order to minimize the impact of the e-bus fleet integration on the grid, coordinated smart charging could be adopted.
In coordinated smart charging, the e-buses load profiles are distributed almost evenly. In reality, this could be done by shifting the charging of the e-buses in a way that takes into consideration the transformer and line load profiles, and could also be done by decrease the charging power, which prolongs the charging time while taking into consideration the user comfort, which includes the charging period and targeted SoC. In this study, as can be seen in
Figure 18b, smart charging was adopted by shifting the charging of some e-buses that were parked for a longer time and giving charging priority to other e-buses parked less time.
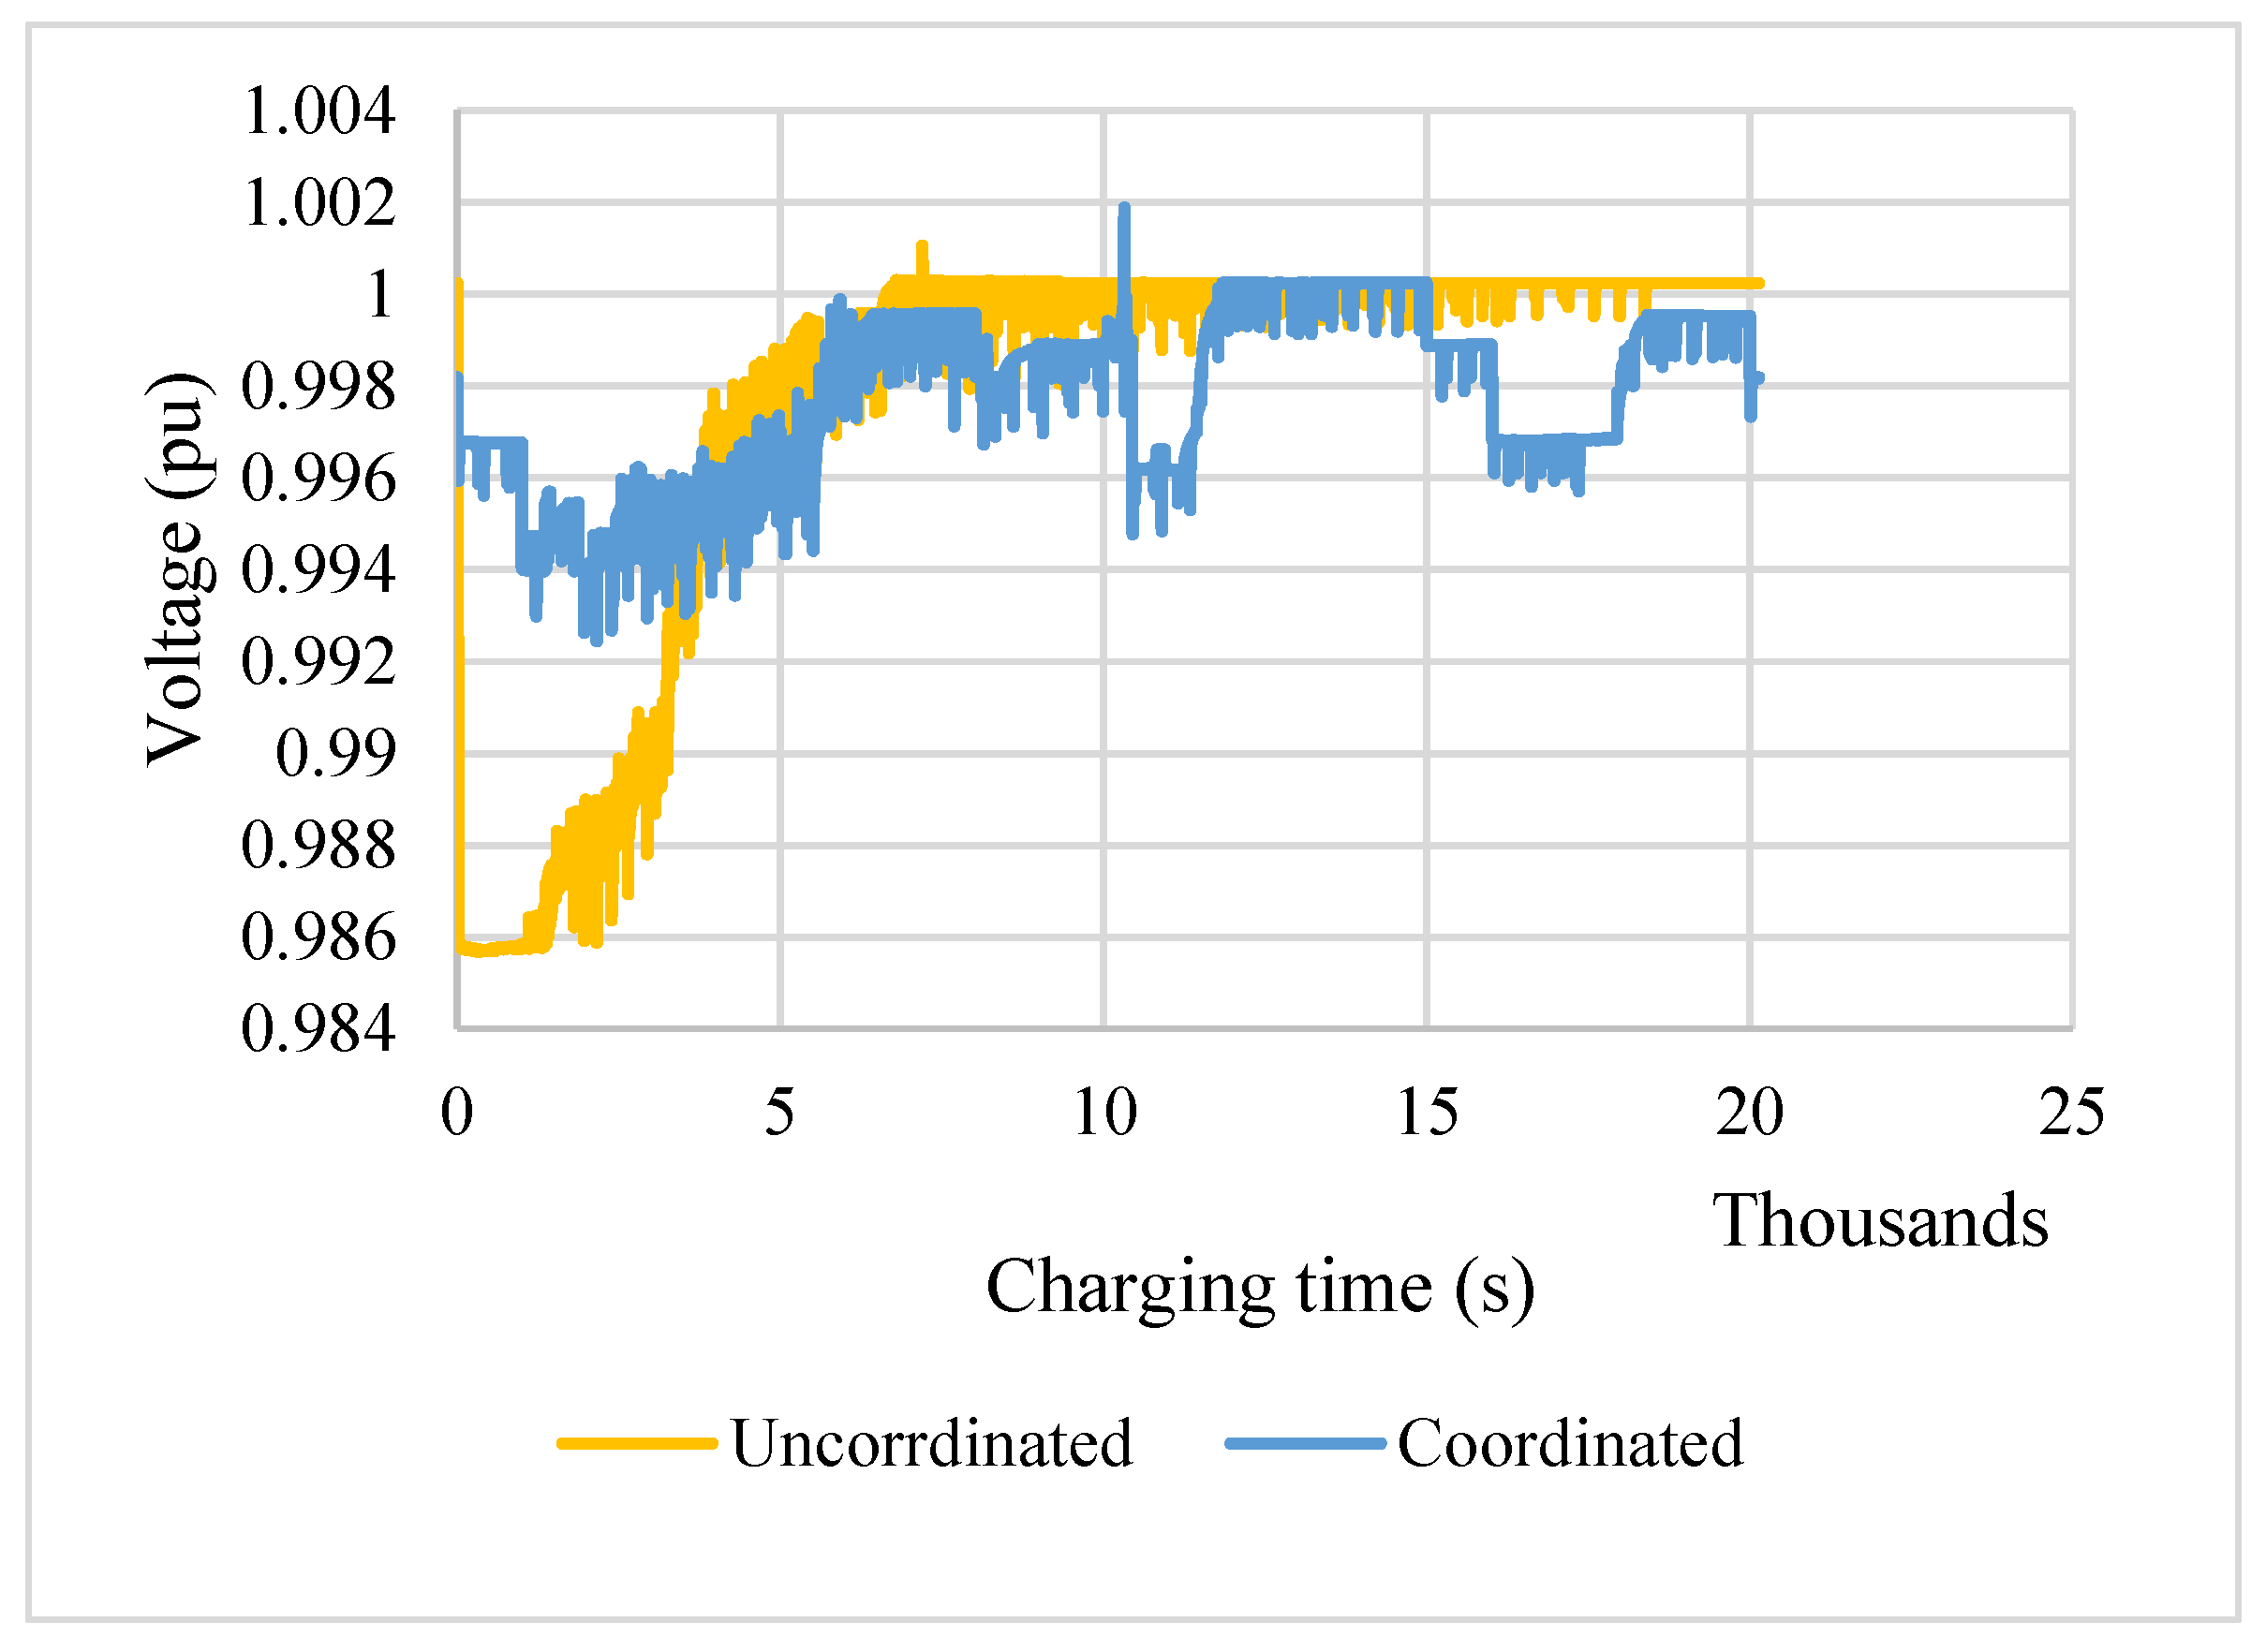
A simulation based on the pandapower Python package was carried out. This scenario included real data from the e-bus fleet in the depot charging station. The results are shown in
Figure 19. The data for the uncoordinated and coordinated charging are the same, with load shaving for coordinated charging.
As can be seen in
Figure 19, for coordinated charging, the peaks and valleys of the voltage profile curve are eliminated and the voltages on the bus bars are supported.
5. e-Bus Fleet Impact on the Environment
The European Union has imposed some CO2 emission regulations over the past three decades. The regulations aim to minimize CO2 emissions. Since then, a series of emissions standards named “Euro” have been implemented, such as Euro 1, Euro 2, Euro 3, Euro 4, and Euro 5. These standards led to the current standard, i.e., Euro 6, which is tailored to become more strict over time and defines the acceptable limits for exhaust emissions of new vehicles sold in EU and the member states of the European Economic Area.
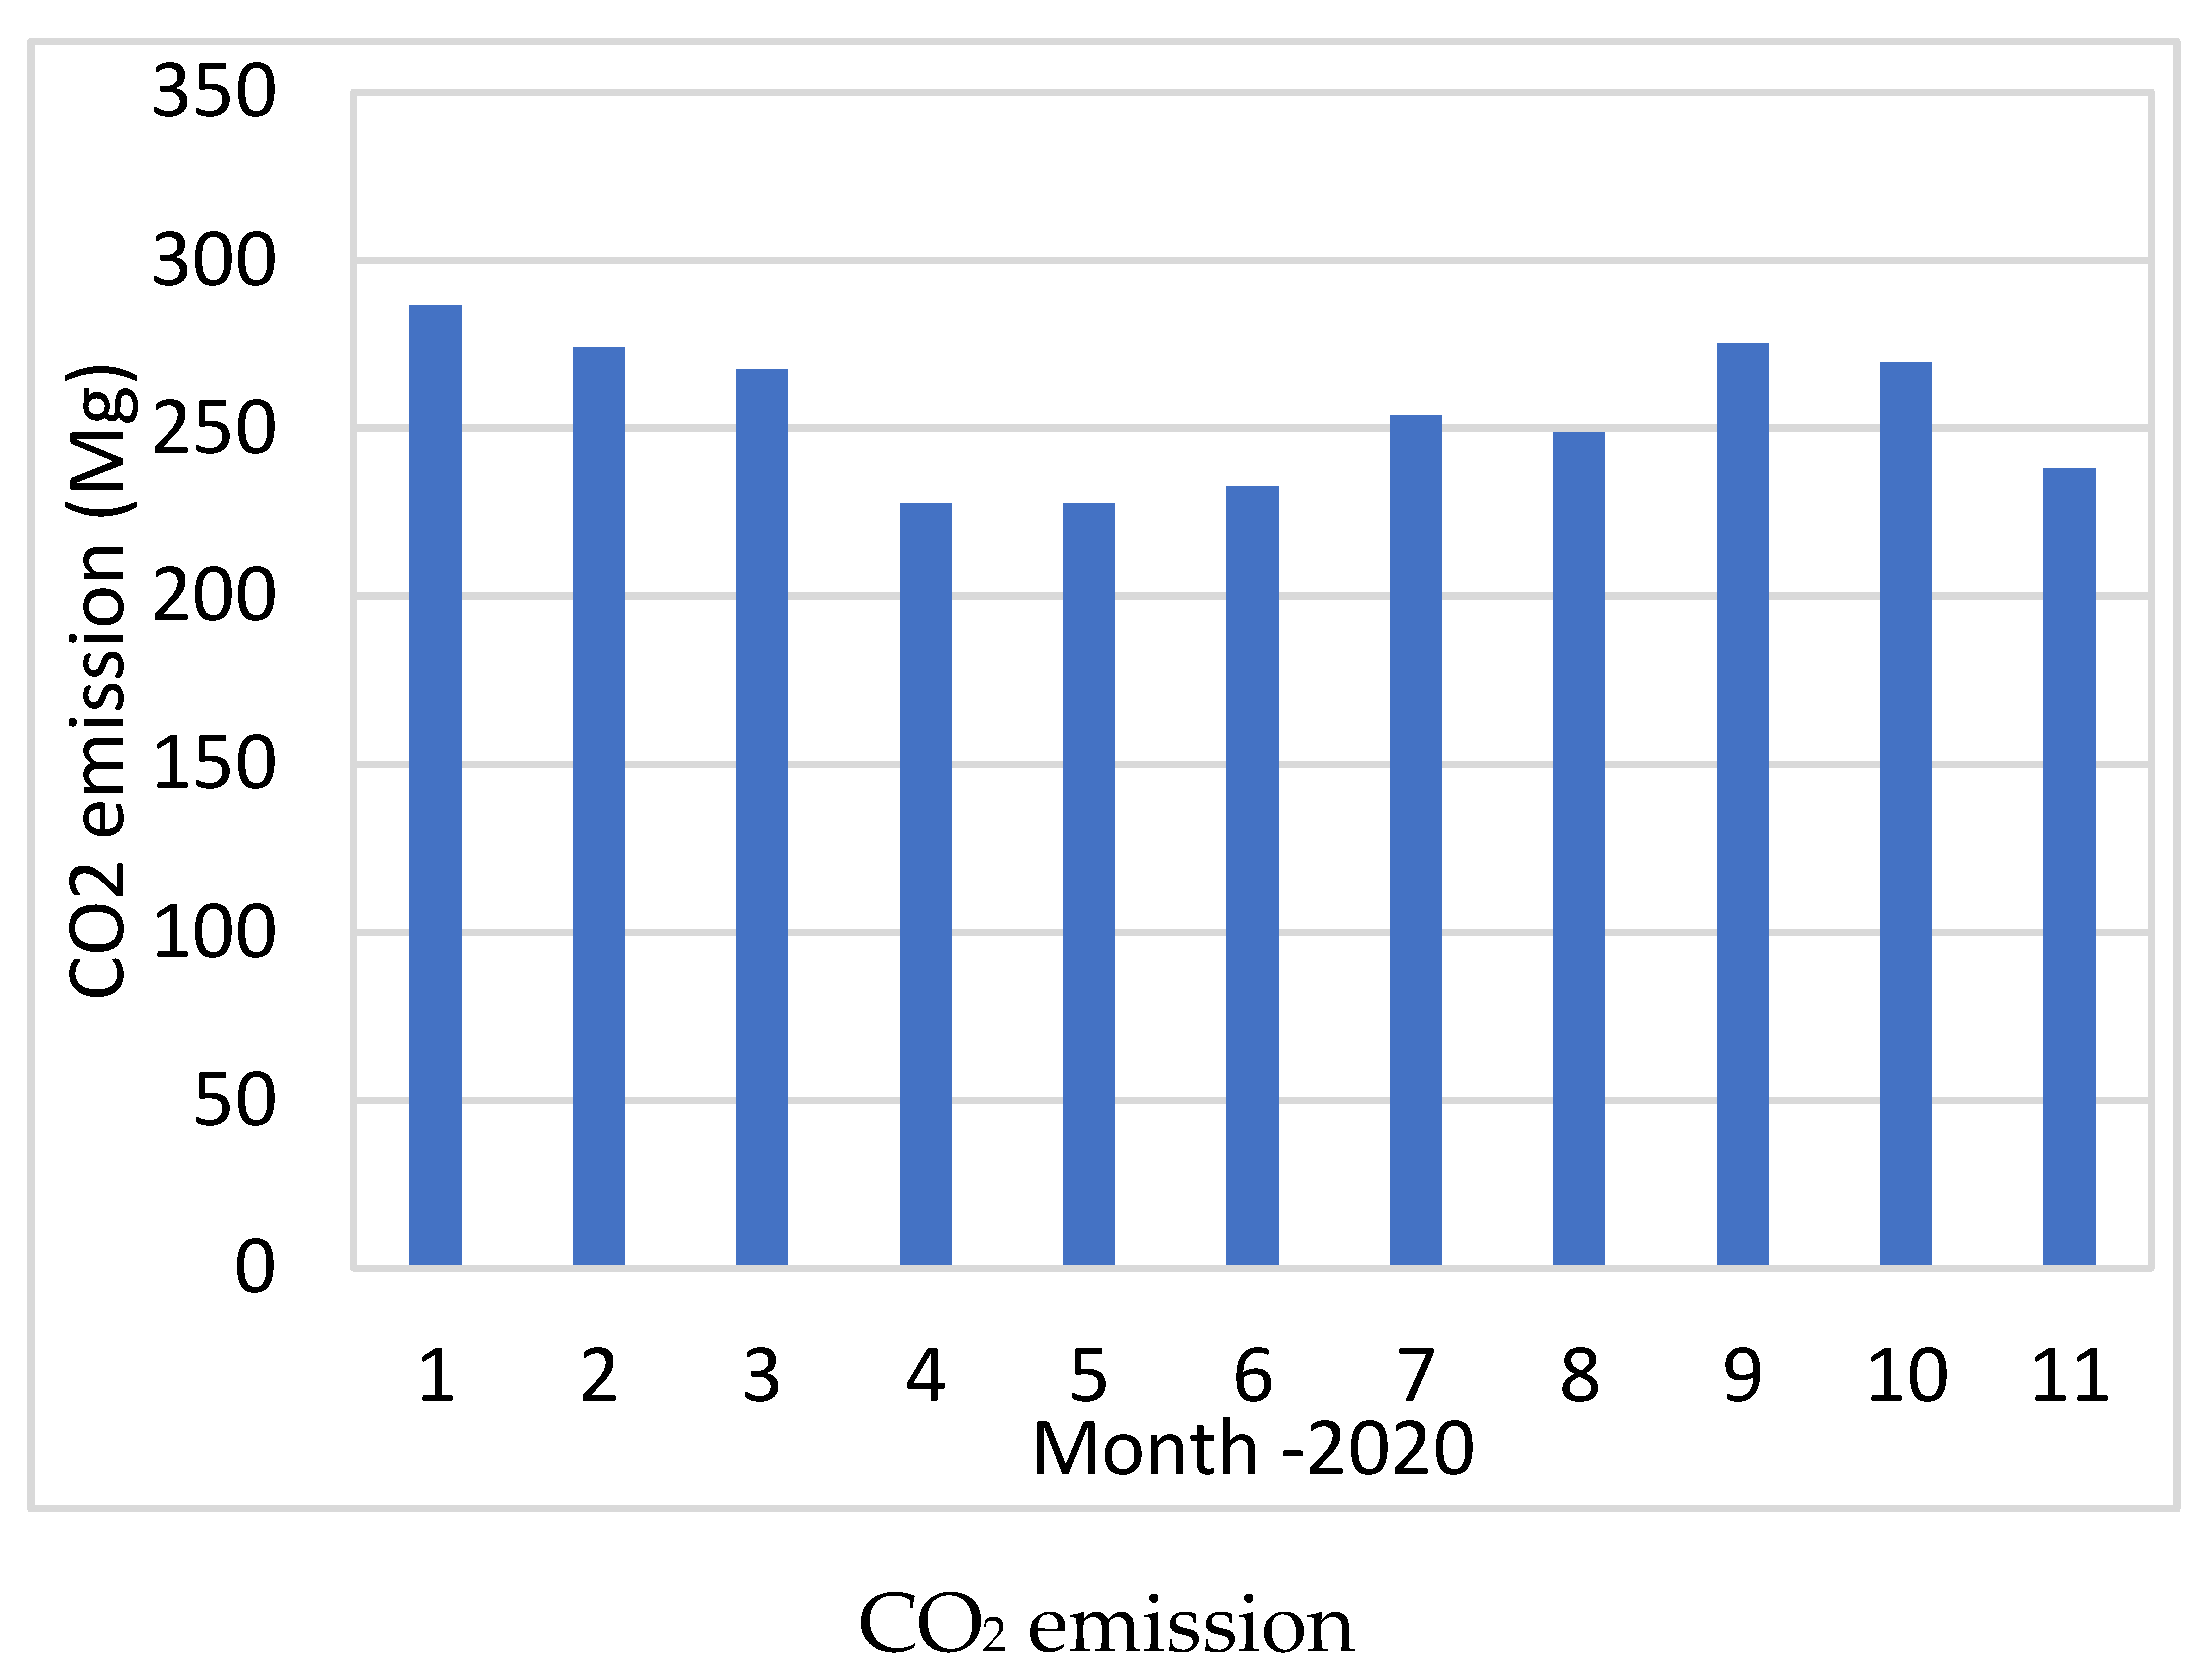
Below are some examples of CO
2 emissions from real data for the diesel fuel combustion of the PKM bus fleet in Jaworzno in 2020 (see
Figure 24). These data are for 12 m and 18 m ICEV buses; there is no data for the 8.9 m buses since this bus was introduced for the first time during the e-bus implementation. After the e-bus implementation, the diesel buses in Jaworzno are no longer used, or they are used only in the following cases:
Malfunction of the e-buses or the need to perform periodic technical inspection/service.
The technical inspection service of the 23 e-buses planned in accordance with the service life specified of the mean time between failure (MTBF). It is conducted on the weekends when there are fewer routes to be serviced in order to not disturb the planned cycle and keep using the e-buses without resorting to using the diesel ones.
During the traffic congestion peak in the intercity lines/routes when the maximum number of vehicles is used simultaneously for a short period of time.
As an intercity line/route for which there is currently no formal possibility to build chargers.
According to the EU assumptions for 2030, Jaworzno is an ideal role model in terms of bus fleet electrification. Jaworzno is an example that with the appropriate modification of the line and adaptation of infrastructure, it is possible to completely replace ICEVs with EVs.
One L of diesel weighs 835 g. Diesel consists of 86.2% carbon or 720 g of carbon per liter of diesel. In order to combust this carbon to CO
2, 1920 g of oxygen is needed. The sum is thus 720 + 1920 = 2640 g of CO
2/liter diesel [
16]. Comparing the CO
2 emissions of ICEVs to those of the introduced e-buses with zero emissions, the fleet of 23 e-buses could minimize the CO
2 emissions in Jaworzno by around 1000 Mg per year.
Generally, e-buses are less noisy than ICEVs; however, there is no noise data available to make an analysis about this topic.
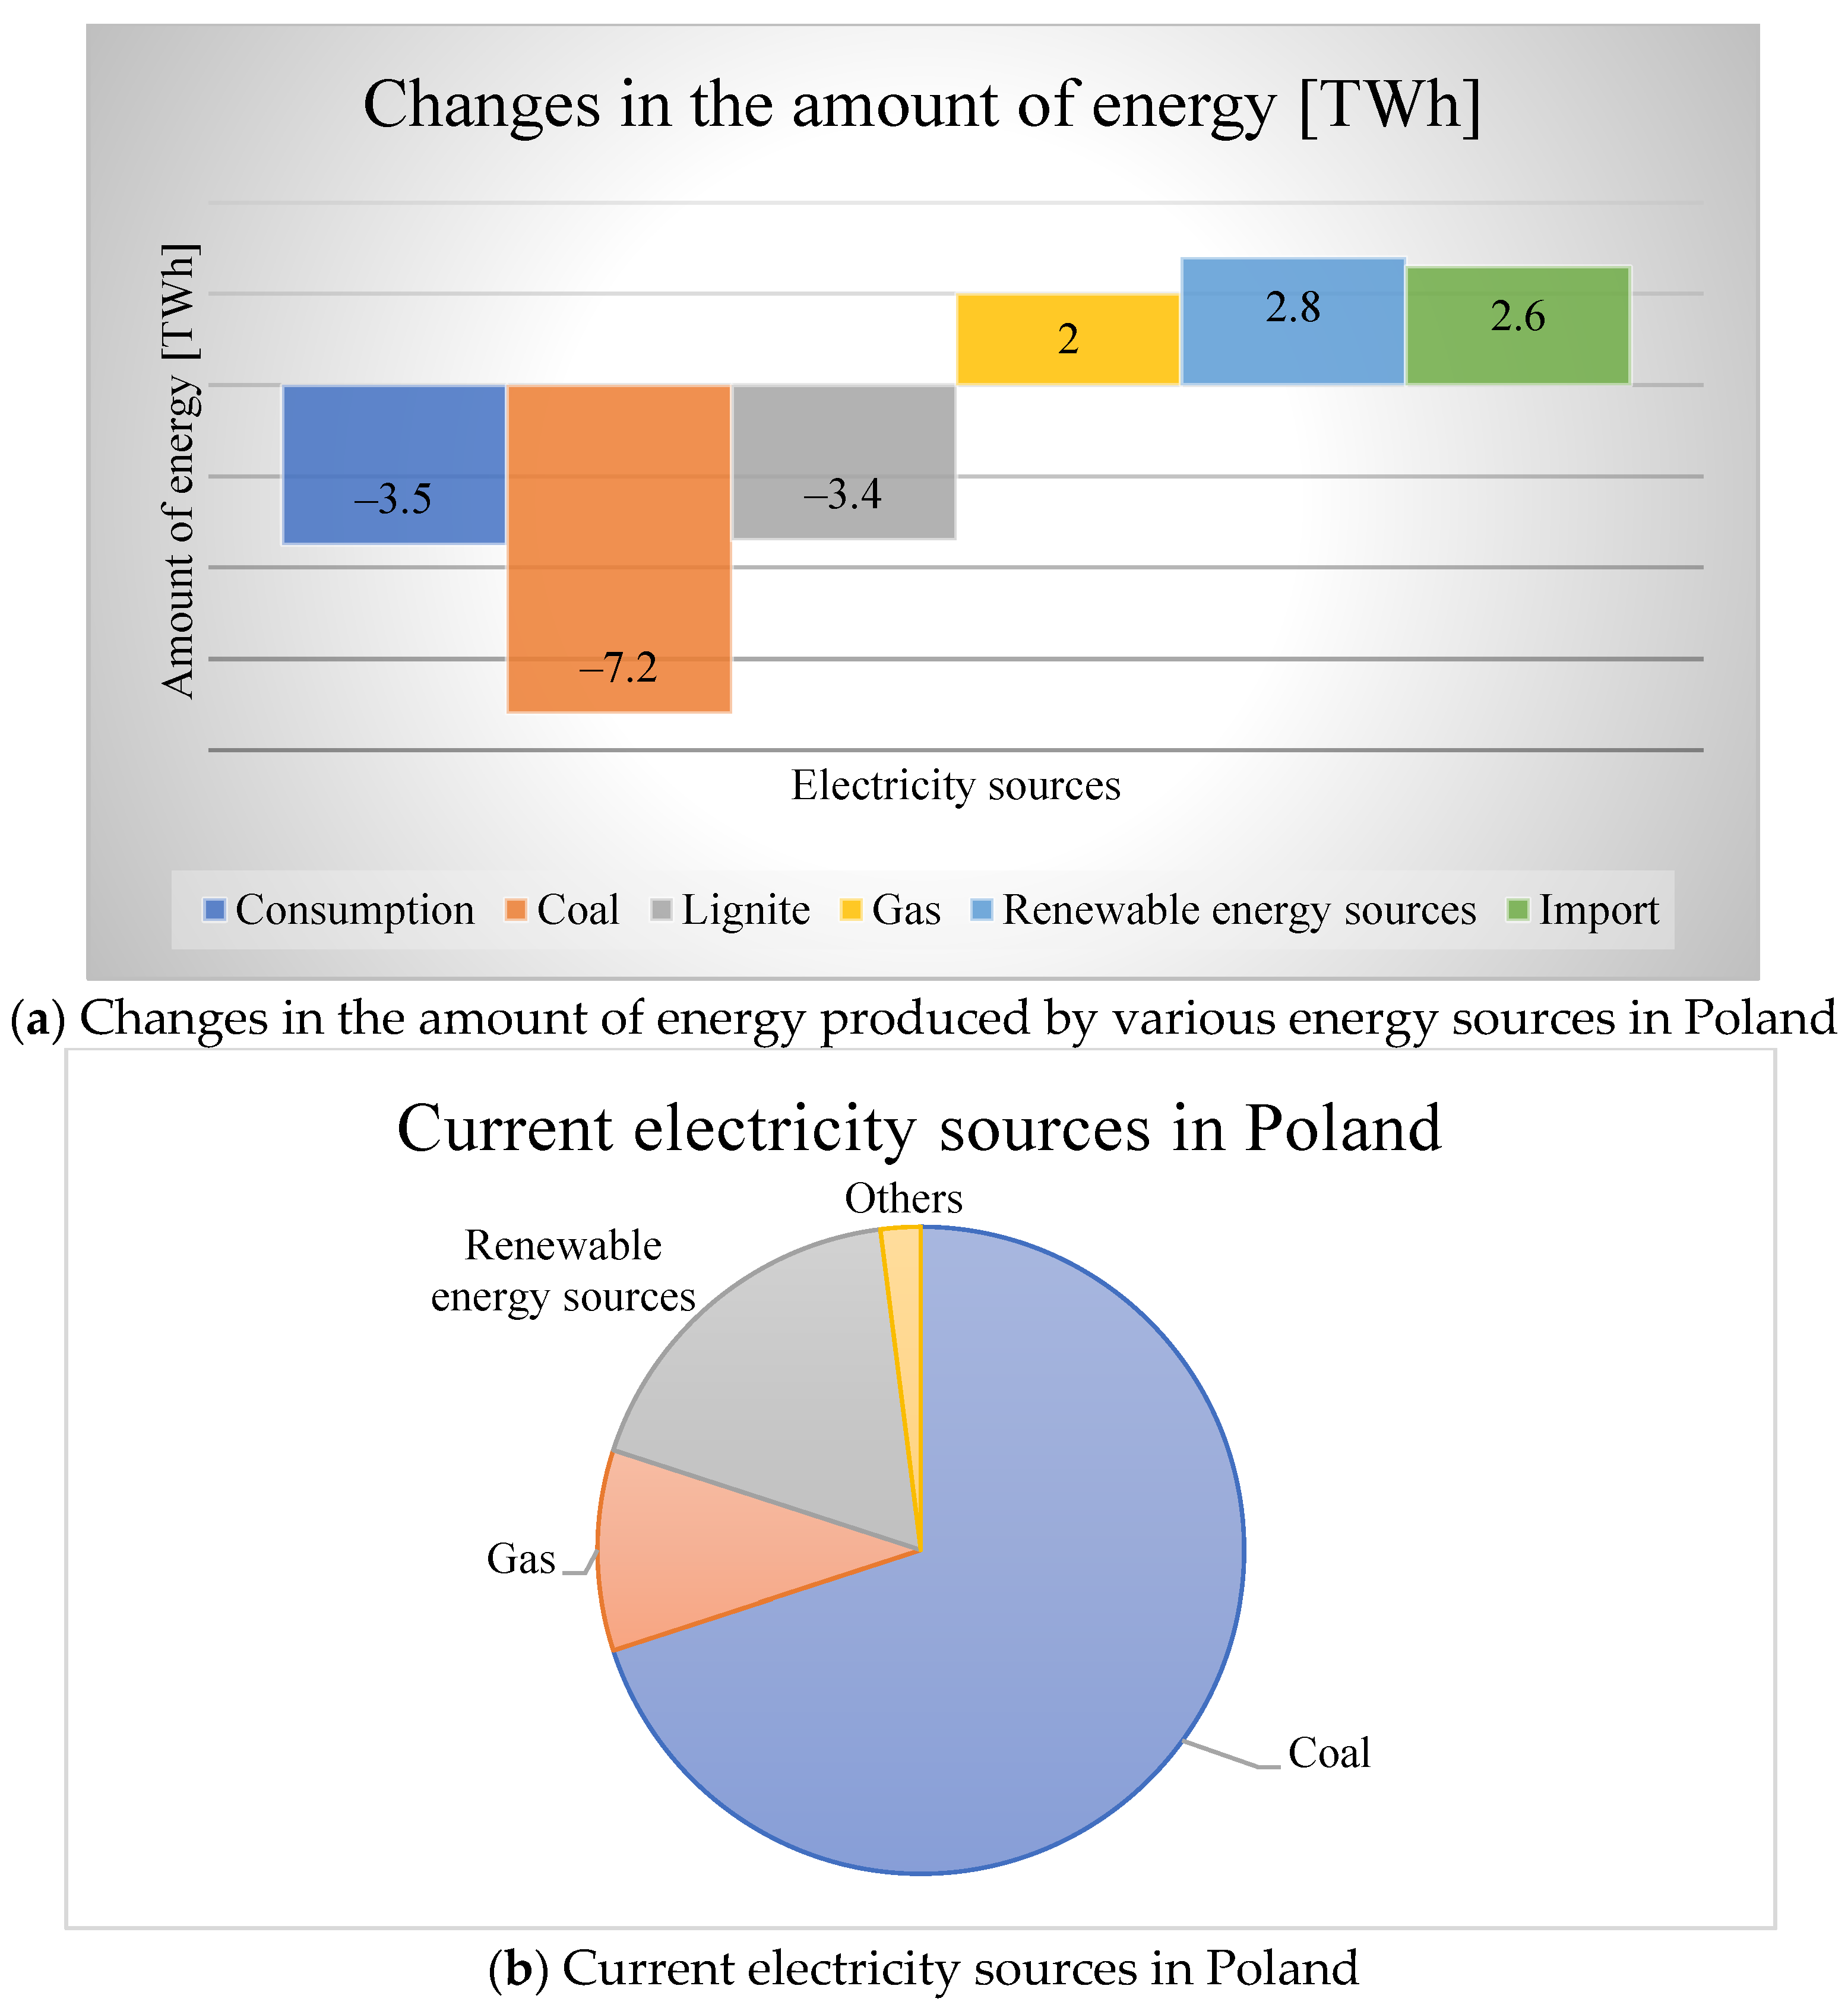
PKM Jaworzno, as one of the leaders in electromobility in Poland, uses the full potential of electric buses. In total, e-buses from Jaworzno have traveled over 7 million kilometers, which may have a large impact on greenhouse gas emissions. Additionally, the company takes into account the country’s policy regarding sources of energy production (see
Figure 25). Progress has been achieved in terms of reducing the production of greenhouse gases by 3.8% and reducing consumption by 2%.
6. e-Bus Management System
SOLARIS developed a dashboard app that collects real-time information from e-bus fleets from data acquisition devices (eSConnect), which is accessible by the dashboard app through a SIM socket cellular network (3G). The main functionalities of the eSconnect are as follows: swift maintenance support, generation of statistics and reports, access to vehicle data in real time, monitoring of operating parameters of the vehicle, tracking and monitoring of the online routes of each vehicle in the fleet, identification of faults and alerts in real time and to notify the operator about them, fleet utilization status, estimation of the energy needed to reach the destination based on the battery SoC, remote vehicle diagnoses, fault identification, current energy consumption, distance covered between charges, etc.
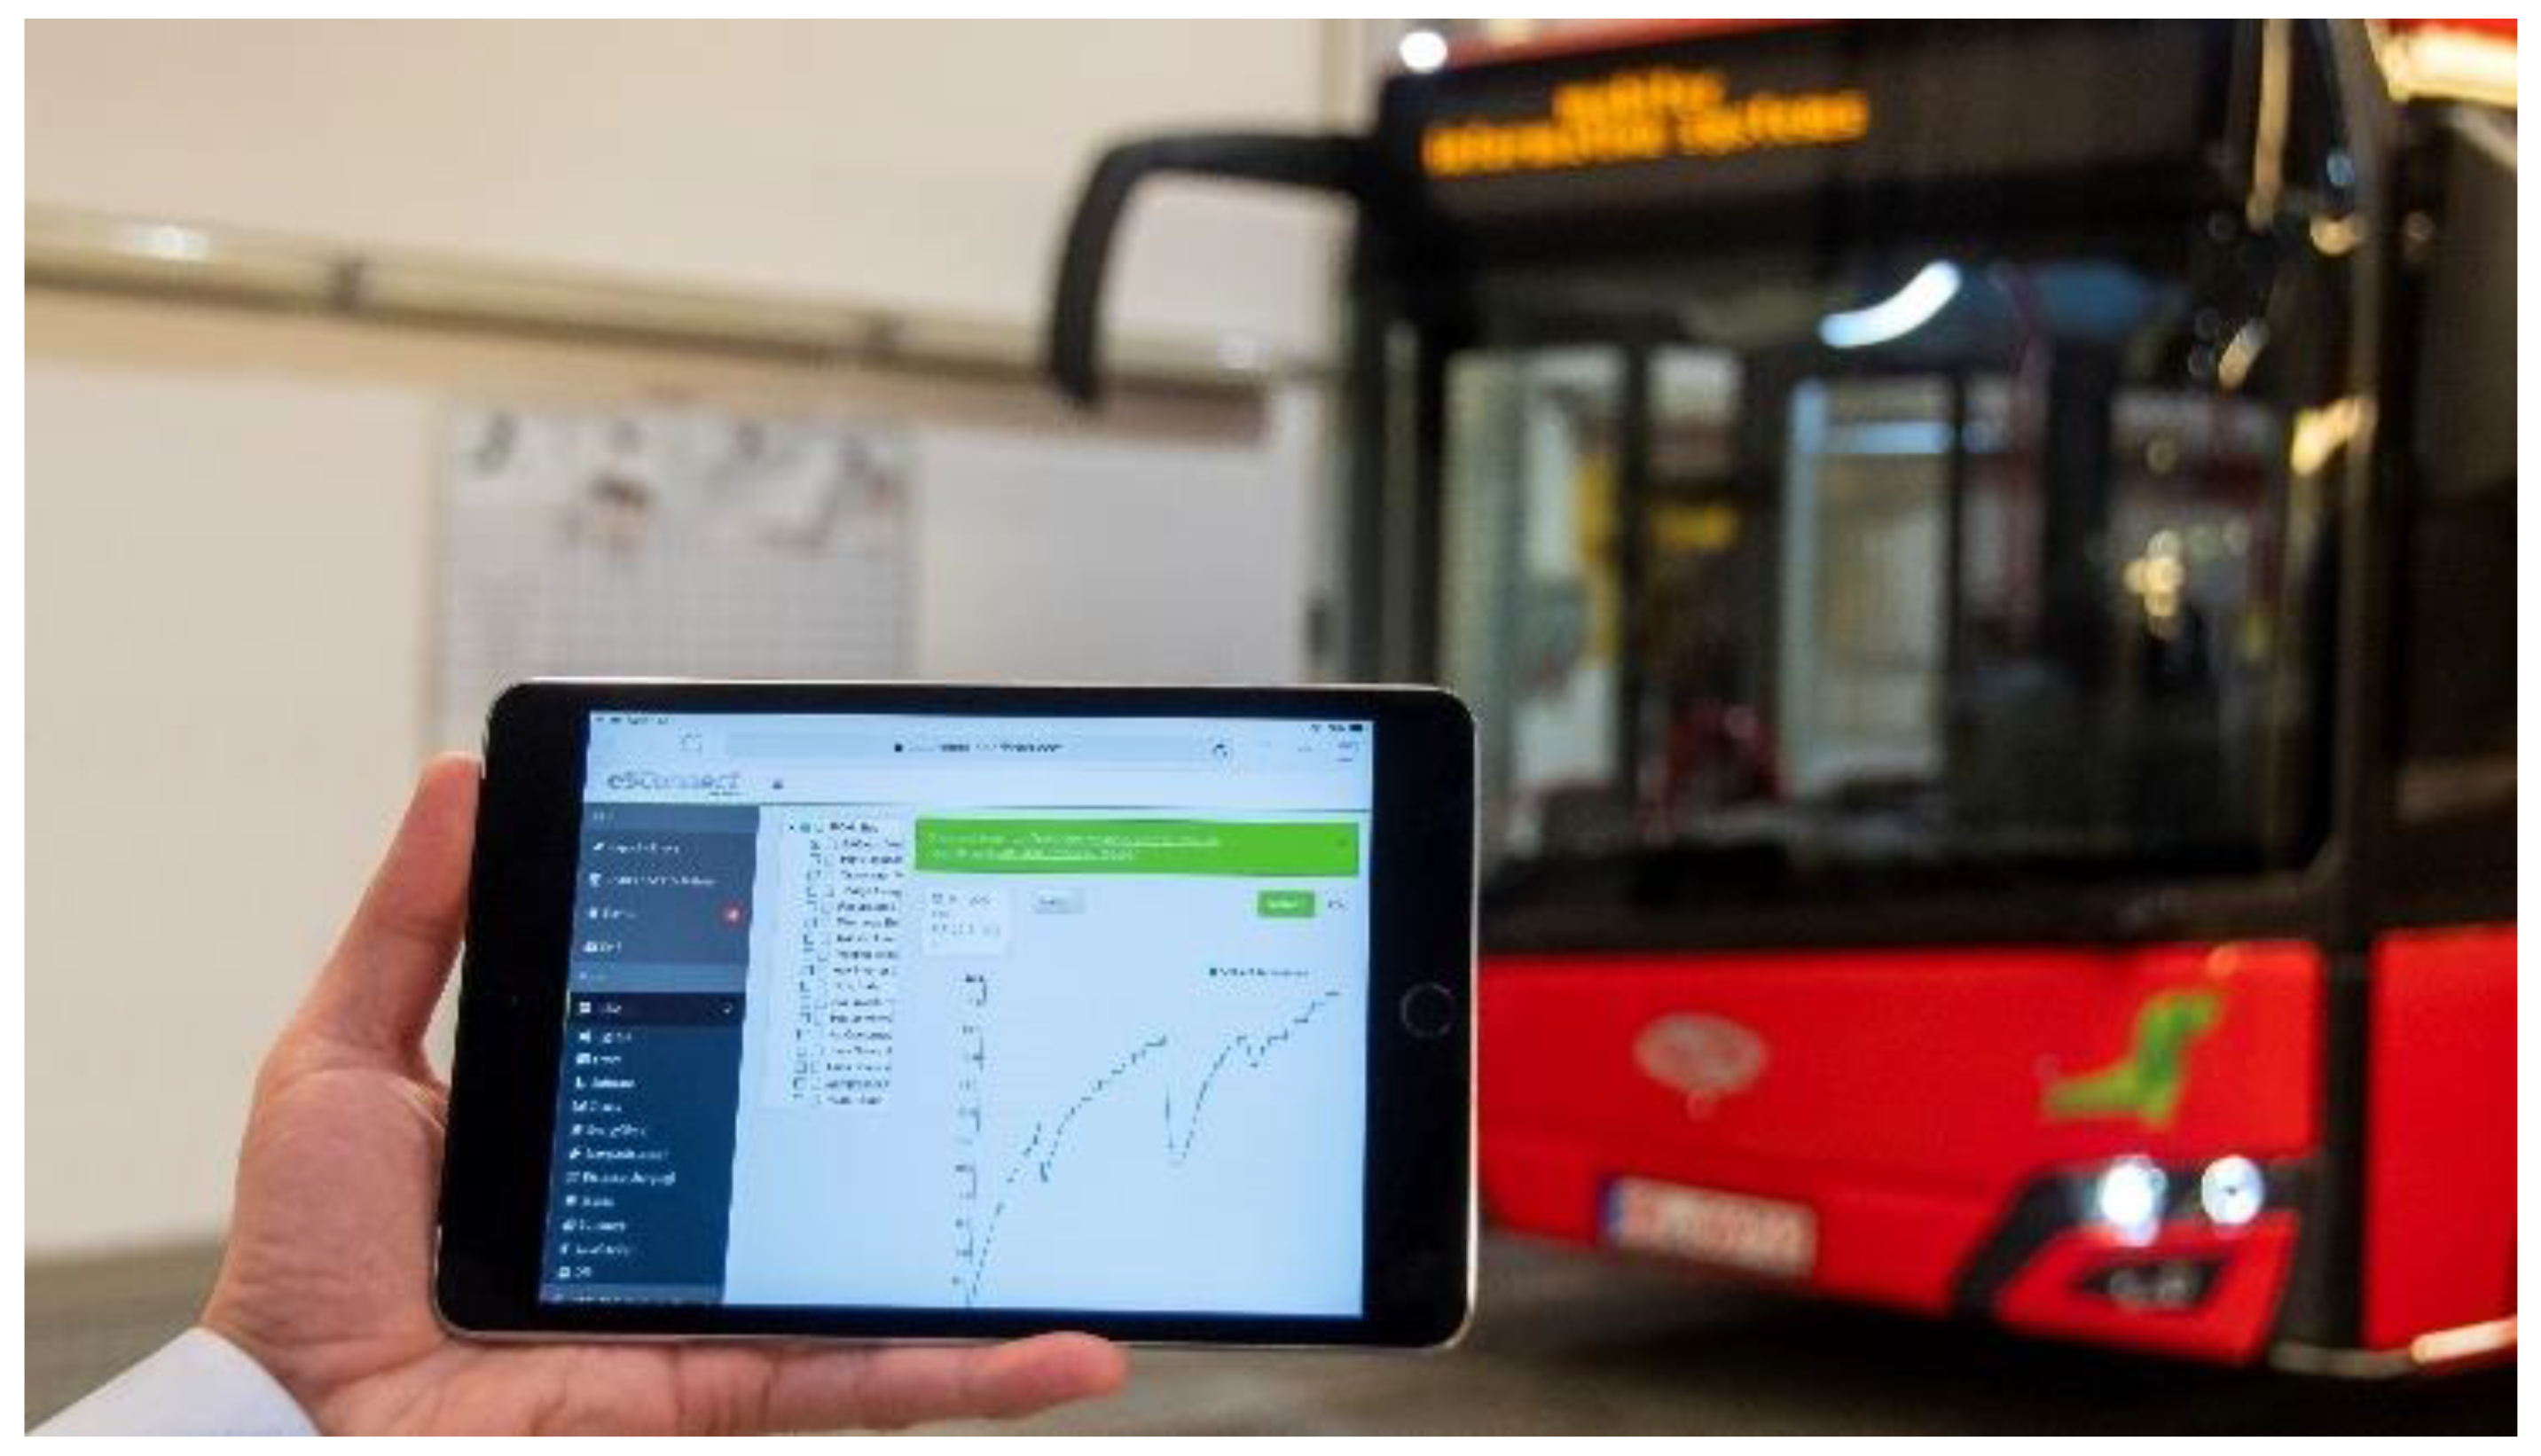
The dashboard app can be installed on any PC or mobile phone (see
Figure 26). The e-bus operator can perform the following optimization based on the dashboard app:
Limit the downtime of the buses;
Prevent unnecessary returns to the e-bus depot;
Gain additional time to prepare the workshop for repairs;
Analyze the historical data, which enables the improvement of operational efficiency.
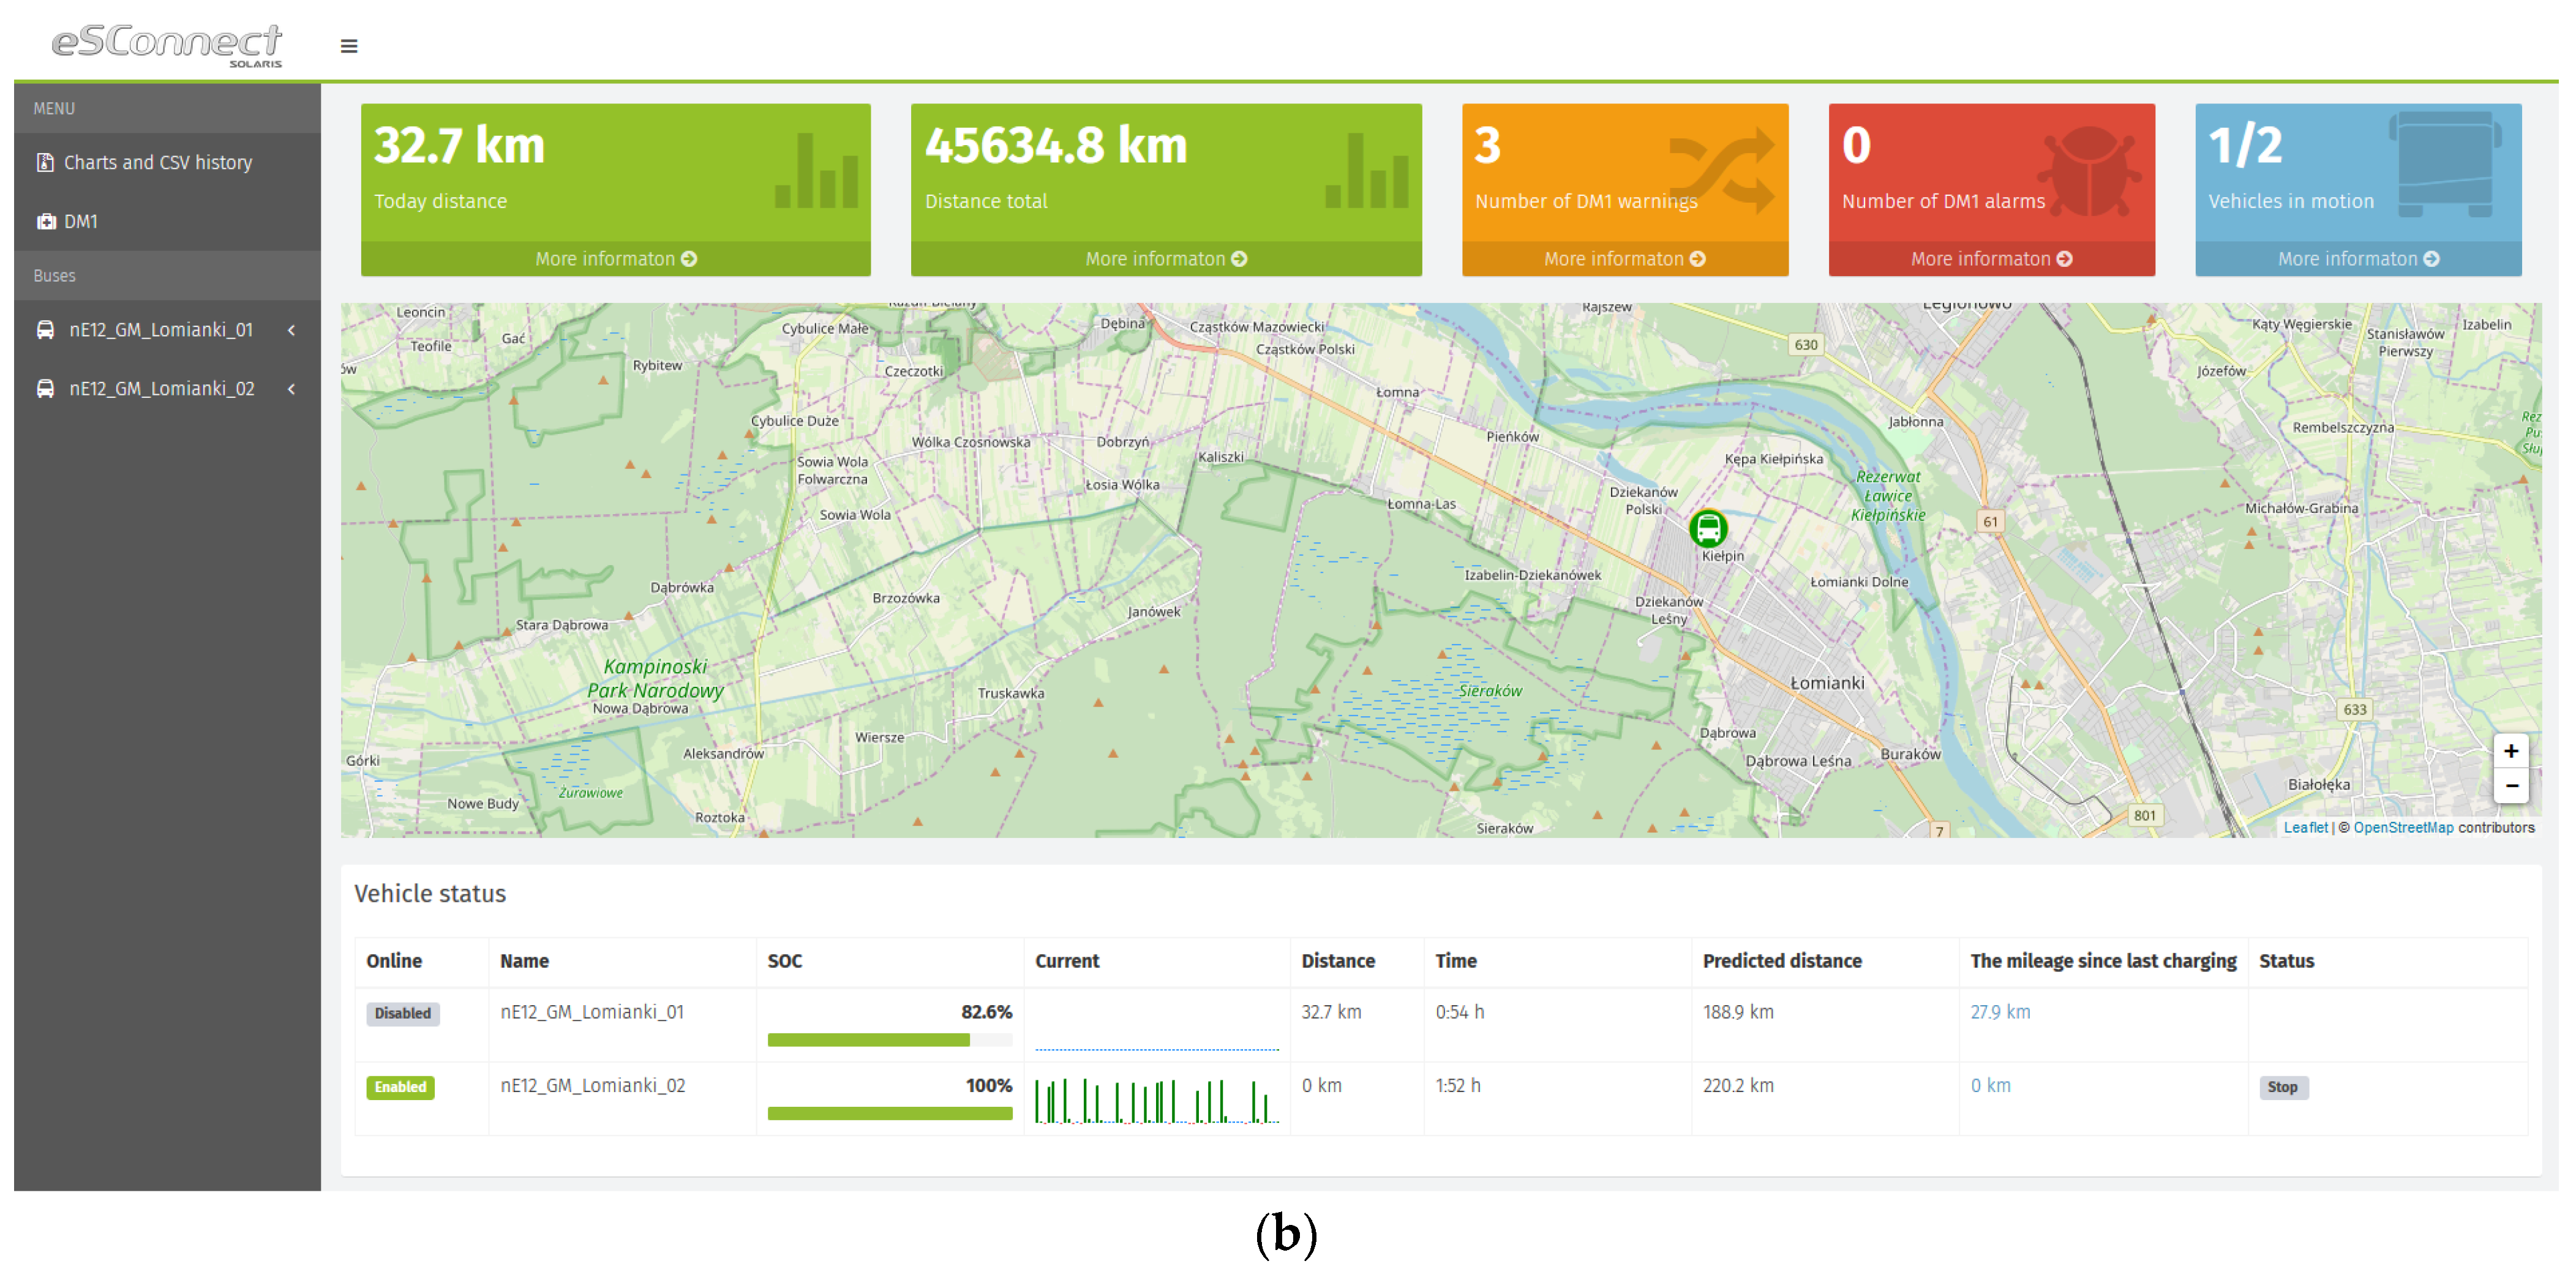
The dashboard app could have an opportunity to integrate with other fleet management systems used by the operator. With remote diagnosis, it is possible to start removing the fault without having to carry out maintenance. Additionally, it is possible to decrease the number of necessary maintenance visits and reduce the maintenance duration and vehicle downtime. The online routes of the e-buses from the dashboard app could also be monitored (see
Figure 27).
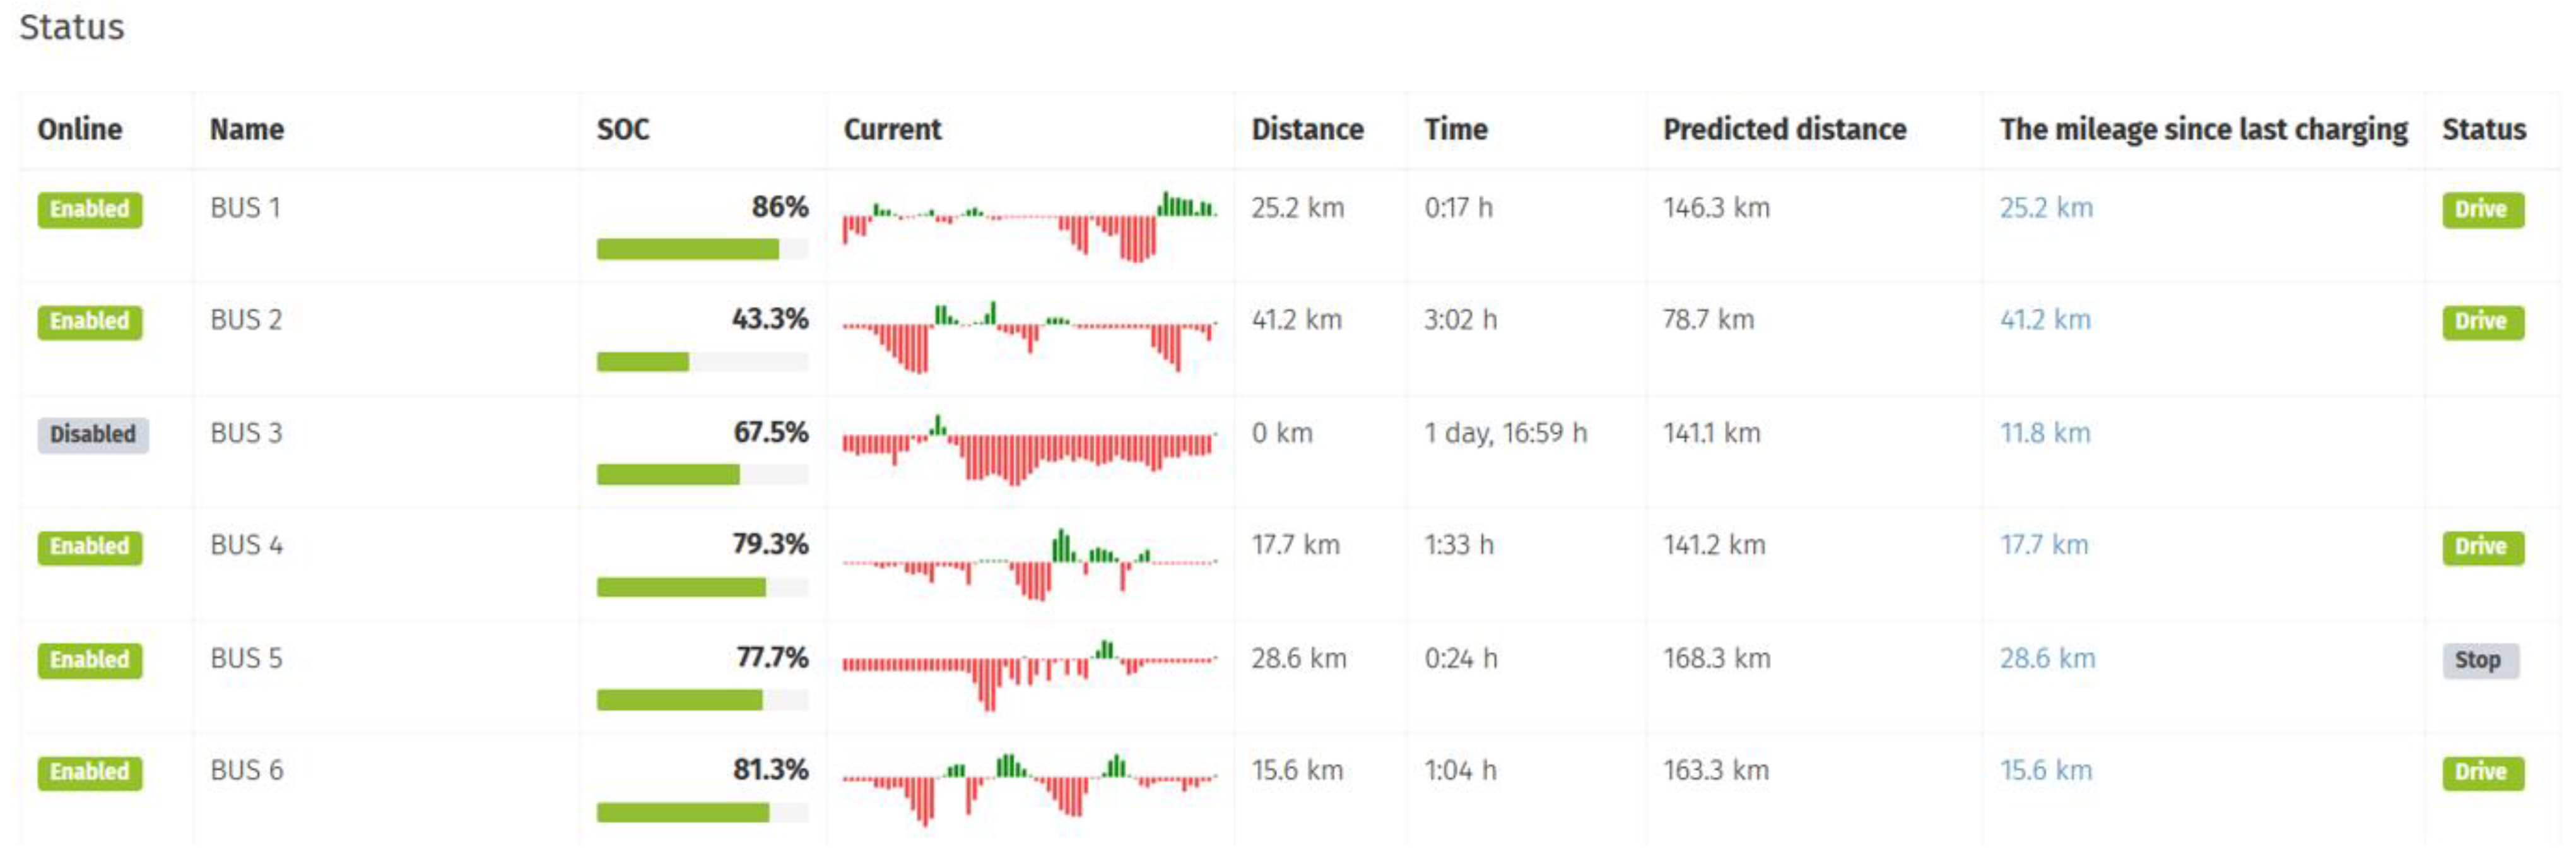
The most important aspect is that e-bus status can be monitored, as can SoC, discharge/charge current, distance, predicted distance to be covered according to the SoC, etc. (see
Figure 28). In addition, in case of irregularities/error, eSConnect displays detailed information about the error.
7. Conclusions
A real-life demo of HD vehicles was presented in this work. The vehicles are used for public transport in Jaworzno, Poland. The e-bus fleet demo includes 23 e-buses with 4 units of 8.9 m, 10 units of 12 m, and 9 units of 18 m articulated e-buses.
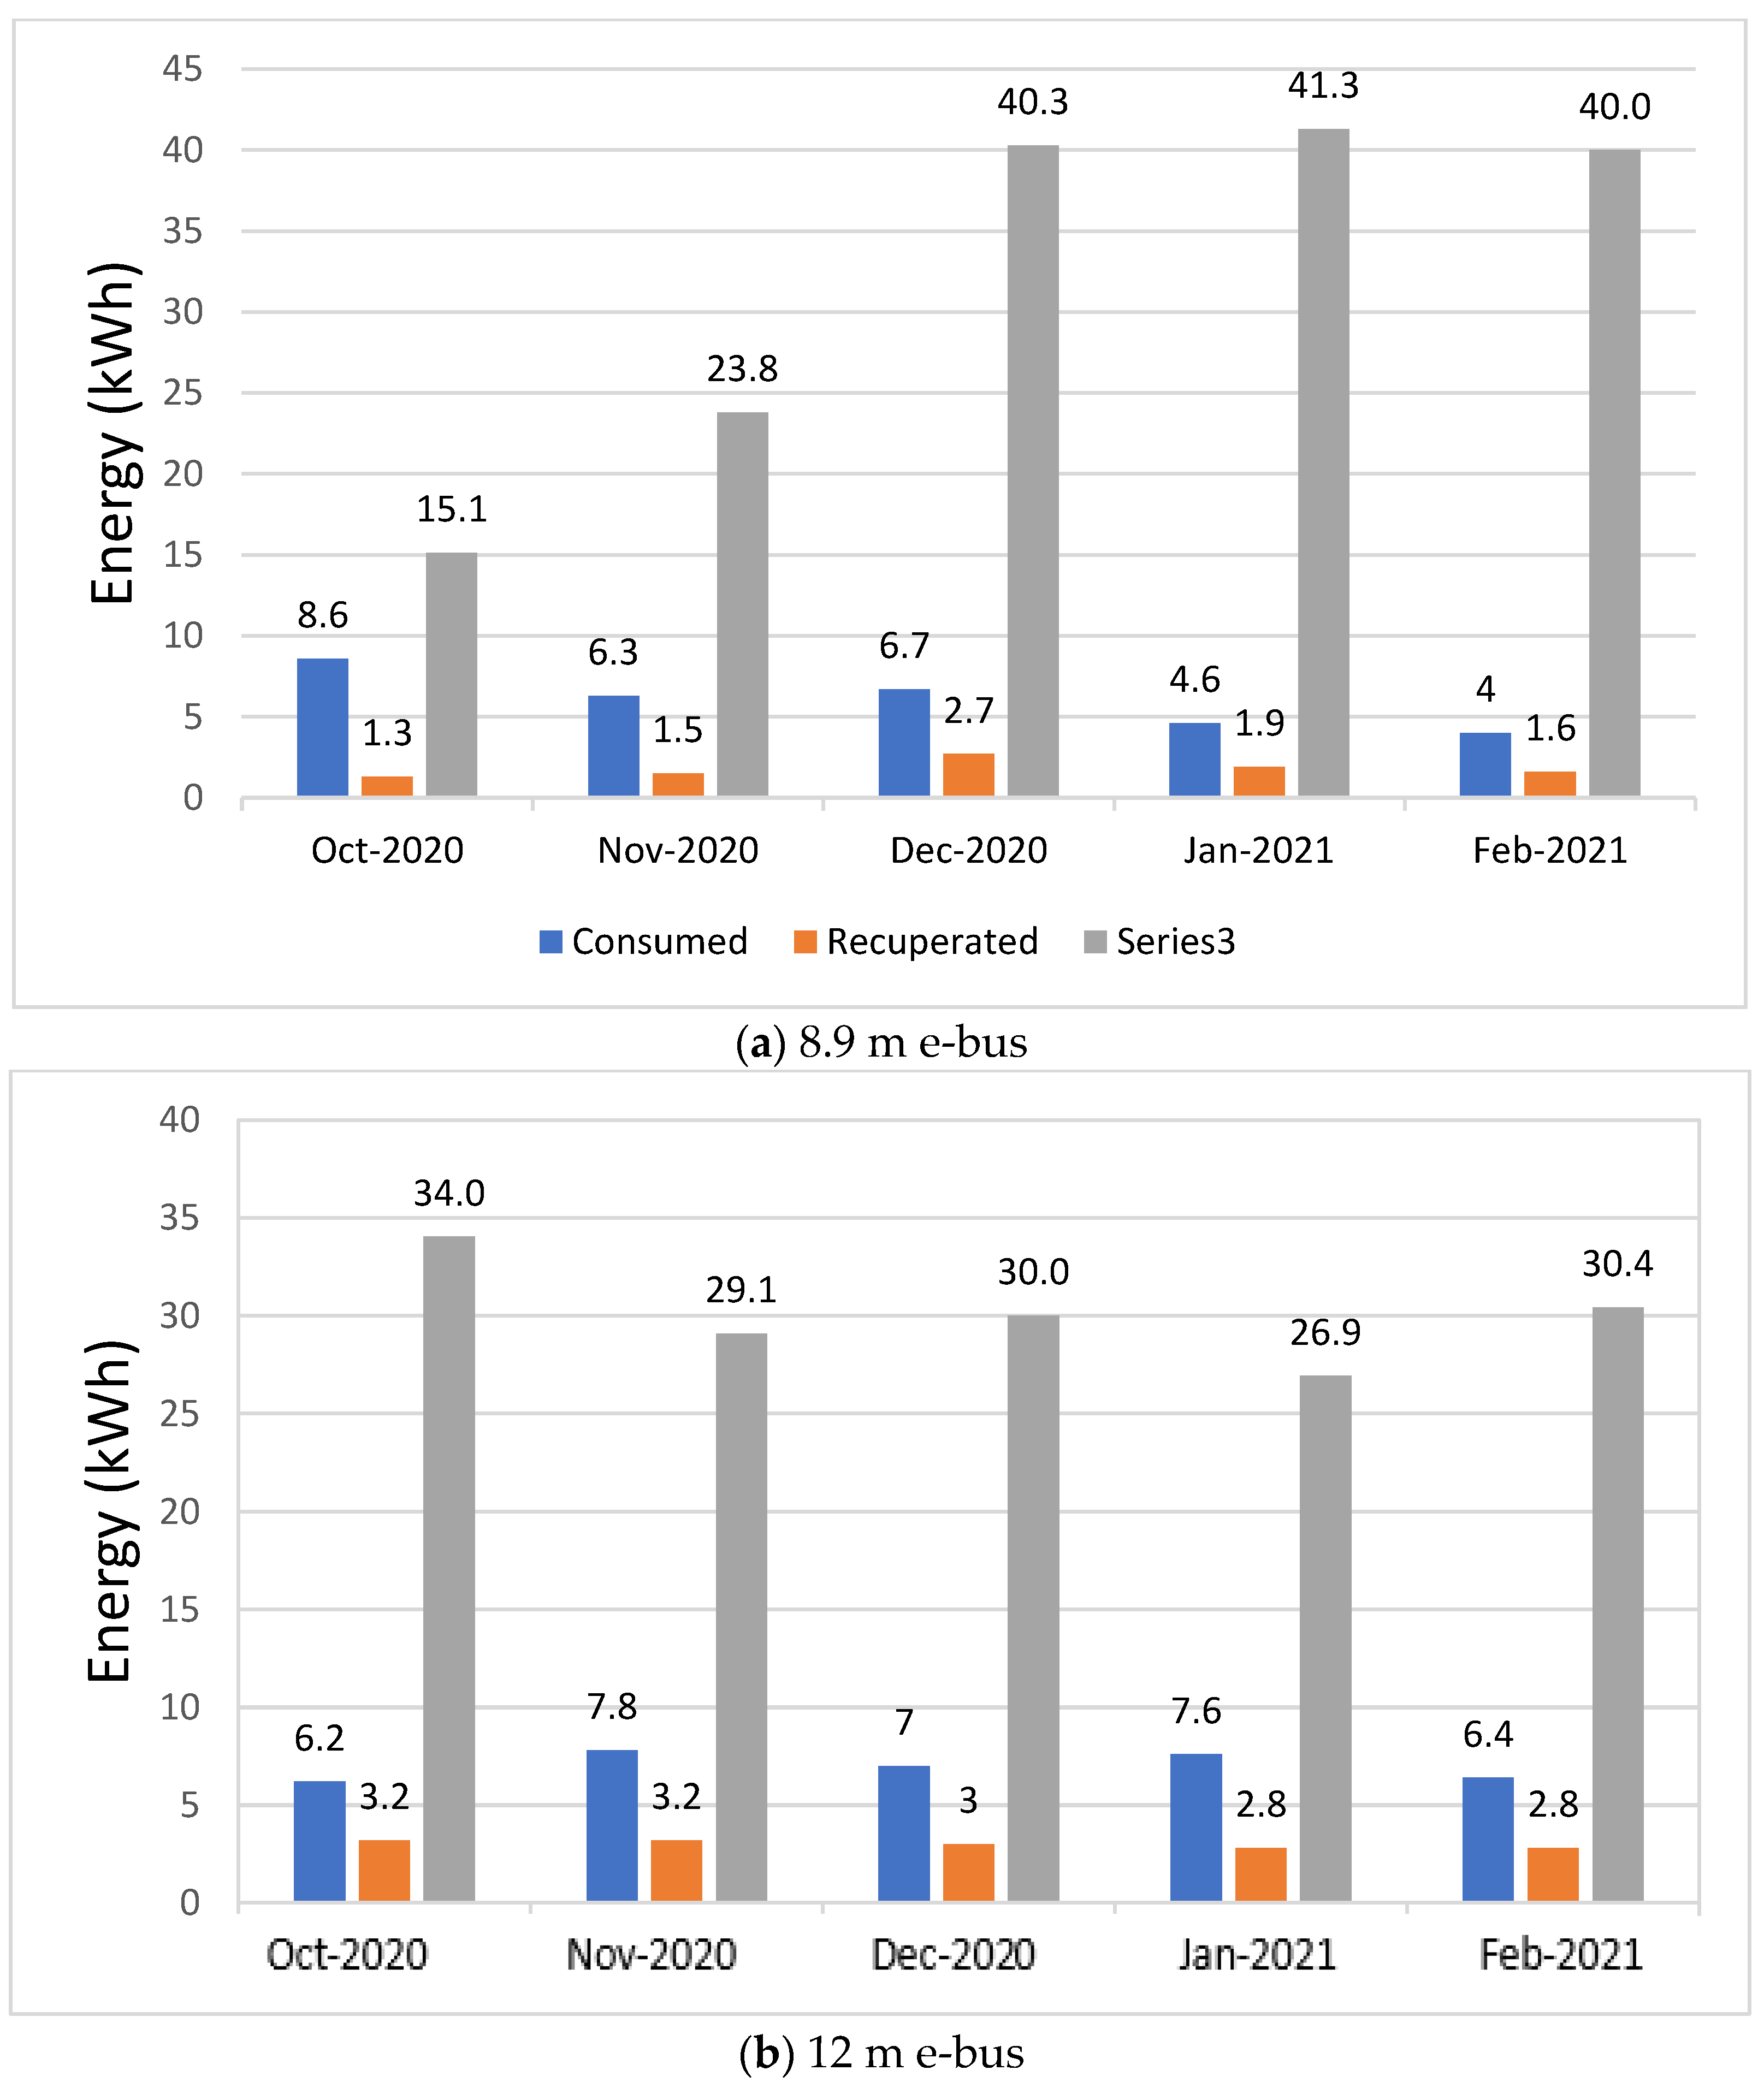
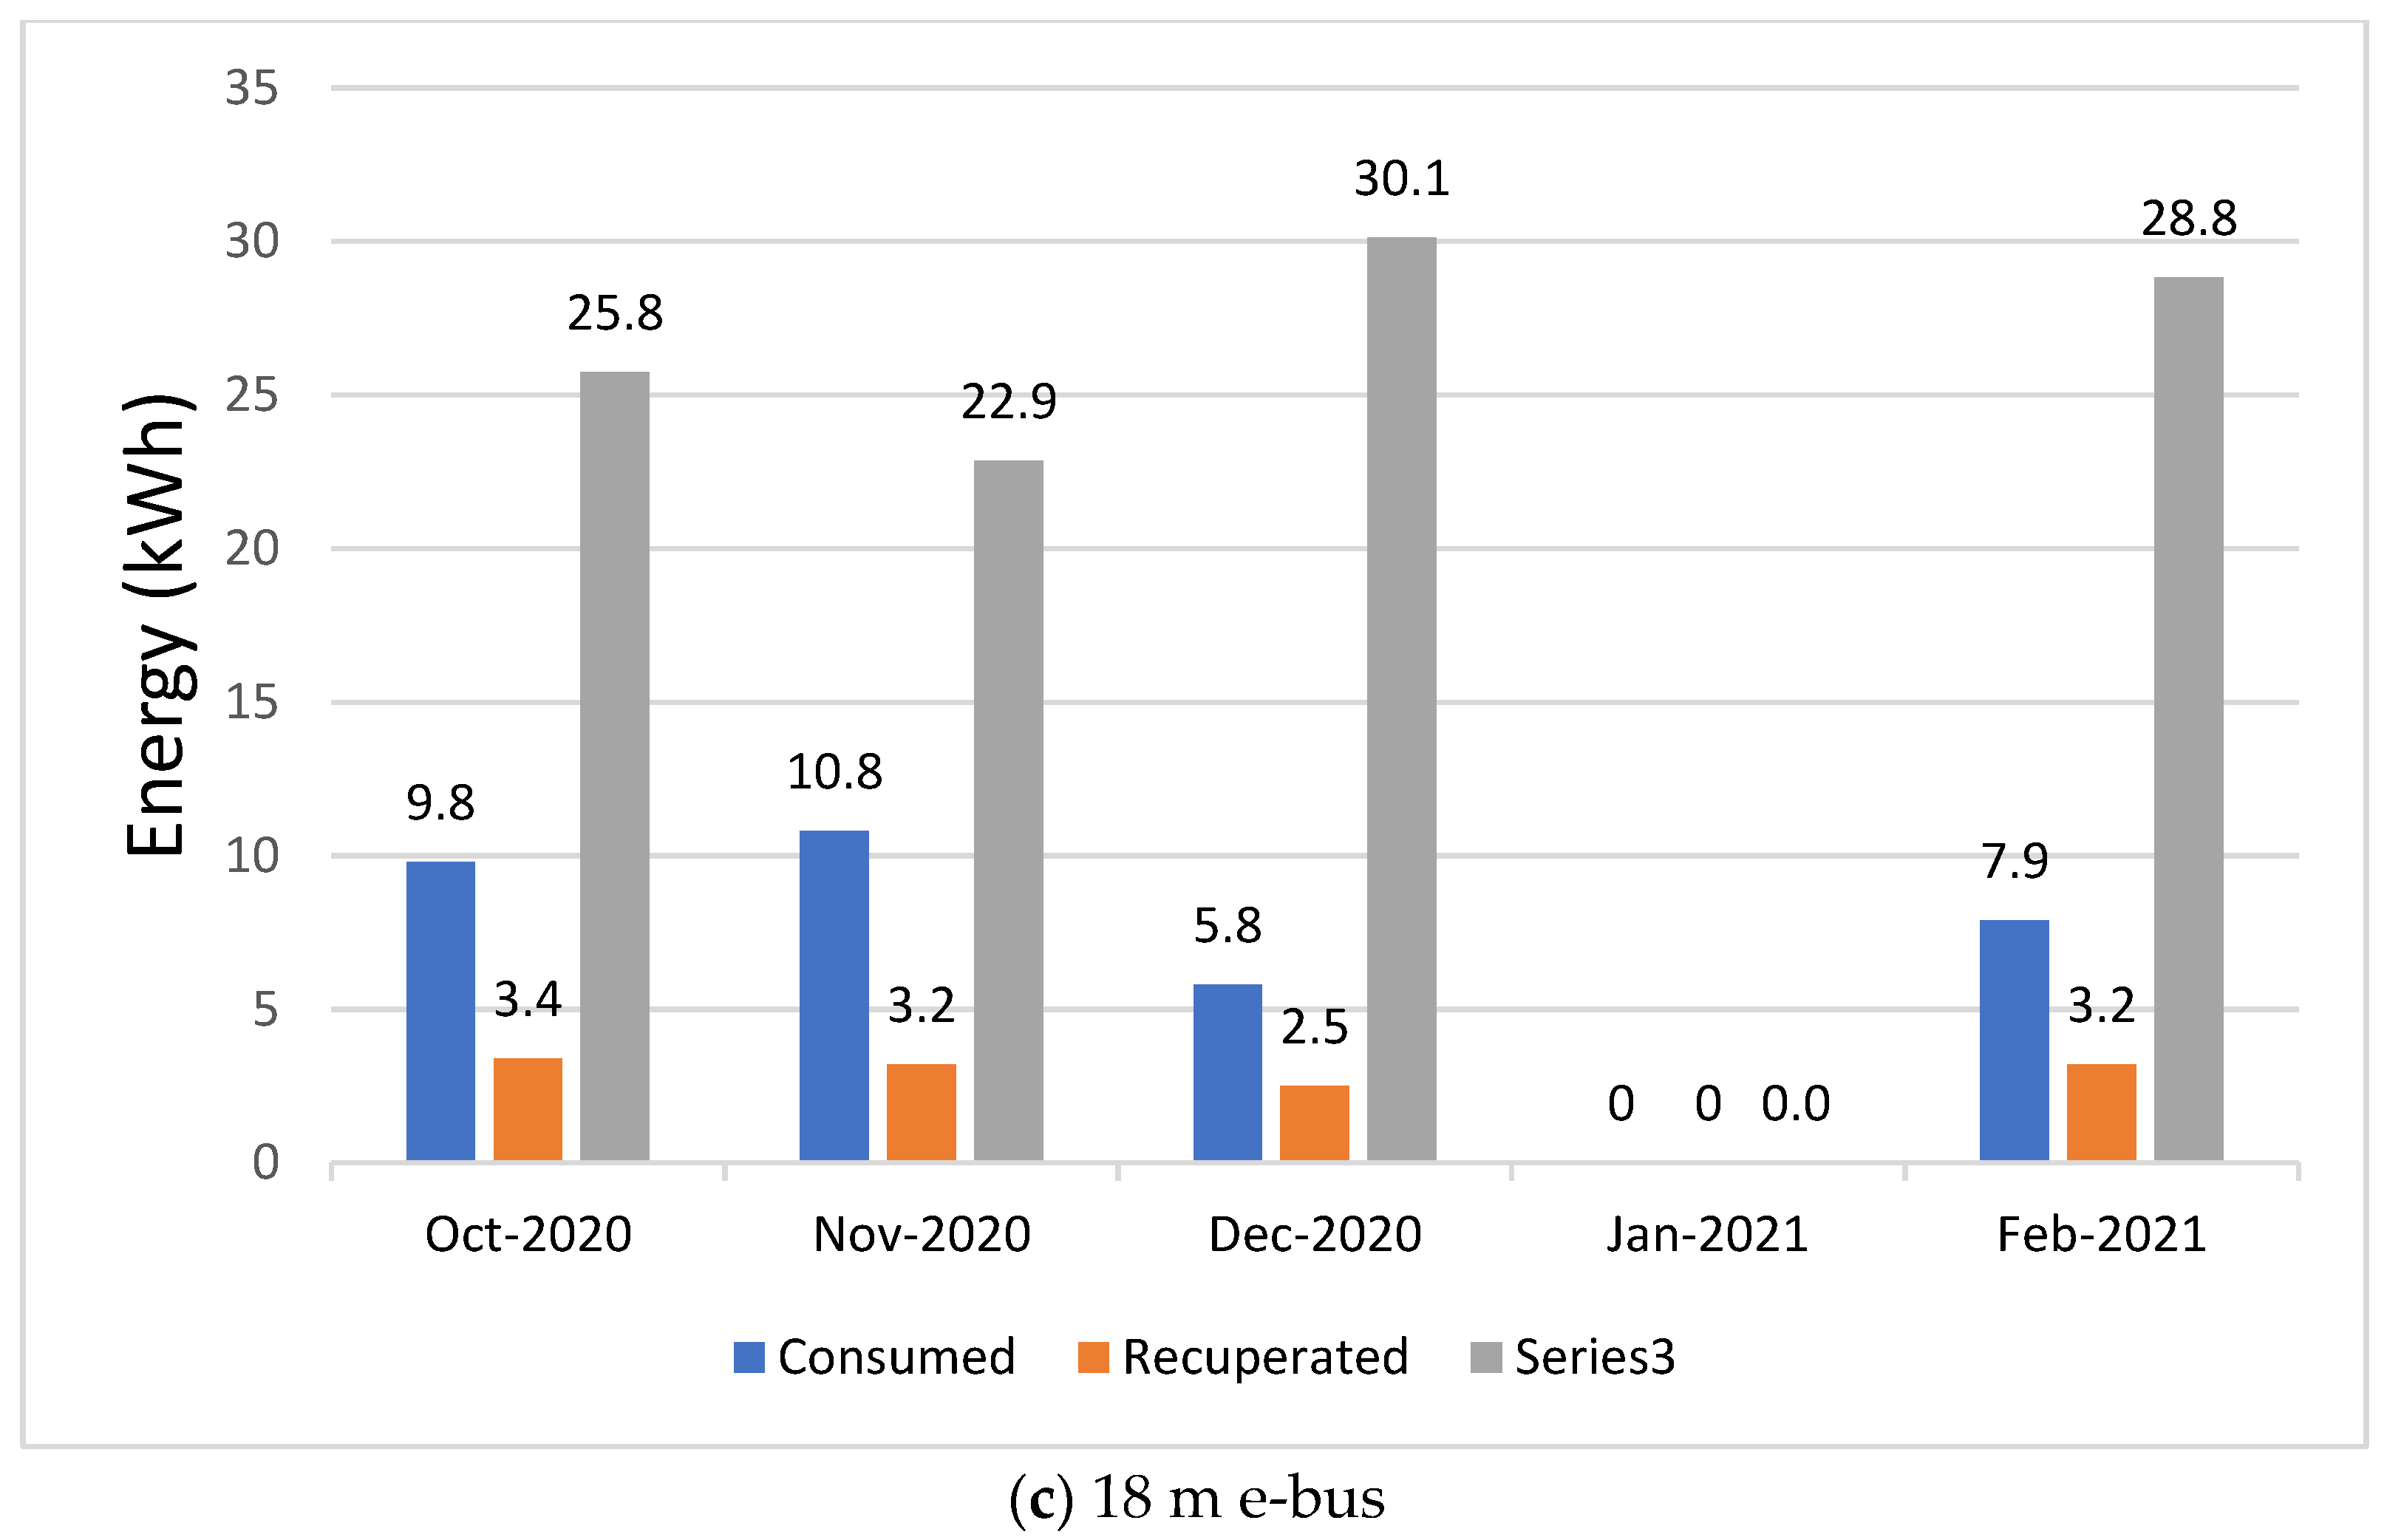
The e-buses are equipped with braking systems for operational cost optimization and efficiency improvement. It was found that the braking system could recuperate around 15–40% of the consumed energy. In addition, the heat generated from the braking system can be used for heating purposes. Furthermore, economic routing can be adopted by the bus operator to minimize the consumed energy and optimize the e-bus fleet operation.
There are 20 plug-in charging solutions based on NC in the depot of the e-bus operator. To minimize the consumed energy, optimal battery packs were installed in the e-buses, which also minimize the total cost of ownership. These battery packs need to be charged frequently. Therefore, 12 pantograph chargers were dispersed in Jaworzno along the e-buses routes. Due to the adopted energy management system and the charging infrastructure, which comply with the network code of the DSO grid, the e-bus fleet has a slight impact on the grid, and does not impact DSO operation. However, smart and standard charging were investigated in this study. Smart charging has less impact on the grid, less charging cost, and prolongs the battery lifetime. Furthermore, the demo e-buses have a considerable impact on CO2 emissions reduction.
Maintaining the appropriate correlation between fast and slow normal charging allows for the full use of traction battery resources. NC is adopted as much as possible in order to optimize the operational cost and improve the TCO, which is related to battery lifetime. The e-bus fleet management could be monitored online to manage all the e-buses actively and efficiently.
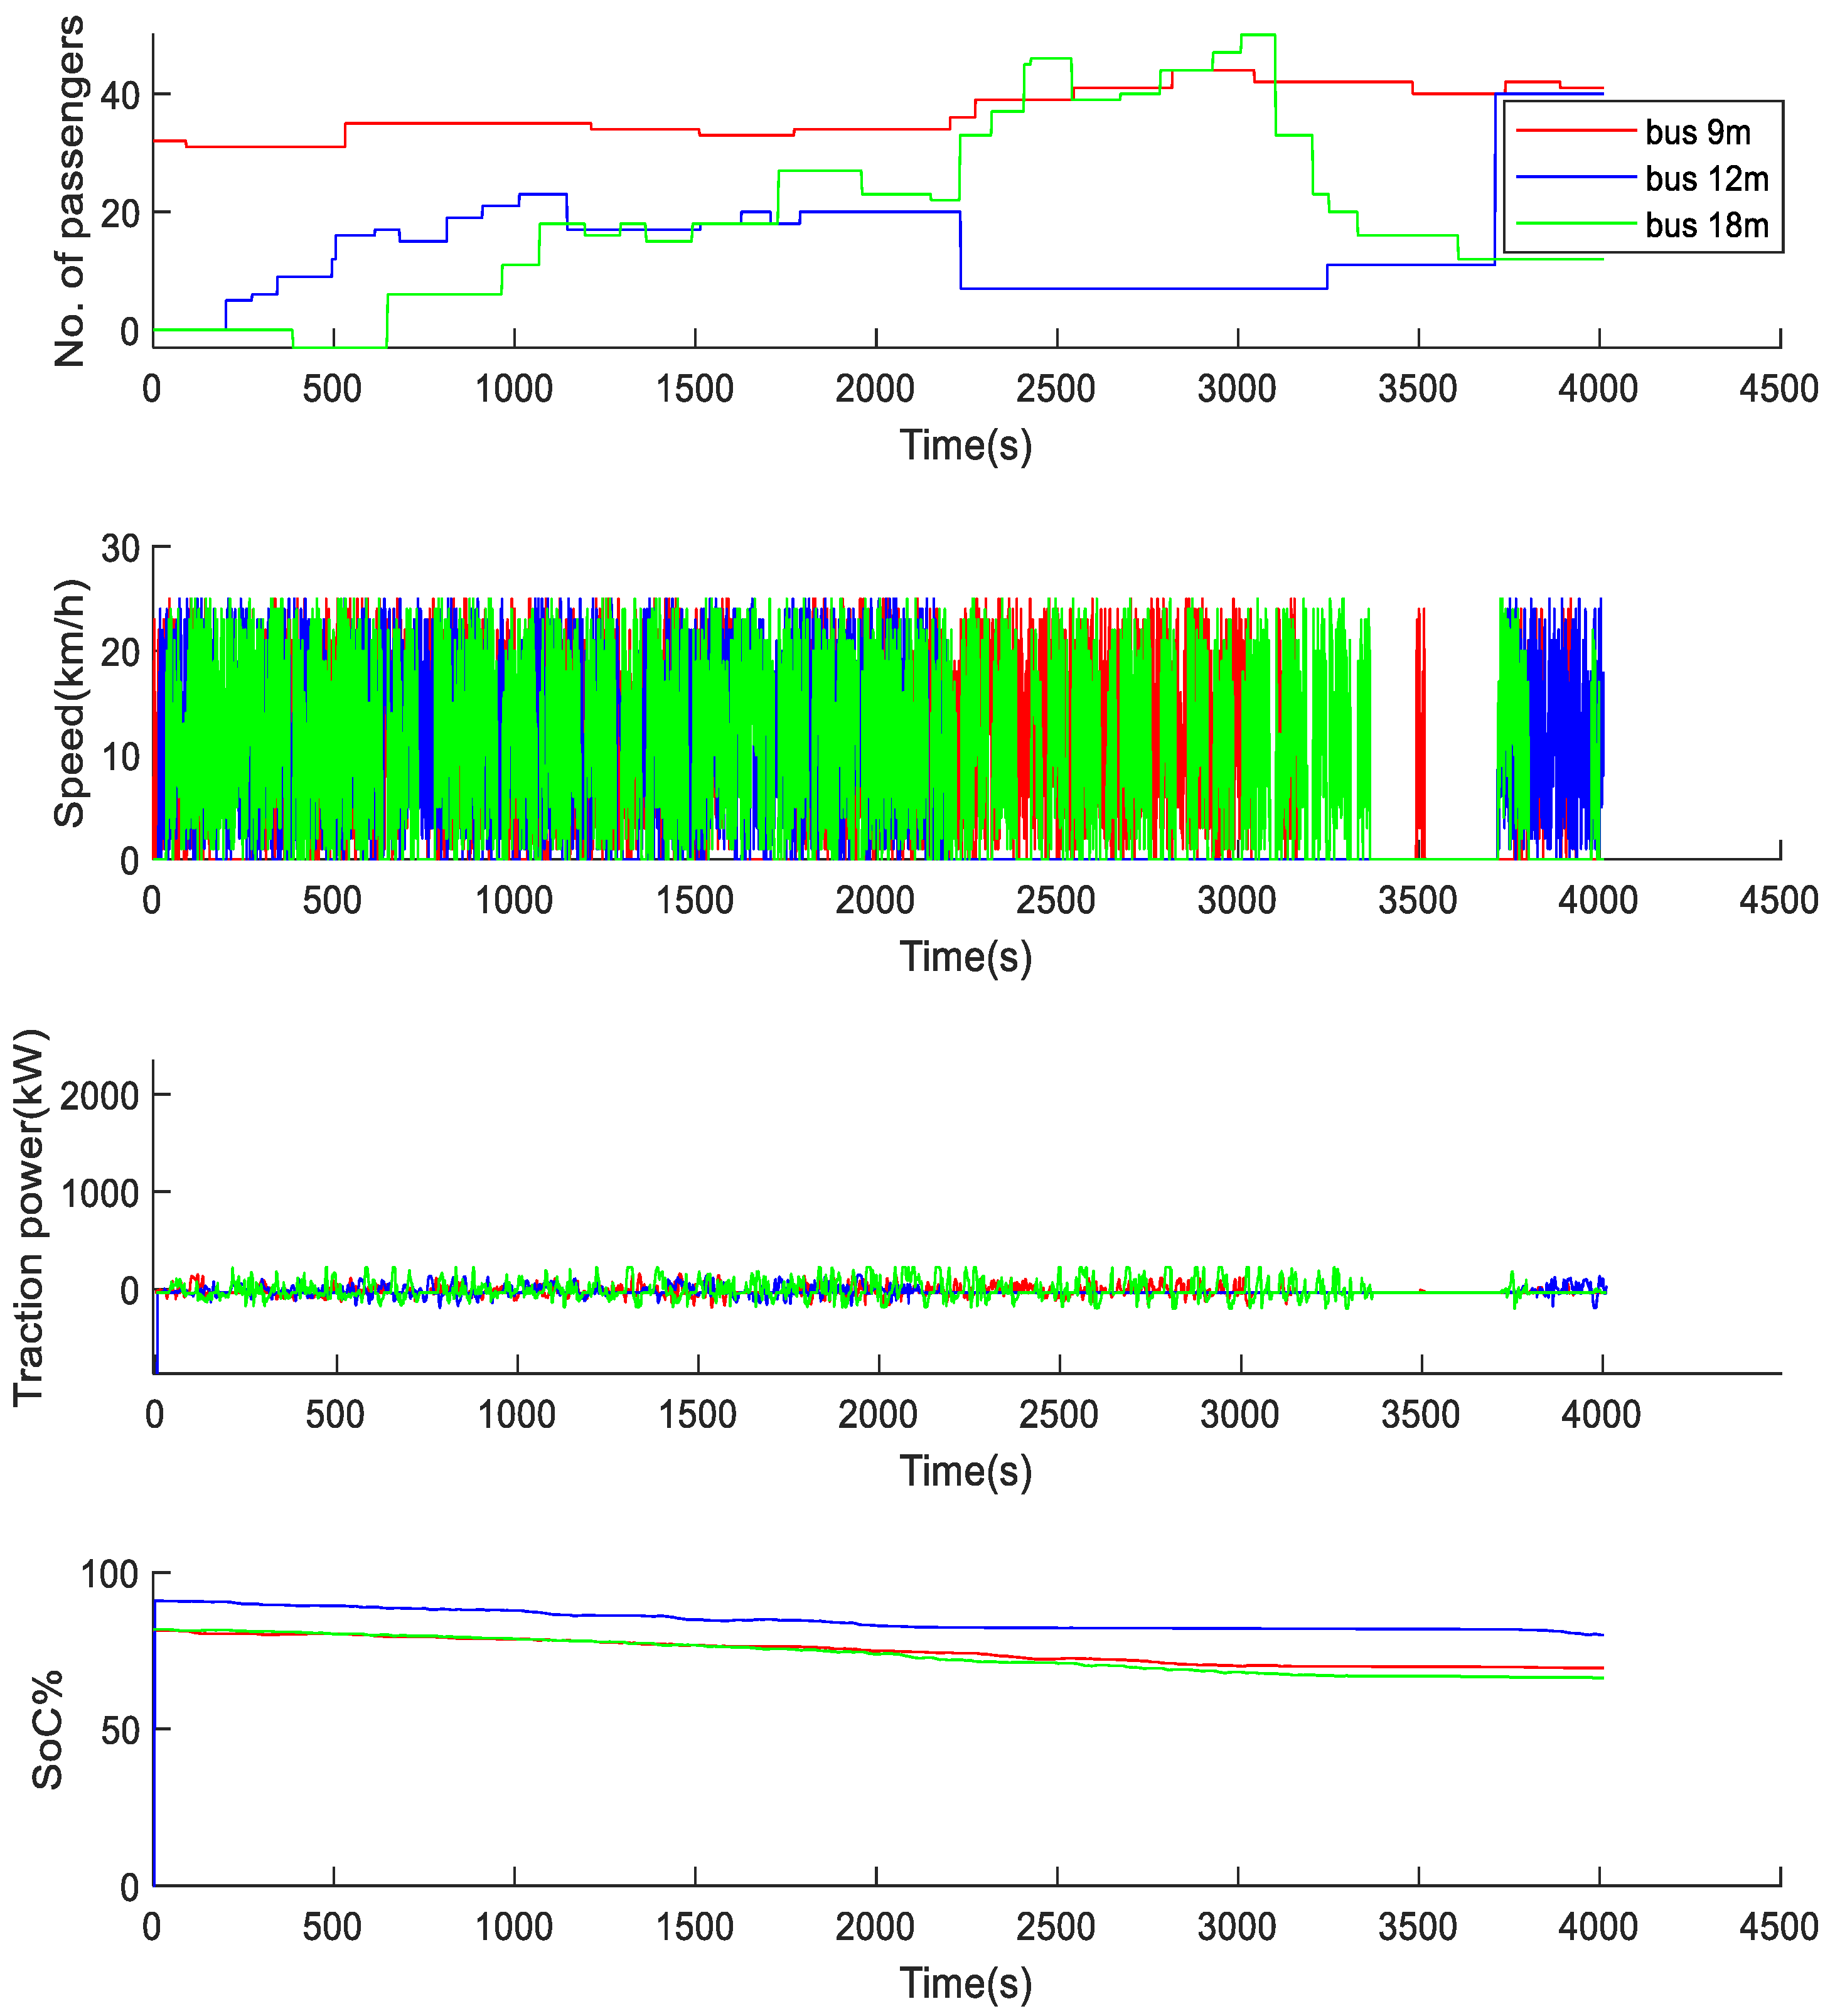
The energy consumed by an e-bus is a function of the number of passengers and internal consumption, which includes the engine power and heating/air-conditioning system (weather conditions). By predicting the number of passengers during the day (hourly basis)/week/year (weekend, national holidays, etc.), the operational cost can be improved by using an e-bus with less length (less consumed power).


 ,
, 


