Article

Awareness of Air Pollution and Ecosystem Services Provided by Trees: The Case Study of Warsaw City

1
Institute of Environmental Engineering, Warsaw University of Life Sciences—SGGW, Nowoursynowska 166, 02-787 Warsaw, Poland
2
Institute of Economics and Finance, Warsaw University of Life Sciences—SGGW, Nowoursynowska 166, 02-787 Warsaw, Poland
*
Author to whom correspondence should be addressed.
Sustainability 2021, 13(19), 10611; https://doi.org/10.3390/su131910611
Submission received: 26 August 2021 / Revised: 22 September 2021 / Accepted: 23 September 2021 / Published: 24 September 2021
(This article belongs to the Special Issue Effects of Global Changes on Biodiversity and Ecosystem Services)

Abstract

:
One of the consequences of the constant urban development in numerous countries is a growing concentration of air pollution, which adversely affects both the environment and people’s health. One of the ways of changing this negative trend is to maintain green areas and trees within cities, as they serve many ecosystem functions, including biological absorption of particles and other types of air pollution. This article provides the findings of a study carried out among the residents of Warsaw, the capital of Poland, in order to assess social awareness of air pollution and the importance of trees. The study of the residents’ awareness was supplemented with the assessment of the parameters of the trees’ capacity for pollution absorption in selected locations performed with the help of the i-Tree Eco tool, which allowed the authors to compare the residents’ impressions on the role of trees in the process of absorption of pollution with their actual potential. The analyses showed that the majority of city residents are concerned with the problem of air in the city, but at the same time failing to notice its negative impact on their health. The majority of respondents were not aware of the role the trees play in the process of pollution absorption, suggesting that there is a real need for raising social awareness of functions served by trees and green areas in urban spaces. The comparison of the city residents’ opinions on the importance of trees in the process of pollution absorption with objective data obtained with the help of i-Tree Eco tool shows that the majority of people’s impressions of pollution absorption by trees in urban areas is correct.

1. Introduction

One of the main environmental challenges, apart from GHG emissions (and their consequences), has been air pollution caused by mineral or anthropogenic particulates [1] which cause adverse effects on humans and the environment [2,3,4,5]. The types of air pollution with the most detrimental influence on people’s health are: particulate matter (PM) [3,5,6,7], nitrogen dioxide (NO2), ozone (O3) and sulphur dioxide (SO2) [8,9,10,11]. Air pollution causes respiratory and circulatory problems and contributes to premature death [12,13,14]. As listed in the available statistical data, outdoor air pollution has contributed to 0.5 million premature deaths in the EU and 4.2 million cases globally [15,16]. Suspended particulate matter (PM) is one of the main sources or air pollution in cities [17,18,19], which is why its direct impact on people’s health has been observed in industrial and urban areas. It is estimated that due to growing migration from rural to urban areas the percentage of the population in the cities will reach 60% by 2030 [20], 70% on a global scale [21] and 82% in the EU [22] by 2050. Despite the fact that the process of urbanisation provides numerous social benefits, it can be seen as a significant factor behind environmental issues [23,24] such as the Urban Heat Island (UHI) [24,25,26,27], caused by changes in land use and construction developments [28,29]. Research conducted by the World Health Organisation in more than 3000 cities found that outdoor air pollution has grown 8% globally in the last five years [15]. One of the factors which reduce the negative consequences of air pollution in urbanised areas is the tree cover [30]. As air pollution grows in city agglomerations, the subject of trees in urban management grows in importance. Urban trees provide various ecosystem services to the residents [31]. Some of their functions include filtration of atmospheric air and accumulation (retention) of toxic substances [32,33]. Research shows that one of the most effective methods of elimination of suspended particulate matter in the environment is the presence of vegetation [34,35]. Data provided by the UN [22] shows that more than half of the world’s population currently lives in urban areas. In Poland, the percentage of people living in cities is almost 60% [36]. It is vital to conduct research on the level of awareness of the residents of urban areas in the scope of air pollution and its impact on health, and, in related matters—their knowledge on the ecosystem functions of trees as biological absorbers of particles and other impurities [34]. Raising awareness in the scope discussed here is necessary in order to increase the surface of green areas in urban agglomerations. This awareness is probably lacking in numerous countries (e.g., Chile in North America) [37]—most definitely in Poland, where vegetation is frequently removed from public spaces and replaced with concrete (as shown on the examples of revitalisation of main squares in numerous Polish cities and towns, such as Włocławek, Kutno, Białystok, Kielce, Skierniewice, Wągrowiec, Warsaw) [38]. This phenomenon is confirmed by the continuous increase in the loss of trees in urban space in Poland, which in 2019 amounted to 125,706 pieces and accounted for 141% of the loss of trees in 2004 [39]. Social awareness surveys on air pollution have been conducted by many authors in various countries [40,41,42,43], however, not to a large extent in Poland [44,45]. Moreover, none of the works referenced here draw attention to the social awareness on ecosystem functions of trees and their role in reduction of pollution, hence why the aim of this study is to assess the social awareness of air pollution among city inhabitants and investigating the functions realized by trees in large cities taking into account the example of Warsaw. The survey consisted of two stages: The first one involved interviews on city residents which were used to assess the social awareness of air pollution and functions of trees. Stage two of the research focused on tree inventory in two specifically selected locations in the city which provided data necessary to establish the parameters of the trees’ capacity to absorb impurities. This approach allowed the authors to confront the residents’ opinions (and misconceptions) on the functions of trees in the city with an objective assessment of the potential capacity to absorb impurities.

2. Literature Review

2.1. Ecosystem Services and Benefits Generated by Trees

Ecosystem services may be described as conditions and processes provided by natural ecosystems and their species by means of maintaining and enriching people’s lives [46]. Ecosystem services may also be defined as benefits drawn directly and indirectly by the members of communities from ecosystem functions [47,48]. Due to steadily increasing urban populations [15,21,22] and limited green areas, the urban ecosystem functions, which create a link between the cities and the biosphere, improve public health of the residents, reduce noise levels, purify wastewater systems and reduce the urban ecological debt [49,50,51] have become endangered [52]. Green infrastructure provides the residents of urban agglomerations with social and environmental services in order to improve their quality of life serve as generators of urban ecosystem services [53,54,55,56,57]. In addition, as one of the major elements of the social and ecological urban systems, green infrastructure has become an increasingly crucial point of reference in discussions on sustainable development and urban planning [49,57,58,59]. Trees at the roadside, in parks, gardens, remaining woodlands and on buildings create the largest segment of the urban green areas [60,61]. Research shows that trees enrich the landscape and play a major role in the process of limiting adverse effects of residential estates on the environment [62]. These benefits are described as ecosystem services provided by trees and provide other advantages: economic, health, social and visual benefits, but also create the process of environment regulation [63]. In practice, trees and other elements of the green infrastructure in the cities are used to manage stormwater runoff [64,65], provide solutions to problems with impermeable surfaces [66] and capture rainwater before it reaches stormwater systems [66]. They are also useful in the process of lowering energy consumption levels; indeed, trees growing to the south and west of houses contribute to lower costs of cooling the buildings [67]. According to other authors, trees also positively influence public health by increasing the quality of air, thus encouraging physical activity of the residents, lowering stress levels and improving social relationships [68]. A study showed that residents of districts with better access to parks and green areas play more sports [69,70], while it has also been proved that a higher number of green areas positively influences the possibility of taking walks in the neighborhood [71], with trees, and access to them, contributing to lower levels of stress [72,73,74,75]. Independent studies showed that women who lived in close proximity of trees (within a 50-metre radius) were less likely to give birth to children with a low birth weight [76,77]. At the same time, it must be noted that the trees which provide ecosystem services may also damage the infrastructure elements and cause allergies [49]. Appropriate urban planning in line with sustainable development should take into account the correlations between the residents’ attitude towards the green areas and their influence on the development and management of the green urban infrastructure [78,79,80,81].

2.2. Social Awareness in the Scope of Environmental Benefits Generated by Trees

Trees in cities have various levels of importance for the society. Some city residents consider them as an opportunity to stay in touch with nature, while others see them as nuisance [63]. The relationships between the natural environment and people may be considered on the basis of numerous theories of environmental psychology [82]; Ajzen’s theory of planned behavior, Stern’s value-belief-norm theory [83,84] and Rokeach’s theory of cognitive hierarchy are of importance here [85,86]. Homer and Kale, on the basis of the models listed here, created their value–attitude–behavior model, which can be applied in the environmental discourse [86,87]. Attitudes are defined within the model as positive and negative ones (differentiated as preference, affection or dislike) towards certain objects, including trees, among others [88,89,90]. The data shows that people have a very positive attitude towards trees in cities [52,91,92,93,94,95,96,97], which, in combination with the value–attitude–behavior hierarchy model, is applied in research on potential behaviors in the urban space, where specific attitudes of the residents also influence decisions on the green infrastructure [98]. The analysis of the opinions of city residents conducted in the San Juan Metropolitan Area in Puerto Rico shows that city residents are able to identify numerous ecosystem services provided by the green urban areas [99,100]. The findings show that the perception of ecosystem services may differ in small areas [99]. The most popular ecosystem service listed by the visitors of Plaza de Convalecencia was the landscape value [100]. A cross-sectional study with data gathered in London [52] shows that the number of antidepressant prescriptions was lower in areas with higher street tree density [93]. A study conducted in the Netherlands focused on green street areas showed their positive influence on the general health condition and mental health of the residents [94]. Research conducted by Peckham and others [95] shows that the residents of Halifax and Calgary present various attitudes and ways of perceiving of urban trees. During their commute, some residents used the green urban areas, and many of them named birds singing as a calming factor. Keeping the residents informed about the correlations between green area management and the ecosystem services may contribute to the application of holistic strategies in green management [101]. There are numerous studies on the ways that the amount and quality of information on ecosystem services influence the decision-making process of policymakers [102].

2.3. Political Efforts Made in Order to Decrease Air Pollution in Urban Areas

The improvement of air quality is one of the main tasks of environmental protection institutions [103]. Air quality policies vary depending on the country and its regions, and rich countries tend to introduce more rigorous restrictions and advanced strategies in order to reduce air pollution. Developing countries make use of existing standards and practices used by the United States and the European Union, the leaders in the field [104].
In 1968, the World Meteorological Organisation developed an air pollution level monitoring program. It served as the basis for the first global network of Background Air Pollution Monitoring, which provides information on the impact of pollution on the climate [105]. In the 1970s, the air quality and its protection became a subject of international priority in the field of environment protection. The OSCE (Organisation for Security and Co-operation in Europe) Final Act included information on transboundary air pollution and the necessity of close cooperation among countries in order to maintain air quality. It was noticed that pollution emissions in one country had a negative impact on air in other countries. The Convention on Long-range Transboundary Air Pollution (LRTAP) was concluded in 1979, and its main objective was the protection of people and the environment against long-range air pollution by means of limiting emissions and reducing pollutant level [106].
Urban air quality policy often combines methods aimed at discouraging the use of private cars with activities meant to increase the use of less emission-heavy means of transport as more desirable ones [107]; such actions are implemented in the form of infrastructure investments in bicycle route networks and public transportation systems. While these systems generate high costs over a short period, they enable—and facilitate—a long-term change in behavior which, in turn, results in lowering the level of traffic-generated pollution [107].
It is worth mentioning that low emission zones (LEZ) are created within urban agglomerations. These are areas where limits on vehicle use were introduced in order to reduce exhaust emissions, and represent a very popular measure to improve air quality in the United Kingdom, Italy, Sweden and the Netherlands, among others [108]. Limitations usually apply to Diesel-powered utility vehicles and very old cars which produce a large amount of pollution [109]. Countries such as Singapore are planning to create integrated transport hubs, which will provide easier access to different means of transport, for example, switching from a bus to a tram [107]. In 2017 a transport hub which links a bus terminal, a train station and a bicycle station was opened in Port Talbot in Wales [110]. In San Francisco, employers are obligated to encourage workers to use bicycles, carpooling or public transport by offering transport cost tax deductions [111]. Speed limits may also serve as a method of air quality control near roads [112] and are included in air quality plans in several European countries [113].
Information and marketing are other crucial activities which resulted in improved social awareness and compliance with air quality regulations [114]. Actions in Singapore may be an example of raising social responsibility in the scope of air quality improvement: Community and youth for environment events are held yearly, while The Green Champions campaign was launched in the Royal Borough of Kensington and Chelsea in order to educate its residents on energy efficiency and pollution reduction issues [111], and a 100-metre-tall air purification tower has been built in Xi’an in China [115]. Reagents such as NO2 and absorbent substances are also being tested in several countries, such as the Netherlands, Japan and Great Britain [116]. Attempts at the development and improvement of air quality monitoring networks are also being made in China and cities of UE. The Chinese government has built a nationwide network of monitors tracking levels of PM2.5 where the data are made publicly available and can be checked by any smartphone user [117]. Cities in Poland also implement actions aimed at the improvement of air quality—e.g., in Poznań, where the municipal police are involved in a fight against the use of inappropriate fuel [118]; elsewhere, the Low Emission Reduction Program for the city of Kraków and Warsaw was introduced with the goal of replacing the most harmful furnaces [119,120]. Another program was also prepared for the residents who bear the highest costs involved in the modernisation of the heating system. Further, anti-smog towers which remove PM and purify air are also being tested in the city of Kraków [121].
Apart from this, some cities in Poland have implemented tree-planting initiatives, such as the Platanus program in Szczecin [122], aimed at planting air purifying trees or the “Million Trees” app used in Warsaw, which allows the city residents to report spots where trees are lacking [123]. Similar programs, such as re-forestation initiatives and urban forest protection campaigns, have also been implemented in other cities worldwide [124,125,126]. The aim is to increase the tree canopy cover percentage, as applied in the “Million Trees” campaign in New York City [127] or a Melbourne initiative to reach the level of 40% tree canopy cover. In Balder et al.’s study [128], 100 trees per kilometer of road was considered the optimal tree density; indeed, planting trees in cities is promoted as an urban solution [129] which reduces environmental degradation caused by urban development. The aim of these actions is to increase sustainable development of urban areas, to alleviate and adapt to the climate changes and to improve people’s health and wellbeing [63,130].

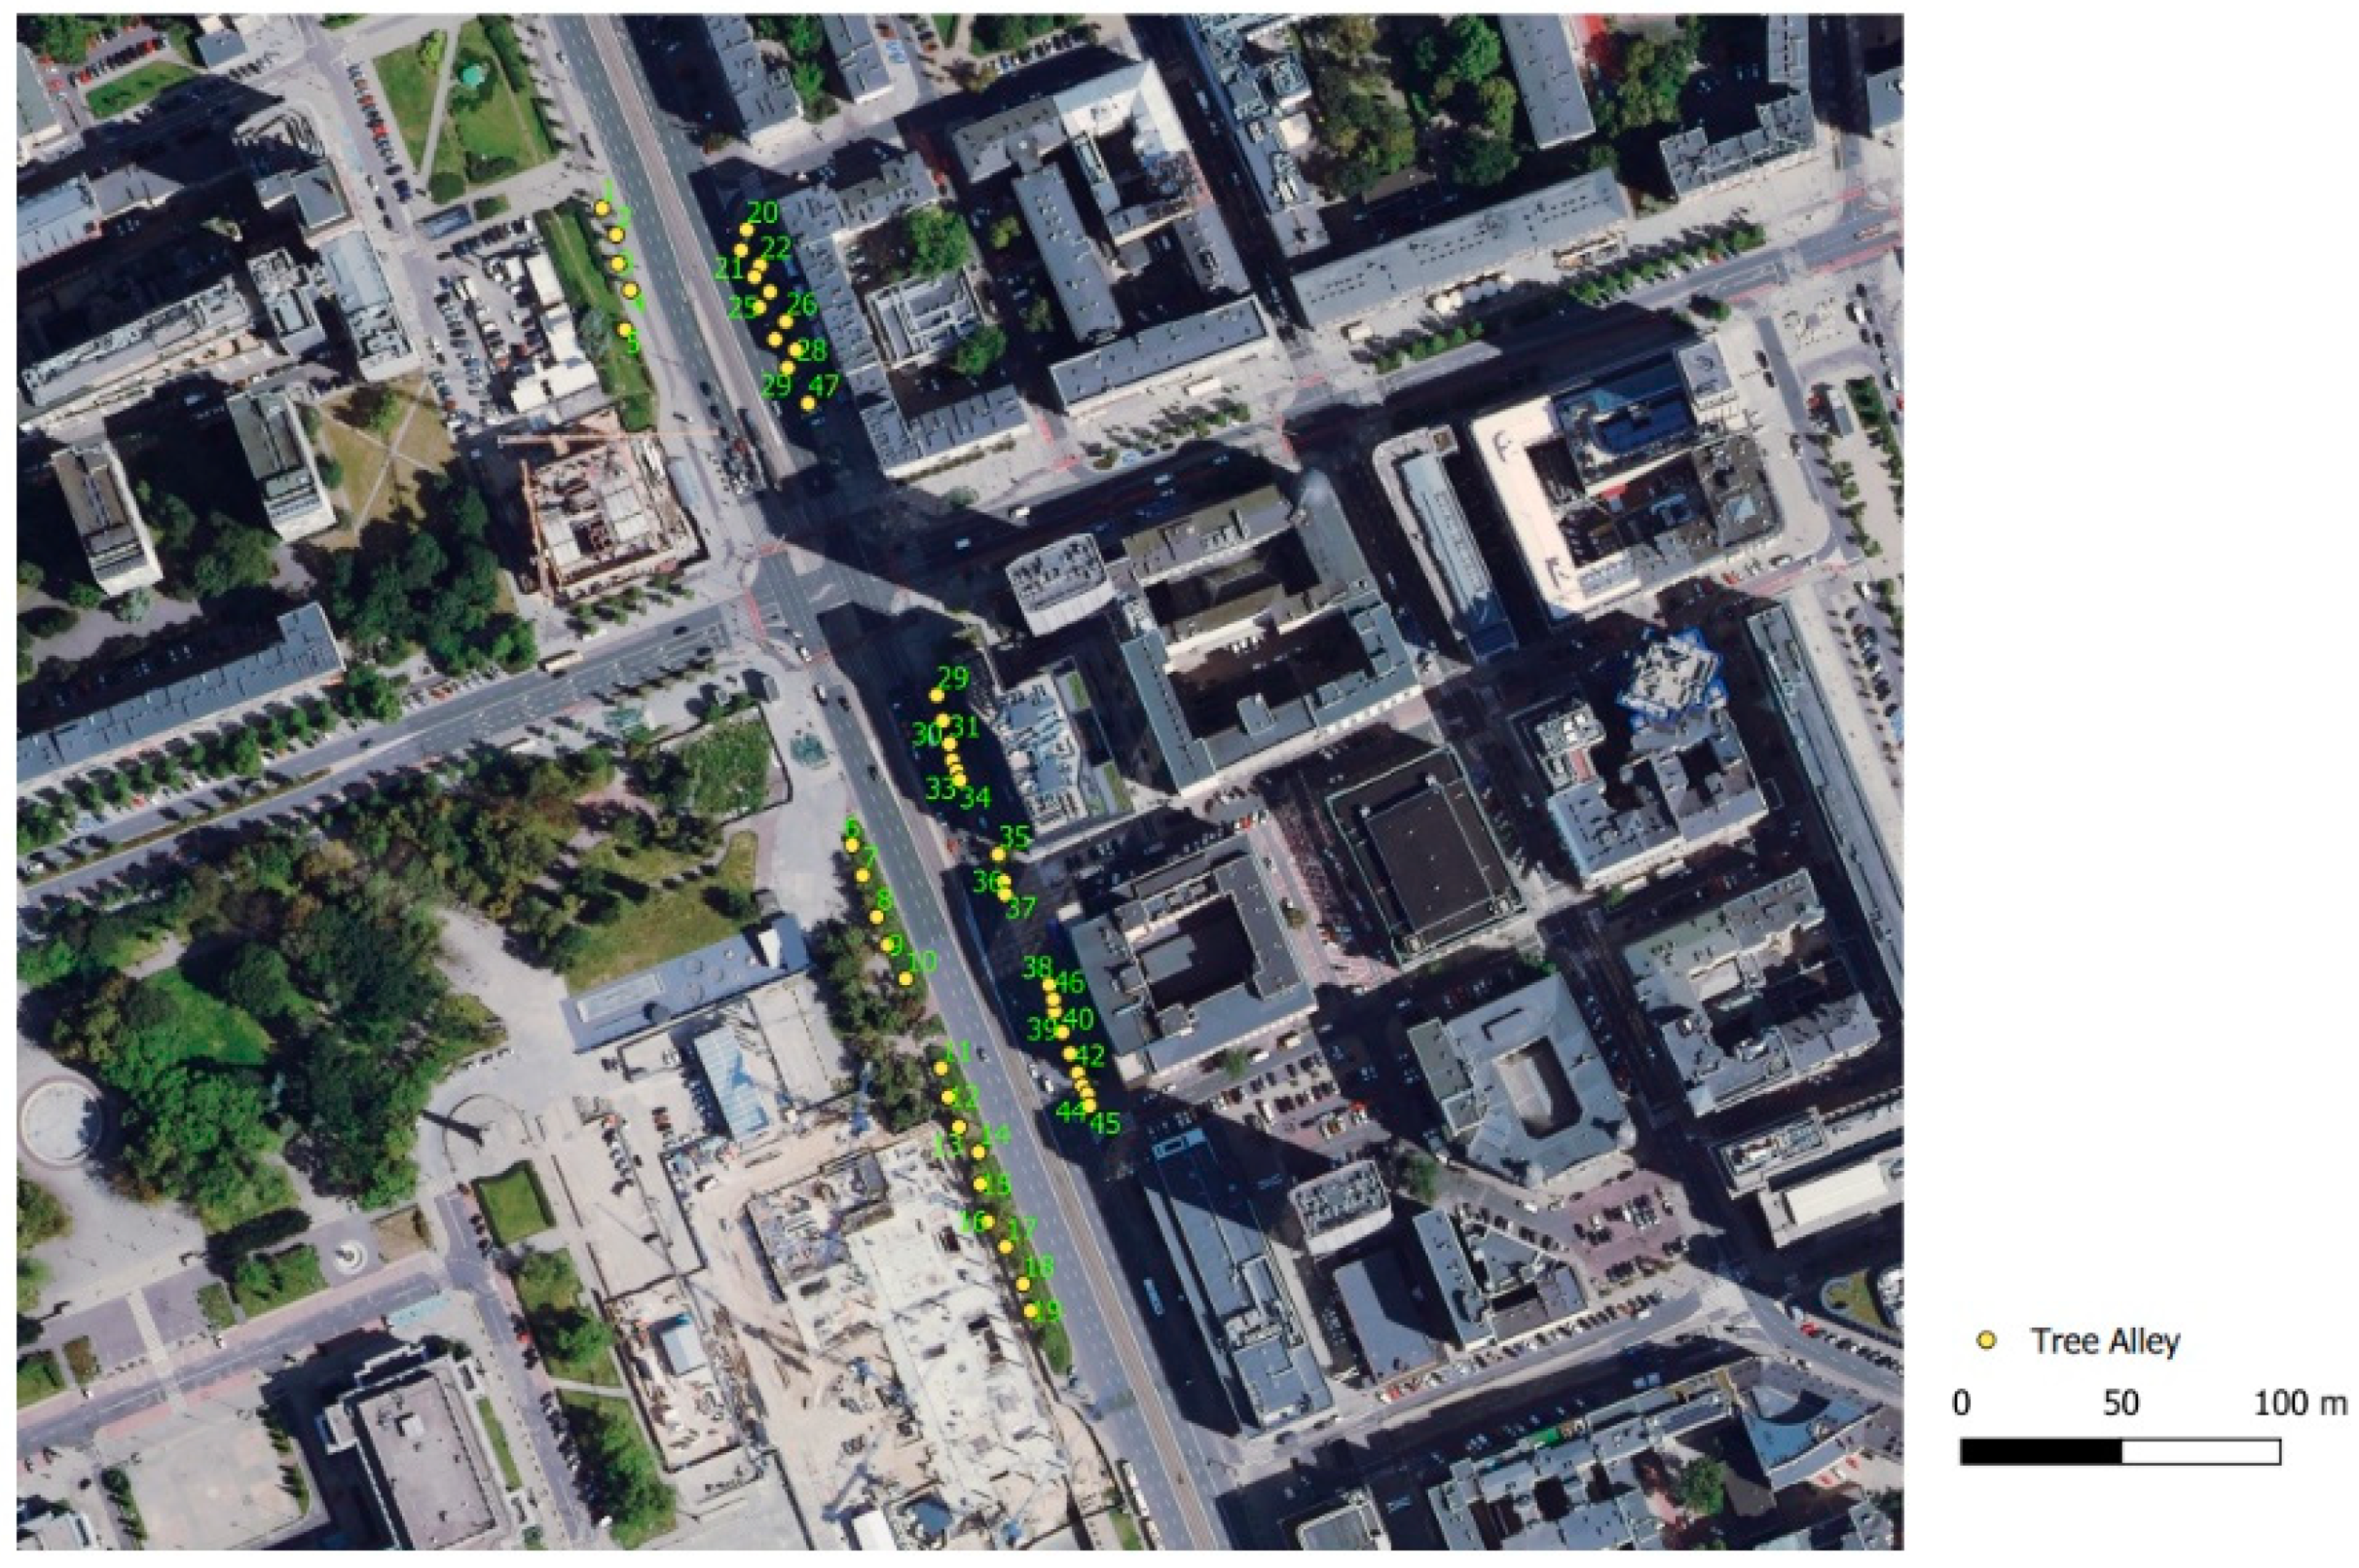
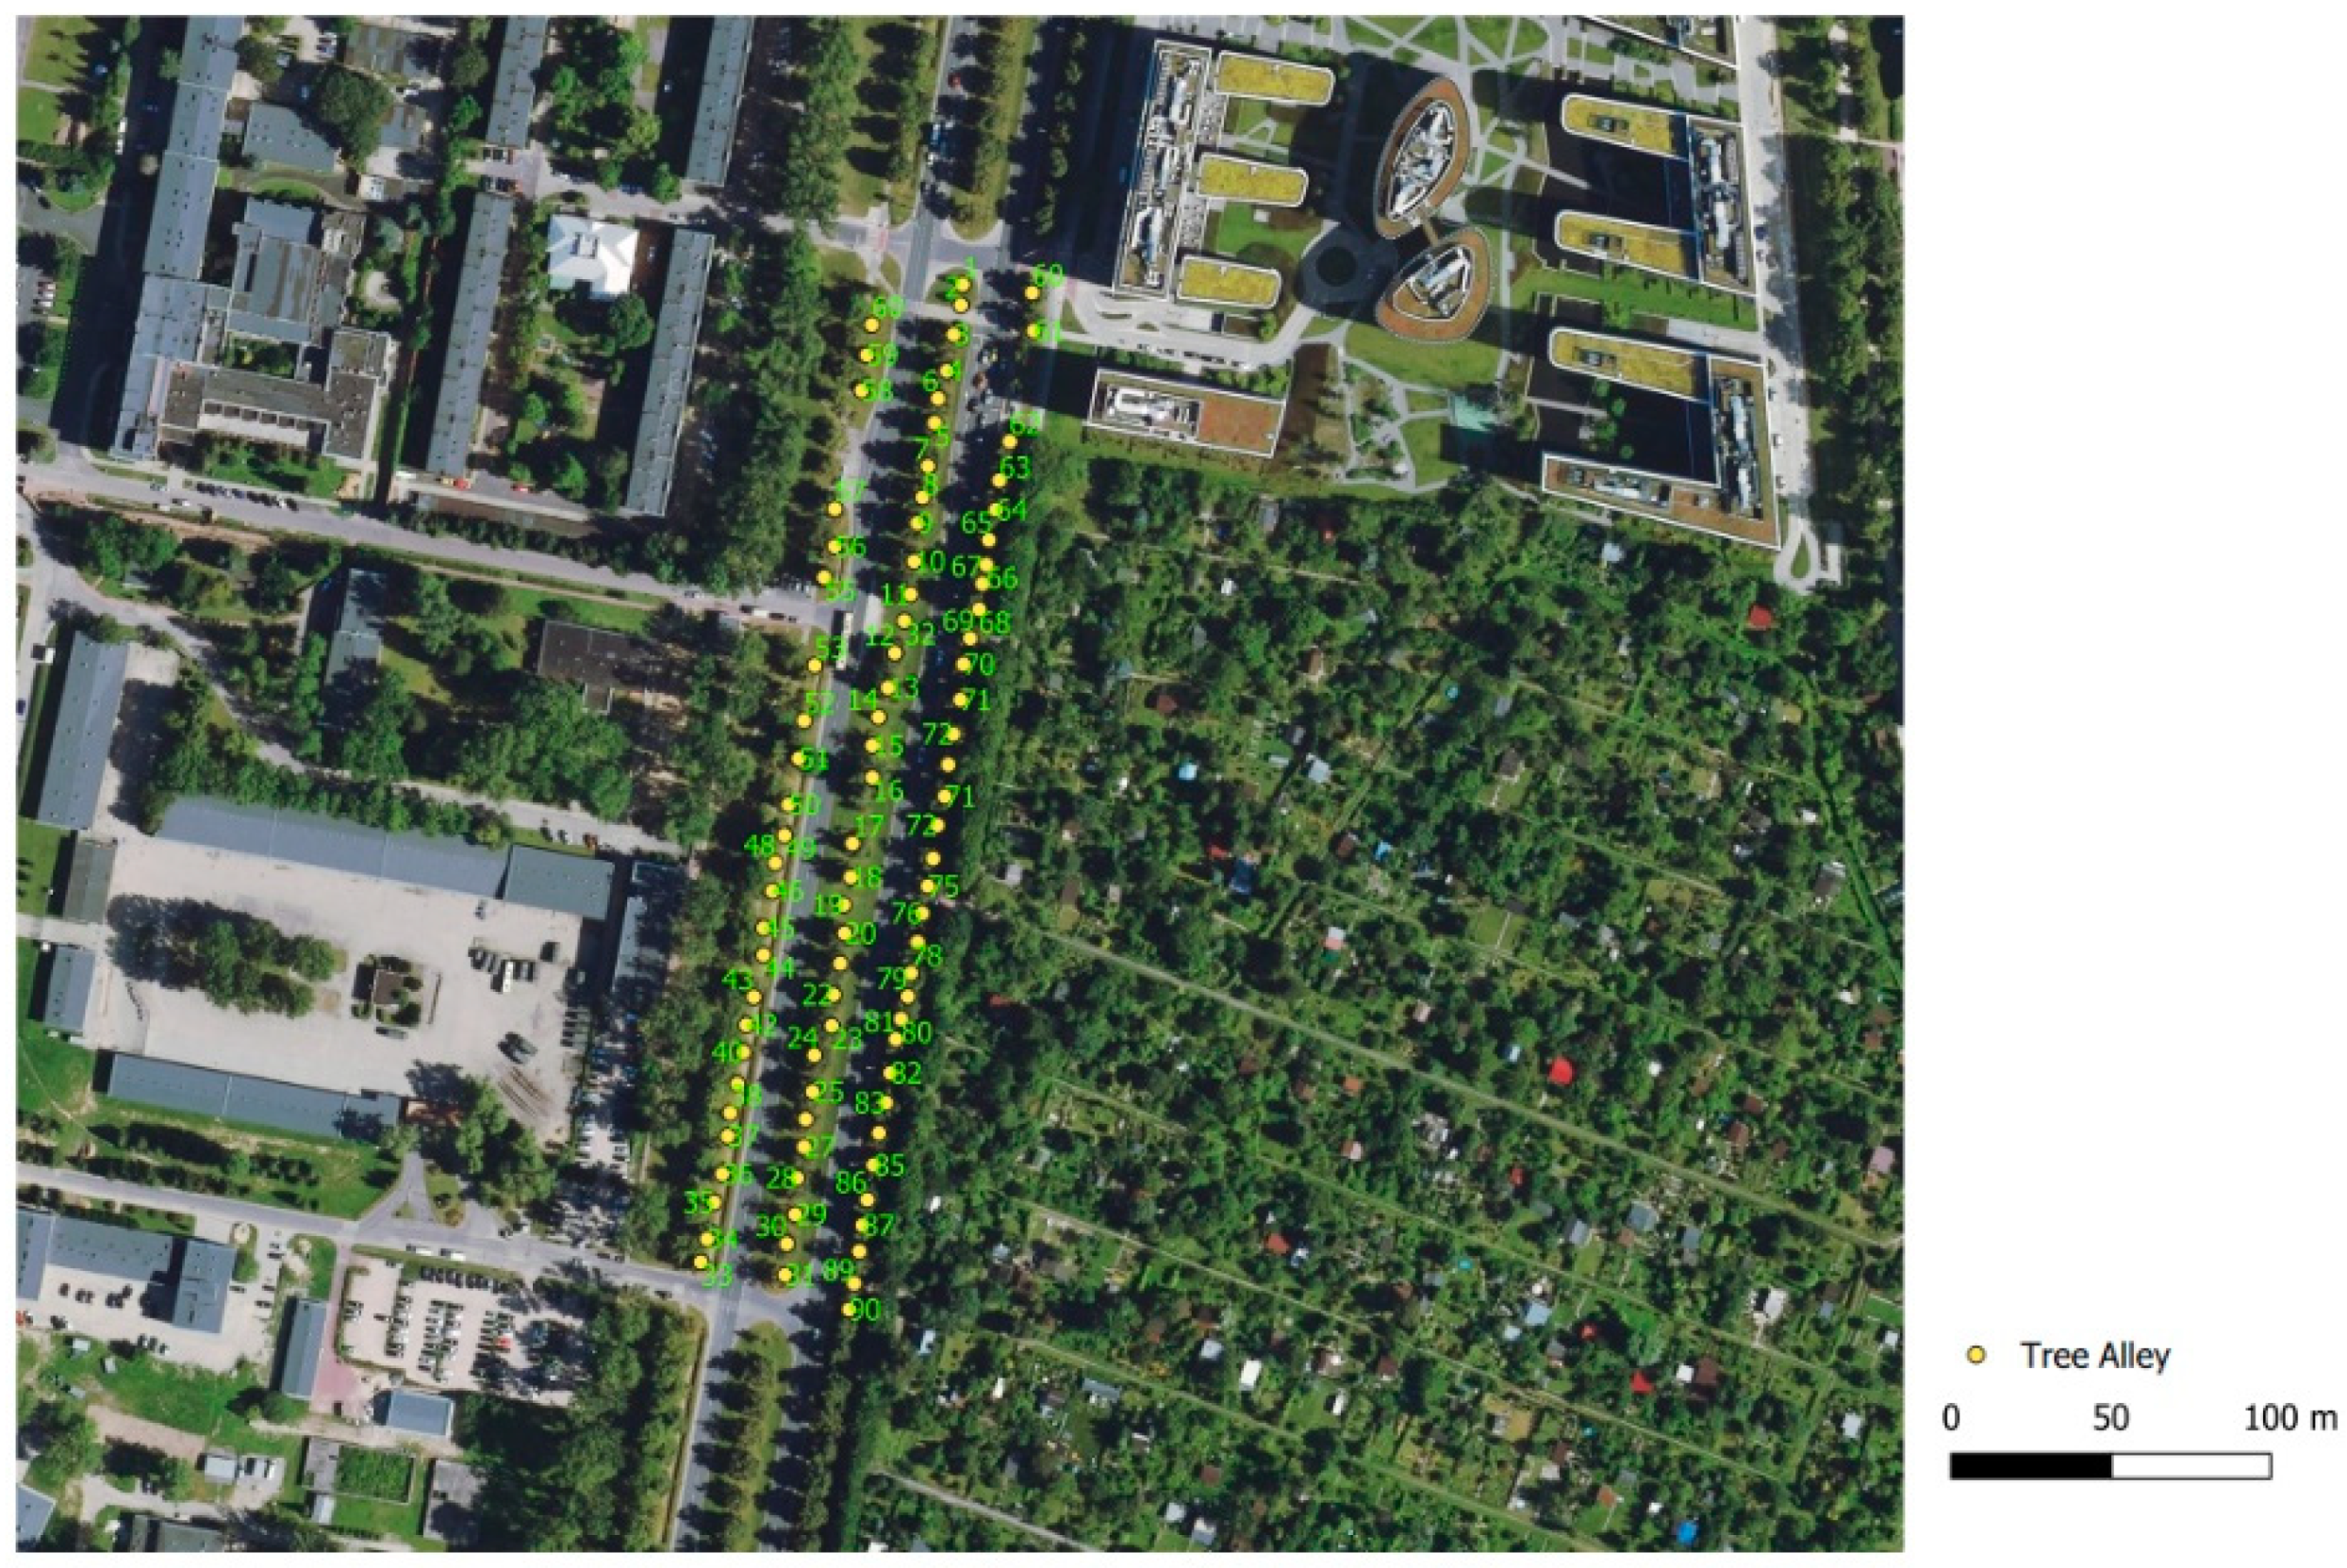
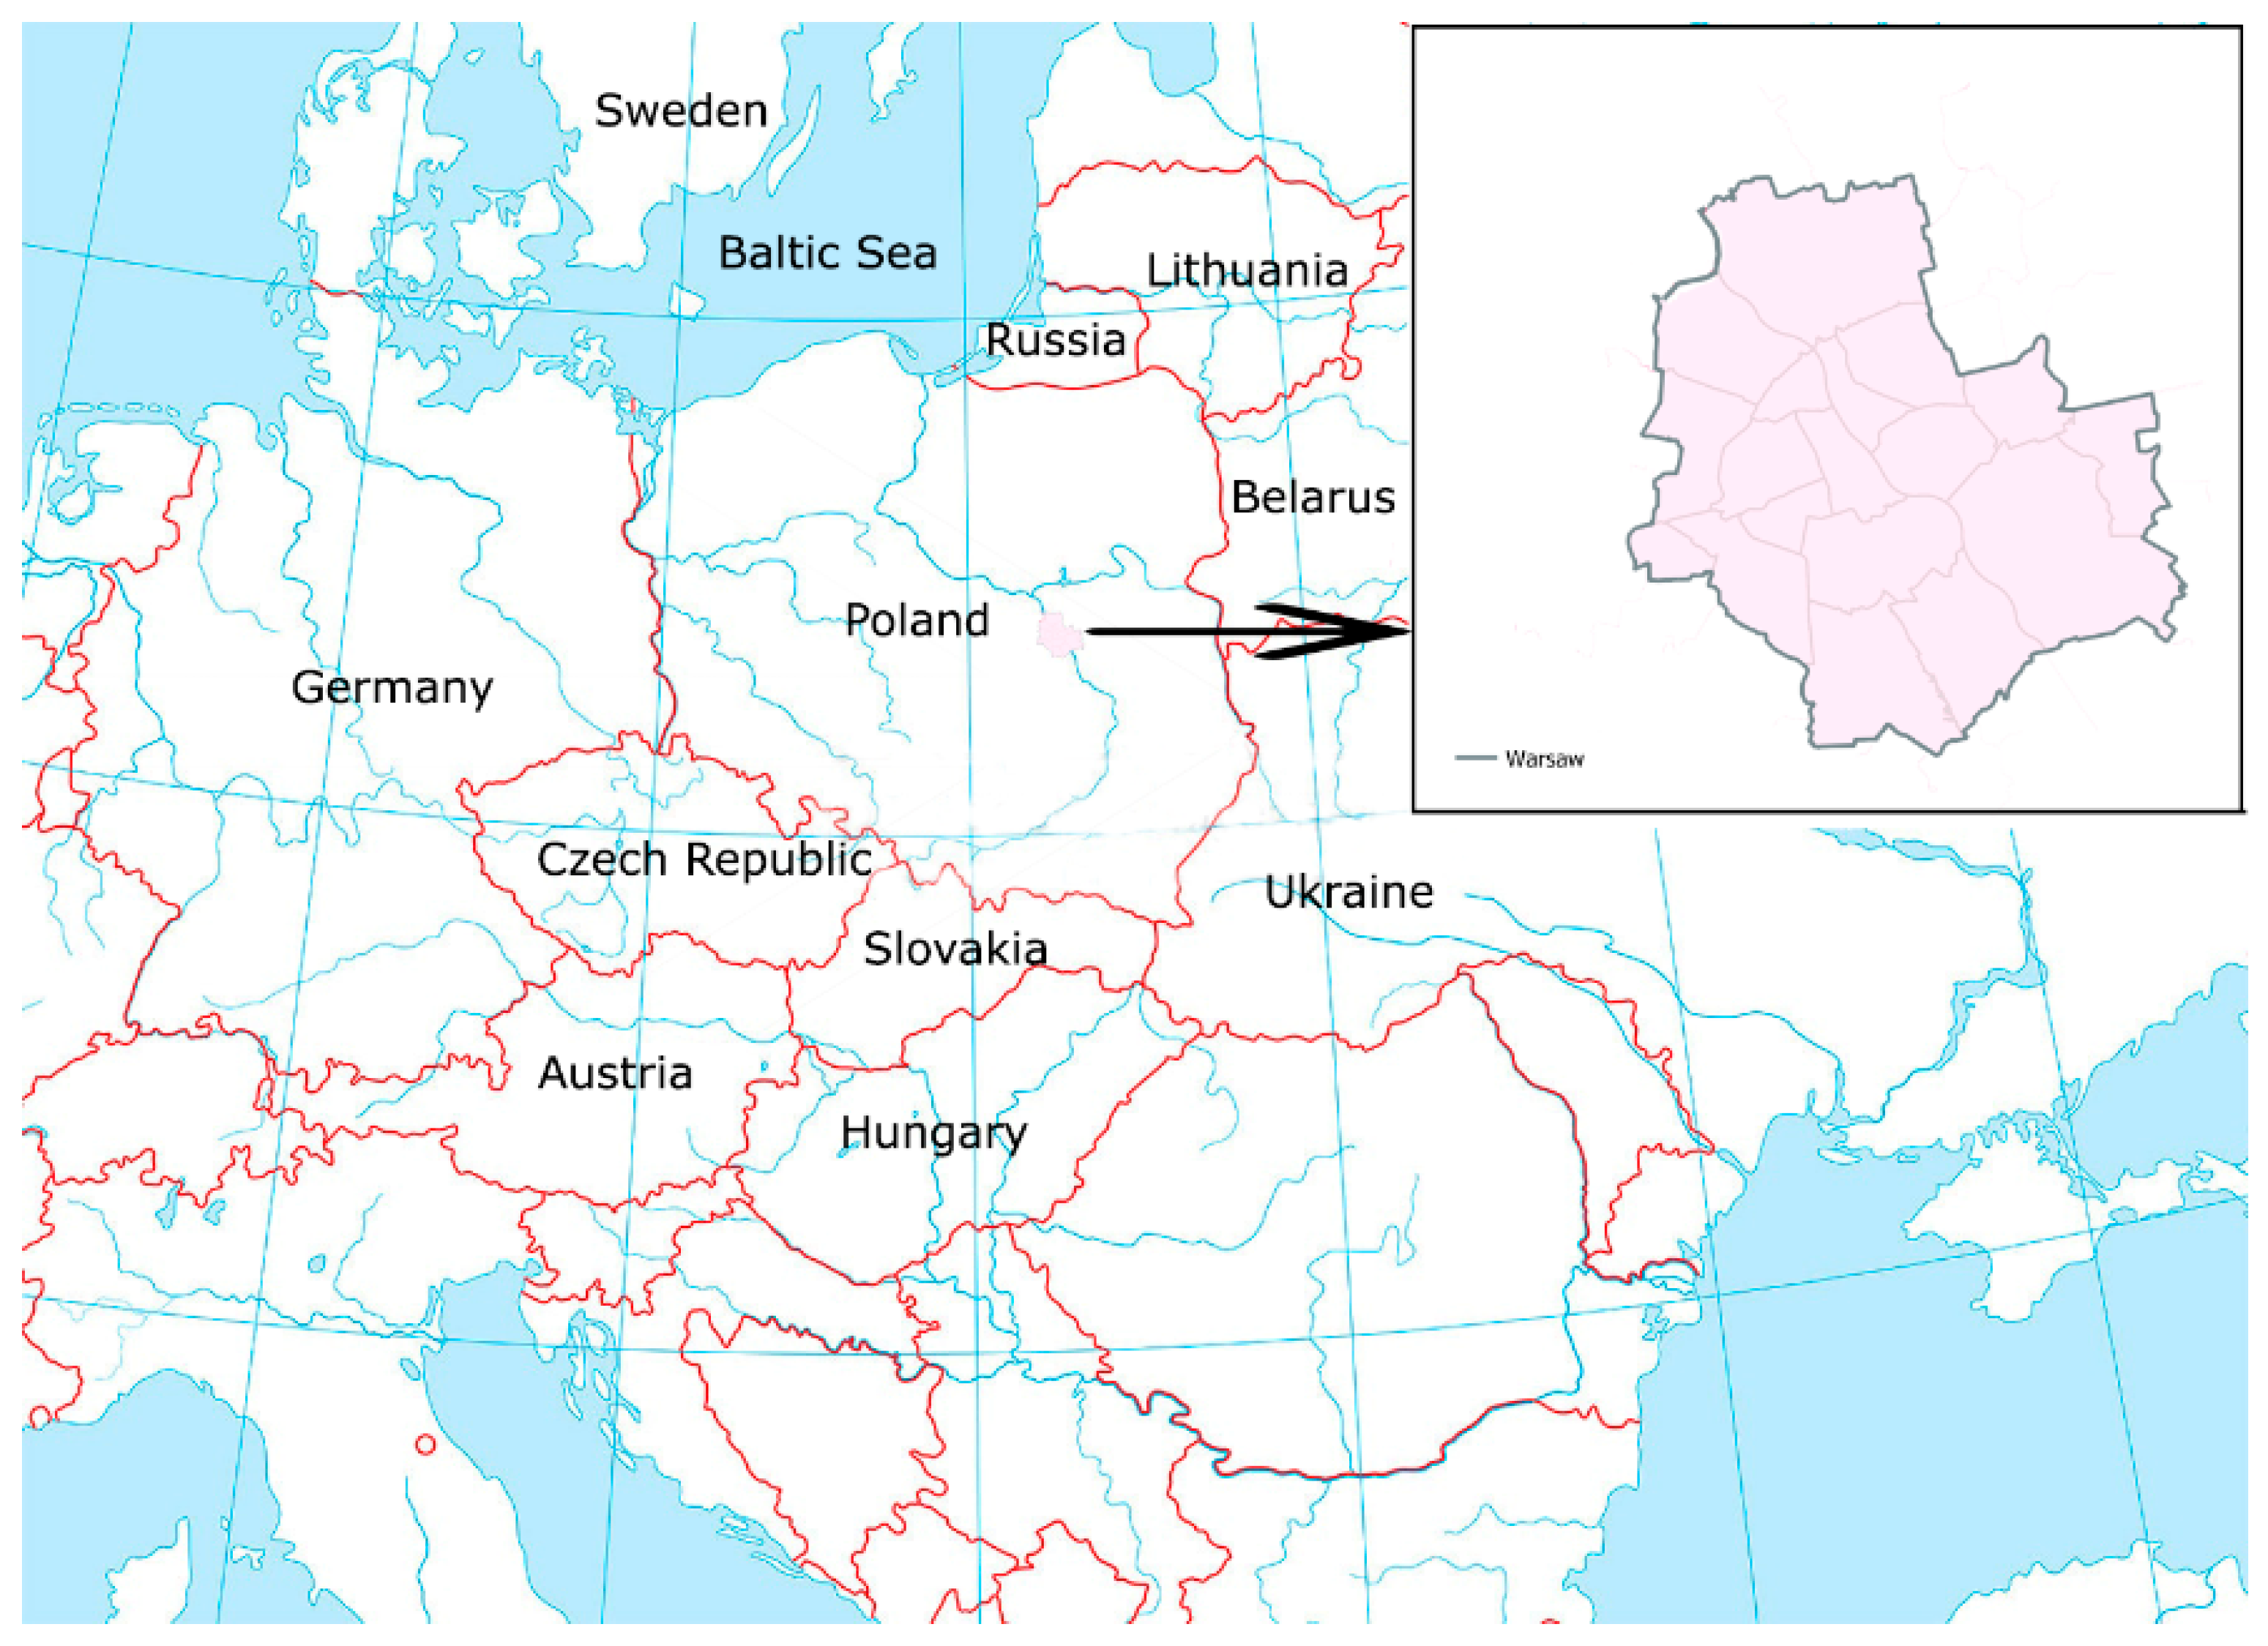
3. Case Study Area Description

Warsaw—the capital of Poland, the largest city in the country, located in its centre as well as in the central part of Europe, was selected for the research area (Figure 1). Similar to numerous Polish cities, Warsaw is listed among the places with the worst air quality on a world scale. In February 2021, Warsaw placed 2nd among the cities with the lowest air quality according to the World Air Quality Ranking [131], where PM10 concentration level was exceeded by 232% and the PM2.5 level by a staggering 364%. This January, Warsaw was the 6th most polluted city in the world according to the Air Quality Index Ranking [132]. One of the most serious smog episodes in the city happened in January 2017, while very high levels exceeding air pollution standards were recorded in the majority of Poland. In Warsaw, the permissible average PM10 concentration level was exceeded on 19–22 days in January 2017 (60–70% of time over the course of the month), while the average PM2.5 concentration level was too high on 25–28 days of the month (80–90% of the time) [133].
The city, with an area of 517.2 km2, is currently inhabited by 1,794,166 people [134] with 56.9% of residents being working age, 18.6% of pre-working age and 24.5% of retirement age [134].
The tree inventory was carried out on two 300-metre-long street sections in Warsaw. The roads were selected as the inventory sites, due to their varied tree cover and their crucial communication function in the city, with heavy traffic on both of them. The streets in question have the same layout (without curves or bends) which does not influence the variability of air pollution measurements. In both cases, the trees are in public spaces and they are easily accessible.
One of the segments (Figure 2)—Marszałkowska Street—is located in the centre of Warsaw, in the neighborhood of the Palace of Culture and Science and the Warsaw Central Railway Station, and there are a small number of green areas and trees around. Concrete squares, wide concrete pavements and commercial buildings are predominant there, and the road fits three traffic lanes in each direction. The tree alley along the street consists mostly of small-leaved linden trees (Tilia cordata Mill) planted between the pavement and the road. There are concrete walkways on both sides of the road and the spaces in front of buildings do not feature any shrubbery.
The second segment (Figure 3)—Żwirki i Wigury Street—is the main communication artery, as it connects the southern part of Warsaw with Chopin airport and the city centre. A closed military area, multi-family residential buildings and allotment gardens are located along the street. Due to the closeness of allotment gardens along Żwirki i Wigury, there are more trees and other plants in the neighborhood of the street. There are two traffic lanes in each direction separated by small-leaved linden trees (Tilia cordata).

4. Materials and Methods

Two principal sources of data were used in the research, namely the i-Tree Eco tool (pollution model) and data collected in field interviews conducted with the use of the CAPI method (Computer-Assisted Personal Interview). In the survey, the interviewer’s contact with the respondent was direct, while the information obtained was stored directly on a mobile device. During the research, the interviewers chose people willing to fill in the questionnaire. Therefore, it can be concluded that the sampling in this case was convenient. Conducting a survey using this method has several advantages, such as their comparatively low cost and quick turnaround time, but it can also undermine the representativeness of the sample obtained [135,136,137]. Given the disadvantages associated with non-probabilistic surveys with respect to sample representativeness, a minimum sample size was calculated. A group of 271 inhabitants of the capital city took part in the questionnaire conducted in the first half of August 2021.
The research allowed us to assess the level of social awareness of air pollution and the importance of trees in big cities. The assessment covered air quality, the impact of polluted air on health, and the ecosystem functions of trees. The assessment of the awareness of the inhabitants of Warsaw was measured on the Likert scale, and summary statistics were applied to further analyse the findings.
Data collected during the inventory with the use of i-Tree Eco tool were used in order to create the pollution model for two representative streets in Warsaw. I-Tree Eco uses the Urban Forest Effects (UFORE) model established by Nowak and Crane [138]. I-Tree Eco is a widely available programming tool developed by the United States Forest Service (USFS); it analyses the structure of urban trees with regard to the composition of species, leaf surface and health condition of trees in order to estimate the value of ecosystem services provided by the trees [138]. I-Tree Eco utilizes the dry deposition component included in the UFORE model to calculate pollution removed by the plants [139].
The guidelines about the research site listed in the i-Tree Eco user manual [140] were used during the field work and comprehensive inventory was carried out on the designated area. The tool requires a detailed tree inventory—species and location of trees were specified and dendrometric measurements were taken: trunk diameter (DBH—diameter at breast height), total tree height (TTH), live tree height (LTH), crown base (CB), crown width N–S (North–South), crown width E–W (East–West), crown percentage miss (CROWN%MISS), crown health (CH) and crown light exposure (CLE). DBH was measured with a caliper at 130 cm above the ground. Crown width N–S and E–W, total tree height, live tree height and crown base were measured with a Bosch GLM120c laser measure with up to 0.5 m accuracy.
Weather details and air quality data recorded in the i-Tree database tool were also included in the model. The meteorological data covered wind speed and height. Based on the metadata of the model, data on PM2.5 concentrations, recorded by monitors installed closest to the locations selected by the researcher, were used. In the case of our study, this was a monitor installed on Aleja Niepodległości Street in Warsaw. The i-Tree database also provides access to meteorological data and air quality details. The model was launched after all the necessary data was entered in the i-Tree Eco, and it provided estimates on the amount of pollutants removed by trees at Marszałkowska Street and Żwirki i Wigury Street.

5. Results

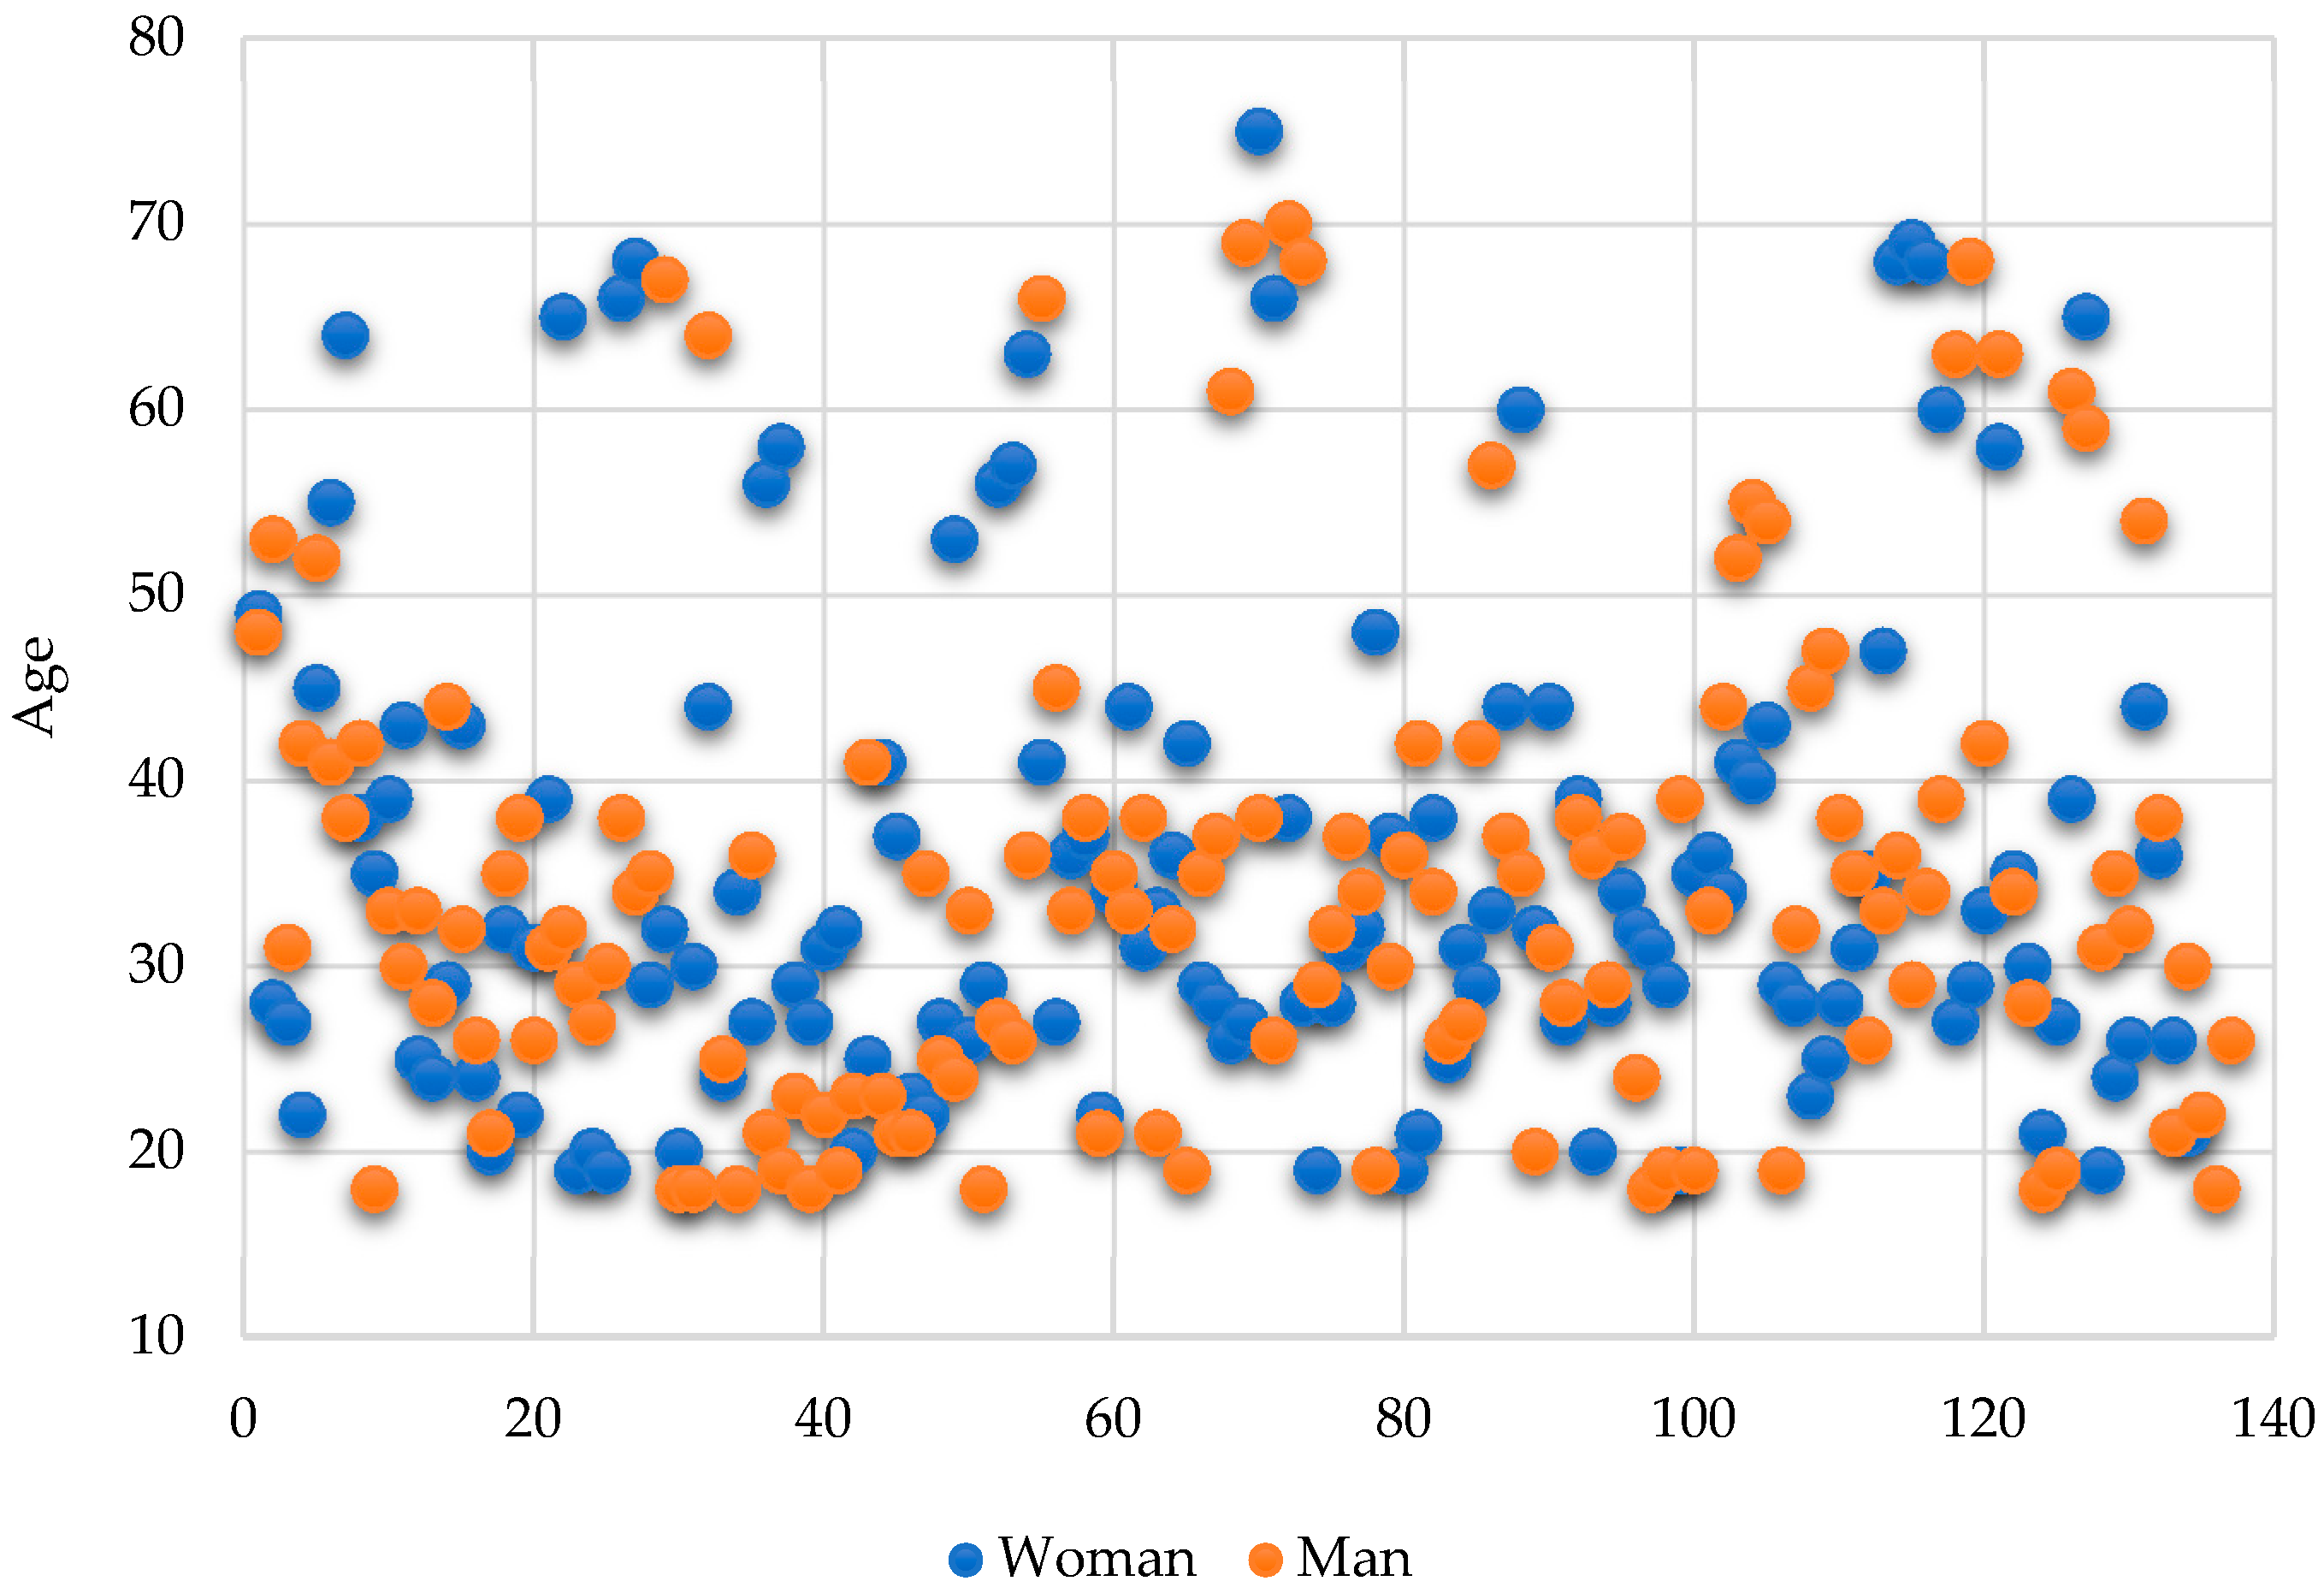
5.1. Characteristics of the Research Sample

The field survey was conducted on 271 respondents—inhabitants of 18 districts in Warsaw. 137 men and 134 women aged 18 to 75 comprised the sample group (Figure 4). A total 7% of the respondents either worked or held degrees in the environmental protection.
At later stages of the analysis, the sample group was divided with the used of the quartile method where the age of the respondents served as the decisive criterion. Due to the odd number of observations, the median indicated the middle value. The calculations provided the following age brackets for the respondent group (Table 1).

5.2. The Assessment of the Social Awareness of Air Pollution and Ecosystem Functions of Trees

The level of Warsaw inhabitants’ consciousness on the issue of air pollution was studied by the authors. The respondents rated the issue on the scale from 0 to 5, where 0 meant a lack of concern and 5 indicated a high level of concern in the issue. The overview provided below (Table 2) shows that almost 75% of respondents are concerned about air pollution in Warsaw, although on average they do not perceive it as highly concerning. Among people who indicated a lack of concern (0 points on the scale) or a low level of concern (1 point) the most numerous (above 81%) was the 18 to 25-years-old age group.
The residents also assessed air quality on the scale from 0 to 5, where 0 indicated very bad quality and 5 meant very good quality. The overview provided below (Table 2) shows that the majority of respondents (62.7%) indicated bad quality of air in the city, although on average they did not describe the air quality in the capital city as very bad. Bad and very bad air quality was reported most often by respondents aged 41 to 75, while good and very good assessment was given by people aged 18 to 25.
The authors also analysed the residents’ perception of the impact on air pollution in Warsaw of such activities as using lignite, plastic, particle board and other unsuitable materials for fuel in central heating; burning waste (rubbish) in home furnaces; operation of CHP plants; exhaust emissions from traffic (e.g., passenger cars, lorries) and exhaust emissions generated by production plants (stacks). The respondents rated the impact of the indicated activities on air pollution in the city on the scale from 0 to 5, where 0 meant the activity of lowest negative impact and 5 indicated the most harmful issue. The overview provided below (Table 3) shows that, depending on the activity, from over 30% to almost 90% of respondents notice their harmful character. The most frequently noted harmful activities were: exhaust emissions from traffic (32.10% of respondents indicated them as harmful and 20.66% as the most harmful) operation of CHP plants (19.93% of level 4 and 5 notes) and the least frequently listed by the residents was using unsuitable materials for fuel in furnaces (5.54% indications of their harmful character and 7.38% of the highest level of harm), which is justified by the location of industrial plants on the outskirts of the city and in localities adjacent to the capital.
The researchers also attempted to establish the assessment of activities which contribute to reduction of air pollution in Warsaw (Table 4), including chimney stack filters (in industrial plants), renewable energy sources (such as solar photovoltaic panels in lanterns and at bus stops), green belts which separate industrial grounds, the presence of urban parks and forests, green areas and street greenery (such as squares, lawns, meadows), popularisation of using collective transport (urban public transport) and eco-friendly means of transport (such as bicycles). Similar to the previous stages of the research, the respondents assessed the activities on the scale of 0 (does not contribute) to 5 (heavily contributes). In the respondents’ opinion, the action which contributes to the reduction of air pollution in Warsaw to the largest extent is the popularisation of individual eco-friendly means of transport (55.7% of level 5 grades) and the presence of urban parks and forests (49.8% of level 5 grades). The popularisation of collective transport (urban public transport—railway, buses and tramways) was graded slightly lower. The respondents considered the activities which involve installation of chimney stack filters (e.g., in industrial plants) to have a visibly smaller significance. Marginal assessment of this activity may suggest (as in the case of the impact of industrial plants on air pollution) that these plants are located on the outskirts of Warsaw or outside the city limits, which is why the respondents did not notice any necessity for action in this scope.
The awareness of the impact of air pollution on health was also subject to analysis (Table 5). Generally speaking, it can be stated that the respondents do not see any correlation between the presence of air pollution and health (75.28% of the responses ranked it at level 2 or lower). Among those who indicated lack of significance between air pollution and health, the largest age group consisted of people aged 18 to 25. Similar results were obtained in the assessment of the awareness of consequences of polluted air on health. The overview shows that all the listed health consequences of air pollution were assessed by the respondents as having low or no impact. The least frequently listed consequences of air pollution were headaches and respiratory problems, while the highest significance was usually given to cancer (with a higher frequency of level 4 and 5 grades).
Another aspect analysed in the course of the research was the residents’ perception of the importance of trees in their functions such as the decorative aspect, increased biological diversity of trees and animal species, cooling the air, slowing down precipitation, retention of rainwater, noise protection, reduction of stress and aggression levels and the development of local communities. The overview provided below (Table 6) shows that, in the respondents’ opinion, the most significant ecosystem function of trees is the improvement of air quality. Among the ecosystem functions listed here, almost a half of the respondents assessed the impact of trees on the improvement of air quality as highly significant (48.71% of level 5 grades). A similarly large percentage of the interviewees assessed noise protection at a high level (43.54% of level 5 grades). An especially insignificant value was noted by the respondents with regard to the process of development of local communities (almost 50% of them rated it at 0). The function of increased biological diversity of trees and animal species and reduction of stress and aggression was also of low significance to the respondents.
In addition to the ecosystem functions presented here, the awareness of the residents as to the capacity of air pollution (PM2.5 and PM10) absorption by trees was also subject to analysis. Although many respondents are aware of the ecosystem functions of trees, as shown in the analyses above, a relatively low number of them had the awareness of the trees’ capacity to absorb particle matter (Table 7). More than a half of the interviewees (57.2%) assessed the trees’ capacity to absorb pollution as very low or non-existing. Among the respondents who indicated the lack of said capacity, the largest group (70%) consisted of 18 to 25-year-olds.
The perception of residents of such elements as the existing biodiversity, the trees’ pollution reduction capacity and air-cooling potential, noise protection, retention of rainwater and the decorative aspect were also analysed. The assessment of these elements included both Marszałkowska Street and Żwirki i Wigury Street, where the tree inventory was completed (Table 8). All ecosystem functions of trees at Marszałkowska Street were assessed at very low levels. The only element which has received higher notes than the rest was the decorative aspect, as it may be associated with attractive urban developments in the area. The assessment of the respondents with regard to each of the ecosystem functions of trees at Żwirki i Wigury Street was decidedly higher. The ecosystem functions which received the highest grades were the decorative aspects and the noise protection feature. Despite the fact that the respondents assessed the trees’ capacity to absorb air pollution (PM2.5 and PM10) as low, taking into consideration both locations, their assessment was higher in the area with a larger tree cover (Żwirki i Wigury Street).

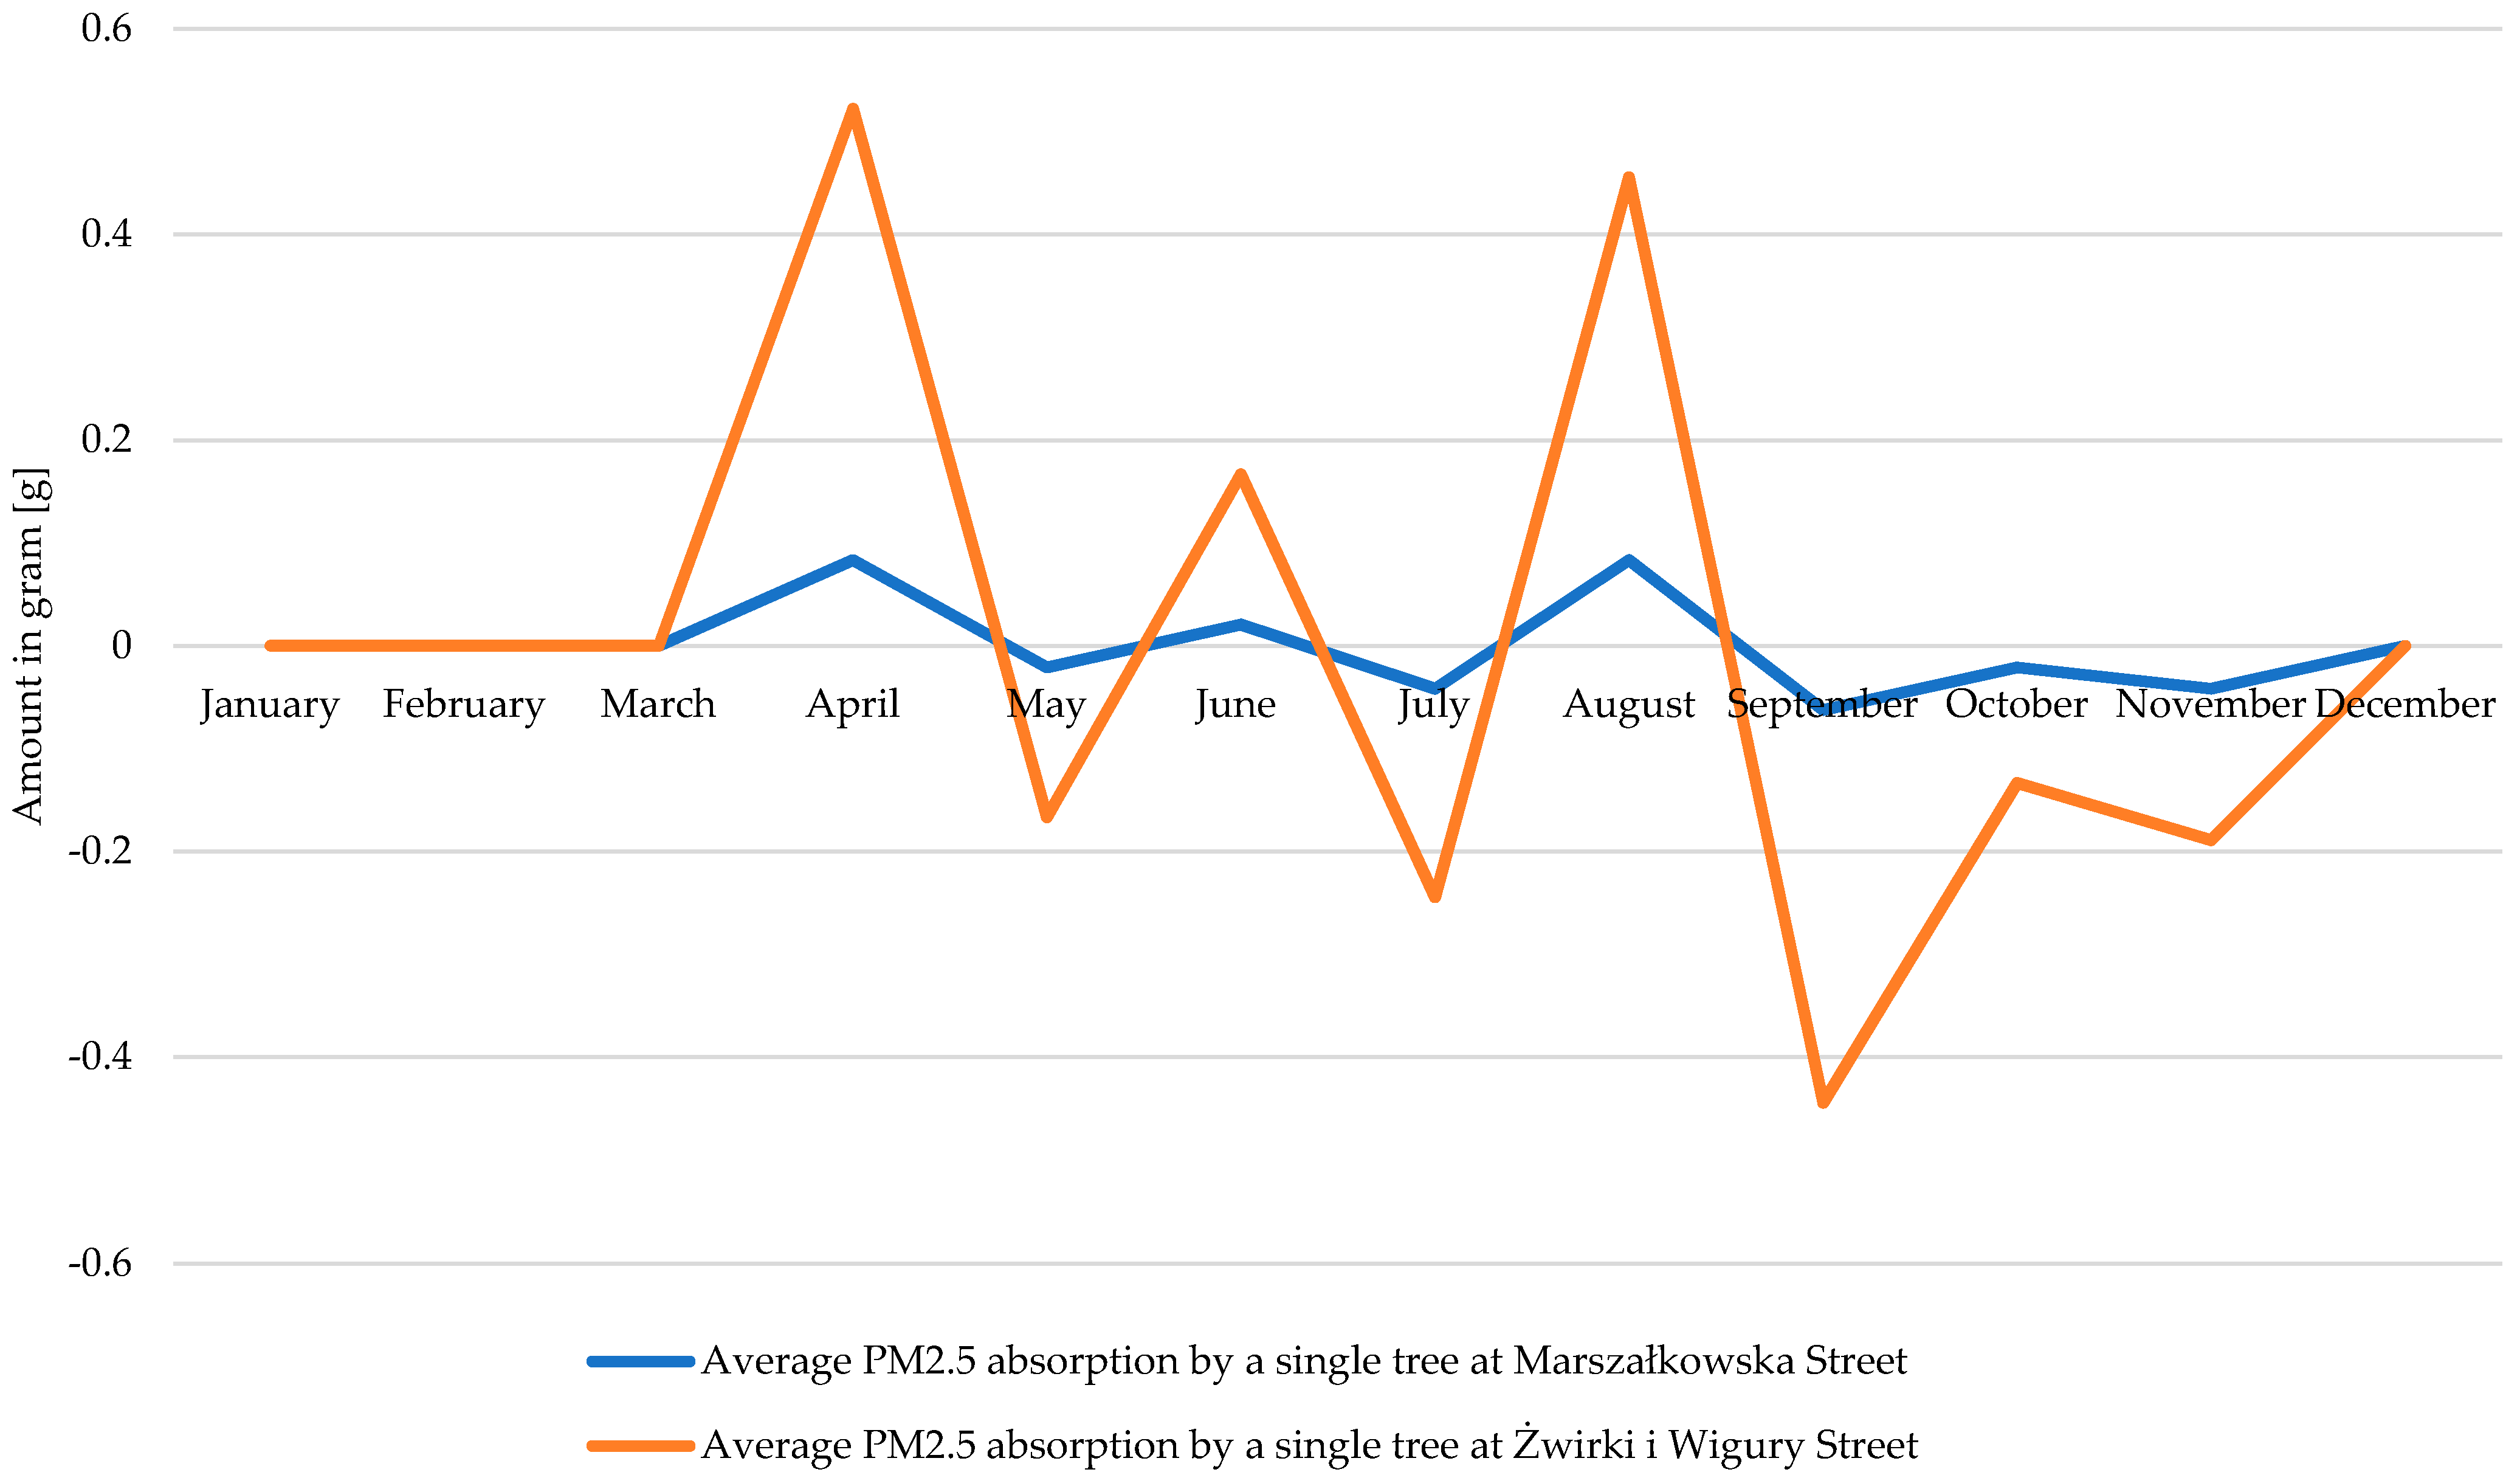
5.3. The Assessment of the Capacity of Trees to Absorb Air Pollution

The second part of the research involved a tree inventory conducted in two locations in Warsaw. As a result of the tree measurement at Marszałkowska Street and Żwirki i Wigury Street taken on 300-metre-long sections of both streets with the i-Tree Eco model the levels of absorption of O3, NO2, CO, SO2 and PM2.5 were calculated. Air pollutants and their production affect human health—at various scales, both local and regional, as well as global [141]. Tropospheric ozone O3 and fine particulate matter (PM2.5) are very dangerous pollutants due to the fact that they contribute to cardiovascular and lung diseases [141,142,143]. CO2 (carbon dioxide) is considered a major contributor to global temperature increases, with negative impacts on human health manifested as the potential to cause 21,600 additional deaths worldwide [142]. NO is a short-lived intercellular messenger that is important and has many biological functions, e.g., immune function, inflammation—processes that are relevant to the lungs and cardiovascular system. They cause pathophysiology of the cardiovascular system [144]. The findings on PM2.5 pollution point out to changeability in dust absorption over the course of the year and given months in both locations (Figure 5). It can be seen that during winter months, the trees do not absorb PM2.5 impurities due to the lack of leaves. The highest value of PM2.5 absorption was noted in April—one tree at Marszałkowska Street removed 0.083 g of dust on average, while one tree at Żwirki i Wigury Street absorbed 0.52 g. The overview includes also negative readings, caused by the phenomemon of dust retention in the trees observed in May, July and September.
The analyses show changeability in the absorption of impurities (CO, NO2, O3, SO2) by trees (Table 9). It was established in the course of the study that one tree at Marszałkowska Street absorbs an average 89.38 g of pollution per year, while a tree growing at Żwirki i Wigury included in the test absorbs 390.39 g of pollution per year. This phenomenon is caused by the poor quality of trees at Marszałkowska Street; there, they grow in unfavourable conditions, often in spaces covered with paving stones with the exception of tree trunk openings, which in turn results in limited access to water and stilted root growth, trees growing at Żwirki i Wigury Street grow in more natural conditions of open space. The highest capacity of absorption of pollution was recorded in April, May and July for both streets and referred to the absorption of ozone, where the result for individual trees was 4.5 times higher on average at Żwirki i Wigury Street.

6. Discussion

Over the last few decades, the notion of air pollution has become a significant subject of the public debate [145,146]. It comes as a result of growing environmental issues caused by extensive economic development. One of the aspects which contributes to economic development is the constant process of urbanisation. Green areas are commonly transformed into concrete squares, shopping galleries or residential estates, which in turn causes further decline in the amount of greenery in the cities or making them worse [147]. The result is the intensification of smog and an increase in air pollution in urban agglomerations. Recently, both mass media and local communities have started to popularise activities which contribute to mitigation of urban air pollution, which is also confirmed by the results obtained. Planting trees is one of those activities, and, as research shows, they are the most effective biological absorbers of particle matter and other sources of pollution [34]. However, according to our study, trees with smaller crowns (of poorer condition) have lower ecosystem service effectiveness. Similar results were also obtained by other authors, who indicate that the location of trees affects their ecological functions and is important in the removal potential of air pollutants [148,149].
It is reasonable to assume that this relationship also applies to new plantings, the presence of which, according to research conducted in megacities, would increase the value of ecosystem services by 85% [150]. It is therefore justified to promote activities which lead to an increase in the tree cover. It is therefore reasonable to promote activities aimed at increasing the area of wooded land, but especially protection of existing trees and concern for their site conditions [151]. That is why raising the social awareness of ecosystem functions of trees, effectiveness and the issue of air pollution in the cities has become such a crucial topic. Previous studies conducted both in Poland and abroad show that social awareness of air pollution is quite varied, although a rather low level of awareness is often indicated [41,44,45,152]. In addition, a UK study found not only low awareness of tree ecosystem services among residents, but also noted the willingness of residents to remove trees due to problems with blocking sunlight or leaf fall [153]. It generates the need for educational activities which involve learning about the features of residents with different levels of awareness of air pollution and, especially, its impact on their health.
The analyses show that the majority of respondents in Warsaw is concerned with the problem of air pollution in the city, although on average it was not deemed a truly alarming issue. Wang et al. [154] obtained similar results, where 92.28% of the residents of Zibo showed concern or a high level of concern about air pollution in the city. As in our study, residents usually noticed the impact of detrimental activities on the quality of air in the capital. They quoted exhaust emissions from traffic and the operation of CHP plants as two factors which most heavily contribute to the problem. This is in line with the findings of the research Chin et al. [41] conducted—according to them, the majority of respondents were aware of the fact that engine cars create the major source of pollution in the city. The respondents also assessed the activities which are meant to alleviate air pollution in the capital. The highest rated solution was the popularisation of individual eco-friendly means of transport and the presence of parks and forests in the city. These findings differ from the ones collected by Wang et al. [154] where over 75% of the respondents pointed out that using public transport is the main activity which contributes to the reduction of air pollution. This is the first time that a study of the importance of green space and awareness of its ecosystem services has been conducted in a small number of cities in Poland. In the case of one of these cities, residents indicated that green space was valued for its recreational value [155]. In another, residents indicated that they valued the decorative, environmental and recreational aspects [156]. In the case of the Warsaw study, the most important ecosystem function provided by trees was improving air quality. Similar results were obtained in a Hong Kong survey, in which respondents pointed to the microclimatic benefits of green spaces rather than their social or recreational functions [157]. There is also consensus in support for two other microclimatic functions, namely cooling of air temperature and protection from noise. The moderate support given to air-cooling is consistent with studies conducted in Helsinki and New Zealand [158,159]; however, it contrasts with the results of similar studies where this function is rated as very important [157,160,161]. Warsaw residents also rated the noise protection function highly, which contrasts with the results of similar studies where the rating of this element was low [157,160,162,163].
One of the most interesting findings of this study is that residents rated the function of lowering stress and aggression low. However, this factor is highly valued in many studies [158,164,165,166]. Additionally, despite the function of improving air quality being identified as the most important, residents’ awareness of the ability of trees to absorb pollutants was low, which is consistent with a study conducted in Rotterdam that indicated residents’ unawareness of the ability of green infrastructure to adapt to climate change [167]. Moreover, the low assessment of the impact of air pollution on health by residents in Warsaw is worrying, which contrasts with results conducted in Helsinki, Hong Kong or Kalton, where this aspect was treated as a key attribute [157,165,168]. It is worth noting that the demonstration of the relationship between air pollution and health in the literature has been widely reported for both children and adults [169,170,171,172,173,174,175].

7. Conclusions

The city residents also identified the ecosystem functions of trees; for them, the most crucial aspect of that was the improvement of air quality. However, when comparing the two locations, the awareness and the effectiveness of the tree work was higher, especially with a planting density considered to be optimal. However, despite the fact that the above notion was ranked as the most important one, the awareness of the interviewees on the ability of the trees to absorb particle matter was rather low. While comparing both locations, it was established that the awareness was higher in the area with a higher tree cover. The assessment of the potential to absorb pollutants indicated by trees growing at two different streets was in line with the results obtained in the pollution model prepared with the help of the i-Tree Eco tool.
The analysis of the model data has shown that, on average, a single tree surrounded by concrete areas has the capacity to absorb pollution at a level four times lower than that of a tree located at the side of the street surrounded with greenery with optimal habitat conditions and saturation. This phenomenon may be caused by adverse conditions of tree growth at Marszałkowska Street. The results of the analysis indicate that it is necessary to conduct information campaigns on the ecosystem services of trees and their proper care in the urban space among local communities, media, as well as local authorities and NGOs. These campaigns should be conducted for different age groups, so that the message can be adjusted to the age of the recipients.
It is worth noting that, in most of the analysed cases of social awareness of air pollution and related issues, the lowest awareness and knowledge was shown by respondents aged 18–25. Assessment of awareness of people of this age was not positioned in other air pollution awareness studies. The results of the study may cause concern, as it was found that Warsaw residents do not recognise the impact of air pollution on their health (as indicated by as many as 75% of respondents).
However, a number of limitations of the survey conducted among Warsaw residents should be noted. First, the residents’ opinion was obtained using convenience sampling techniques and there are no representative samples of the surveyed population; thus, it becomes necessary to repeat the survey in a representative sample in order to be able to generalize the results to the entire city population. In addition, the selection of ecosystem services, air pollution mitigation activities could be expanded or replaced by other elements. In addition, the study could be extended the use of interviews to be able to explore more deeply the awareness of residents. Third, while the survey results suggest consensus for some ecosystem services or air pollution awareness, they also indicate that there are differences in relation to tree benefits.
The present study is a step towards a better understanding of how urban residents evaluate the benefits associated with trees. From both a theoretical and policy perspective, this topic is of great importance when it comes to urban development and proper care of urban spaces. The results of the study support the thesis of the desirability of spreading public awareness in this area as well, although firm conclusions require further comprehensive research.

Author Contributions

Conceptualization, K.K. and M.G.; methodology, K.K. and M.G.; software, K.K.; validation, M.G.; formal analysis, K.K. and M.G.; resources, K.K. and M.G.; writing—original draft preparation, K.K., M.G. and M.S.; writing—review and editing, M.G. and M.S.; visualization, M.G.; supervision, M.G.; project administration, K.K. All authors have read and agreed to the published version of the manuscript.

Funding

This research received no external funding.

Institutional Review Board Statement

Not applicable.

Informed Consent Statement

Informed consent was obtained from all subjects involved in the study.

Conflicts of Interest

The authors declare no conflict of interest.

References

  1. Khelfi, A. Sources of Air Pollution. In Handbook of Research on Microbial Tools for Environmental Waste Management; Pathak, V.M., Navneet, Eds.; IGI Global Publisher of Timely Knowledge: Hershey, PA, USA, 2008. [Google Scholar]
  2. EEA. Climate Change, Impacts and Vulnerability in Europe 2012; An Indicator-Based Report; EEA: Copenhagen, Denmark, 2012. [Google Scholar]
  3. Jasiński, R.; Galant-Gołębiewska, M.; Nowak, M.; Ginter, M.; Kurzawska, P.; Kurtyka, K.; Maciejewska, M. Case Study of Pollution with Particulate Matter in Selected Locations of Polish Cities. Energies 2021, 14, 2529. [Google Scholar] [CrossRef]
  4. Pappa, A.; Kioutsioukis, I. Forecasting Particulate Pollution in an Urban Area: From Copernicus to Sub-Km Scale. Atmosphere 2021, 12, 881. [Google Scholar] [CrossRef]
  5. Juneng, L.; Latif, M.T.; Tangang, F. Factors influencing the variations of PM10 aerosol dust in Klang Valley, Malaysia during the summer. Atmos. Environ. 2011, 45, 4370–4378. [Google Scholar] [CrossRef]
  6. Chen, S.C.; Liao, C.M. Health risk assessment on human exposed to environmental polycyclic aromatic hydrocarbons pollution sources. Sci. Total Environ. 2006, 366, 112–123. [Google Scholar] [CrossRef] [PubMed]
  7. Duan, J.; Chen, Y.; Fang, W.; Su, Z. Characteristics and Relationship of PM, PM10, PM2.5 Concentration in a Polluted City in Northern China. Procedia Eng. 2015, 102, 1150–1155. [Google Scholar] [CrossRef] [Green Version]
  8. Donzelli, G.; Cioni, L.; Cancellieri, M.; Llopis-Morales, A.; Morales-Suárez-Varela, M. Air Quality during COVID-19 Lockdown. Encyclopedia 2021, 1, 519-526. [Google Scholar] [CrossRef]
  9. Foszcz, D.; Niedoba, T.; Siewior, J. Models of Air Pollution Propagation in the Selected Region of Katowice. Atmosphere 2021, 12, 695. [Google Scholar] [CrossRef]
  10. Kurt, O.K.; Zhang, J.; Pinkerton, K.E. Pulmonary Health Effects of Air Pollution. Curr. Opin. Pulm. Med. 2016, 22, 138–143. [Google Scholar] [CrossRef]
  11. Fantke, P.; Jolliet, O.; Evans, J.S.; Apte, J.S.; Cohen, A.J.; Hänninen, O.O.; Hurley, F.; Jantunen, M.J.; Jerrett, M.; Levy, J.I.; et al. Health effects of fine particulate matter in life cycle impact assessment: Findings from the Basel Guidance Workshop. Int. J. Life Cycle Assess. 2014, 20, 276–288. [Google Scholar] [CrossRef]
  12. Dockery, D.W.; Pope, C.A.; Xu, X.; Spengler, J.D.; Ware, J.H.; Fay, M.E.; Ferris, B.G.J.; Speizer, F.E. An Association between Air Pollution and Mortality in Six U.S. Cities. N. Engl. J. Med. 1993, 329, 1753–1759. [Google Scholar] [CrossRef] [Green Version]
  13. Wan Mahiyuddin, W.R.; Sahani, M.; Aripin, R.; Latif, M.T.; Thach, T.Q.; Wong, C.M. Short-term effects of daily air pollution on mortality. Atmos. Environ. 2013, 65, 69–79. [Google Scholar] [CrossRef]
  14. ChooChuay, C.; Pongpiachan, S.; Tipmanee, D.; Suttinun, O.; Deelaman, W.; Wang, Q.; Xing, L.; Li, G.; Han, Y.; Palakun, J.; et al. Impacts of PM2.5 sources on variations in particulate chemical compounds in ambient air of Bangkok, Thailand. Atmos. Pollut. Res. 2020, 11, 1657–1667. [Google Scholar] [CrossRef]
  15. WHO World Health Organization. Available online: https://www.who.int/news-room/fact-sheets/detail/ambient-(outdoor)-air-quality-and-health (accessed on 14 August 2021).
  16. Sicard, P.; Agathokleous, E.; De Marco, A.; Paoletti, E.; Calatayud, V. Urban population exposure to air pollution in Europe over the last decades. Environ. Sci. Eur. 2021, 33, 28. [Google Scholar] [CrossRef]
  17. Gulia, S.; Shiva Nagendra, S.M.; Khare, M.; Khanna, I. Urban air quality management—A review. Atmos. Pollut. Res. 2015, 6, 286–304. [Google Scholar] [CrossRef] [Green Version]
  18. Zhang, C.; Wohlhueter, R.; Zhang, H. Genetically modified foods: A critical review of their promise and problems. Food Sci. Hum. Wellness 2016, 5, 116–123. [Google Scholar] [CrossRef] [Green Version]
  19. Dominick, D.; Juahir, H.; Latif, M.T.; Zain, S.M.; Aris, A.Z. Spatial assessment of air quality patterns in Malaysia using multivariate analysis. Atmos. Environ. 2012, 60, 172–181. [Google Scholar] [CrossRef]
  20. Population Reference Bureau. World Population Highlights: Key Findings from PRB’s 2007 World Population Data Sheet; Population Reference Bureau: Washington, DC, USA, 2007. [Google Scholar]
  21. FAO. Guidelines on Urban and Peri-Urban Forestry; FAO Forestry Paper No. 178; FAO: Rome, Italy, 2016. [Google Scholar]
  22. World Urbanization Prospects Highlights (ST/ESA/SER.A/421); United Nations: New York, NY, USA, 2019.
  23. Ünal, Y.S.; Sonuç, C.Y.; Incecik, S.; Topcu, H.S.; Diren-Üstün, D.H.; Temizöz, H.P. Investigating urban heat island intensity in Istanbul. Theor. Appl. Climatol. 2019, 139, 175–190. [Google Scholar] [CrossRef]
  24. Pishgar-Komleh, S.H.; Zylowski, T.; Rozakis, S.; Kozyra, J. Efficiency under different methods for incorporating undesirable outputs in an LCA+DEA framework: A case study of winter wheat production in Poland. J. Environ. Manag. 2020, 260, 110–138. [Google Scholar] [CrossRef] [PubMed]
  25. Huang, K.; Li, X.; Liu, X.; Seto, K.C. Projecting global urban land expansion and heat island intensification through 2050. Environ. Res. Lett. 2019, 14, 114037. [Google Scholar] [CrossRef] [Green Version]
  26. Aslam, B.; Maqsoom, A.; Khalid, N.; Ullah, F.; Sepasgozar, S. Urban Overheating Assessment through Prediction of Surface Temperatures: A Case Study of Karachi, Pakistan. ISPRS Int. J. Geo-Inf. 2021, 10, 539. [Google Scholar] [CrossRef]
  27. Branea, A.-M.; Gaman, M.S.; Badescu, S.; Ana-Maria, B.; Mihai-Ionut, D.; Stelian, G.M.; Ștefana, B. Challanges Regarding the Study of Urban Heat Islands. Ruleset for Researchers. In Proceedings of the International Conference: The Risk Reduction for Resilient Cities, Bucharest, Romania, 3–4 November 2016. [Google Scholar]
  28. Perpina Castillo, C.; Kavalov, B.; Jacobs-Crisioni, C.; Baranzelli, C.; Batista e Silva, F.; Lavalle, C.; Perpina Castillo, C.; Kavalov, B.; Jacobs-Crisioni, C.; Baranzelli, C.; et al. Main land-use patterns in the EU within 2015-2030; Joint Research Centre (Seville Site): Brussels, Belgium, 2019. [Google Scholar]
  29. Tu, L.; Qin, Z.; Li, W.; Geng, J.; Yang, L.; Zhao, S.; Zhan, W.; Wang, F. Surface urban heat island effect and its relationship with urban expansion in Nanjing, China. J. Appl. Remote Sens. 2016, 10, 026037. [Google Scholar] [CrossRef] [Green Version]
  30. Akbari, H.; Pomerantz, M.; Taha, H. Cool surfaces and shade trees to reduce energy use and improve air quality in urban areas. Sol. Energy 2001, 70, 295–310. [Google Scholar] [CrossRef]
  31. Escobedo, F.J.; Kroeger, T.; Wagner, J.E. Urban forests and pollution mitigation: Analyzing ecosystem services and disservices. Environ. Pollut. 2011, 159, 2078–2087. [Google Scholar] [CrossRef] [PubMed]
  32. Sawidis, T.; Breuste, J.; Mitrovic, M.; Pavlovic, P.; Tsigaridas, K. Trees as bioindicator of heavy metal pollution in three European cities. Environ. Pollut. 2011, 159, 3560–3570. [Google Scholar] [CrossRef] [PubMed]
  33. Greksa, A.; Ljevnaić-Mašić, B.; Grabić, J.; Benka, P.; Radonić, V.; Blagojević, B.; Sekulić, M. Potential of urban trees for mitigating heavy metal pollution in the city of Novi Sad, Serbia. Environ. Monit. Assess. 2019, 191, 636. [Google Scholar] [CrossRef]
  34. Przybysz, A.; Nersisyan, G.; Gawroński, S.W. Removal of particulate matter and trace elements from ambient air by urban greenery in the winter season. Environ. Sci. Pollut. Res. 2018, 26, 473–482. [Google Scholar] [CrossRef] [Green Version]
  35. Xu, X.; Xia, J.; Gao, Y.; Zheng, W. Additional focus on particulate matter wash-off events from leaves is required: A review of studies of urban plants used to reduce airborne particulate matter pollution. Urban For. Urban Green. 2020, 48, 126559. [Google Scholar] [CrossRef]
  36. Central Statistical Office. Population in Cities in% of the Total Population in Poland; Central Statistical Office: Warsaw, Poland, 2020. [Google Scholar]
  37. Pauchard, A.; Aguayo, M.; Peña, E.; Urrutia, R. Multiple effects of urbanization on the biodiversity of developing countries: The case of a fast-growing metropolitan area (Concepción, Chile). Biol. Conserv. 2006, 127, 272–281. [Google Scholar] [CrossRef]
  38. Mencwel, J. Betonoza. Jak Się Niszczy Polskie Miasta; Wydawnictwo Krytyki Politycznej: Warszawa, Poland, 2020; ISBN 978-83-66586-25-3. [Google Scholar]
  39. Central Statistical Office. Nasadzenia i Ubytki wg Lokalizacji w Powiatach—Plantings and Cavities by Location in Counties; Central Statistical Office: Warsaw, Poland, 2019. [Google Scholar]
  40. Munro, N. Profiling the Victims: Public awareness of pollution-related harm in China. J. Contemp. China 2014, 23, 314–329. [Google Scholar] [CrossRef] [Green Version]
  41. Chin, Y.S.J.; De Pretto, L.; Thuppil, V.; Ashfold, M.J. Public awareness and support for environmental protection—A focus on air pollution in peninsular Malaysia. PLoS ONE 2019, 14, e0212206. [Google Scholar] [CrossRef]
  42. Ramírez, A.S.; Ramondt, S.; Van Bogart, K.; Perez-Zuniga, R. Public Awareness of Air Pollution and Health Threats: Challenges and Opportunities for Communication Strategies To Improve Environmental Health Literacy. J. Health Commun. 2019, 24, 75–83. [Google Scholar] [CrossRef]
  43. Saksena, S. Public Perceptions of Urban Air Pollution with a Focus on Developing Countries; East-West Center: Honolulu, HI, USA, 2007. [Google Scholar]
  44. Piekut, A.; Dziubanek, G. Awareness of environmental health risks in selected social groups in Silesian voivodeship. Ann. Acad. Med. Silesiensis 2012, 66, 34–44. [Google Scholar]
  45. Adamkiewicz, Ł. Polish people awareness on the impact of air pollution on health. Sci. J. Mil. Inst. Health. Serv. 2016, 94, 28–31. [Google Scholar]
  46. Daily, G.C. Nature’s Services: Societal Dependence on Natural Ecosystems; Island Press: Washington, DC, USA, 1997; pp. 1–19. [Google Scholar]
  47. Reid, W. Millennium Ecosystem Assessment. Ann. N. Y. Acad. Sci. 2008, 1134, 25–60. [Google Scholar]
  48. Costanza, R.; D’Arge, R.; de Groot, R.; Farber, S.; Grasso, M.; Hannon, B.; Limburg, K.; Naeem, S.; O’Neill, R.V.; Paruelo, J.; et al. The value of the world’s ecosystem services and natural capital. Nature 1997, 387, 253–260. [Google Scholar] [CrossRef]
  49. Gómez-Baggethun, E.; Gren, Å.; Barton, D.N.; Langemeyer, J.; McPhearson, T.; O’Farrell, P.; Andersson, E.; Hamstead, Z.; Kremer, P. Urban Ecosystem Services. In Urbanization, Biodiversity and Ecosystem Services: Challenges and Opportunities: A Globle Assessment; Springer: Dordrecht, The Netherlands, 2013; pp. 175–251. [Google Scholar] [CrossRef] [Green Version]
  50. Langemeyer, J.; Gómez-Baggethun, E.; Haase, D.; Scheuer, S.; Elmqvist, T. Bridging the gap between ecosystem service assessments and land-use planning through Multi-Criteria Decision Analysis (MCDA). Environ. Sci. Policy 2016, 62, 45–56. [Google Scholar] [CrossRef]
  51. Haase, D.; Larondelle, N.; Andersson, E.; Artmann, M.; Borgström, S.; Breuste, J.; Gomez-Baggethun, E.; Gren, Å.; Hamstead, Z.; Hansen, R.; et al. A Quantitative Review of Urban Ecosystem Service Assessments: Concepts, Models, and Implementation. AMBIO 2014, 43, 413–433. [Google Scholar] [CrossRef] [PubMed] [Green Version]
  52. Salmond, J.A.; Tadaki, M.; Vardoulakis, S.; Arbuthnott, K.; Coutts, A.; Demuzere, M.; Dirks, K.N.; Heaviside, C.; Lim, S.; Macintyre, H.; et al. Health and climate related ecosystem services provided by street trees in the urban environment. Environ. Health 2016, 15, 95–111. [Google Scholar] [CrossRef] [PubMed] [Green Version]
  53. La Rosa, D.; Wiesmann, D. Land cover and impervious surface extraction using parametric and non-parametric algorithms from the open-source software R: An application to sustainable urban planning in Sicily. GIScience Remote Sens. 2013, 50, 231–250. [Google Scholar] [CrossRef]
  54. Jennings, V.; Larson, L.; Yun, J. Advancing Sustainability through Urban Green Space: Cultural Ecosystem Services, Equity, and Social Determinants of Health. Int. J. Environ. Res. Public Health 2016, 13, 196. [Google Scholar] [CrossRef] [Green Version]
  55. Jim, C.Y.; Chen, W.Y. Ecosystem services and valuation of urban forests in China. Cities 2009, 26, 187–194. [Google Scholar] [CrossRef]
  56. Benedict, M.A.; McMahon, E.T. Green Infrastructure. Linking Landscapes and Communities; Island Press: Washington, DC, USA, 2012. [Google Scholar]
  57. Ahern, J. Green infrastructure for cities: The spatial dimension. In Cities of the Future: Towards Integrated Sustainable Water and Landscape Management; Novotny, V., Brown, P., Eds.; IWA Publishing: London, UK, 2007; pp. 267–283. [Google Scholar]
  58. Wu, J. Urban ecology and sustainability: The state of the science and future directions. Landsc. Urban Plan. 2014, 125, 209–221. [Google Scholar] [CrossRef]
  59. Lovell, S.T.; Taylor, J.R. Supplying urban ecosystem services through multifunctional green infrastructure in the United States. Landsc. Ecol. 2013, 28, 1447–1463. [Google Scholar] [CrossRef]
  60. Feng, X.; Porporato, A.; Rodriguez-Iturbe, I. Changes in rainfall seasonality in the tropics. Nat. Clim. Chang. 2013, 3, 811–815. [Google Scholar] [CrossRef]
  61. Jim, C.Y. Highrise Greenery: Ancient Invention with New Lease of Life. In Advances in 21st Century Human Settlements; Dahiya, B., D’Silva, L., Eds.; Springer: Singapore, 2017; pp. 227–249. [Google Scholar]
  62. Silvera Seamans, G. Mainstreaming the environmental benefits of street trees. Urban For. Urban Green. 2013, 12, 2–11. [Google Scholar] [CrossRef]
  63. Roy, S.; Byrne, J.; Pickering, C. A systematic quantitative review of urban tree benefits, costs, and assessment methods across cities in different climatic zones. Urban For. Urban Green. 2012, 11, 351–363. [Google Scholar] [CrossRef] [Green Version]
  64. Day, S.D.; Dove, J.E.; Bartens, J.; Harris, J.R. Stormwater Management that Combines Paved Surfaces and Urban Trees. GeoCongress 2008, 1129–1136. [Google Scholar] [CrossRef]
  65. Xiao, Q.; McPherson, E.G.; Simpson, J.R.; Ustin, S.L. Rainfall interception by Sacramento’s urban forest. J. Arboric. 1998, 24, 235–244. [Google Scholar]
  66. Villarreal, E.L.; Semadeni-Davies, A.; Bengtsson, L. Inner city stormwater control using a combination of best management practices. Ecol. Eng. 2004, 22, 279–298. [Google Scholar] [CrossRef]
  67. Donovan, G.H.; Butry, D.T. The value of shade: Estimating the effect of urban trees on summertime electricity use. Energy Build. 2009, 41, 662–668. [Google Scholar] [CrossRef]
  68. Hystad, P.; Davies, H.W.; Frank, L.; Van Loon, J.; Gehring, U.; Tamburic, L.; Brauer, M. Residential Greenness and Birth Outcomes: Evaluating the Influence of Spatially Correlated Built-Environment Factors. Environ. Health Perspect. 2014, 122, 1095–1102. [Google Scholar] [CrossRef] [Green Version]
  69. Coombes, E.; Jones, A.P.; Hillsdon, M. The relationship of physical activity and overweight to objectively measured green space accessibility and use. Soc. Sci. Med. 2010, 70, 816–822. [Google Scholar] [CrossRef] [Green Version]
  70. Hansmann, R.; Hug, S.M.; Seeland, K. Restoration and stress relief through physical activities in forests and parks. Urban For. Urban Green. 2007, 6, 213–225. [Google Scholar] [CrossRef]
  71. Frank, L.D.; Schmid, T.L.; Sallis, J.F.; Chapman, J.; Saelens, B.E. Linking objectively measured physical activity with objectively measured urban form: Findings from SMARTRAQ. Am. J. Prev. Med. 2005, 28, 117–125. [Google Scholar] [CrossRef]
  72. Hartig, T.; Staats, H. The need for psychological restoration as a determinant of environmental preferences. J. Environ. Psychol. 2006, 26, 215–226. [Google Scholar] [CrossRef]
  73. Roe, J.; Aspinall, P. The restorative benefits of walking in urban and rural settings in adults with good and poor mental health. Health Place 2011, 17, 103–113. [Google Scholar] [CrossRef] [PubMed]
  74. Stigsdotter, U.K.; Ekholm, O.; Schipperijn, J.; Toftager, M.; Kamper-Jørgensen, F.; Randrup, T.B. Health promoting outdoor environments—Associations between green space, and health, health-related quality of life and stress based on a Danish national representative survey. Scand. J. Public Health 2010, 38, 411–417. [Google Scholar] [CrossRef] [PubMed]
  75. Van den Berg, A.E.; Maas, J.; Verheij, R.A.; Groenewegen, P.P. Green space as a buffer between stressful life events and health. Soc. Sci. Med. 2010, 70, 1203–1210. [Google Scholar] [CrossRef] [Green Version]
  76. Donovan, G.H.; Michael, Y.L.; Butry, D.T.; Sullivan, A.D.; Chase, J.M. Urban trees and the risk of poor birth outcomes. Health Place 2011, 17, 390–393. [Google Scholar] [CrossRef]
  77. Laurent, O.; Wu, J.; Li, L.; Milesi, C. Green spaces and pregnancy outcomes in Southern California. Health Place 2013, 24, 190–195. [Google Scholar] [CrossRef] [Green Version]
  78. Freeman, C.; Dickinson, K.J.M.; Porter, S.; van Heezik, Y. “My garden is an expression of me”: Exploring householders’ relationships with their gardens. J. Environ. Psychol. 2012, 32, 135–143. [Google Scholar] [CrossRef]
  79. Cook, E.M.; Hall, S.J.; Larson, K.L. Residential landscapes as social-ecological systems: A synthesis of multi-scalar interactions between people and their home environment. Urban Ecosyst. 2011, 15, 19–52. [Google Scholar] [CrossRef]
  80. Casado-Arzuaga, I.; Madariaga, I.; Onaindia, M. Perception, demand and user contribution to ecosystem services in the Bilbao Metropolitan Greenbelt. J. Environ. Manag. 2013, 129, 33–43. [Google Scholar] [CrossRef] [PubMed]
  81. Urgenson, L.S.; Prozesky, H.E.; Esler, K.J. Stakeholder Perceptions of an Ecosystem Services Approach to Clearing Invasive Alien Plants on Private Land. Ecol. Soc. 2013, 18, 26. [Google Scholar] [CrossRef] [Green Version]
  82. Holahan, C.J. Environmental Psychology. Annu. Rev. Psychol. 2003, 37, 381–407. [Google Scholar] [CrossRef]
  83. Ajzen, I. The Theory of Planned Behavior. Organ. Behav. Hum. Decis. Process. 1991, 50, 179–211. [Google Scholar] [CrossRef]
  84. Stern, P.C.; Dietz, T.; Abel, T.; Guagnano, G.; Kalof, L. A Value-Belief-Norm Theory of Support for Social Movements: The Case of Environmentalism. Hum. Ecol. Rev. 1999, 6, 81–97. [Google Scholar]
  85. Baur, J.W.R.; Tynon, J.F.; Ries, P.; Rosenberger, R.S. Public attitudes about urban forest ecosystem services management: A case study in Oregon cities. Urban For. Urban Green. 2016, 17, 42–53. [Google Scholar] [CrossRef]
  86. Milfont, T.L.; Duckitt, J.; Wagner, C. A Cross-Cultural Test of the Value–Attitude–Behavior Hierarchy. J. Appl. Soc. Psychol. 2010, 40, 2791–2813. [Google Scholar] [CrossRef]
  87. Homer, P.M.; Kahle, L.R. A Structural Equation Test of the Value-Attitude-Behavior Hierarchy. J. Pers. Soc. Psychol. 1988, 54, 638–646. [Google Scholar] [CrossRef]
  88. Jones, R.E.; Davis, K.L.; Bradford, J. The Value of Trees: Factors Influencing Homeowner Support for Protecting Local Urban Trees. Environ. Behav. 2012, 45, 650–676. [Google Scholar] [CrossRef]
  89. Balram, S.; Dragićević, S. Attitudes toward urban green spaces: Integrating questionnaire survey and collaborative GIS techniques to improve attitude measurements. Landsc. Urban Plan. 2005, 71, 147–162. [Google Scholar] [CrossRef]
  90. Kaltenborn, B.P.; Bjerke, T. Associations between environmental value orientations and landscape preferences. Landsc. Urban Plan. 2002, 59, 1–11. [Google Scholar] [CrossRef]
  91. Tzoulas, K.; Korpela, K.; Venn, S.; Yli-Pelkonen, V.; Kaźmierczak, A.; Niemela, J.; James, P. Promoting ecosystem and human health in urban areas using Green Infrastructure: A literature review. Landsc. Urban Plan. 2007, 81, 167–178. [Google Scholar] [CrossRef] [Green Version]
  92. Schroeder, H.; Flannigan, J.; Coles, R. Residents’ Attitudes Toward Street Trees in the UK and U.S. Communities. Arboric. Urban For. 2006, 32, 236–246. [Google Scholar]
  93. Taylor, M.S.; Wheeler, B.W.; White, M.P.; Economou, T.; Osborne, N.J. Research note: Urban street tree density and antidepressant prescription rates—A cross-sectional study in London, UK. Landsc. Urban Plan. 2015, 136, 174–179. [Google Scholar] [CrossRef]
  94. De Vries, S.; van Dillen, S.M.E.; Groenewegen, P.P.; Spreeuwenberg, P. Streetscape greenery and health: Stress, social cohesion and physical activity as mediators. Soc. Sci. Med. 2013, 94, 26–33. [Google Scholar] [CrossRef] [Green Version]
  95. Peckham, S.C.; Duinker, P.N.; Ordóñez, C. Urban forest values in Canada: Views of citizens in Calgary and Halifax. Urban For. Urban Green. 2013, 12, 154–162. [Google Scholar] [CrossRef]
  96. Heynen, N. Green Urban Political Ecologies: Toward a Better Understanding of Inner-City Environmental Change. Environ. Plan. A 2016, 38, 499–516. [Google Scholar] [CrossRef]
  97. Tallis, H.; Polasky, S. Mapping and Valuing Ecosystem Services as an Approach for Conservation and Natural-Resource Management. Year Ecol. Conserv. Biol. 2009, 1162, 265–283. [Google Scholar] [CrossRef] [PubMed]
  98. Heberlein, T.A. Navigating Environmental Attitudes. Conserv. Biol. 2012, 26, 583–585. [Google Scholar] [CrossRef]
  99. López-Marrero, T.; Meyn, M.; Nieves-Crespo, H.I.; Morales-López, R.; Balloffet, N.M. Public Knowledge and Perceptions about Urban Forests in a Watershed Context; ConoBosque Briefing; Misión Industrial de Puerto Rico: San Juan, PR, USA, 2011. [Google Scholar]
  100. Santiago, L.; Gladkikh, T.; Betancourt, L.; Vargas, Y. Green versus Gray: Attitudes toward Vegetation in a Tropical Metropolitan Square. Environ. Nat. Resour. Res. 2015, 5, 109–120. [Google Scholar] [CrossRef]
  101. Fish, R.D. Environmental decision making and an ecosystems approach: Some challenges from the perspective of social science. Prog. Phys. Geogr. Earth Environ. 2011, 35, 671–680. [Google Scholar] [CrossRef]
  102. Laurans, Y.; Mermet, L. Ecosystem services economic valuation, decision-support system or advocacy? Ecosyst. Serv. 2014, 7, 98–105. [Google Scholar] [CrossRef]
  103. Zhang, K.; Wen, Z. Review and challenges of policies of environmental protection and sustainable development in China. J. Environ. Manag. 2008, 88, 1249–1261. [Google Scholar] [CrossRef] [PubMed]
  104. Kuklinska, K.; Wolska, L.; Namiesnik, J. Air quality policy in the U.S. and the EU—A review. Atmos. Pollut. Res. 2015, 6, 129–137. [Google Scholar] [CrossRef]
  105. Köhler, A. Wmo’s activities on background atmospheric pollution and integrated monitoring and research. Environ. Monit. Assess. 1988, 11, 253–268. [Google Scholar] [CrossRef]
  106. Wettestad, J. The Convention on Long-Range Transboundary Air Pollution (CLRTAP). In Environmental Regime Effectiveness: Confronting Theory with Evidence; Miles, E.L., Underdal, A., Andresen, S., Wettestad, J., Skjaerseth, J.B., Carlin, E.M., Eds.; The MIT Press: London, UK, 2001. [Google Scholar]
  107. UNEP. Actions on Air Quality: Policies and Programmes for Improving Air Quality around the World; UNEP: Nairobi, Kenya, 2016. [Google Scholar]
  108. Holman, C.; Harrison, R.; Querol, X. Review of the efficacy of low emission zones to improve urban air quality in European cities. Atmos. Environ. 2015, 111, 161–169. [Google Scholar] [CrossRef]
  109. Government Digital Service Transport for London. Available online: https://tfl.gov.uk/modes/driving/low-emission-zone (accessed on 3 August 2021).
  110. Jones, R. Business News Wales. Available online: https://businessnewswales.com/port-talbots-new-5-6m-integrated-transport-hub-opens/ (accessed on 1 August 2021).
  111. Hesketh, R.E.; Hinrichs-Krapels, S.; Jones, L.E.B. King’s College London. Available online: https://www.kcl.ac.uk/sspp/policy-institute/publications/Air-quality-improvement-initiatives-in-other-cities.pdf (accessed on 5 August 2021).
  112. Porter, C.; Kall, D.; Selin, T.; Baker, R.; Kishan, S.; Preusse, D.; Stanard, A. Evaluate the Interactions between Transportation-Related Particulate Matter, Ozone, Air Toxics, Climate Change, and Other Air-Pollutant Control Strategies; Cambridge Systematics, Inc.: Cambridge, MA, USA, 2010. [Google Scholar]
  113. GOV Welsh Government Services and Information. Available online: https://gov.wales/ps20m-air-quality-fund-among-new-measures-improve-air-quality-wales (accessed on 6 August 2021).
  114. York Bigazzi, A.; Rouleau, M. Can traffic management strategies improve urban air quality? A review of the evidence. J. Transp. Health 2017, 7, 111–124. [Google Scholar] [CrossRef]
  115. Lewis, A. The Conversation. Available online: https://theconversation.com/beware-chinas-anti-smog-tower-and-other-plans-to-pull-pollution-from-the-air-90596 (accessed on 9 August 2021).
  116. Lorch, M. The Conversation. Available online: https://theconversation.com/a-layerof-sunscreen-on-the-street-might-fight-smog-16545 (accessed on 1 August 2021).
  117. Gardiner, B. National Geographic. Available online: https://www.nationalgeographic.com/science/article/china-air-pollution-solutions-environment-tangshan (accessed on 9 August 2021).
  118. Poznań City Hall—Department of Environmental Protection Program KAWKA—Szansą na Ograniczanie Niskiej Emisji w Poznaniu (The KAWKA Program—An Opportunity to Reduce Low Emissions in Poznań). Available online: https://www.poznan.pl/mim/public/main/attachments.att?co=show&instance=1017&parent=69945&lang=pl&id=179846 (accessed on 19 September 2021).
  119. Marshal’s Office of the Mazowieckie Voivodeship in Warsaw Air Protection Programs. Available online: http://www.powietrze.mazovia.pl/pop-i-pdk/program-ograniczania-niskiej-emisji-pone-1 (accessed on 19 September 2021).
  120. Krakow City Hall Environmental Protection. Available online: https://www.bip.krakow.pl/?dok_id=105326 (accessed on 19 September 2019).
  121. Kowalska, F. Air pollution is a significant threat to the health of the inhabitants of Polish cities. Refleksje Pismo Nauk. Stud. Dr. WNPiD UAM 2020. [Google Scholar] [CrossRef]
  122. Association of the Szczecin Metropolitan Area. News Szczecin. Available online: http://som.szczecin.pl/2019/04/29/szczecin-program-platan/ (accessed on 19 September 2019).
  123. Capital City of Warsaw Municipal Greenery. Available online: https://warszawa19115.pl/-/milion-drzew-dla-warszawy (accessed on 19 September 2019).
  124. Green Forest Fund Forest Donation. Available online: https://www.greenforestfund.de/en/ (accessed on 19 September 2019).
  125. Lawton, G.; Markuly, I. Greening the Desert Project. Available online: https://www.greeningthedesertproject.org/ (accessed on 19 September 2021).
  126. Ripple Africa Inspiring Communities to Achieve a Sustainable Future. Available online: https://rippleafrica.org/ (accessed on 19 September 2021).
  127. Rae, R.A.; Simon, G.; Braden, J. Public Reactions to New Street Tree Planting. Cities Environ. 2010, 3, 1–21. [Google Scholar] [CrossRef]
  128. Balder, H.; Ehlebracht, K.; Mahler, E. Stressen Baume Planen, Pflanzen, Pfelgen am Beispiel Berlin; Patzer Verlag: Berlin, Germany; Hanover, Germany, 1997. [Google Scholar]
  129. Han, Q.; Keeffe, G.; Caplat, P.; Simson, A. Cities as hot stepping stones for tree migration. Urban Sustain. 2021, 1, 1–5. [Google Scholar] [CrossRef]
  130. Andersson-Sköld, Y.; Thorsson, S.; Rayner, D.; Lindberg, F.; Janhäll, S.; Jonsson, A.; Moback, U.; Bergman, R.; Granberg, M. An integrated method for assessing climate-related risks and adaptation alternatives in urban areas. Clim. Risk Manag. 2015, 7, 31–50. [Google Scholar] [CrossRef] [Green Version]
  131. Kołodziej, E. NOIZZ Ekologia. Available online: https://noizz.pl/ekologia/warszawa-gorsza-niz-kalkuta-jest-na-2-miejscu-miast-z-najgorszym-powietrzem/c3jn196 (accessed on 2 August 2021).
  132. Krzysztoszek, A.; Jakubowska, J. Euractiv.pl. Available online: https://www.euractiv.pl/section/energia-i-srodowisko/news/mroz-smog-piec-warszawa-wroclaw-zanieczyszczenie-powietrze-miasta/ (accessed on 2 August 2021).
  133. Karaczun, Z.; Michalak, W. Impact of the Hange and Air Pollution for the Health of Warsaw Inhabitants; Polish Ecological Club, Mazowiecki District: Warszawa, Poland, 2019. [Google Scholar]
  134. Poland in Numbers. The City of Warsaw in Numbers. Available online: https://www.polskawliczbach.pl/Warszawa (accessed on 2 August 2021).
  135. Glen, S. Convenience Sampling (Accidental Sampling): Definition, Examples. Available online: https://www.statisticshowto.com/convenience-sampling/ (accessed on 20 September 2021).
  136. Salkind, N. Encyclopedia of Research Design; SAGE Publications, Inc.: New York, NY, USA, 2012. [Google Scholar] [CrossRef]
  137. Nielsen, J.S. Use of the Internet for willingness-to-pay surveys: A comparison of face-to-face and web-based interviews. Resour. Energy Econ. 2011, 33, 119–129. [Google Scholar] [CrossRef]
  138. Nowak, D.J.; Crane, D.E. The Urban Forest Effects (UFORE) model: Quantifying urban forest structure and functions. In Integrated Tools for Natural Resources Inventories in the 21st Century; General Technical Report, NC-212; Hansen, M., Burk, T., Eds.; U.S. Department of Agriculture, Forest Service, North Central Forest Experiment Station: St. Paul, MN, USA, 2000. [Google Scholar]
  139. Hirabayashi, S.; Kroll, C.N.; Nowak, D.J. i-Tree Eco Dry Deposition Model Descriptions. Available online: https://citeseerx.ist.psu.edu/viewdoc/download?doi=10.1.1.365.190&rep=rep1&type=pdf (accessed on 26 August 2021).
  140. i-Tree Eco User’s Manual. Available online: https://www.itreetools.org/documents/275/EcoV6_UsersManual.2021.04.19.pdf (accessed on 1 August 2021).
  141. Laden, F.; Schwartz, J.; Speizer, F.E.; Dockery, D.W. Reduction in Fine Particulate Air Pollution and Mortality. Am. J. Respir. Crit. Care Med. 2012, 173, 667–672. [Google Scholar] [CrossRef] [PubMed]
  142. Jacobson, M.Z. On the causal link between carbon dioxide and air pollution mortality. Geophys. Res. Lett. 2008, 35, L03809. [Google Scholar] [CrossRef] [Green Version]
  143. Jerrett, M.; Burnett, R.T.; Pope, C.A.I.; Ito, K.; Thurston, G.; Krewski, D.; Shi, Y.; Calle, E.; Thun, M. Long-Term Ozone Exposure and Mortality. N. Engl. J. Med. 2009, 360, 1085–1095. [Google Scholar] [CrossRef] [Green Version]
  144. Adamkiewicz, G.; Ebelt, S.; Syring, M.; Slater, J.; Speizer, F.E.; Schwartz, J.; Suh, H. Association between air pollution exposure and exhaled nitric oxide in an elderly population. Thorax 2004, 59, 204–209. [Google Scholar] [CrossRef] [Green Version]
  145. Siddi, M. The European Green Deal: Assessing Its Current State and Future Implementation; FIIA: Helsinki, Finland, 2020. [Google Scholar]
  146. Wolf, S.; Teitge, J.; Mielke, J.; Schütze, F.; Jaeger, C. The European Green Deal—More Than Climate Neutrality. Intereconomics 2021, 56, 99–107. [Google Scholar] [CrossRef]
  147. Suchocka, M.; Swoczyna, T.; Kosno-Jończy, J.; Kalaji, H.M. Impact of heavy pruning on development and photosynthesis of Tilia cordata Mill. trees. PLoS ONE 2021, 16, e0256465. [Google Scholar] [CrossRef]
  148. Cimburova, Z.; Barton, D.N. The potential of geospatial analysis and Bayesian networks to enable i-Tree Eco assessment of existing tree inventories. Urban For. Urban Green. 2020, 55, 126801. [Google Scholar] [CrossRef]
  149. Davies, H.; Doick, K.; Handley, P.; O’Brien, L.; Wilson, J. Delivery of Ecosystem Services by Urban Forests; Research Report; Forestry Commission: Bristol, UK, 2017.
  150. Endreny, T.; Santagata, R.; Perna, A.; De Stefano, C.; Rallo, R.F.; Ulgiati, S. Implementing and managing urban forests: A much needed conservation strategy to increase ecosystem services and urban wellbeing. Ecol. Modell. 2017, 360, 328–335. [Google Scholar] [CrossRef]
  151. Suchocka, M.; Jankowski, P.; Błaszczyk, M. Tree protection on construction sites—Knowledge and perception of Polish professionals. Urban For. Urban Green. 2019, 46, 126436. [Google Scholar] [CrossRef]
  152. Suchocka, M.; Jankowski, P.; Błaszczyk, M. Perception of Urban Trees by Polish Tree Professionals vs. Nonprofessionals. Sustainability 2019, 11, 211. [Google Scholar] [CrossRef] [Green Version]
  153. Davies, H.J.; Doick, K.J.; Hudson, M.D.; Schreckenberg, K. Challenges for tree officers to enhance the provision of regulating ecosystem services from urban forests. Environ. Res. 2017, 156, 97–107. [Google Scholar] [CrossRef] [PubMed] [Green Version]
  154. Wang, Y.; Sun, M.; Yang, X.; Yuan, X. Public awareness and willingness to pay for tackling smog pollution in China: A case study. J. Clean. Prod. 2016, 112, 1627–1634. [Google Scholar] [CrossRef]
  155. Pisarek, M. Znaczenie terenów zieleni w świadomości mieszkańców Tarnowa (The importance of green areas in the minds of the inhabitants of Tarnów). Topiarius Stud. Kraj. 2017, 2, 131–144. [Google Scholar]
  156. Rykała, P. Miejskie przestrzenie publiczne—Przykład orientacyjnej wyceny terenu zieleni w Częstochowie (Urban public spaces—An example of an approximate evaluation of a green area in Częstochowa). Rozw. Reg. Polityka Reg. 2019, 45, 103–122. [Google Scholar] [CrossRef]
  157. Lo, A.Y.H.; Jim, C.Y. Citizen attitude and expectation towards greenspace provision in compact urban milieu. Land Use Policy 2012, 29, 577–586. [Google Scholar] [CrossRef] [Green Version]
  158. Tyrväinen, L.; Mäkinen, K.; Schipperijn, J. Tools for mapping social values of urban woodlands and other green areas. Landsc. Urban Plan. 2007, 79, 5–19. [Google Scholar] [CrossRef]
  159. Vesely, É.T. Green for green: The perceived value of a quantitative change in the urban tree estate of New Zealand. Ecol. Econ. 2007, 63, 605–615. [Google Scholar] [CrossRef]
  160. Lohr, V.I.; Pearson-Mims, C.H.; Tarnai, J.; Dillman, D.A. How urban residents rate and rank the benefits and problems associated with trees in cities. J. Arboric. 2004, 30, 28–35. [Google Scholar]
  161. Sanesi, G.; Chiarello, F. Residents and urban green spaces: The case of Bari. Urban For. Urban Green. 2006, 4, 125–134. [Google Scholar] [CrossRef]
  162. Turvey, C.G.; Kong, R. Weather risk and the viability of weather insurance in China’s Gansu, Shaanxi, and Henan provinces. China Agric. Econ. Rev. 2010, 2, 5–24. [Google Scholar] [CrossRef]
  163. Madureira, H.; Nunes, F.; Oliveira, J.V.; Cormier, L.; Madureira, T. Urban residents’ beliefs concerning green space benefits in four cities in France and Portugal. Urban For. Urban Green. 2015, 14, 56–64. [Google Scholar] [CrossRef]
  164. Ward Thompson, C.; Roe, J.; Aspinall, P.; Mitchell, R.; Clow, A.; Miller, D. More green space is linked to less stress in deprived communities: Evidence from salivary cortisol patterns. Landsc. Urban Plan. 2012, 105, 221–229. [Google Scholar] [CrossRef] [Green Version]
  165. Jim, C.Y.; Shan, X. Socioeconomic effect on perception of urban green spaces in Guangzhou, China. Cities 2013, 31, 123–131. [Google Scholar] [CrossRef]
  166. Arnberger, A.; Eder, R. Are urban visitors’ general preferences for green-spaces similar to their preferences when seeking stress relief? Urban For. Urban Green. 2015, 14, 872–882. [Google Scholar] [CrossRef]
  167. Derkzen, M.L.; van Teeffelen, A.J.A.; Verburg, P.H. Green infrastructure for urban climate adaptation: How do residents’ views on climate impacts and green infrastructure shape adaptation preferences? Landsc. Urban Plan. 2017, 157, 106–130. [Google Scholar] [CrossRef]
  168. Tyrväinen, L.; Pauleit, S.; Seeland, K.; de Vries, S. Benefits and Uses of Urban Forests and Trees. In Urban Forests and Trees: A Reference Book; Konijnendijk, C., Nilsson, K., Randrup, T., Schipperijn, J., Eds.; Springer: Berlin/Heidelberg, Germany, 2005; pp. 81–114. [Google Scholar]
  169. Sram, R.J.; Binkova, B.; Dostal, M.; Merkerova-Dostalova, M.; Libalova, H.; Milcova, A.; Rossner, P.; Rossnerova, A.; Schmuczerova, J.; Svecova, V.; et al. Health impact of air pollution to children. Int. J. Hyg. Environ. Health 2013, 216, 533–540. [Google Scholar] [CrossRef]
  170. Vichit-Vadakan, N.; Vajanapoom, N. Health impact from air pollution in thailand: Current and future challenges. Environ. Health Perspect. 2011, 119, 196–198. [Google Scholar] [CrossRef] [Green Version]
  171. Rabl, A.; Spadaro, J.V. Public Health impact of air pollution and implicayions for the energy system. Annu. Rev. Energy Environ. 2003, 25, 601–627. [Google Scholar] [CrossRef]
  172. Künzli, N.; Kaiser, R.; Medina, S.; Studnicka, M.; Chanel, O.; Filliger, P.; Herry, M.; Horak, F.; Puybonnieux-Texier, V.; Quénel, P.; et al. Public-health impact of outdoor and traffic-related air pollution: A European assessment. Lancet 2000, 356, 795–801. [Google Scholar] [CrossRef]
  173. Jeong, S.J. The Impact of Air Pollution on Human Health in Suwon City. Asian J. Atmos. Environ. 2013, 7, 227–233. [Google Scholar] [CrossRef] [Green Version]
  174. Bayat, R.; Ashrafi, K.; Shafiepour Motlagh, M.; Hassanvand, M.S.; Daroudi, R.; Fink, G.; Künzli, N. Health impact and related cost of ambient air pollution in Tehran. Environ. Res. 2019, 176, 108547. [Google Scholar] [CrossRef] [PubMed]
  175. Naddafi, K.; Hassanvand, M.S.; Yunesian, M.; Momeniha, F.; Nabizadeh, R.; Faridi, S.; Gholampour, A. Health impact assessment of air pollution in megacity of Tehran, Iran. Iran. J. Environ. Health Sci. Eng. 2012, 9, 28. [Google Scholar] [CrossRef] [PubMed] [Green Version]
Figure 1. Location of the case study area—Warsaw city.
Sustainability 13 10611 g001
Figure 2. Location of the tree inventory at Marszałkowska Street.
Sustainability 13 10611 g002
Figure 3. Location of the tree inventory at Żwirki i Wigury Street.
Sustainability 13 10611 g003
Figure 4. Respondent age distribution in the sample group. Source: own study base on the survey.
Sustainability 13 10611 g004
Figure 5. Average PM2.5 absorption by a single tree. Source: own study base on the survey.
Sustainability 13 10611 g005
Table 1. Age brackets in the research sample.
Values in the Group below the 1st QuartileValues in the Group between the 1st and 2nd QuartileValues in the Group between the 2nd and 3rd QuartileValues in the Group below the 4th Quartile
Age bracket<18;25><26;31><32;40><41;75>
Percentage of respondents in each group25252525
Average age in the group21293654
Source: own study base on the survey.
Table 2. Percentage of the respondents’ assessment of air quality and their concern for air pollution in Warsaw.
Assessment
012345
Concern for the issue of air pollutionGeneral assessment5.58.111.445.022.97.0
Assessment in specified age brackets
<18;25>19.429.017.719.49.74.8
<26;31>1.61.611.161.915.97.9
<32;40>1.32.69.062.817.96.4
<41;75>1.51.58.832.447.18.8
% of respondents
Air qualityGeneral assessment1.822.938.021.814.01.5
Assessment in specified age brackets
<18;25>3.212.924.221.035.53.2
<26;31>0.017.256.320.33.13.1
<32;40>1.317.947.225.66.41.3
<41;75>2.942.622.119.113.20.0
% of respondents
where: 0—absolutely unconcerned, 5—absolutely disturbing (Concern for the issue of air pollution). 0—very bad quality, 5—very good quality (Air quality). Source: own study base on the survey.
Table 3. Percentage of the respondents’ assessment of the impact of activities on air pollution in Warsaw.
Assessment
012345
Using lignite, plastic, particle board and other unsuitable materials for fuel in central heating7.432.826.620.35.57.4
Burning waste (rubbish) in home furnaces5.511.429.330.614.08.5
Exhaust emissions from traffic (e.g., passenger cars, lorries)1.14.412.229.532.120.7
CHP plants2.28.127.336.219.96.3
exhaust emissions generated by production plants (stacks)6.326.226.927.77.85.2
% of respondents
where: 0—not harmless at all, 5—very harmful. Source: own study base on the survey.
Table 4. Percentage of the respondents’ assessment of activities which contribute to the reduction of air pollution in Warsaw.
Assessment
Activity012345
Chimney stack filters (e.g., in industrial plants)6.629.529.925.16.32.6
Renewable energy sources (photovoltaic panels in lanterns and at bus stops)0.72.617.339.529.210.7
Green belts which separate industrial grounds5.216.629.231.012.25.9
Presence of urban parks and forests1.84.417.026.933.915.9
Green areas and street greenery (such as squares, lawns, meadows)4.111.825.132.815.111.1
Popularisation of collective transport (urban public transport—railway, buses and tramways)0.73.012.936.231.016.2
Popularisation of individual eco-friendly means of transport (e.g., bicycles)1.14.49.629.231.424.4
% of respondents
where: 0—it does not contribute at all, 5—contributes a lot. Source: own study base on the survey.
Table 5. Percentage of the respondents’ assessment of the impact of polluted air on health.
Assessment
012345
Impact of polluted air on healthGeneral assessment12.943.219.214.06.34.4
Assessment in specified age brackets
<18;25>35.529.09.712.99.73.2
<26;31>7.958.715.99.51.66.3
<32;40>5.157.724.46.42.63.8
<41;75>5.925.025.027.911.84.4
% of respondents
Assessment
012345
Consequences of polluted air on health
Chronic bronchitis15.545.019.612.55.22.2
Runny nose, frequent colds20.742.418.18.56.63.7
Accelerated process of aging43.526.210.08.58.93.0
Increased cancer incidence45.425.18.97.48.54.8
Reduced birth weight in newborns66.413.77.07.44.11.5
Increased number of high-risk pregnancies and complications63.114.87.46.35.92.6
Rash49.825.510.36.34.14.1
Headache15.139.921.011.86.65.5
Increased number of heart attacks and strokes32.135.411.812.94.83.0
% of respondents
where: 0—no impact, 5—influences very strongly (Impact of polluted air on health). 0—without consequences, 5—very high consequences (Consequences of polluted air on health). Source: own study base on the survey.
Table 6. Percentage of the respondents’ assessment of the importance of ecosystem functions of trees.
Assessment
Activity012345
Decorative aspect0.71.811.126.228.831.4
Increased biological diversity of tree species4.427.724.421.816.25.5
Increased biological diversity of species (e.g., birds)1.124.026.923.215.59.2
Cooling the air1.15.216.228.825.523.2
Slowing down precipitation7.012.916.613.729.919.9
Air quality improvement1.54.112.917.015.948.7
Retention of rainwater9.217.311.114.828.419.2
Noise protection0.47.415.118.115.543.5
Reduction of stress and aggression levels12.521.424.711.817.312.2
Development of local communities49.423.212.55.53.06.3
% of respondents
where: 0—not relevant at all, 5—even more important. Source: own study base on the survey.
Table 7. Percentage of the respondents’ assessment of the trees’ capacity to absorb air pollution (PM2.5 and PM10).
Assessment
012345
Absorption of air pollution (PM2.5 and PM10) by treesGeneral assessment12.245.021.411.45.54.4
Assessment in specified age brackets
<18;25>37.127.49.717.74.83.2
<26;31>4.861.915.97.96.33.2
<32;40>3.867.916.73.85.12.6
<41;75>5.919.142.617.65.98.8
% of respondents
where: 0—no possibility, 5—very high possibility. Source: own study base on the survey.
Table 8. Percentage of the respondents’ assessment of the significance of highlighted elements of Marszałkowska Street and Żwirki i Wigury Street.
Marszałkowska Street
Assessment
Element012345
Biodiversity85.23.73.03.33.71.1
Dust reduction provided by trees86.04.83.01.82.61.8
Cooling down the air87.53.31.81.53.72.2
Noise protection88.62.61.53.72.61.1
Retention of rainwater88.93.31.12.62.21.8
Decorative aspect41.039.511.14.41.82.2
% of respondents
Żwirki i Wigury Street
Assessment
Element012345
Biodiversity0.718.529.525.519.26.6
Dust reduction provided by trees12.939.921.813.78.53.3
Cooling down the air0.79.218.126.623.621.8
Noise protection0.411.114.418.810.744.6
Retention of rainwater10.717.012.513.331.415.1
Decorative aspect1.55.513.314.418.147.2
% of respondents
where: 0—not relevant at all, 5—even more important. Source: own study base on the survey.
Table 9. Average absorption of impurities: CO, NO2, O3, SO2 by a single tree.
Average Absorption of Impurities by a Single Tree [g]
Marszałkowska StreetŻwirki i Wigury Street
MonthCONO2O3SO2CONO2O3SO2
January0.040.770.500.100.092.991.980.41
February0.040.940.400.130.114.012.030.44
March0.041.130.670.130.094.432.700.44
April0.313.694.850.291.2417.9924.991.33
May0.445.607.190.441.7127.3132.911.92
June0.405.468.130.441.5226.3736.871.93
July0.385.089.230.441.491.4942.072.01
August0.384.298.560.351.4320.7239.191.69
September0.404.234.920.351.5220.4422.291.69
October0.312.602.400.311.2712.5711.141.43
November0.040.880.400.080.093.481.530.37
December0.020.810.810.000.083.133.130.33
Total2.7935.4848.043.0610.64144.93220.8314.01
Average0.232.964.000.260.8912.0818.401.17
Source: own study base on the survey.
Publisher’s Note: MDPI stays neutral with regard to jurisdictional claims in published maps and institutional affiliations.

