Article

Interactions between the Built Environment and the Energy-Related Behaviors of Occupants in Government Office Buildings

1
Sichuan Institute of Building Research, Chengdu 610030, China
2
School of Mechanical Engineering, Southwest Jiaotong University, Chengdu 610030, China
3
Department of Building Science, Tsinghua University, Beijing 100084, China
*
Author to whom correspondence should be addressed.
Sustainability 2021, 13(19), 10607; https://doi.org/10.3390/su131910607
Submission received: 30 August 2021 / Revised: 16 September 2021 / Accepted: 20 September 2021 / Published: 24 September 2021

Abstract

:
Human behaviors that greatly influence building energy consumption are stimulated by the indoor environment. However, the relative importance of different environmental factors remains unclear. Previous literature mostly focused on single behavior. Holistic study of multiple energy-related behaviors is scarce. To fill the gap, this study investigated 22 government office buildings in Sichuan using questionnaires and field measurement. Environmental factors were ranked based on the two dimensions of “importance level’level” and “satisfaction level”. The key energy-related behaviors were identified by the comparative study between low- and high-energy-consuming buildings. Lastly, interactions between the building energy consumption, indoor environment quality, occupants’ satisfaction, and human behaviors were analyzed. Questionnaires reveal that most occupants consider indoor air quality as the prior “pain point” while feeling satisfied enough with the thermal environment. Although people attach less importance to the acoustic environment, they manifest evident discontent, suggesting that noise control is an urgent imperative. In contrast, occupants are relatively unconcerned with illuminance, which implies the feasibility of saving energy by reasonably reducing lighting requirements of some non-critical areas. The comparative study indicates that increased energy consumption was attributable to extra personal appliances, wasteful air conditioning habits, and the lack of ventilation in summer. The objective environment of high-energy-consuming buildings is slightly better. However, the difference in perceived satisfaction was not obvious. The findings of this study contribute to determining the most noteworthy environmental factor and the key energy-related behaviors and provide reference information for optimizing energy-saving strategies.

1. Introduction

The influence of human–building interactions on building energy consumption is no less significant than that of equipment and technologies. For instance, green buildings that integrate a multitude of energy-efficient technologies can suffer performance degradation because of improper operation. Turner et al. found that the actual energy consumption of 92 green buildings certified by LEED during 2001 and 2007 was 41% higher than the design value on average [1]. Further, 28–35% of LEED buildings did not outperform their conventional counterparts in terms of energy efficiency, and the main cause lies in users’ unfamiliarity with green technologies [2]. Therefore, high-performance equipment and advanced technologies alone are insufficient to ensure building energy efficiency.
Appropriate interventions for human behaviors have considerable energy-saving potential. Gill et al. reported that energy-efficiency behaviors account for 37% of the reduction in electricity consumption of houses from the UK EcoHomes site [3]. Clevenger and Haymaker simulated building energy consumption under different behavior schedules, and a discrepancy of energy consumption up to 150% was observed among the simulated cases [4]. Sonderegger et al. analyzed the influence of human behavior by comparing the gas consumption of 205 identical townhouses and found that 33% of the variation resulted from energy-consuming habits [5]. Overall, some studies summarized that behavioral change can reduce energy use by 6–25% for residential buildings [6] and 5–30% for commercial buildings [7]. Apart from the direct effects on energy consumption, human behaviors impose extra challenges on building operation by causing fluctuations in energy demand [8,9]. Supply–demand coordination is essential for improving building energy efficiency [10], and volatility in energy demand is unfavorable [9,11]. Therefore, understanding occupants’ behaviors is of great significance for enhancing building energy-saving strategies. Moreover, the building industry should aim at an indoor environment conducive to people’s health and well-being, rather than constructing buildings merely fit for survival [12]. People are not passive recipients of their immediate environment but are constantly interacting with and adapting to it [13]. Thus, not only the observable behaviors but also the underlying perceptions of occupants deserve thorough research.
Human–building interactions are attributed to complex factors such as physiology, psychology, and social context [14]. To cast light on this issue, the existing studies can be divided into the following categories: (1) developing or optimizing human behavior models, so as to simulate building energy more accurately [15,16,17,18]; (2) estimating the effect of human behavior on building energy consumption by analyzing energy statistics and performing field tests on similar buildings [4,5,7]; and (3) characterizing the attitudes of building users towards energy-saving technologies and policies, and evaluating the effectiveness of a certain strategy [19,20,21].
Despite the surging volume of relevant literature, there are some long-standing limitations. First, most behavior models used in building energy simulation are data-driven and mainly deal with objective factors that can be expressed mathematically, such as occupancy profile [18]. The effects of occupants’ subjective perceptions are not well studied. Particularly, how occupants weigh the importance of different environmental factors, such as thermal comfort and indoor air quality, remains unclear. This limitation blurs the breakthrough point for improving the indoor environment. Second, previous studies often focus on a single type of behavior [4]. However, the various human behaviors tend to be interconnected. For instance, temperature and humidity can also influence people’s perception of indoor air quality [22]. Consequently, the air conditioning behaviors may affect the use of air cleaners as well. Therefore, it is necessary to rank the priority of different environmental factors based on building users’ perceptions and conduct a holistic study on the key energy-related behaviors.
This study involved a questionnaire survey and field measurement of 22 government office buildings in Sichuan, China. The main purposes are three-fold: first, to survey the perceived importance level and satisfaction level of different environmental factors (thermal comfort, indoor air quality, acoustic environment, light environment) and analyze the results based on the cognitive decision model; second, to identify key energy-related behaviors through the comparative study between low- and high-energy-consuming buildings; and third, to analyze the correlations between the key energy-related behaviors, as well as between the building energy consumption, objective environment quality, and occupants’ satisfaction. The findings can help building operators to focus on the real pain points of environmental factors so that occupants’ satisfaction can be improved without futile investment. The correlation analysis reveals the influence of energy consumption on both objective and subjective indoor environment quality and indicates how energy-related behaviors interconnect. These results can assist researchers and practitioners in optimizing energy-saving behavior management strategies.
The paper is organized as follows. Firstly, basic information about the 22 survey buildings is introduced in Section 2. Then, the cognitive model, the design of the questionnaire, and the field measurement method are described in Section 3. Section 4 discusses the results of participants’ profiles, their perceptions of indoor environment, influences of energy-related behaviors, and correlations between energy use, environment quality, and occupants’ perceived satisfaction. Lastly, a preliminary correlation analysis of the key energy-related behaviors is expounded.

2. Investigated Buildings

The 22 survey buildings are government office buildings distributed in the 18 prefecture-level cities and the three autonomous prefectures of Sichuan Province (Figure 1). In China, government office buildings share higher similarity than other civil buildings because of the strict regulations on their construction and the highly stable working schedules of the occupants. Therefore, the survey buildings are considered as representative.
As shown in Table 1, split air conditioners and centralized air conditioning systems account for 30% and 70%, respectively. Either split air conditioners or centralized systems employing air-cooled heat pumps and variable refrigerant volume (VRV) are used for both cooling and heating, whereas buildings relying on electric chillers require additional boilers in winter.
Electricity is the primary energy consumed by these buildings. The average energy use intensity (E) of the 22 buildings is 50.5 kWh/(m2·a), which is significantly lower than that of similar buildings in developed countries [23]. Even the highest value of 70.5 kWh/(m2·a) is still lower than the average E of commercial office buildings in first-tier cities at the same latitude in China [24]. However, after excluding the influence of personnel density and operation time according to the national standard GB/T 51161 [25], the lowest adjusted E rises to 79.4 kWh/(m2·a), which exceeds the stipulated energy consumption quota of 70 kWh/(m2·a).
In general, the surveyed buildings have been in operation for at least 10 years, and most of them use air-cooled heat pumps or split-air conditioners. The overall energy use intensity was low, partly because of the low staff density.

3. Methods

3.1. User–Building Interaction Model

The user–building interaction model was developed based on the cognitive decision theory [26]. According to the decision theory, people’s interactions with buildings are driven by five factors: (1) state prior to decision; (2) valence of the change of local environmental conditions; (3) force to execute operation; (4) secondary costs; (5) benefits of action. As depicted in Figure 2, the five driving factors are integrated into three aspects of the occupants’ cognition under the framework of the user–building interaction model.
This new framework, which characterizes subjective cognition by the two dimensions of “satisfaction level” and “importance ranking”, is more convenient for diagnosing the indoor environment and prioritizing different environmental factors. Specifically, the environmental factors can be categorized into the following groups with descending priority: (1) important and unsatisfactory; (2) trivial and unsatisfactory; (3) important and satisfactory; and (4) trivial and satisfactory.
In response to environmental stimuli, building users may take actions to enhance comfort. Human behaviors that simultaneously influence the built environment and energy consumption mainly include air conditioning, lighting, ventilation, and the use of some personal electric appliances, such as portable humidifiers, portable air cleaners, and desk lamps. These behaviors are focused on in the questionnaire survey.

3.2. Questionnaire

Based on the user–building interaction model, the aim of the survey was to inspect participants’ opinions on the current indoor environment and their energy-related behaviors. The questionnaire is divided into three major sections, and the specific contents are listed in Table 2.
(1) Basic information: Information about participants’ affiliations, the location of their seats, and the usual working schedule was collected. The data were used to build a profile of the participants.
(2) Evaluation of indoor environment: First, participants were asked to rank thermal comfort, indoor air quality, acoustic environment, and light environment in the order of importance. Then, they had to rate the satisfaction level of each environmental factor on a scale of zero to 10. Note that the 10-point scale was adopted because it had been commonly used in the regular satisfaction survey conducted by the property departments of the survey buildings. The occupants were quite accustomed to and understood the 10-point scale. However, a major concern of using a multi-point scale with more than seven points is that people may not be able to make clear preference judgments [27,28]. There is a trade-off between participants’ habits and performance of the subjective measurement instrument. Therefore, this study counted the votes of score intervals instead of single points so as to offset the negative effect. Lastly, participants can choose to fill in improvement suggestions for each environmental factor.
(3) Energy-related behaviors: the surveyed energy-related behaviors include the air conditioning habits, lighting habits, personal electric appliances using habits, and window-opening habits. ownership rates of personal devices, as well as the proportions of different patterns of the surveyed energy-related behaviors, were compared between high- and low-energy-consuming buildings. In addition, Pearson correlation analysis was performed on the proportion of each pattern of the surveyed behaviors so as to estimate the interrelations between these behaviors. All the data were checked for normality before the correlation analysis.
Questionnaires were sent online and offline with the help of project managers. The online questionnaire platform allows personalized settings such as limiting the times of participation for each IP, judging the validity of the collected questionnaire based on the time spent answering the questions, and recording the IP address to verify the affiliation. Thus, the reliability of the questionnaires can be improved.
A total of 902 valid questionnaires were collected. Published literature has provided tables for determining the sample size [29]. Accordingly, 909 participants out of the total 4999 occupants from the 22 survey buildings needed to be surveyed to ensure a confidence level of 95% and a precision of ±3%. Therefore, the number of valid questionnaires basically satisfies the requirement. Over 70% of the buildings had a survey participation rate exceeding 15%. Questionnaires from buildings with extremely low participation rate were excluded from the comparative study. Obvious outliers, such as an air conditioning set temperature of 0 °C, were also removed.

3.3. Field Measurement

Objective environment of the 22 survey buildings was investigated by field measurement. For each surveyed building, the measurement was conducted on a typical working day and took approximately six to 10 h, depending on the number of sampled rooms. Thermal comfort (air temperature and relative humidity), indoor air quality (CO2), light environment (illuminance), and acoustic environment (A-weighted sound pressure level of noise) were inspected. As an effective indicator of ventilation, CO2 concentration is also commonly used to evaluate indoor air quality (IAQ). On one hand, it has been confirmed that higher levels of ventilation contribute to removing various indoor air pollutants [30]. On the other hand, CO2 is no less important than other pollutants especially for densely populated buildings [31,32]. The surveyed buildings are offices that do not allow indoor smoking, and none of them are newly decorated. There are no major sources of indoor particulate matter or volatile organic compounds. Therefore, CO2 was selected as the indicator for IAQ.
Table 3 summarizes the test standards, limit values, and measuring instruments of the selected environmental parameters. According to the test standards, at least 10% of the total rooms were sampled. For buildings with less than 100 rooms, at least 10 rooms were selected. The number of measuring points in a room was determined by the room area. Furthermore, the measuring points were evenly distributed throughout the occupied zone, and appropriate spacing was kept between adjacent points. All parameters were measured at each point. Except for the reference plane of illuminance, which was 750 mm from the room floor, all parameters were measured at the height of 1500 mm.
Air temperature, relative humidity, and CO2 concentration were automatically recorded by monitors every five minutes for six hours continuously. Meanwhile, illuminance and A-weighted sound pressure level of noise were measured three times repeatedly at each point. The multifunction sound level meter was used to measure the noise level, and each measurement continued for 10 min to calculate the integral average. As required in the national standard, the noise level was measured without occupants in the room. For the tests of other parameters, occupants’ behaviors were not interfered. All building service systems functioned properly during the test. The average measured value of a certain parameter at all points was taken as the final result of the room, and the percentage of rooms meeting the corresponding standard requirements was the compliance rate of this parameter.

4. Results

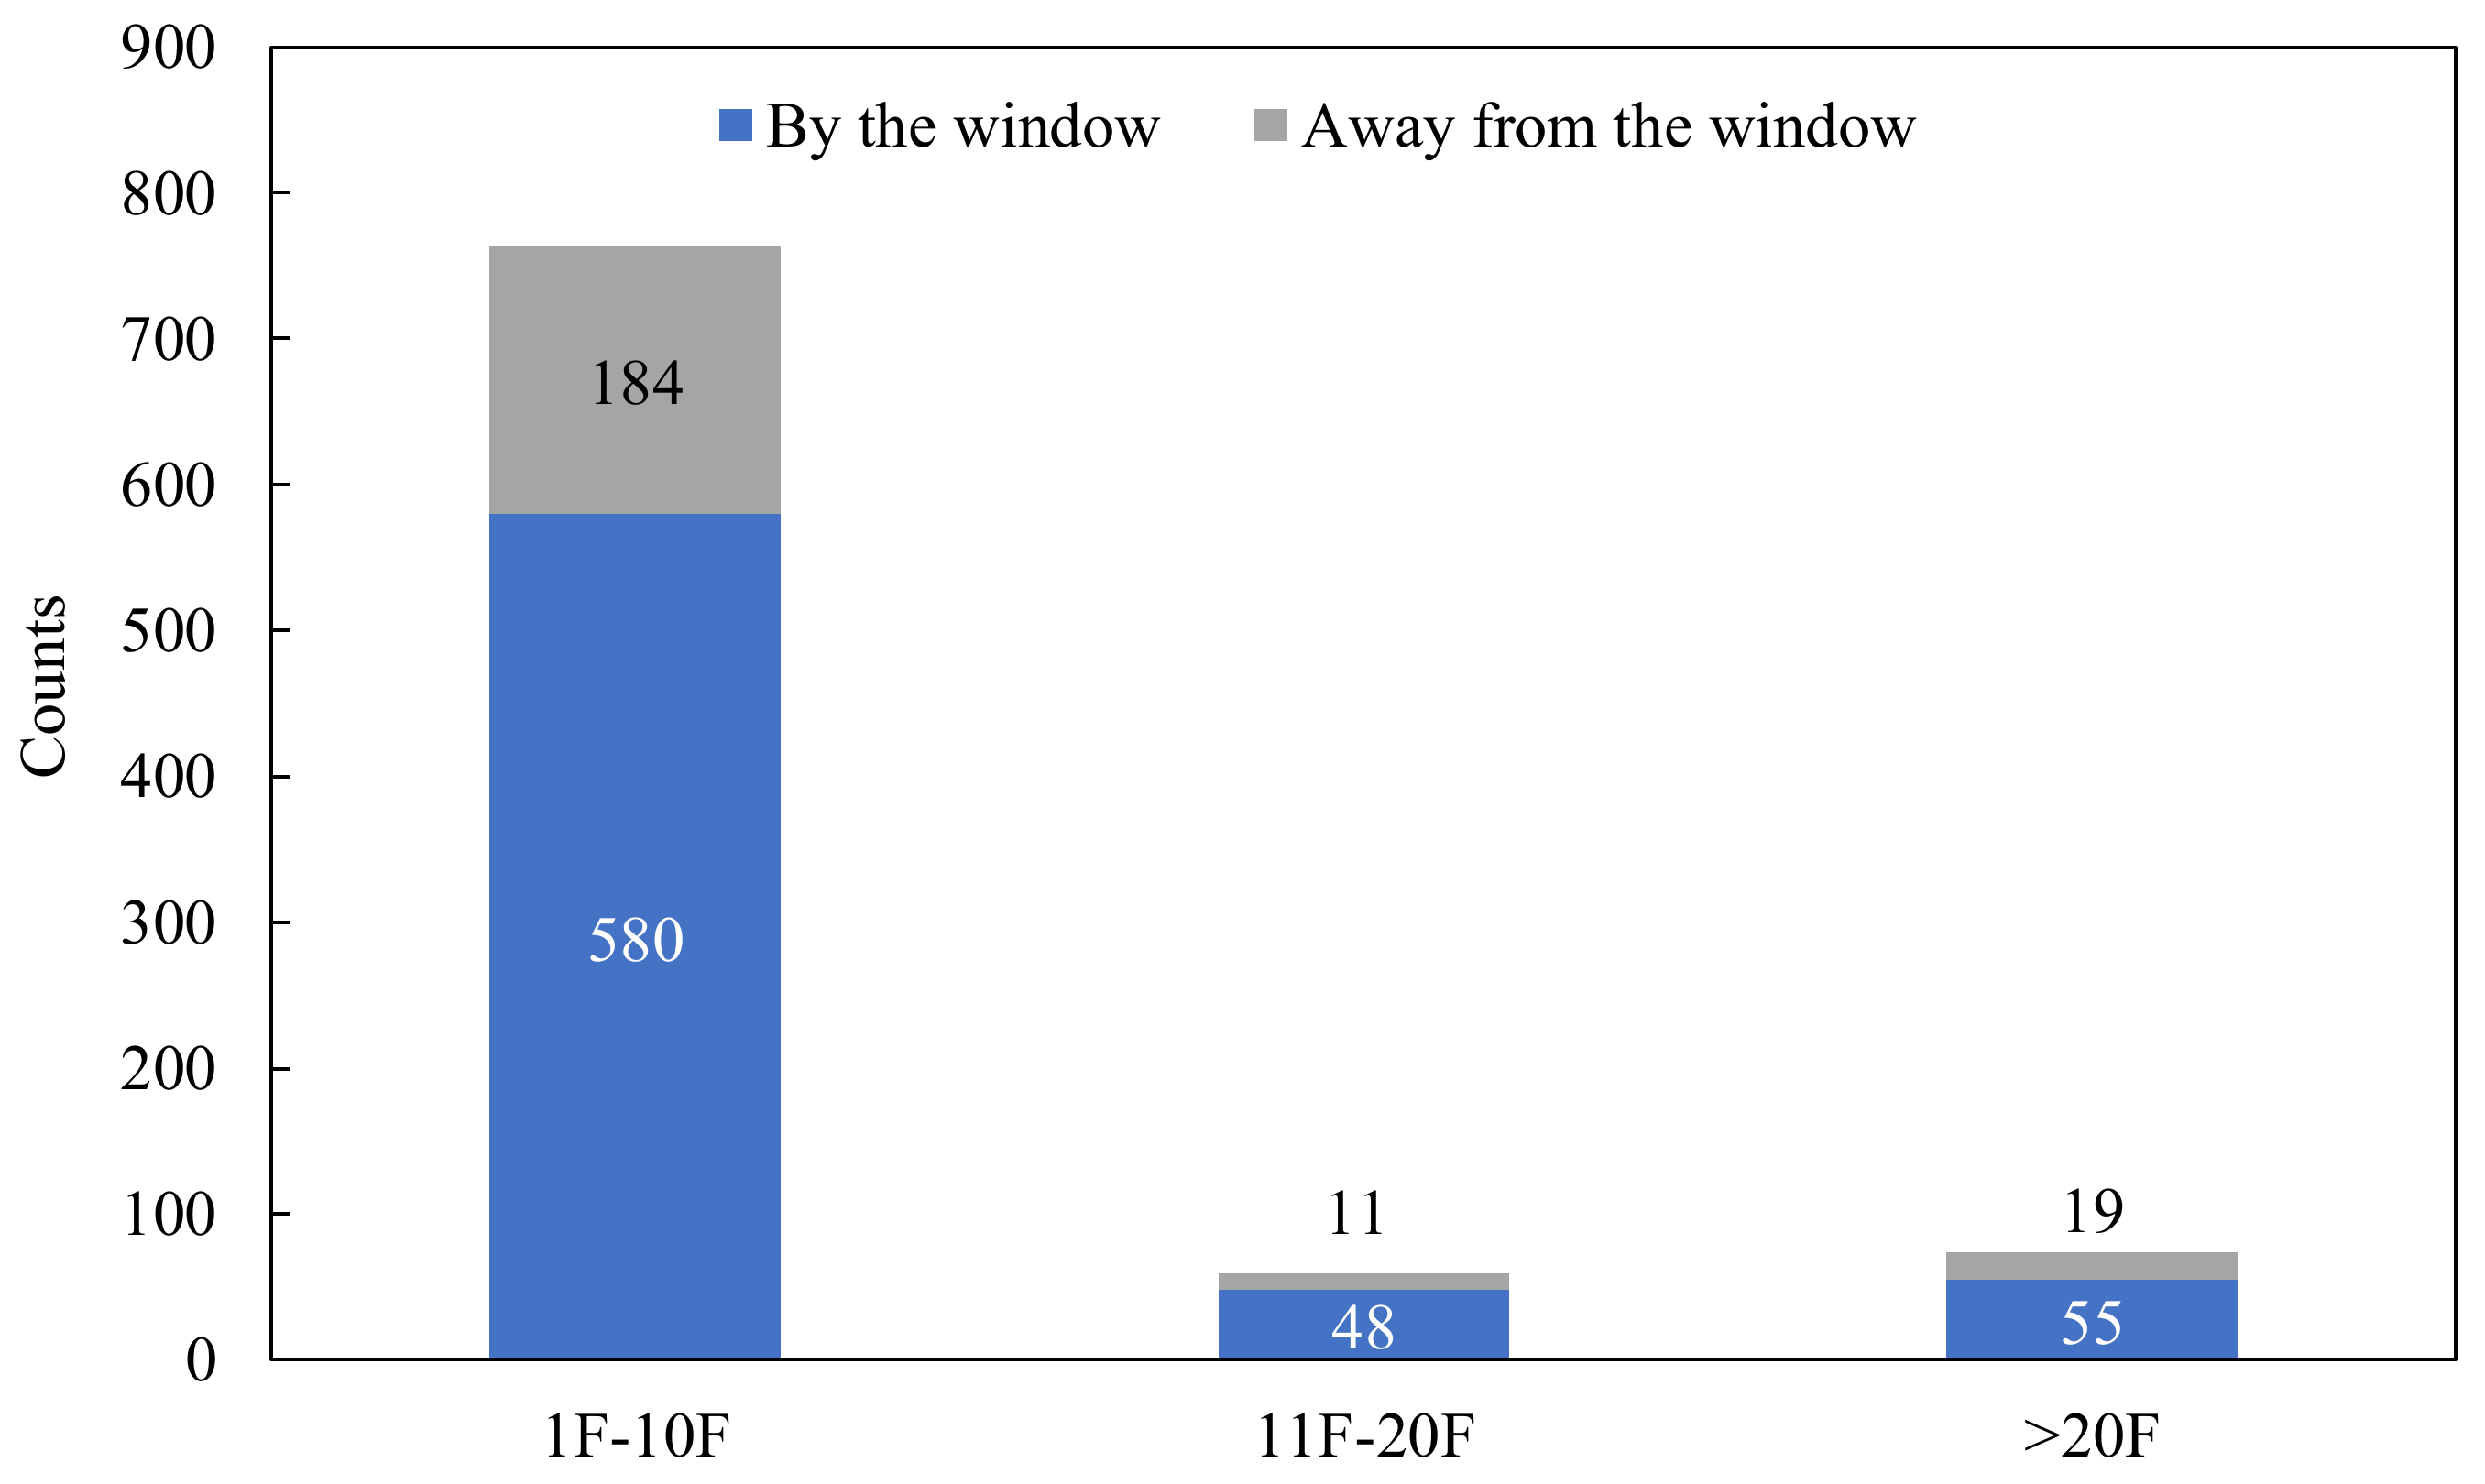
4.1. Participant Profiles

According to the statistics, 85% of the participants worked on lower floors (1F-10F), and 76% were seated by the window (Figure 3). This feature may amplify the impact of outdoor noise on personnel. From the perspective of the personnel’s working schedule, three typical patterns are defined: Type A refers to fixed working hours and little fieldwork. The staff arrive and leave the building on fixed time every day. In addition, they rarely leave the building during working hours. Type B refers to fluctuating working hours and little fieldwork. Type C refers to fluctuating working hours and frequent fieldwork. The occupancy of a building will vary greatly if Type C is the dominant pattern.
Figure 4a shows that around 90% of the participants rarely leave the building during office hours, and nearly 60% have fixed working hours. In other words, for the building analyzed in this study, the number of people in the room and the working schedule are nearly constant. This is likely to result in an obvious regularity in the daily energy consumption. In terms of overtime frequency throughout the year (Figure 4b), a majority worked less than 20% over time. Thus, building energy consumption is expected to enter a trough over the weekend.

4.2. Subjective Cognition of Indoor Environment

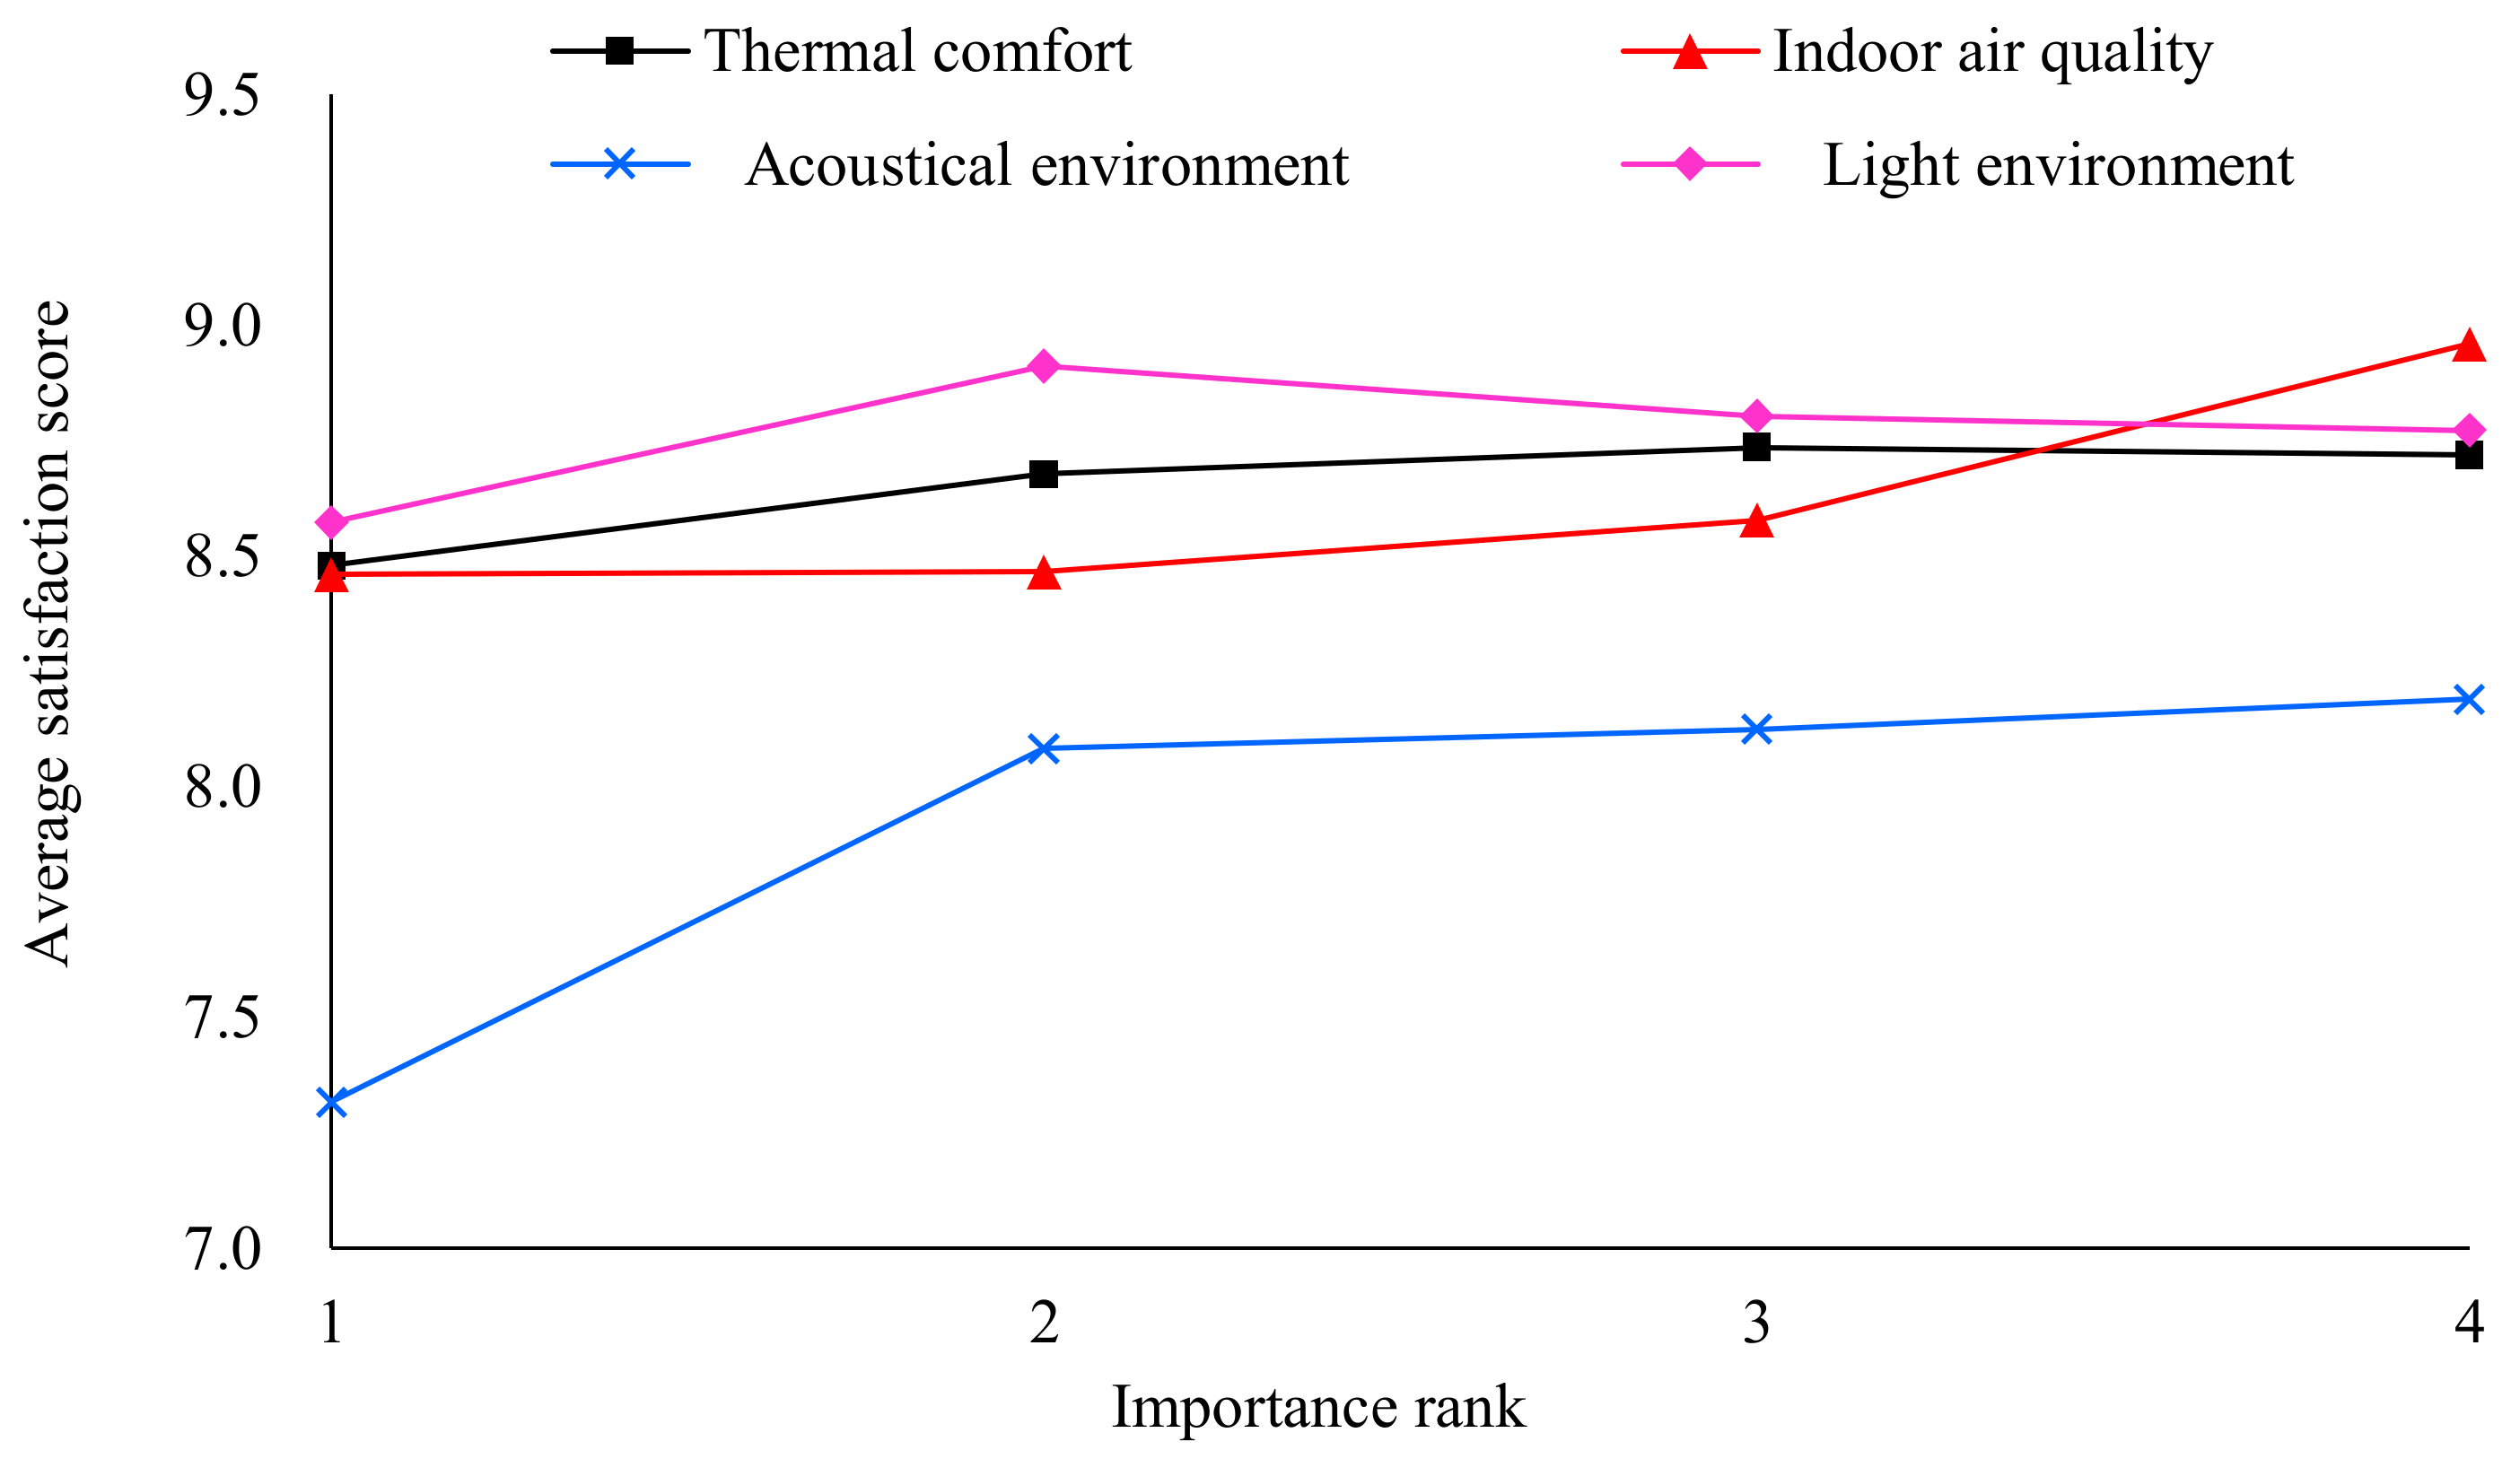
4.2.1. Importance Level of Different Environmental Factors

Table 4 shows the occupants’ votes on the importance level of thermal comfort, indoor air quality, acoustic environment, and light environment. A smaller ranking number indicates higher priority. For instance, approximately 24.7% of the participants ranked thermal comfort first, which means they valued thermal comfort the most. As can be seen, over 90% of the respondents considered indoor air quality as the most or second-most important. The average importance rank of indoor air quality is 1.45, suggesting that emphasizing indoor air quality has almost become a consensus. Thermal comfort also receives considerable attention, with an average importance rank of 2.46. Nevertheless, respondents’ votes for thermal comfort are more scattered and evenly distributed, which indicates the inconsistency in people’s opinions. The average importance rank of the light and acoustic environment is 2.88 and 3.02, respectively. Most participants put them in the third or fourth place, while few people list them as the primary concern. The results can be interpreted as follows.
The importance of indoor air quality has started to take root among the masses. In the past two decades, the extensive use of artificial building and decoration materials in China has significantly raised the concentrations of indoor volatile organic compounds. Higher living standards today promote people’s health awareness and knowledge [39]. More and more people are becoming aware of the exposure to hazardous air pollutants. Respiratory diseases and sick building syndrome related to indoor air pollutions have aroused widespread concern across society [41]. In other words, indoor air quality is more closely connected with health and safety than just an indicator of comfort.
Maintaining livable thermal environment is among the primary functions of buildings, yet it is not difficult for modern buildings with air conditioning systems. Nevertheless, the thermal comfort zone varies greatly among people. Some have strong adaptability, while others are sensitive to the change of temperature and humidity [28]. The variance in votes of the importance rank of thermal comfort may partly result from the diversity of people’s thermal comfort zones.
The influences of light and acoustic environment on human comfort and health are more complex and obscure. People without an educational background in building science are yet to possess adequate knowledge for understanding quantitative indicators of acoustic and light environments, which also hinders them from recognizing the importance of adequate illuminance and noise control.

4.2.2. Satisfaction Score of Different Environmental Factors

In addition to the importance level, the questionnaire invited respondents to rate their satisfaction with each environmental factor. The full score is 10, and a higher score indicates better performance. As shown in Table 5, the average scores of thermal comfort, indoor air quality, acoustic environment, and light environment were 8.8, 8.6, 8.2, and 9.0, respectively. In general, the current indoor environment satisfies occupants well. Note that indoor air quality that ranks the highest in importance receives the second-lowest score, and its score is also lower than the average of the four factors. The result suggests that indoor air pollution is a real pain point. Improvement of indoor air quality has great potential for boosting people’s satisfaction. In contrast, although participants also emphasize thermal comfort, most of them feel comfortable enough with the current conditions. That is, the significance of optimizing thermal and humidity environment is limited. Instead, the focus would better be shifted to the energy-efficient operation of air-conditioning systems. Although the acoustic environment ranks low in importance, many participants still find it rather unsatisfactory. This indicates that the basic needs of the occupants for quietness are not met. There are probably some serious defects in noise control that should be remedied urgently. Lastly, the light environment receives neither too much attention nor too many complaints. Therefore, it is reasonable to properly lower the lighting power density of non-critical areas. Energy-saving control strategies, such as lighting according to occupancy, are also recommended.
Another intriguing phenomenon is that the satisfaction score of an environmental factor seems to be negatively related to its importance rank (Figure 5). There are two possible mechanisms: First, a higher degree of emphasis raises the ideal standards and thus increases the difficulty of satisfying the requirements. Second, a higher degree of emphasis makes people more sensitive to defects and makes them harder to be pleased. Users of different types of buildings tend to evaluate environmental factors differently. For instance, occupants are much more concerned with acoustic environment in residential buildings. Therefore, it is necessary to develop different maintenance strategies for each environmental factor based on building functions and occupants’ perceptions.

4.3. Influences of Energy-Related Behaviors

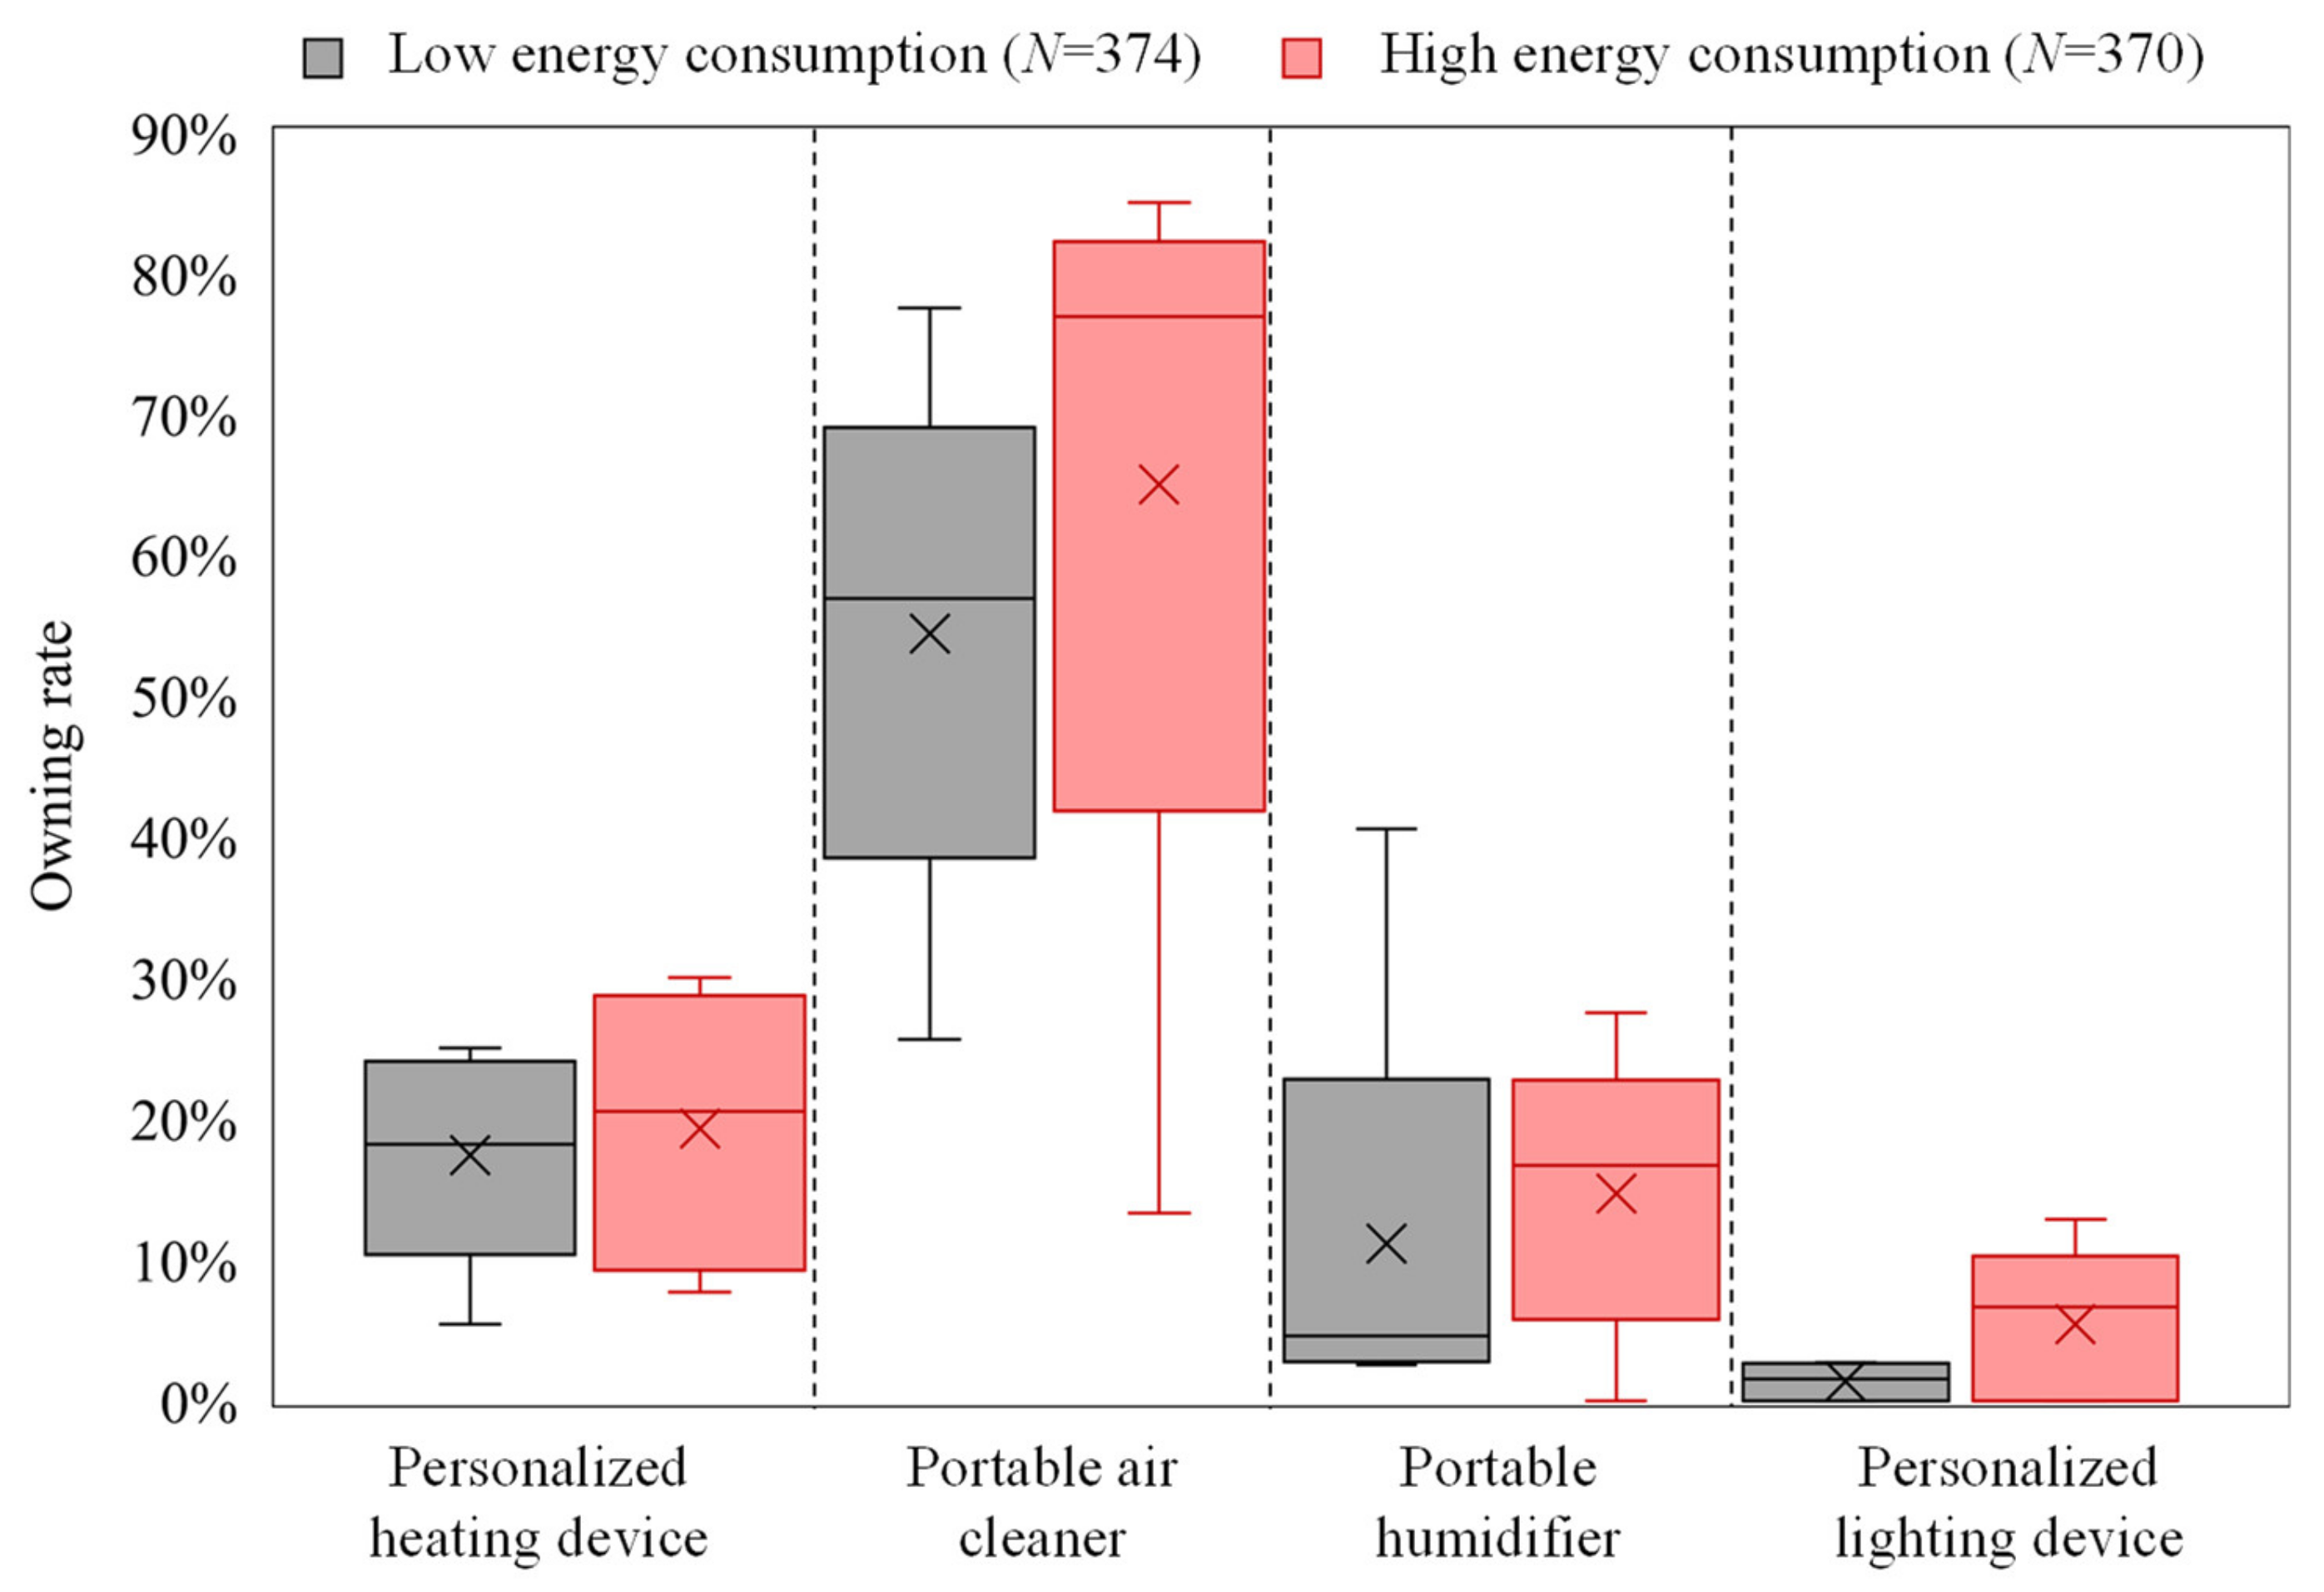
4.3.1. Personal Electric Devices

Personal heating devices, portable humidifiers, portable air cleaners, and personal lighting devices are commonly used appliances that draw power from sockets. For comparative study, the survey buildings were divided into two groups consisting of 70% of the high-energy-consuming buildings (E > 50 kWh/m2) and 30% of the low-energy-consuming buildings (E < 40 kWh/m2).
Figure 6 shows the ownership rates of the devices above for the two groups of buildings. Consistent with the previous finding that indoor air quality is of the greatest concern, the ownership rate of portable air cleaners is the highest among the four kinds of devices. Personalized devices for adjusting thermal and humidity microenvironment, such as mini radiant heaters and portable humidifiers, are also widely used. This is because many office buildings in Southern China rely on air conditioning for heating in the winter. However, draft sensation, temperature stratification, and dryness are common problems that arouse discomfort. Consequently, many people turn to prefer personalized heating and humidifying methods [42]. Since few participants complain about the light environment, and most of them place little focus on it, personalized lighting devices such as desk lamps have a very low utilization rate. Previous studies have pointed out that office staff work on electronic screens most of the time, and therefore they have lower illumination requirements of the surrounding environment than in the past [43]. However, it is crucial to ensure a brightness contrast between the background and the screen.
Overall, the ownership rates of personal electric devices are higher in high-energy-consuming buildings. According to statistics, the lighting socket system accounts for up to 34% of the total energy use [44,45]. On one hand, extra appliances directly increase building energy consumption. On the other hand, this reflects that occupants possibly weigh personal comfort over saving energy. Users of high-energy-consuming buildings may be more likely to pay for increased energy in exchange for higher environmental quality. The difference in notions can have a more lasting impact on building energy consumption.

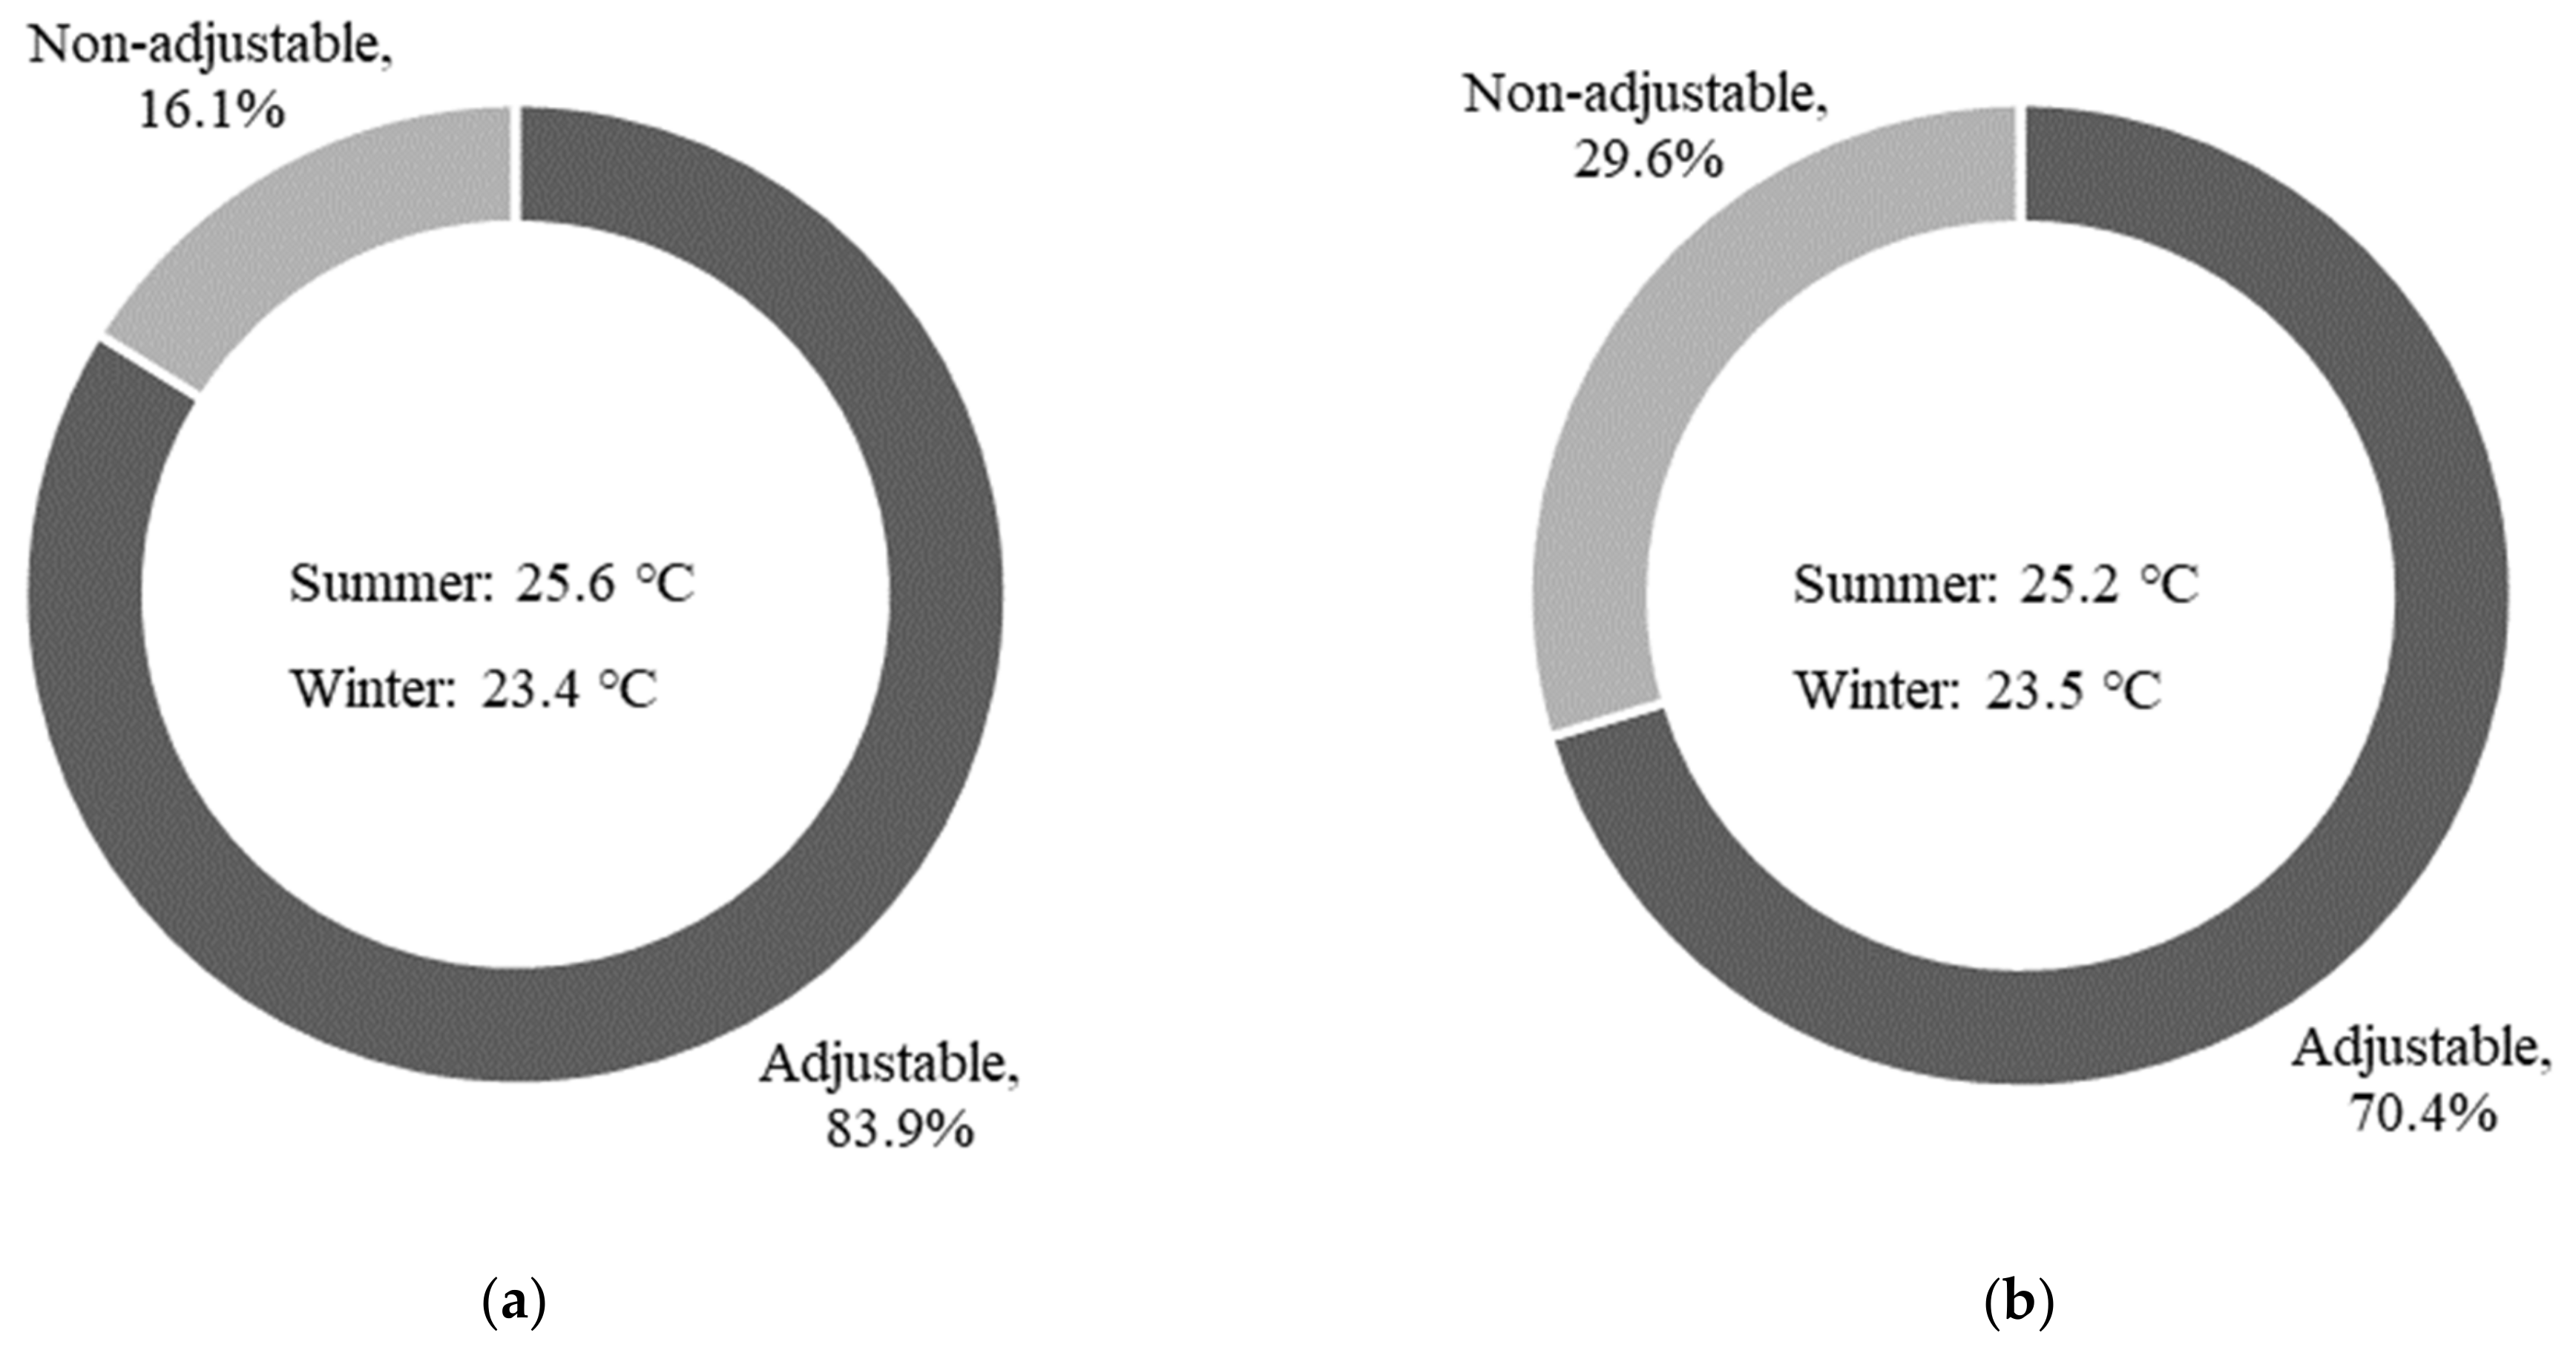
4.3.2. Air Conditioning Habits

Investigations were conducted on air-conditioning habits, window-opening habits, and lighting habits to verify whether there are significant differences in occupants’ energy-related behaviors of high- and low-energy-consuming buildings. The behavior pattern is divided into four categories: “waste”, “neutral”, “good”, and “economical.” In terms of air conditioning, the “waste” pattern means that air conditioners operate continuously throughout office hours, regardless of the occupancy or actual temperature and humidity. The “neutral” pattern means that air conditioners are turned on immediately once people arrive at the office and turned off temporarily when people go out or achieve thermal comfort. The “good” pattern means that air conditioners are controlled based on actual demands. Thus, the equipment is turned on only in areas with people and only when the thermal environment significantly deteriorates. Lastly, the “economical” pattern means that people rarely use air conditioners. They may prefer to rely on ventilation or fans for cooling in summer and additional clothes to keep warm in winter.
Figure 7 compares the proportions of the four air-conditioning patterns in low- and high-energy-consuming buildings. Air conditioners are intensively used in summer for both types of buildings. The proportion of wasteful air conditioning patterns in high-energy-consuming buildings is slightly higher, but the air conditioning patterns of the two groups of buildings are generally similar. The use of air conditioning systems in winter is much less than that in summer. For high-energy-consuming buildings, it is more common to heat the whole space continuously, while for low-energy-consuming buildings, the “good” and “economical” air conditioning pattern take up a larger proportion in winter.
Figure 8 shows the setting temperature and the adjustability of air conditioning systems. The average air conditioning setting temperatures of the two types of buildings are very close. However, the adjustability of air conditioning systems in low-energy-consuming buildings is better. There is a growing body of literature addressing the effect of perceived control on the level of satisfaction. Previous studies noted that increased sense of control has the potential to alter behavioral patterns and reduce energy use [46]. Being able to adjust air conditioning equipment encourages environmentally conscious occupants to form “good” and “economical” air conditioning habits. Meanwhile, the sense of control provides psychological satisfaction, which sometimes expands people’s thermal comfort zone [47].

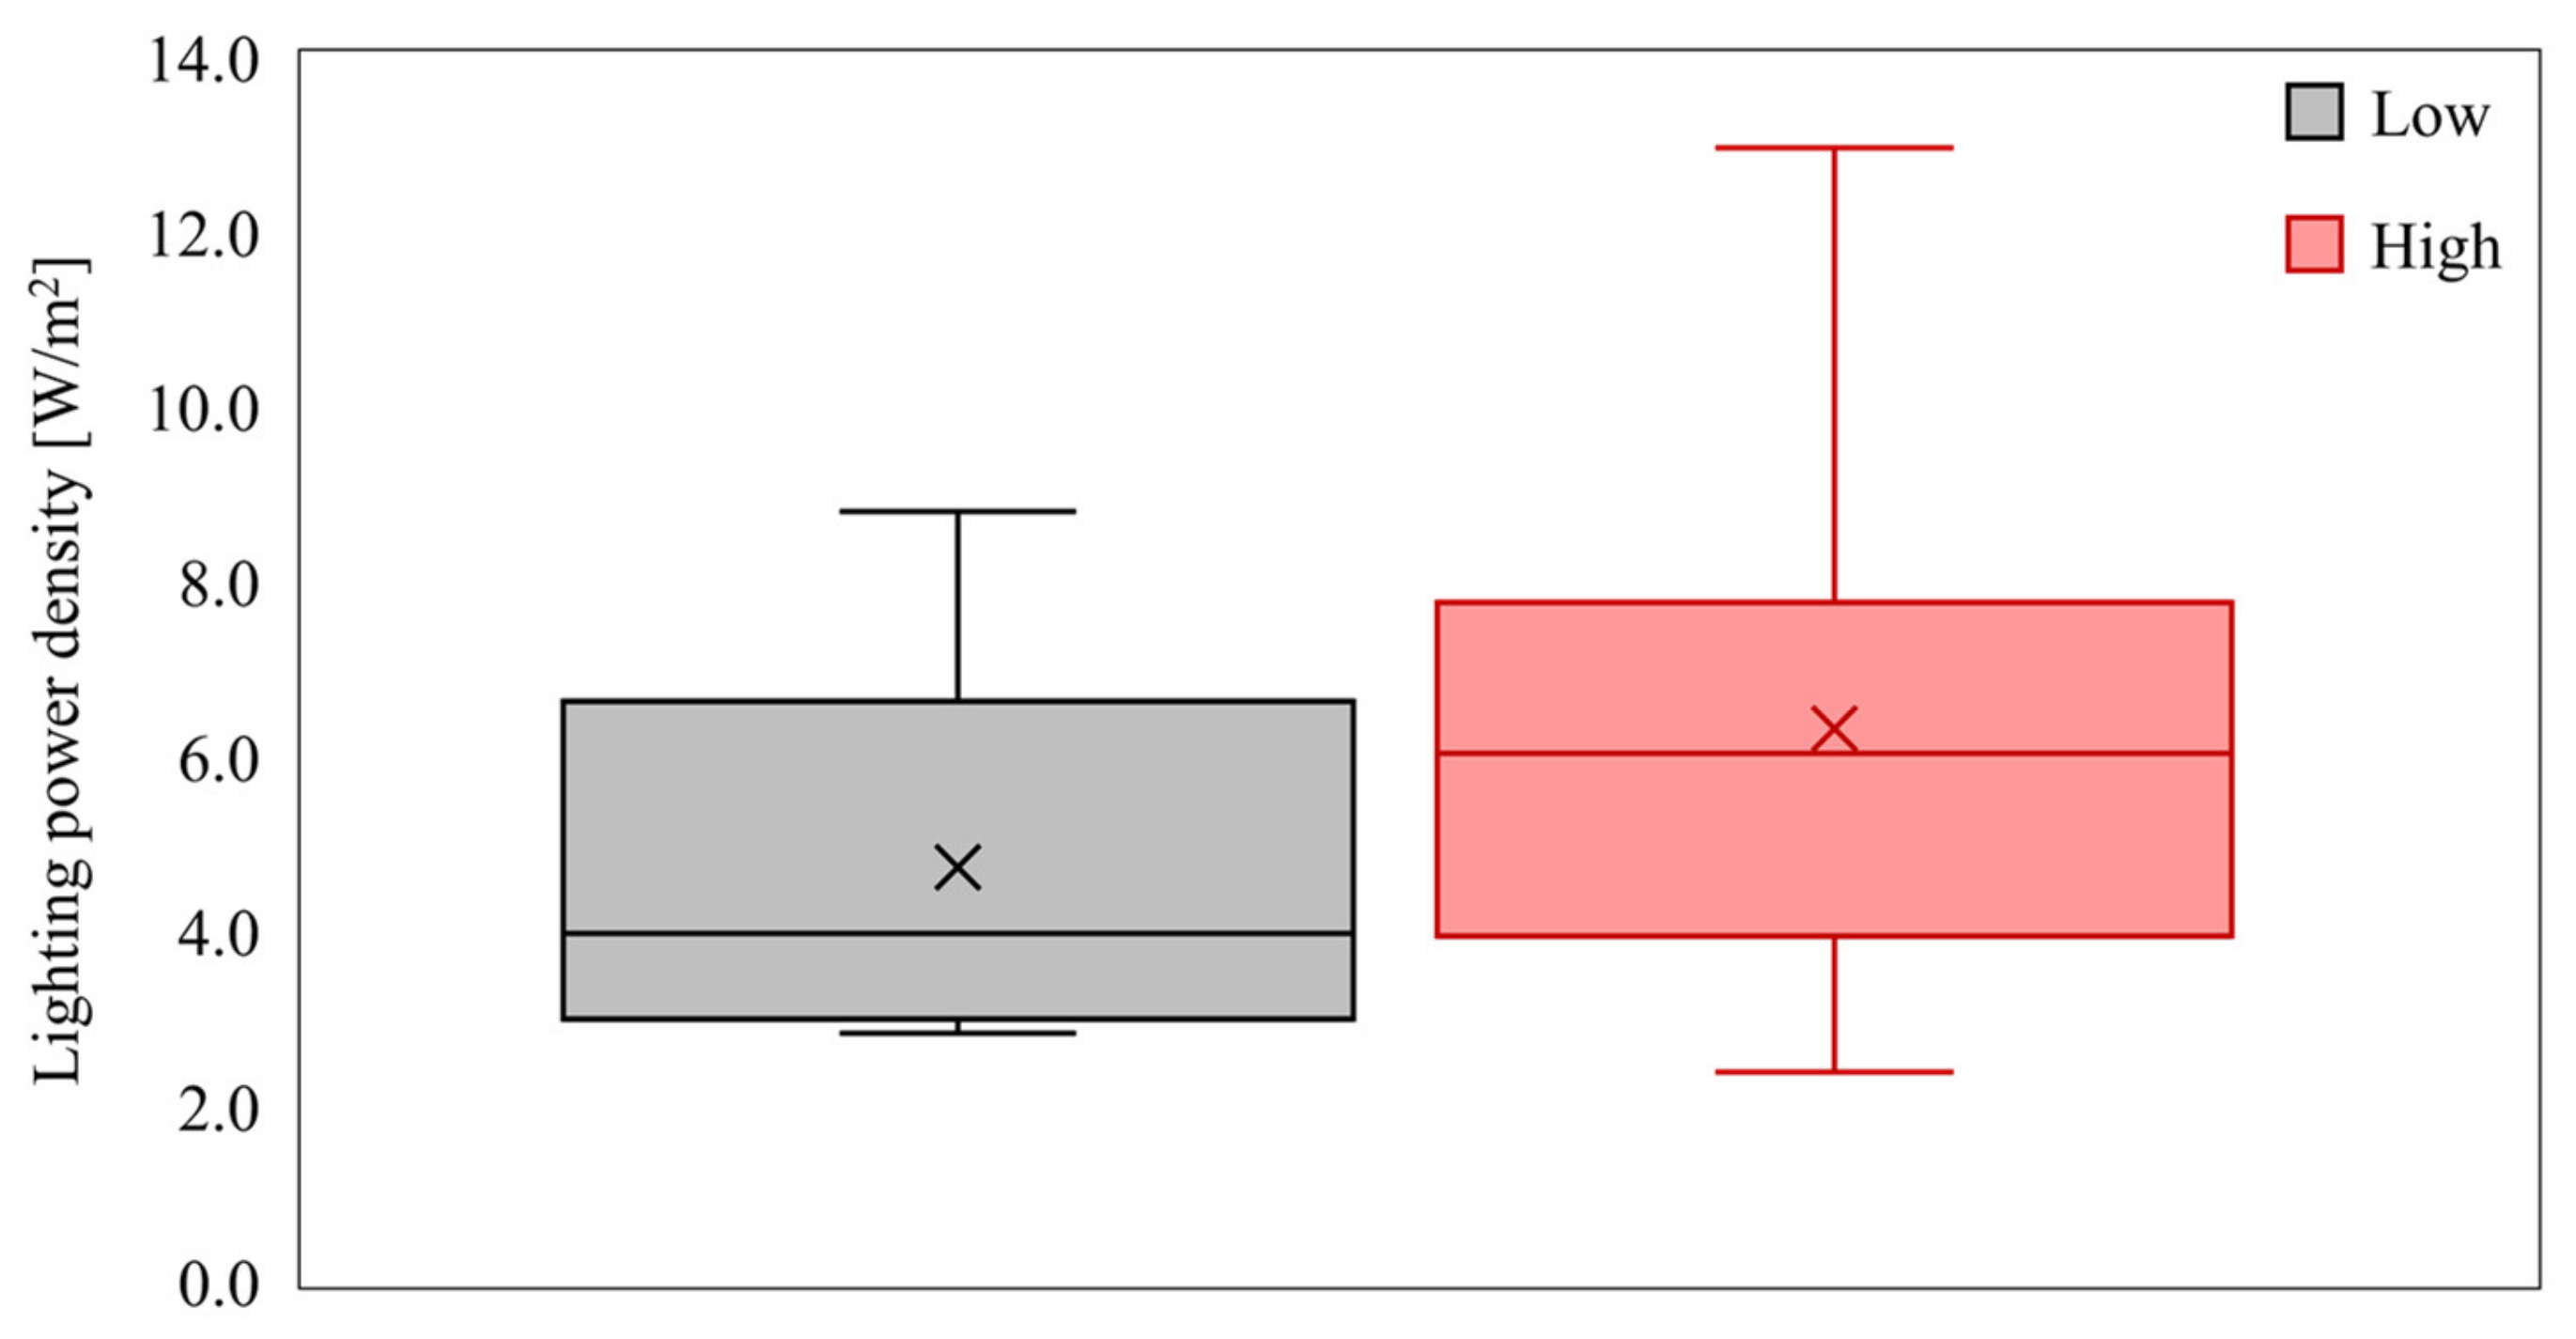
4.3.3. Lighting Habits

Similar to the definition of air conditioning patterns, the “waste” lighting habit means that all the lights are switched on during office hours without any adjustment. The “neutral” pattern means that lights in the entire building are turned on at a fixed hour on the workday and can be manually turned off whenever people leave the room. The only difference between “good” and “neutral” is that the former takes occupancy into consideration and only turns on lights in occupied areas. “Economical” means lights are not turned on until someone arrives at the office. Further, lights in some public areas are automatically controlled.
Figure 9 shows the proportions of different lighting patterns in high- and low-energy-consuming buildings. The percentage of “good” lighting pattern in low-energy-consuming buildings is 7% higher than that in high-energy-consuming buildings. However, the “economical” and “neutral” lighting patterns have a higher share in high-energy-consuming buildings, suggesting that low-energy-consuming buildings do not have distinct superiority in lighting pattern.
The lighting power density (LPD) was measured by counting lights within a specific space and dividing the added power by the floor area. As illustrated in Figure 10, high-energy-consuming buildings have much higher lighting power densities than low-energy-consuming buildings. In conclusion, occupants from the two groups of buildings have similar lighting habits. However, the higher LPD in high-energy-consuming buildings puts them at a disadvantage.

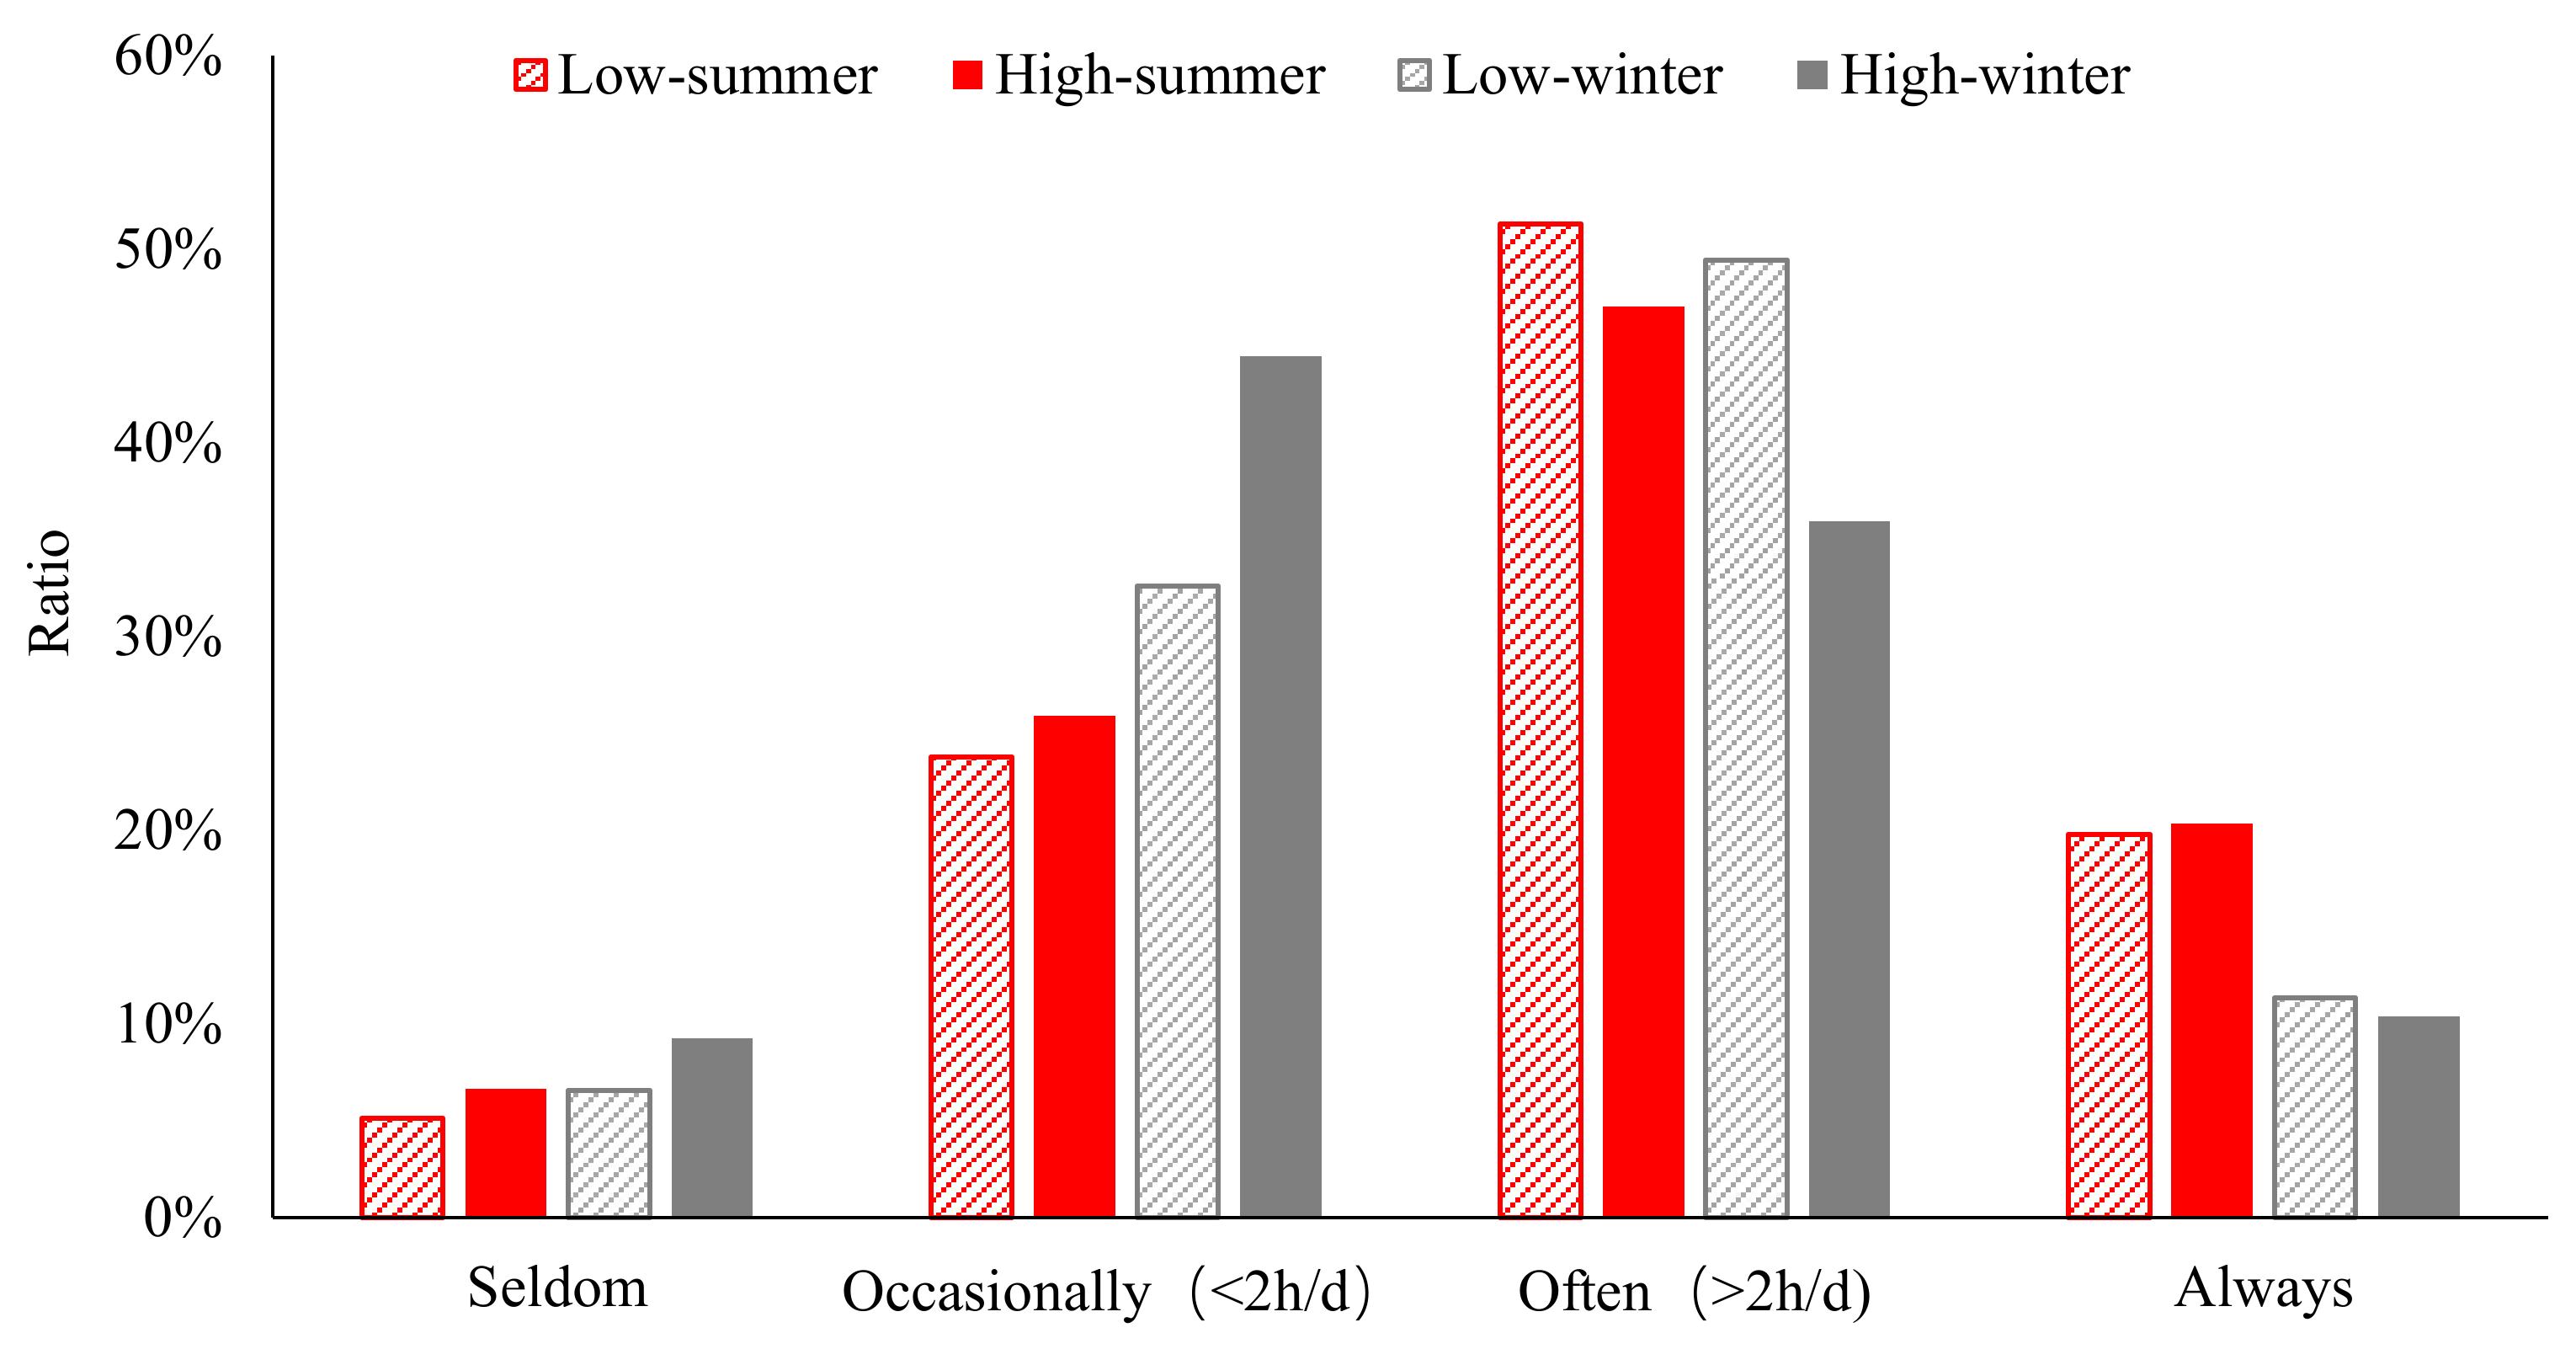
4.3.4. Ventilation Habits

Since none of the buildings were installed with a mechanical fresh air system, the ventilation solely depended on opening windows. The window-opening habits were classified into “seldom”, “occasionally”, “often”, and “always” based on frequency. The window-opening habits in summer and winter of high- and low-energy-consuming buildings were analyzed as shown in Figure 11.
Users of low-energy-consuming buildings open windows more actively both in summer and winter. In summer, ventilation can be an effective supplement to air conditioning to adjust thermal comfort. The air-conditioning season can be shortened by exploiting the natural cooling. In addition, studies have shown that dynamic natural wind helps to expand the range of the thermal comfort zone [48]. This allows higher room temperature in summer, which is conducive to the air conditioner efficiency. Therefore, better adjustability of air conditioning systems and more sufficient use of natural ventilation jointly contribute to low-energy-consuming buildings.
The window-opening frequency markedly decreases in winter for both types of buildings. Meanwhile, the gap between high- and low-energy-consuming buildings is further enlarged. This can be related to the difference in air conditioning pattern. Unlike in summer, opening windows in the heating seasons is always unfavorable for maintaining thermal comfort and saving energy. Therefore, “windows should not be opened when air conditioning” has almost become common sense for many building users. In other words, less use of air conditioners in winter is a possible reason for the higher window-opening frequency of low-energy-consuming buildings. However, this also puts occupants at higher risk of suffering from deteriorating thermal environments. It is necessary to investigate the correlation between the energy consumption and objective indoor environment quality.

4.4. Integrated Analysis

4.4.1. Effects of Energy Consumption on Environment Quality

Table 6 summarizes the statistics of measured environmental parameters in high- and low-energy-consuming buildings. Generally, high-energy-consuming buildings perform slightly better in maintaining appropriate temperature, controlling noise, and providing adequate lighting. However, the higher objective environment quality does not necessarily result in improved occupants’ satisfaction.
The phenomenon above may partially stem from the shrinking marginal benefit of increasing the use of building service systems. The majority of survey participants have a high evaluation of the indoor environment, reflecting that most survey buildings adequately meet the basic demands of occupants. Thus, further investment will have a relatively limited effect on satisfaction. The threshold at which a marginal effect appears is affected by many factors including economic development, local living habits, and building types. All buildings analyzed in this study are government office buildings, which are key objects of promoting energy conservation in public buildings in China. The staff working in these buildings are frequently exposed to publicity about energy saving and are more likely to weigh energy conservation over the excessive pursuit of comfort. In addition, research has revealed that environmentally conscious consumers are more tolerant to the building environment when they realize energy-saving effects [49,50]. The perception of satisfaction and the behavior within energy-efficient buildings is influenced by factors beyond the objective environment quality of those buildings.

4.4.2. Interactions among Energy-Related Behaviors

Interactions among air conditioning, window-opening, and lighting behaviors were preliminarily studied by the correlation analysis of the proportion of different behavior patterns. Note that air conditioning and window opening in summer and winter were investigated separately. Since the complete correlation results are lengthy, Table 7 selectively shows correlation matrices with high significance outcome.
First, the correlation matrix for air conditioning habit in summer and winter, as well as window-opening habit, reveals a strong positive correlation between the same behavior pattern in the two seasons. In other words, if occupants use air conditioning systems wastefully in summer, they are likely to do the same in winter. Similarly, people that are accustomed to opening windows frequently in summer tend to maintain this habit in winter. In general, occupants’ air conditioning and window-opening habits exhibit a certain consistency throughout the year.
Second, some kind of spillover effect between lighting and air conditioning habit is observed. Despite the mediocre significance, “good” and “economical” air conditioning habits are positively associated with energy-saving lighting habits and negatively related to wasteful lighting habits. As mentioned earlier, the “waste” lighting pattern means that all the lights are on during the entire working hours. In this pattern, occupants rarely take the initiative to adjust the lights. In contrast, in “good” and “economical” air conditioning patterns, people can flexibly decide whether and when to use air conditioners. Therefore, the spillover effect may result from occupants’ awareness and proactive behaviors of saving energy by interacting with building service systems.
The result suggests that significant correlation between window-opening and air conditioning behavior only emerges in winter. A possible reason is that summer ventilation has inconsistent influences on air conditioning because it sometimes contributes to thermal comfort while at other times increases the cooling load. The result confirms that air conditioning in winter can suppress people’s disposition to open windows. Intriguingly, occupants who rarely use air conditioners in winter seem to be more inclined to open windows. Perhaps for these people, the concern that opening windows will impair the effect of air conditioning disappears, which allows them to ventilate freely. This phenomenon also implies the priority of indoor air quality in occupants’ perceptions.
Since the human behavior data were collected using questionnaires rather than controlled experiments, it is hard to accurately quantify effects of the behaviors on building energy consumption. The correlation coefficient between building energy consumption and behaviors studied in this paper is not significant. Further research needs to be conducted with the aid of behavioral models and simulation tools, which was not the main target of the present study.

5. Discussions

This study investigated 22 government office buildings in Sichuan using questionnaires and field measurement. Three main implications were derived.
First, occupants pay different degrees of attention to the environmental factors (thermal comfort, indoor air quality, light environment, acoustic environment). It is unnecessary to set high standards uniformly. This study ranks the environmental factors based on their perceived “importance level” and “satisfaction level”. Results show that for government office buildings, indoor air quality is a pain point worthy of further improvement. Consequently, the ownership rate of portable air cleaners far exceeds other personal appliances. It is important to combine the use of natural ventilation, air conditioners, and air cleaners to find a balance between energy saving and indoor air quality. Thermal comfort is the second-most concerning factor. Nevertheless, most buildings perform sufficiently well in this respect. Further improvement is likely to have a marginal effect on user satisfaction. Although the acoustic environment ranks low in importance, it causes the strongest dissatisfaction, which implies the existence of severe problems. Therefore, noise control is an absolute imperative. Nevertheless, it is unnecessary to set overly demanding targets for the acoustic environment of office buildings. The light environment is the least important factor that occupants easily feel satisfied with. This is related to the fact that people work on computers most of the time. The requirements for the lighting environment can be appropriately reduced. Note that the rank may vary with building types. For instance, Geng et al. reveals that the light environment of airport terminals has significant effects on satisfaction [51].
Second, not all human behaviors are consequential for building energy consumption. The key factors that differentiate low- and high-energy-consuming buildings mainly include the following aspects. First, personal appliances are more pervasively used in high-energy-consuming buildings. On one hand, extra appliances directly increase building energy consumption. On the other hand, this may imply that users of high-energy-consuming buildings tend to pursue personal comfort at the expense of increased energy consumption. Second, low-energy-consuming buildings are usually air conditioned intermittently and locally, which is facilitated by the better adjustability of the air conditioning systems. In contrast, there is no salient difference in lighting habits, but the higher lighting power density in high-energy-consuming projects puts them at a disadvantage. Lastly, occupants of low-energy-consuming buildings open windows more actively, either in summer or winter. In summer, ventilation can be an effective supplement to air conditioning to adjust thermal comfort. In winter, less use of air conditioners is part of the reason why users in low-energy-consuming buildings feel free to open windows.
Third, human behaviors are interrelated. The underlying mechanism may be the interactional perceptions of the environmental factors [52]. In general, occupants’ air conditioning and window opening habits exhibit a certain consistency throughout the year. In other words, if occupants use air conditioning systems wastefully in summer, they are likely to do the same in winter. Similarly, people that are accustomed to opening windows frequently in summer tend to maintain this habit in winter. Some kind of spillover effect between lighting and air conditioning habit is observed. The “good” and “economical” air conditioning habits are positively associated with energy-saving lighting habits. Air conditioning in winter suppresses people’s disposition to open windows to some extent, while occupants who rarely use air conditioners in winter seem to be more inclined to open windows frequently.

6. Conclusions

In conclusion, the findings can help building operators to focus on the real pain points of indoor environment so that occupants’ satisfaction can be improved without futile investment. The conclusions about energy-related behaviors can assist researchers and practitioners in optimizing energy-saving behavior management strategies. However, there are limitations of the present work. This research is more of a descriptive study than an explanatory study. Interactions between the building energy consumption, indoor environment quality, and occupants’ behaviors were preliminarily estimated but without in-depth explanation. Some researchers introduced ontology to represent energy-related occupant behavior, which may provide inspirations for this issue [53,54]. Although the measured parameters are commonly used to reflect objective environment quality, they are not exhaustive. Some important parameters may be omitted, especially for indoor air quality. Another shortcoming is that the field measurement for each building was only conducted on a typical working day. The measured results may not be sufficient to represent the state throughout the year. These are all possible geneses of discrepancies between the objective environment quality and subjective satisfaction. Therefore, it is necessary to determine the appropriate combination of measured parameters and carry out long-term monitoring.

Author Contributions

Conceptualization, formal analysis, writing-review & editing, X.Z.; project administration, methodology, data curation, investigation, B.G.; supervision, X.Y., Y.Y.; funding acquisition, J.N.; Resources, J.N. All authors have read and agreed to the published version of the manuscript.

Funding

This research was funded by the Key Research and Development Projects of Sichuan Science and Technology Plan, grant number 2020YFS0059, and the Science and Technology Projects of Sichuan Huashi Group, grant number HXKX2019/022.

Institutional Review Board Statement

Not applicable.

Informed Consent Statement

Not applicable.

Data Availability Statement

The data presented in this study are available on request from the corresponding author.

Conflicts of Interest

The authors declare no conflict of interest.

References

  1. Turner, C.; Frankel, M. Energy performance of LEED for new construction buildings. New Build. Inst. 2008, 4, 1–46. [Google Scholar]
  2. Newsham, G.R.; Mancini, S.; Birt, B.J. Do LEED-certified buildings save energy? Yes, but…. Energy Build. 2009, 41, 897–905. [Google Scholar] [CrossRef]
  3. Gill, Z.M.; Tierney, M.J.; Pegg, I.M.; Allan, N. Low-energy dwellings: The contribution of behaviours to actual performance. Build. Res. Inf. 2010, 38, 491–508. [Google Scholar] [CrossRef]
  4. Clevenger, C.M.; Haymaker, J. The impact of the building occupant on energy modeling simulations. Proceeding of the Joint International Conference on Computing and Decision Making in Civil and Building Engineering, Montreal, QC, Canada, 14–16 June 2006; pp. 1–10. [Google Scholar]
  5. Sonderegger, R.C. Movers and stayers: The resident’s contribution to variation across houses in energy consumption for space heating. Energy Build. 1978, 1, 313–324. [Google Scholar] [CrossRef] [Green Version]
  6. Pothitou, M.; Kolios, A.J.; Varga, L.; Gu, S. A framework for targeting household energy savings through habitual behavioral change. Int. J. Sol. Energy 2016, 35, 686–700. [Google Scholar]
  7. Wood, G.; Newborough, M. Dynamic energy-consumption indicators for domestic appliances: Environment, behavior and design. Energy Build. 2003, 35, 821–841. [Google Scholar] [CrossRef]
  8. Chung, W. Review of building energy-use performance benchmarking methodologies. Appl. Energy 2011, 88, 1470–1479. [Google Scholar] [CrossRef]
  9. Roetzel, A.; Tsangrassoulis, U.; Dietrich, S.B. A review of occupant control on natural ventilation. Renew. Sustain. Energy Rev. 2010, 14, 1001–1013. [Google Scholar] [CrossRef]
  10. Xu, Z.; Jia, Q.; Guan, X. Supply demand coordination for building energy saving. In Proceedings of the IEEE International Conference on Automation Science and Engineering (CASE), Madison, WI, USA, 17–21 August 2013. [Google Scholar]
  11. Lee, S.; Kwon, B.; Lee, S. Joint energy management system of electric supply and demand in houses and buildings. IEEE Trans. Power Syst. 2014, 29, 2804–2812. [Google Scholar] [CrossRef]
  12. Al Horr, Y.; Arif, M.; Kaushik, A.; Mazroei, A.; Katafygiotou, M.; Elsarrag, E. Occupant productivity and office indoor environment quality: A review of the literature. Build. Environ. 2016, 105, 369–389. [Google Scholar] [CrossRef] [Green Version]
  13. Yang, L.; Yan, H.; Lam, J.C. Thermal comfort and building energy consumption implications—A review. Appl. Energy 2014, 115, 164–173. [Google Scholar] [CrossRef]
  14. O’Brien, W.; Gunay, H.B. The contextual factors contributing to occupants’ adaptive comfort behaviors in offices—A review and proposed modeling framework. Build. Environ. 2014, 77, 77–87. [Google Scholar] [CrossRef]
  15. Stazi, F.; Naspi, F.; D’Orazio, M. A literature review on driving factors and contextual events influencing occupants’ behaviours in buildings. Build. Environ. 2017, 118, 40–66. [Google Scholar] [CrossRef]
  16. Fabi, V.; Andersen, R.V.; Corgnati, S.; Olesen, B.W. Occupants’ window opening behaviour: A literature review of factors influencing occupant behavior and models. Build. Environ. 2012, 58, 188–198. [Google Scholar] [CrossRef]
  17. Pisello, A.L.; Castaldo, V.L.; Piselli, C. How peers’ personal attitudes affect indoor microclimate and energy need in an institutional building: Results from a continuous monitoring campaign in summer and winter conditions. Energy Build. 2016, 126, 485–497. [Google Scholar] [CrossRef]
  18. Vuarnoz, D.; Hoxha, E.; Nembrini, J.; Jusselme, T.; Cozza, S. Assessing the gap between a normative and a reality-based model of building LCA. J. Build. Eng. 2020, 31, 101454. [Google Scholar] [CrossRef]
  19. Li, Q.; Sun, X.; Chen, C.; Yang, X. Characterizing the household energy consumption in heritage Nanjing Tulou buildings, China: A comparative field survey study. Energy Build. 2012, 49, 317–326. [Google Scholar] [CrossRef]
  20. Jiang, P.; Chen, Y.; Xu, B.; Dong, W.; Kennedy, E. Building low carbon communities in China: The role of individual’s behaviour change and engagement. Energy Policy 2013, 60, 611–620. [Google Scholar] [CrossRef]
  21. Hu, S.; Yan, D.; Guo, S.; Cui, Y.; Dong, B. A survey on energy consumption and energy usage behavior of households and residential building in urban China. Energy Build. 2017, 148, 366–378. [Google Scholar] [CrossRef]
  22. De Dear, R.J.; Brager, G.S. Thermal comfort in naturally ventilated buildings: Revisions to ASHRAE standard 55. Energy Build. 2002, 34, 549–561. [Google Scholar] [CrossRef] [Green Version]
  23. Liu, L.; Zhao, J.; Liu, X.; Wang, Z. Energy consumption comparison analysis of high energy efficiency office buildings in typical climate zones of China and U.S. based on correction model. Energy 2013, 65, 221–232. [Google Scholar] [CrossRef]
  24. Li, Y.Y.; Guo, K.; Du, R.; Li, H.C.; Yang, Y.G. The studies on the energy consumption quota of state organ office buildings. Adv. Mater. Res. 2011, 243–249, 5899–5904. [Google Scholar] [CrossRef]
  25. Ministry of Housing and Urban Rural Development of the People’s Republic of China. GB/T 51161-2016. Standard for Energy Consumption of Building; Ministry of Housing and Urban Rural Development of the People’s Republic of China: Beijing, China, 2016.
  26. Von Grabe, J. Decision models and data in human-building interactions. Energy Res. Soc. Sci. 2016, 19, 61–65. [Google Scholar] [CrossRef]
  27. Wang, J.; Wang, Z.; Dear, R.D.; Luo, M.; Ghahramani, A.; Lin, B. The uncertainty of subjective thermal comfort measurement. Energy Build. 2018, 181, 38–49. [Google Scholar] [CrossRef]
  28. Wang, Z.; Zhang, H.; He, Y.; Luo, M.; Li, Z.; Hong, T.; Lin, B. Revisiting individual and group differences in thermal comfort based on ASHRAE database. Energy Build. 2020, 219, 110017. [Google Scholar] [CrossRef]
  29. Oakland, G.B. Determining sample size. Can. Entomol. 1953, 85, 108–113. [Google Scholar] [CrossRef]
  30. Kraus, M.; Senitkova, I.J. A study of perceived air quality and odours. IOP Conf. Series Mater. Sci. Eng. 2019, 471, 092004. [Google Scholar] [CrossRef]
  31. Erdmann, C.A.; Apte, M.G. Mucous membrane and lower respiratory building related symptoms in relation to indoor carbon dioxide concentrations in the 100-building BASE dataset. Indoor Air 2004, 14, 127–134. [Google Scholar] [CrossRef] [PubMed]
  32. Federspiel, C.C.; Fisk, W.J.; Price, P.N.; Liu, G.; Faulkner, D.; Dibartolomeo, D.L.; Sullivan, D.P.; Lahiff, M. Worker performance and ventilation in a call center: Analyses of work performance data for registered nurses. Indoor Air 2010, 14, 41–50. [Google Scholar] [CrossRef] [PubMed] [Green Version]
  33. Ministry of Housing and Urban Rural Development of the People’s Republic of China. JGJ/T 177-2009. Standard for Energy Efficiency Test of Public Buildings; Ministry of Housing and Urban Rural Development of the People’s Republic of China: Beijing, China, 2009.
  34. Ministry of Housing and Urban Rural Development of the People’s Republic of China; General Administration of Quality Supervision, Inspection and Quarantine of the People’s Republic of China. GB 50736-2012. Design Code for Heating Ventilation and Air Conditioning of Civil Buildings; Ministry of Housing and Urban Rural Development of the People’s Republic of China; General Administration of Quality Supervision, Inspection and Quarantine of the People’s Republic of China: Beijing, China; Beijing, China, 2012.
  35. General Administration of Quality Supervision, Inspection and Quarantine of the People’s Republic of China. GB/T 18204.24-2000. Methods for Determination of Carbon Dioxide in Air of Public Places; General Administration of Quality Supervision, Inspection and Quarantine of the People’s Republic of China: Beijing, China, 2000.
  36. General Administration of Quality Supervision, Inspection and Quarantine of the People’s Republic of China; National Health Commission of the People’s Republic of China; Ministry of Ecology and Environment of the People’s Republic of China. GB/T 18883-2002. Indoor Air Quality Standard; Standards Press of China: Beijing, China, 2002.
  37. General Administration of Quality Supervision, Inspection and Quarantine of the People’s Republic of China; Standardization Administration of the People’s Republic of China. GB/T 5700-2008. Measurement Methods for Lighting; General Administration of Quality Supervision, Inspection and Quarantine of the People’s Republic of China; Standardization Administration of the People’s Republic of China: Beijing, China; Beijing, China, 2008.
  38. Ministry of Housing and Urban Rural Development of the People’s Republic of China; General Administration of Quality Supervision, Inspection and Quarantine of the People’s Republic of China. GB 50034-2013. Standard for Lighting Design of Buildings; Ministry of Housing and Urban Rural Development of the People’s Republic of China; General Administration of Quality Supervision, Inspection and Quarantine of the People’s Republic of China: Beijing, China; Beijing, China, 2013.
  39. Ministry of Housing and Urban Rural Development of the People’s Republic of China; General Administration of Quality Supervision, Inspection and Quarantine of the People’s Republic of China. GB 50118-2010. Code for Design of Sound Insulation of Civil Buildings; Ministry of Housing and Urban Rural Development of the People’s Republic of China; General Administration of Quality Supervision, Inspection and Quarantine of the People’s Republic of China: Beijing, China; Beijing, China, 2010.
  40. Von dem Knesebeck, O.; Vonneilich, N.; Kim, T.J. Public awareness of poverty as a determinant of health: Survey results from 23 countries. Int. J. Public Health 2018, 63, 165–172. [Google Scholar] [CrossRef] [PubMed]
  41. Zhu, X.; Lv, M.; Yang, X. Performance of sorption-based portable air cleaners in formaldehyde removal: Laboratory tests and field verification. Build. Environ. 2018, 136, 177–184. [Google Scholar] [CrossRef]
  42. Omrany, H.; Soebarto, V.; Zuo, J.; Sharifi, E.; Chang, R. What leads to variations in the results of life-cycle energy assessment? An evidence-based framework for residential buildings. Energy Built Environ. 2021, 2, 392–405. [Google Scholar] [CrossRef]
  43. Keyvanfar, A.; Shafaghat, M.Z.; Majid, A.; Lamit, H.B.; Hussin, M.W.; Ali, K.N.B.; Saad, A.D. User satisfaction adaptive behaviors for assessing energy efficient building indoor cooling and lighting environment. Renew. Sustain. Energy Rev. 2014, 39, 277–295. [Google Scholar] [CrossRef]
  44. Lee, W.L.; Yik, F.; Jones, P.; Burnett, J. Energy saving by realistic design data for commercial buildings in Hong Kong. Appl. Energy 2001, 70, 59–75. [Google Scholar] [CrossRef]
  45. Yu, P.C.; Chow, W.K. A discussion on potentials of saving energy use for commercial buildings in Hong Kong. Energy 2007, 32, 83–94. [Google Scholar] [CrossRef]
  46. Sintov, N.D.; Schultz, P.W. Adjustable green defaults can help make smart homes more sustainable. Sustainability 2017, 9, 622. [Google Scholar] [CrossRef] [Green Version]
  47. Pan, S.; Xie, L.; Wei, S.; Wang, Y.; Xu, C.; Wang, X.; Zhang, Y. A review of building occupants adaptive behavior in buildings of China. In Proceedings of the 5th International Conference on Civil Engineering and Transportation, Guangzhou, China, 28–29 November 2015; Volume 30, pp. 1528–1531. [Google Scholar]
  48. Luo, M.; Yu, J.; Ouyang, Q.; Cao, B.; Zhu, Y. Application of dynamic airflows in buildings and its effects on perceived thermal comfort. Indoor Built Environ. 2017, 27, 1162–1174. [Google Scholar] [CrossRef]
  49. Deuble, M.P.; de Dear, R.J. Green occupants for green buildings: The missing link? Build. Environ. 2012, 56, 21–27. [Google Scholar] [CrossRef]
  50. Xie, X.; Lu, Y.; Gou, Z. Green building pro-environment behaviors: Are green users also green buyers? Sustainability 2017, 9, 1703. [Google Scholar] [CrossRef] [Green Version]
  51. Geng, Y.; Yu, J.; Lin, B.; Wang, Z.; Huang, Y. Impact of individual IEQ factors on passengers’ overall satisfaction in Chinese airport terminals. Build. Environ. 2017, 112, 241–249. [Google Scholar] [CrossRef]
  52. Geng, Y.; Ji, W.; Lin, B.; Zhu, Y. The impact of thermal environment on occupant IEQ perception and productivity. Build. Environ. 2017, 121, 158–167. [Google Scholar] [CrossRef]
  53. Hong, T.; D’Oca, S.; Turner, W.J.; Taylor-Lange, S.C. An ontology to represent energy-related occupant behavior in buildings. Part I: Introduction to the DNAs framework. Build. Environ. 2015, 92, 764–777. [Google Scholar] [CrossRef] [Green Version]
  54. Hong, T.; D’Oca, S.; Taylor-Lange, S.C.; Turner, W.J.; Chen, Y.; Corgnati, S.P. An ontology to represent energy-related occupant behavior in buildings. Part II: Implementation of the DNAS framework using an XML schema. Build. Environ. 2015, 94, 196–205. [Google Scholar] [CrossRef] [Green Version]
Figure 1. Locations of the investigated buildings.
Sustainability 13 10607 g001
Figure 2. Schematic of energy-relevant user–building interaction model.
Sustainability 13 10607 g002
Figure 3. Locations of participants’ seats.
Sustainability 13 10607 g003
Figure 4. Schedule types and overtime frequencies of participants. (a) Number of occupants following different working schedule types; (b) overtime frequency of occupants with different working schedule types.
Sustainability 13 10607 g004
Figure 5. Correlation between the average satisfaction score and importance rank of different environmental factors.
Sustainability 13 10607 g005
Figure 6. Comparison of personalized electric device ownership rates between buildings with low and high energy consumption, N refers to sample size.
Sustainability 13 10607 g006
Figure 7. Usage pattern of air conditioners in summer (red) and winter (gray) for low-energy-consuming buildings (“Low”) and high-energy-consuming buildings (“High”).
Sustainability 13 10607 g007
Figure 8. Air conditioning set temperature and its adjustability for (a) low-energy-consuming buildings; (b) high-energy-consuming buildings.
Sustainability 13 10607 g008
Figure 9. Lighting patterns in (a) low-energy-consuming buildings and (b) high-energy-consuming buildings.
Sustainability 13 10607 g009
Figure 10. Lighting power density in high- and low-energy-consuming buildings.
Sustainability 13 10607 g010
Figure 11. Window-opening habits of staff from low-energy-consuming buildings (Low) and high-energy-consuming buildings (High) in summer (red) and winter (gray).
Sustainability 13 10607 g011
Table 1. Information of the 22 investigated office buildings.
No.Completion YearNumber of StaffFloorFloor Area (m2)InsulationWindow GlassAir Conditioning System* E (kWh/(m2·a))Adjusted E (kWh/(m2·a))
1 199578632/-1F49,290NoneLow-E hollow glassElectric chiller70.5181.7
2 199537117/-1F21,818RoofLow-E hollow glassElectric chiller59.6146.8
3 199718414/-1F11,189NoneDouble silver Low-E hollow glassSplit air conditioner36.191.1
4 200216411/-1F10,020RoofLow-E hollow glassSplit air conditioner51.6130.6
5 201113112F13,099Wall and roofLow-E hollow glassVRV air conditioner66.9247.4
6 20111696F11,613Wall and roofInsulating glassAir-cooled heat pump52.1143.8
7 20051169/-1F9250RoofLow-E hollow glassAir-cooled heat pump62.2192.2
8 199819010/-1F15,869RoofTransparent glassAir-cooled heat pump36.4116.6
9 20112779/-1F17,584Wall and roofLow-E hollow glassAir-cooled heat pump53.9140.3
10 201017510/-1F11,510Wall and roofLow-E hollow glassAir-cooled heat pump63.9170.8
11 200319012/-1F10,785RoofInsulating glassSplit air conditioner60.7145.7
12 19912587F8640RoofTransparent glassSplit air conditioner50.285.4
13 199720219/-1F22,218RoofTransparent glassVRV air conditioner34.5138.1
14 200320515F22,278NoneTransparent glassAir-cooled heat pump27.7109.6
15 20031988/-1F17,000RoofTransparent glassAir-cooled heat pump28.191.9
16 20102207/-1F11,479Wall and roofLow-E hollow glassAir-cooled heat pump60.7137.4
17 199926914/-1F15,449NoneLow-E hollow glassSplit air conditioner32.879.4
18 20051989/-1F10,850RoofInsulating glassAir-cooled heat pump59.3139.0
19 199715111/-1F13,371NoneLow-E hollow glassSplit air conditioner37.6126.1
20 19951278F5007NoneTransparent glassSplit air conditioner51.196.3
21 200416810/-1F11,857NoneInsulating glassSplit air conditioner60.0168.9
22 20072508F9124RoofTransparent glassAir-cooled heat pump56.2100.9
* Energy use intensity (E).
Table 2. Content of questionnaire.
Part 1 Basic information
1. Please fill in your affiliation. (Fill in the blank)
2. On which floor is your office located? (Fill in the blank)
3. Is your seat by the window? (Yes/No)
4. Please choose the working mode closest to the actual situation.
A. Fixed working hours and little outwork
B. Fluctuating working hours and little outwork
C. Frequent outwork, and the number of staff in the office varies greatly every day
D. Other
5. Please fill in the percentage of weekends that you work overtime in a year.
Part 2 Evaluation of indoor environment
6. Please rank the following aspects of indoor environment in the order of importance.
(1: Most important; 4: least important)
A. Thermal comfort; B. indoor air quality; C. acoustic environment; D. lighting environment
7. Please rate your satisfaction with the current office environment.
(0: Totally dissatisfied; 10: fully satisfied)
A. Thermal comfort:
Sustainability 13 10607 i001
B. Indoor air quality:
Sustainability 13 10607 i002
C. Acoustic environment:
Sustainability 13 10607 i003
D. Lighting environment:
Sustainability 13 10607 i004
8. Please fill in specific indoor environment improvement suggestions.
Part 3 Energy-related behaviors
9. Please choose the air conditioning pattern closest to the actual situation.
(Answer the question separately for summer and winter)
A. Turn on: at arrival; turn off: at the end of work
B. Turn on: at arrival; turn off: after establishing thermal comfort.
C. Turn on: feeling thermal discomfort; turn off: after establishing thermal comfort.
D. Barely use air conditioners.
E. Other
10. Please fill in the air conditioner setting temperature. (SummerWinter)
11. Is the setting temperature adjustable? (Yes/No)
12. Do you use personalized devices for thermal comfort in addition to the air conditioner (e.g., humidifier, desktop fan, electric heater)? (Yes/No)
13. Do you use portable air cleaners in your office? (Yes/No)
14. Do you use a desk lamp? (Yes/No)
15. Please choose the window-opening pattern closest to your actual habits.
(Answer the question separately for summer and winter)
A. Barely open/unopenable window (≈0 h/day)
B. Occasionally (<2 h/day)
C. Usually (>2 h/day)
D. Windows are normally open (≈24 h/day)
16. Please choose the lighting pattern closest to your actual habits.
A. Turn on: at arrival; turn off: at the end of work; area: all lights
B. Turn on: at arrival; turn off: when people leave the room; area: all lights
C. Turn on: at arrival; turn off: when people leave the room; area: only in places with people
D. Lighting system is automatically controlled.
E. Other
Table 3. Test standard, limit value, and measuring instrument of environmental parameters.
ParameterTest StandardLimit ValueMeasuring InstrumentInstrument Performance
Air temperature and relative humidity JGJ/T 177-2009 [33]Summer: 24–26 °C, 40–60%; Winter: 16–22 °C, ≥30% [34]Temperature and humidity recorder
(L95-2, Hangzhou Loggertech Co., Ltd., Hangzhou, China)
Range: −40–+100 °C, 0–100%
Accuracy: ±0.5 °C, ±3%
CO2GB/T 18204.24-2000 [35]<1000 ppm [36]Infrared carbon dioxide monitor
(TEL 7001, General Electric Company, Boston, MA, USA)
Range: 0–10,000 ppm
Accuracy: ±5%
Illuminance GB/T 5700-2008 [37]≥300 Lux [38]Handheld illuminance meter
(FLUKE 941, FLUKE Co., Ltd., Everett, DC, USA)
Range: 20–200,000 Lux
Accuracy: ±3%
A-weighted sound pressure level of noise GB 50118-2010 [39]≤45 dB(A) [40]Multifunction sound level meter
(AWA6228+, Hangzhou AiHua Intelligent Technology Co., Ltd., Hangzhou, China)
Range: 20–132 dB(A)
Accuracy: ±3%
Table 4. Vote of the importance rank of thermal comfort, indoor air quality, acoustic environment, and light environment.
Environmental FactorsImportance RankAverage Importance Rank
1234
Thermal comfort24.7%30.1%19.9%25.4%2.46
Indoor air quality67.5%22.8%7.0%2.7%1.45
Acoustic environment4.8%22.5%38.5%34.3%3.02
Light environment8.8%24.0%37.8%29.5%2.88
Table 5. Satisfaction scores of thermal comfort, indoor air quality, acoustic environment, and light environment.
Environmental FactorsSatisfaction ScoreAverage Satisfaction Score
<3[3,6)[6,8)>8
Thermal comfort1.1%3.0%18.4%77.4%8.8
Indoor air quality1.3%5.1%21.4%72.3%8.6
Acoustic environment3.1%9.0%25.0%62.9%8.2
Light environment1.0%4.2%15.7%79.1%9.0
Table 6. Statistics and average compliance rate of low- and high-energy-consuming buildings in terms of air temperature, relative humidity (Rh), CO2 concentration, noise level, and illuminance.
ParametersHigh-Energy-Consuming BuildingsLow-Energy-Consuming Buildings
Air temperature (winter) (°C) Min15.411.3
Max25.130.2
Average19.820.4
Average compliance rate80.6%71.3%
Relative humidity (winter) (%) Min25.818.5
Max57.264.7
Average42.740.5
Average compliance rate84.0%89.0%
CO2 concentration (ppm)Max996.9875.1
Average622.1580.1
Average compliance rate100.0%100.0%
A-weighted sound pressure level of noise (dB(A))Max5558
Average4446
Average compliance rate66.6%47.4%
Illuminance (l×)Min105.781.0
Average265.3303.0
Average compliance rate30.4%18.7%
Average satisfaction scoreThermal comfort8.768.83
Indoor air quality8.738.56
Acoustic environment8.418.03
Light environment8.858.89
Table 7. Correlation matrix for proportions of different behavior patterns and the building energy use intensity (E).
Air Conditioning Habit (Winter) Lighting Habit E
Waste Neutral Good Economical Waste Neutral Good Economical
Air conditioning habit (summer)Waste0.736 **0.266−0.540 *−0.3160.2500.153−0.212−0.0800.29
Neutral0.0410.233−0.3990.084−0.3310.0250.169−0.3580.27
Good−0.517 *−0.4310.664 **0.184−0.126−0.1270.0560.185−0.15
Economical−0.3270.339−−0.1490.246−0.537 *−0.0710.2430.206−0.28
Lighting habitWindow-opening habit (winter)E
WasteNeutralGoodEconomicalSeldomOccasionalOftenAlways
Air conditioning habit (winter)Waste0.4710.113−0.325−0.1790.2950.372−0.303−0.2330.02
Neutral−0.111−0.2710.2760.3010.577 *0.187−0.324−0.2620.10
Good−0.503 *0.1910.2710.092−0.300−0.0600.253−0.172−0.08
Economical−0.636 **−0.0850.2820.159−0.333−0.3210.1790.512 *−0.06
Window-opening habit (summer)Window-opening habit (winter)E
SeldomOccasionalOftenAlwaysSeldomOccasionalOftenAlways
Lighting habitWaste0.194−0.021−0.2870.045−0.152−0.0210.192−0.0550.17
Neutral0.009−0.221−0.1350.336−0.121−0.1670.1440.0960.20
Good−0.0980.0440.315−0.2650.0780.029−0.082−0.003−0.03
Economical0.2430.530 *−0.150−0.557 *0.4650.526 *−0.563 *−0.360−0.70 **
Window-opening habit (winter)E
SeldomOccasionalOftenAlways
Window-opening habit (summer)Seldom0.840 **0.172−0.464−0.2830.06
Occasional0.1140.663 **−0.544 *−0.3620.44
Often−0.318−0.511 *0.558 *0.268−0.25
Always−0.397−0.4430.4420.507 *−0.22
** Correlation significant at 0.01 level (two-tailed); * Correlation significant at 0.05 level (two-tailed).
Publisher’s Note: MDPI stays neutral with regard to jurisdictional claims in published maps and institutional affiliations.

