Review

Convergence, Development, and Energy-Intensive Infrastructure in Africa: A Review of the Evidence

by
Vijaya Ramachandran
The Breakthrough Institute, Berkeley, CA 94704, USA
Sustainability 2021, 13(19), 10572; https://doi.org/10.3390/su131910572
Submission received: 26 August 2021 / Revised: 14 September 2021 / Accepted: 18 September 2021 / Published: 23 September 2021
(This article belongs to the Special Issue Challenges and Innovations in Low-Carbon Energy)

Abstract

:
The structural changes in an economy that accompany its growth to high-income status have been predictable in Europe, the United States, and Asia, characterized by declining employment in agriculture and rising levels of urbanization driven by jobs in the modern industrial sector. As agricultural productivity rises, the share of people employed in agriculture declines, and both urbanization and employment in manufacturing increase. Food prices fall relative to wages, causing the share of income spent on food to decline to very low levels. Asian countries have followed a similar path, although at a much faster pace. Africa, however, is different. Despite a high share of the population in urban areas, most African countries have yet to see significant increases in agricultural productivity that might drive industrial growth and jobs. The rising share of urban population has not been matched by increases in agricultural productivity, falling food prices, or the emergence of a viable industrial sector. Available evidence shows that agricultural yields in Africa are low and food is costly, while the share of employment in agriculture remains high. For the process of structural transformation to get underway, African countries must invest in the manufacture of fertilizer, develop better methods of water control, improve transportation, and invest in cold storage. Each of these interventions requires significant amounts of energy, including energy from fossil fuels, and they are not replaceable—countries have managed structural transformation in different ways but to date none have leapfrogged the process.

1. Introduction

The structural changes in an economy that accompany its growth to high-income status have thus far been predictable in the United States and European countries. As agricultural productivity rises, the share of people employed in agriculture declines, and both urbanization and employment in manufacturing increase [1,2]. Food prices fall relative to wages, causing the share of income spent on food to decline to less than 10 percent. Asian countries have followed a similar path, although at a much faster pace. But most African countries have followed a different path.
This paper describes the lack of convergence in sub-Saharan Africa (henceforth “Africa”) and what it might take to get African countries on a path to high-income status. The premise of the paper is that economic growth in Africa is a necessary condition for improving poverty and cannot be discarded in favor of efforts focused solely on sustainability or the prevention of climate change.
The paper focuses on access to energy as a driver of economic growth. Goal 7 of the United Nations Sustainable Development Goals says that by 2030, all governments must ensure universal access to affordable, reliable and modern energy services for their citizens. They must also increase substantially the share of renewable energy in the global energy mix, and double the global rate of improvement in energy efficiency. The UN goes on to say that by 2030, governments must enhance international cooperation to facilitate access to clean energy research and technology, including renewable energy, energy efficiency and advanced and cleaner fossil-fuel technology, as well as promote investment in energy infrastructure and clean energy technology. Both rich and poor countries must expand infrastructure and upgrade technology for supplying modern and sustainable energy services for all in developing countries. In this paper, I focus on how Goal 7 might be operationalized in Africa, given the particular dynamics of economic development in the region.
Section 2 looks at the lack of economic convergence: in most African countries, the rising share of urban population has not been matched by increases in agricultural productivity, falling food prices, or the emergence of a viable industrial sector. What sort of interventions are needed to address these lacks? Section 3 looks at four interventions—all energy-intensive—that might get countries on a path to high-income status. Section 4 concludes with a discussion of economic growth and Africa’s carbon footprint.

2. Convergence

Figure 1 shows trends in the number of people employed in agriculture from 1800 to 2015 for a subset of high-income countries. Agricultural employment had peaked by 1950 in all countries in this group, and by 1900 for many; all saw sharp declines in agricultural employment from 1950 to 2015. This trend was particularly dramatic in countries that started with high agricultural employment, such as Japan and the United States; for example, Japan saw a decline from over 17 million to under 4 million employed in agriculture from 1950 to 2000. This trend began earlier in the United States, with an exit of 9 million people between 1900 and 2015. Lower-population countries with less agricultural employment at the start of the period, such as the United Kingdom and Finland, saw comparatively modest declines in individuals employed in this sector; nevertheless, these were significant when considered in proportional terms—for example, the United Kingdom saw agricultural employment fall from a high of 3.52 million people in 1861 to just under 500,000 in 2000, a decline of over 85 percent.
Most African countries are on a path different from the one depicted in Figure 1. The share of employment in agriculture in Africa remains high even as urbanization is increasing, even in middle-income countries. This path contrasts with the pattern of employment in the United States, Europe, and Asia.
Figure 2 plots the share of the working-age population employed in agriculture against gross domestic product (GDP) per capita in 2017, with African countries highlighted. There is a negative relationship between income and agricultural employment, with countries that have higher GDP per capita, such as South Africa, seeing a lower proportion of their working-age population employed in agriculture. However, middle-income countries such as Kenya show relatively high proportions of agricultural employment. Several low-income countries in the figure also show very high proportions of agricultural employment that are unmatched in any other region. For example, the Democratic Republic of the Congo still has over 80 percent of its working-age population in agriculture.
Let us compare Kenya with Bangladesh. Figure 3 shows trends in the share of total employment in agriculture, industry, and services in Kenya from 1991 to 2017. Starting around 2000, there was a gradual rise in agricultural employment coupled with a decline in employment in services; this trend reverses around 2005, but the share of agriculture remains high at 55 percent in 2017. The share of employment in industry is less than 10 percent. Figure 4 plots these trends for Bangladesh during the same period of time. While Bangladesh started with a much higher share of agricultural employment in 1991—almost 70 percent—it saw a 30-percentage-point decrease during the period, combined with sharp increases in services employment and a more modest rise in the employment share for industry. The sharpest decline in agricultural employment, with a corresponding increase in services employment, occurred during the early 2000s as industrialization took hold.
The share of urban population in Africa is high even at lower levels of income, and it is rising at a higher rate than it did during comparable periods in developed countries. Even at low levels of per capita income, a higher number of Africans have migrated to cities as compared with the populations of many Asian countries. But migrants from rural areas have mostly ended up in the informal sector, often in less than full-time employment [3].
Figure 5 plots trends in the relationship between the share of the population living in urban areas and GNP per capita from 1800 to 1980, with the trends for Africa versus developed countries highlighted. Despite starting with similar levels of urbanization and GNP per capita in 1800, the trends for developed countries and for Africa diverged rapidly during this period, with developed countries seeing considerable increases in both GNP per capita and urbanization, and Africa showing more modest increases. By the end of the period, Africa saw higher urbanization in relation to GNP per capita than that seen in developed countries with comparable levels of income.
Figure 6 plots the relationship between the share of the population in urban areas and GDP per capita in 2016, with Asian and African countries highlighted. While the graph shows a largely positive relationship between per capita income and urban population, several African countries, such as Djibouti and Liberia, have much larger urban population shares than their GDP per capita would suggest; for example, Djibouti and Bangladesh had similar GDPs per capita in 2016, but Djibouti’s share of population in urban areas was more than 40 percentage points greater than Bangladesh’s.
Looking at the share of agriculture in GDP versus GDP per capita in 2017 (Figure 7), we see that African countries tend to have both a lower GDP per capita and a higher share of agriculture in GDP than Asian countries, with a few exceptions such as South Africa. This contrast becomes apparent when we look at countries from the two continents with comparable levels of GDP per capita, for example, Chad and Nepal: Chad has a much higher share of agriculture in GDP than does Nepal. Figure 8 plots the share of agriculture in GDP over time, with selected countries highlighted. All countries saw declines in the share of agriculture in GDP, but the path of African countries was far less predictable than that of Asia, with the share of agriculture and the level of income not necessarily following a linear path.
McMillan and Rodrik [4] found that between 1990 and 2005, Africa’s structural change sometimes ran counter to the expected pattern of structural convergence in Europe and Asia. They illustrated this point via the longer-term trajectories of sectoral productivity and employment shares in Zambia. The authors compared changes from 1950 to 2005 in the relationship between labor productivity and employment share for the agricultural, manufacturing, and minerals sectors in Zambia. Zambia saw increases in the agricultural employment share accompanied by virtually no improvements in sectoral labor productivity, with small decreases in the employment share for the two other sectors and a limited decline in labor productivity in the manufacturing sector.
In contrast to Asia, labor in African countries has moved from higher- to lower-productivity activities. In resource-rich countries, even though extractive sectors may have high labor productivity they have not absorbed surplus workers from agriculture, many of whom have moved into low-productivity services. McMillan [5] suggests that there may have been a turnaround, with a positive contribution from structural change, over 2005–10. Even so, the pattern of structural change in Africa is different from that in other regions.

The High Cost of Food and Labor

African countries tend to be more costly to live and do business in than countries with similar incomes in other parts of the world. One explanation focuses on low agricultural productivity and weak domestic supply chains [6]. Figure 9 shows the productivity of agriculture in Africa versus other parts of the world. While it has shown some increase in cereal yields over time, Africa as a whole has not kept up with yield increases in other regions. Sub-Saharan Africa in particular lags all other regions—its cereal yields are about one-fifth the level of the rest of the world.
Food is expensive in many African countries, especially when compared with Asia [8]. On average, the African food price level is about 50 percent higher than the overall price level in the economy. Furthermore, a high share of urban food is imported, making it harder to support a low-cost labor platform for manufacturing [7]. In particular, process manufacturing—a key sector in early industrialization—has struggled to take off in a high-cost environment.
Food and nonalcoholic beverages account for 23 percent of nominal expenditures in Africa, the highest share of all regions [9]. Figure 10 shows the ratio of the price level for food and nonalcoholic beverages relative to the overall price level. The absolute level of food prices is much higher in most African countries than in the Asian countries that might be considered their industrial competitors; put another way, food prices in African countries tend to be around 30 to 40 percent higher than in non-African countries at similar levels of GDP per capita [6]. Ethiopia is an exception and some other countries are low in this ratio, but many others are very high.
Most of Africa is land-abundant and has high labor costs. Available data from the World Bank Enterprise Surveys show that labor costs in most African countries are high relative to GDP [10]. Analysis of these data shows that the annual average labor cost per worker in Bangladesh is USD 835, almost identical to the country’s GDP per capita. For African countries, labor cost per worker is often two or more times the GDP per capita. Only Ethiopia, at USD 909, is comparable with Bangladesh and with its own GDP per capita. Africa’s labor cost premium increases with the size of the firm; larger firms are significantly more expensive to staff than comparably sized firms outside the region.
The labor-intensive manufactured exports model that was based on land scarcity and cheap labor in Asia has not proven to be an option for Africa. In a June 2021 email exchange with the author, Lant Pritchett, a distinguished development economist, wrote that “African countries are land-abundant and sparsely populated, and so they are ‘bazaar’ economies, not market economies, because they don’t have enough economic density per square mile to make ‘market institutions’ pay off. The fundamental challenge is lots and lots of relatively low-productivity land, which makes labor costly and market infrastructure and productive infrastructure more expensive as well. The latter are characterized by average cost that declines with population density.”

3. Agricultural Productivity

Section 2 has shown that most countries south of the Sahara have yet to undergo the process of structural transformation whereby increases in agricultural productivity and addition of value throughout the agricultural supply chain create a labor surplus that helps mobilize resources and workers for the industrial sector.
As described previously, agricultural yields in Africa are low and food is costly, while the share of employment in agriculture remains high. How might this situation change? There are many interventions at the micro level that have been carefully studied, including access to better weather data, access to credit, and the use of new crop varieties. This section focuses on large-scale interventions needed to grow more food and to bring that food cheaply to urban markets. Each of the physical interventions described here—fertilizer, irrigation, roads, and cold storage—requires energy. For the process of structural transformation to get underway, African countries must produce energy for the manufacture of fertilizer, develop better methods of water control, improve transportation, and invest in cold storage. Countries have managed structural transformation in different ways but to date none have leapfrogged this process.
What are the drivers of the mix of renewable and non-renewable energy in the African context? Two factors dominate: the availability of renewable energy technology and the relative price of this technology with regard to alternatives in the non-renewables sector. At present, Africa cannot grow its economies on a “renewables-only” basis; technology for fertilizer production and roads necessarily involves fossil fuels, as I demonstrate below. This may change as new technologies emerge that are viable for the continent. Changes to relative prices are making renewables more attractive, but challenges with regard to intermittency, the high cost of storage, and cost recovery remain.

3.1. Land Use and Fertilizer

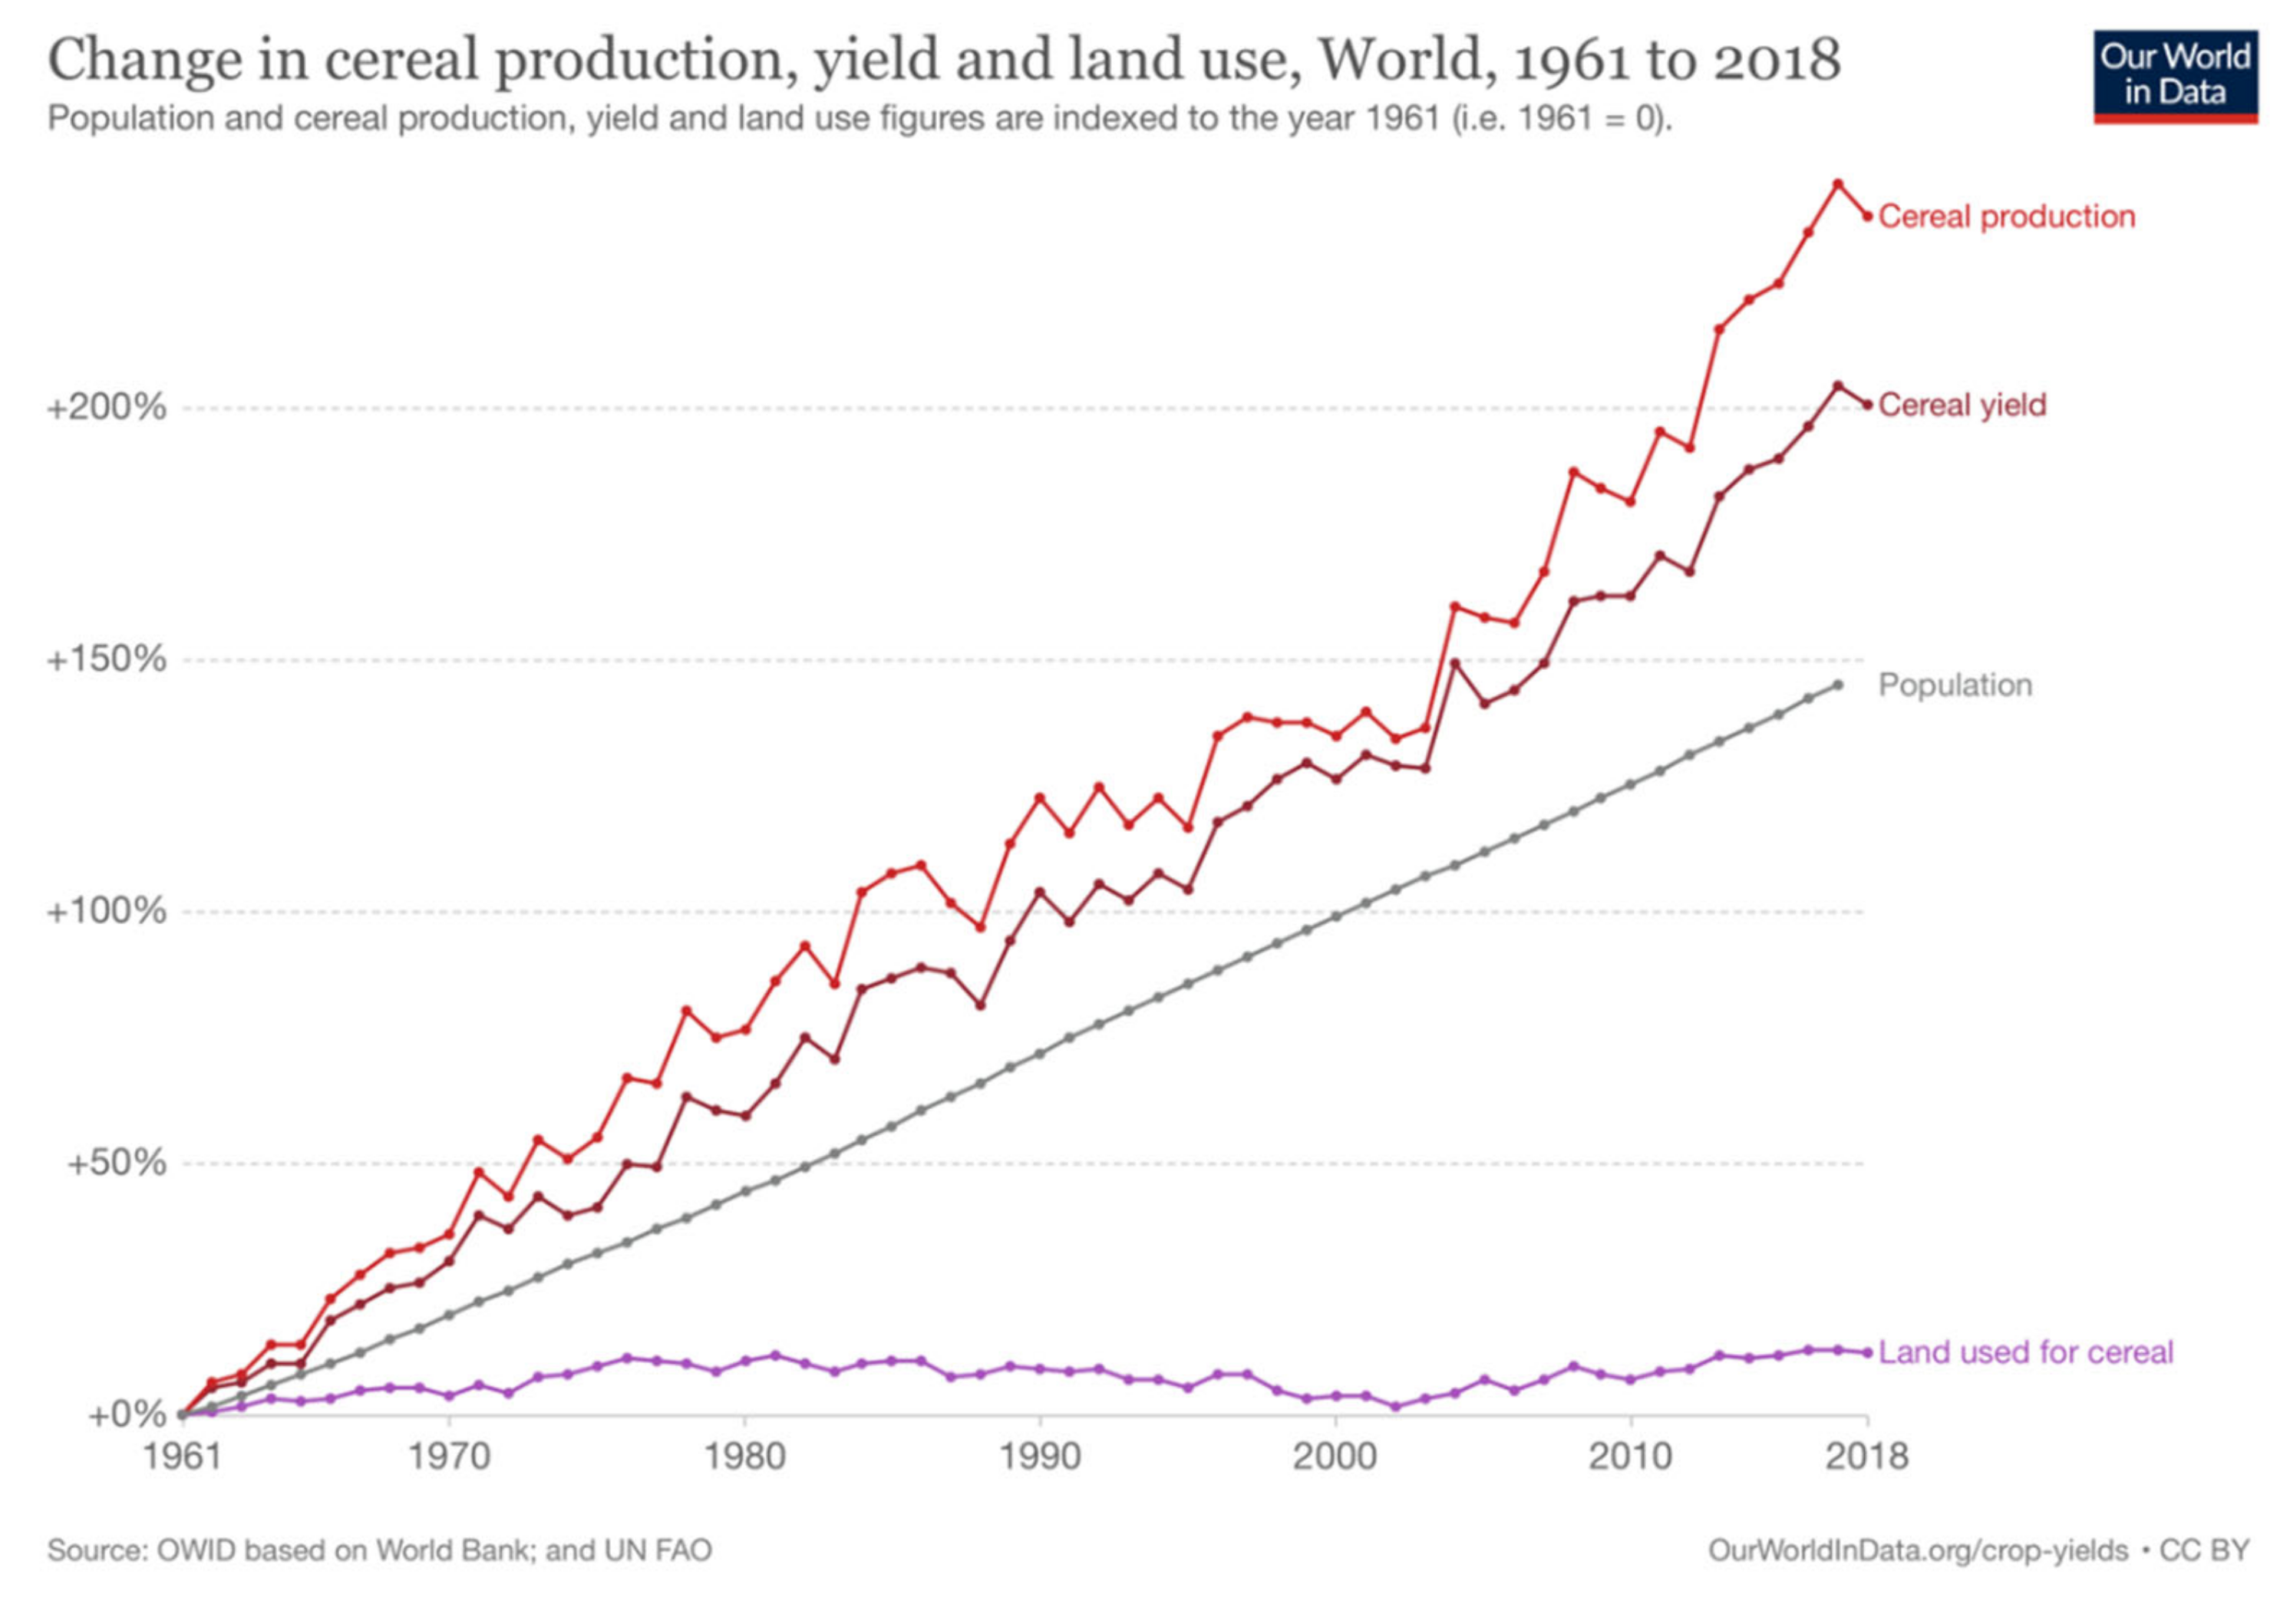
Since the 1960s, the world has grown increasingly larger amounts of food on a more or less fixed amount of land (
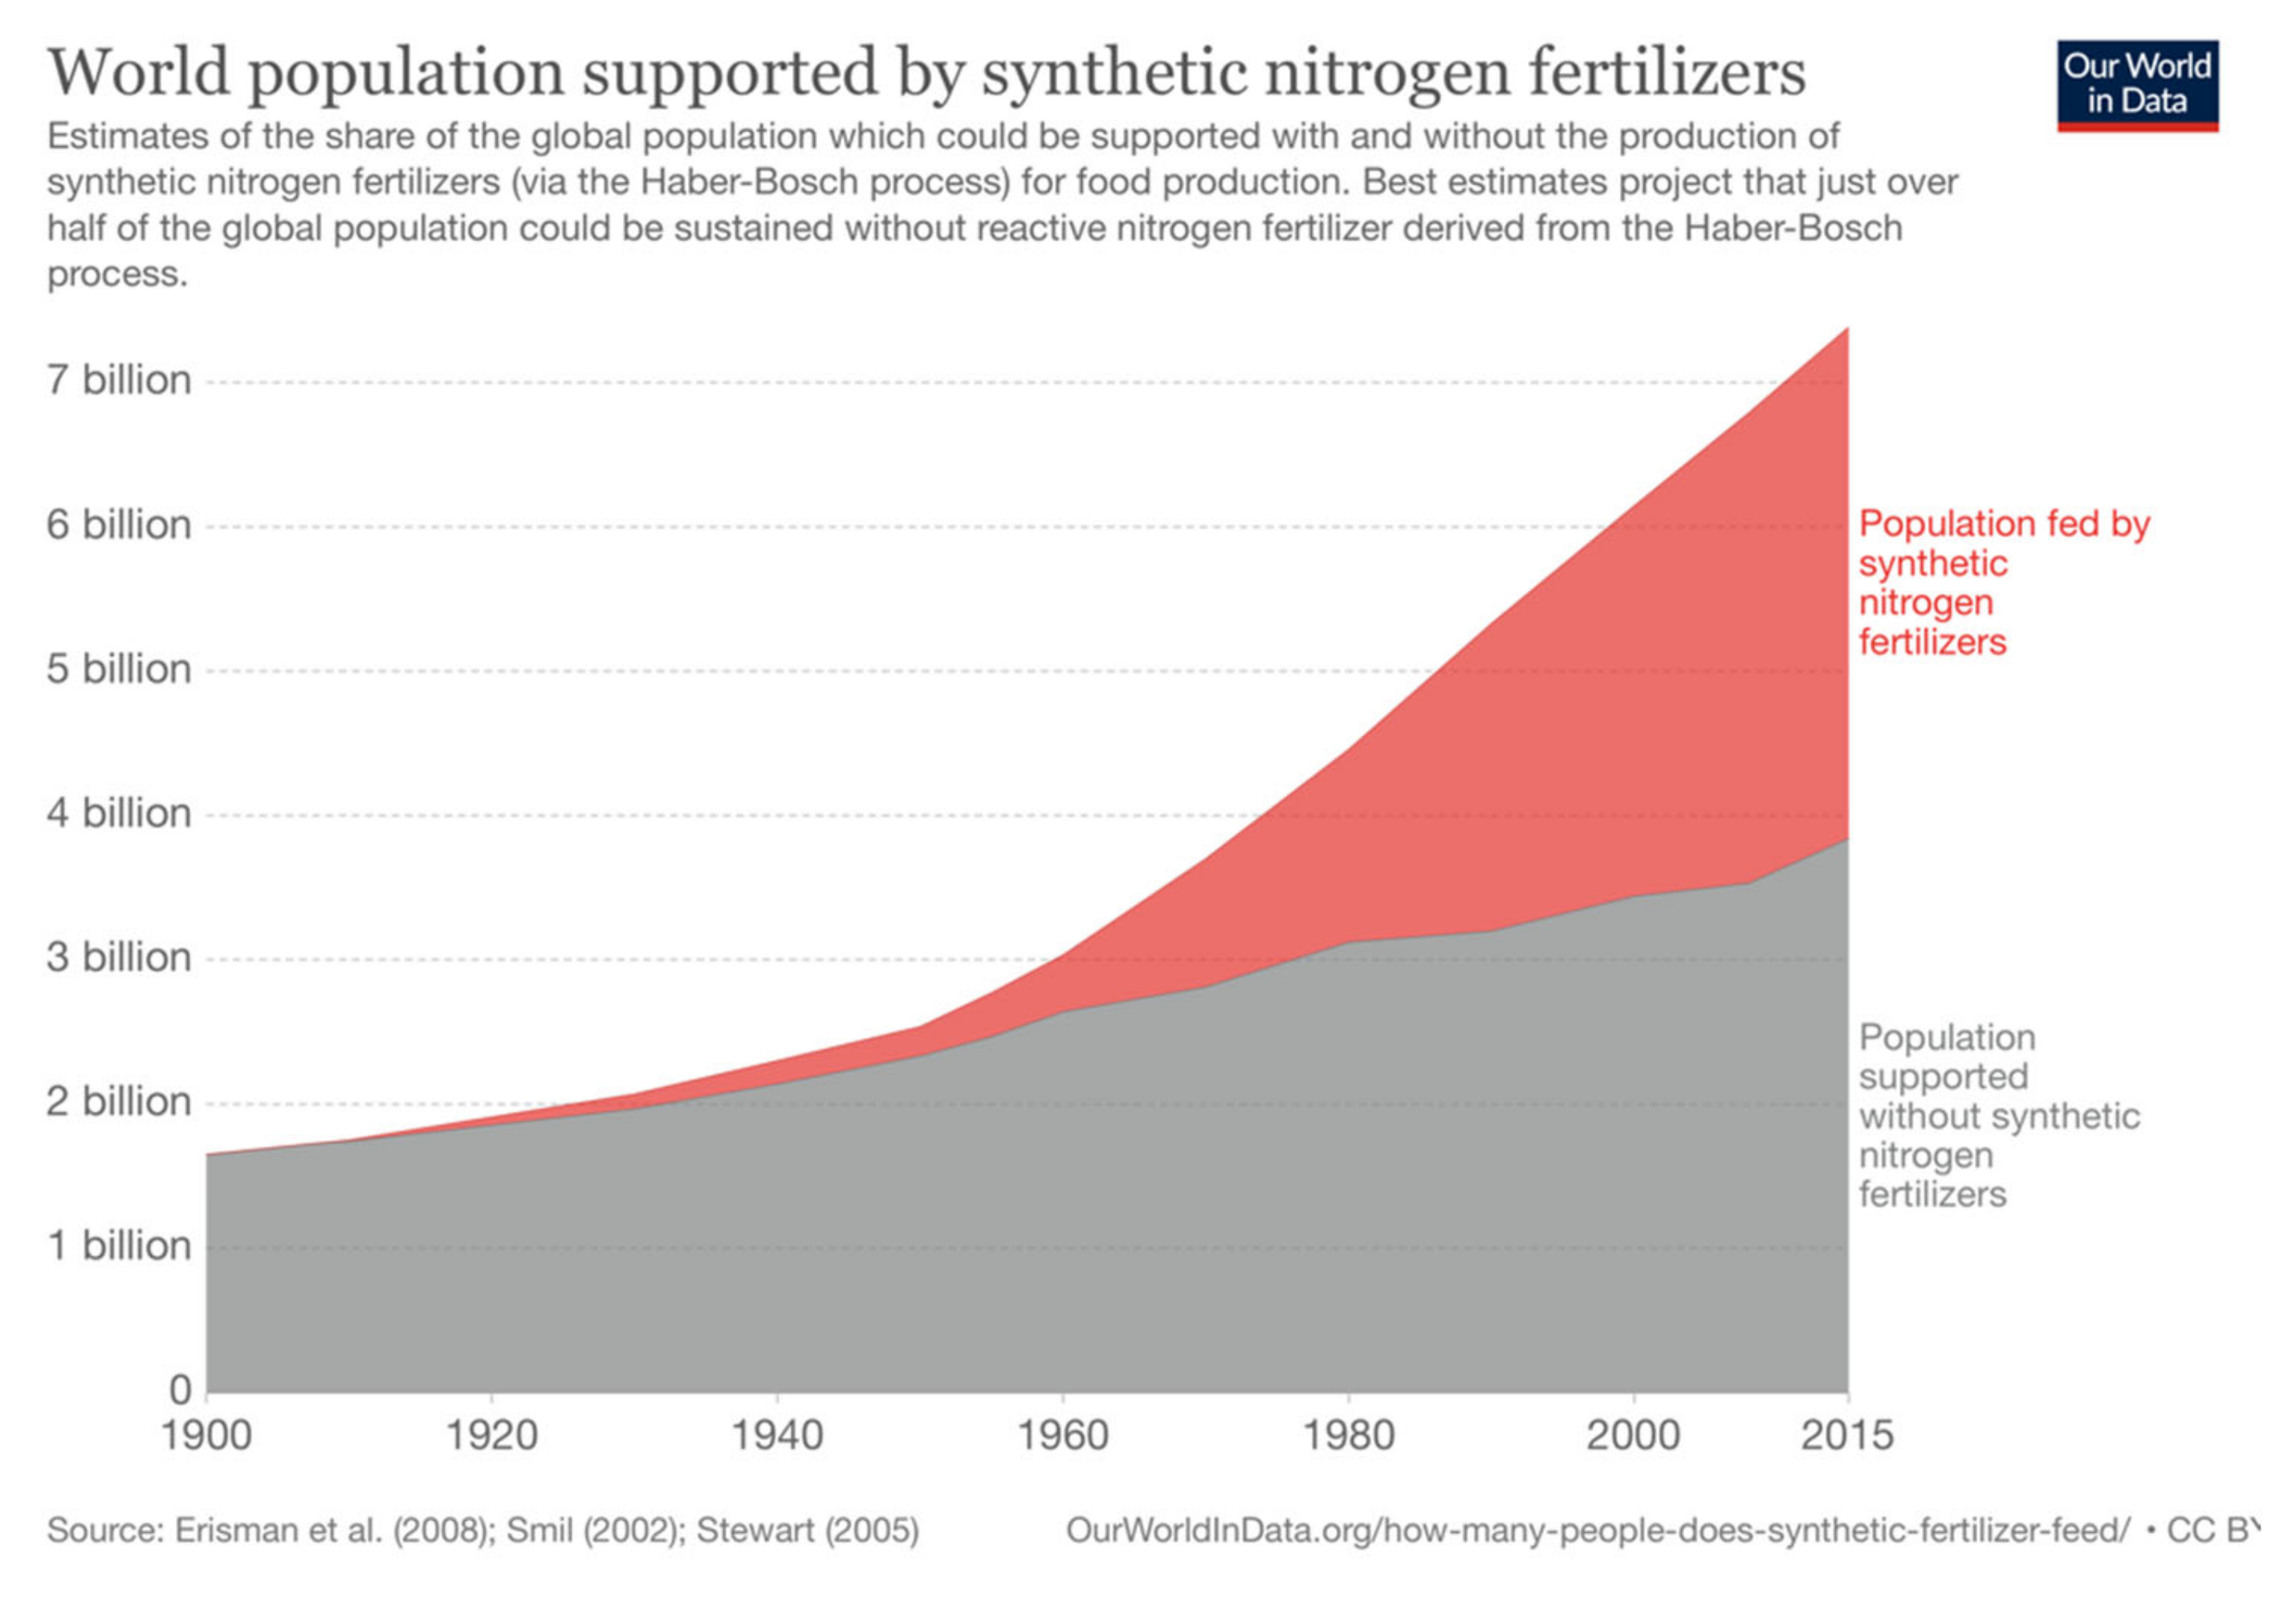
Figure 11). The rate of growth in cereal production and yield has exceeded population growth, thereby preventing famine and raising caloric intake in every part of the world. This is in large part due to the availability of synthetic nitrogen fertilizer, manufactured with the Haber–Bosch process. As Figure 12 shows, almost half of the world’s population is sustained by yield increases generated by the addition of synthetic nitrogen fertilizer.
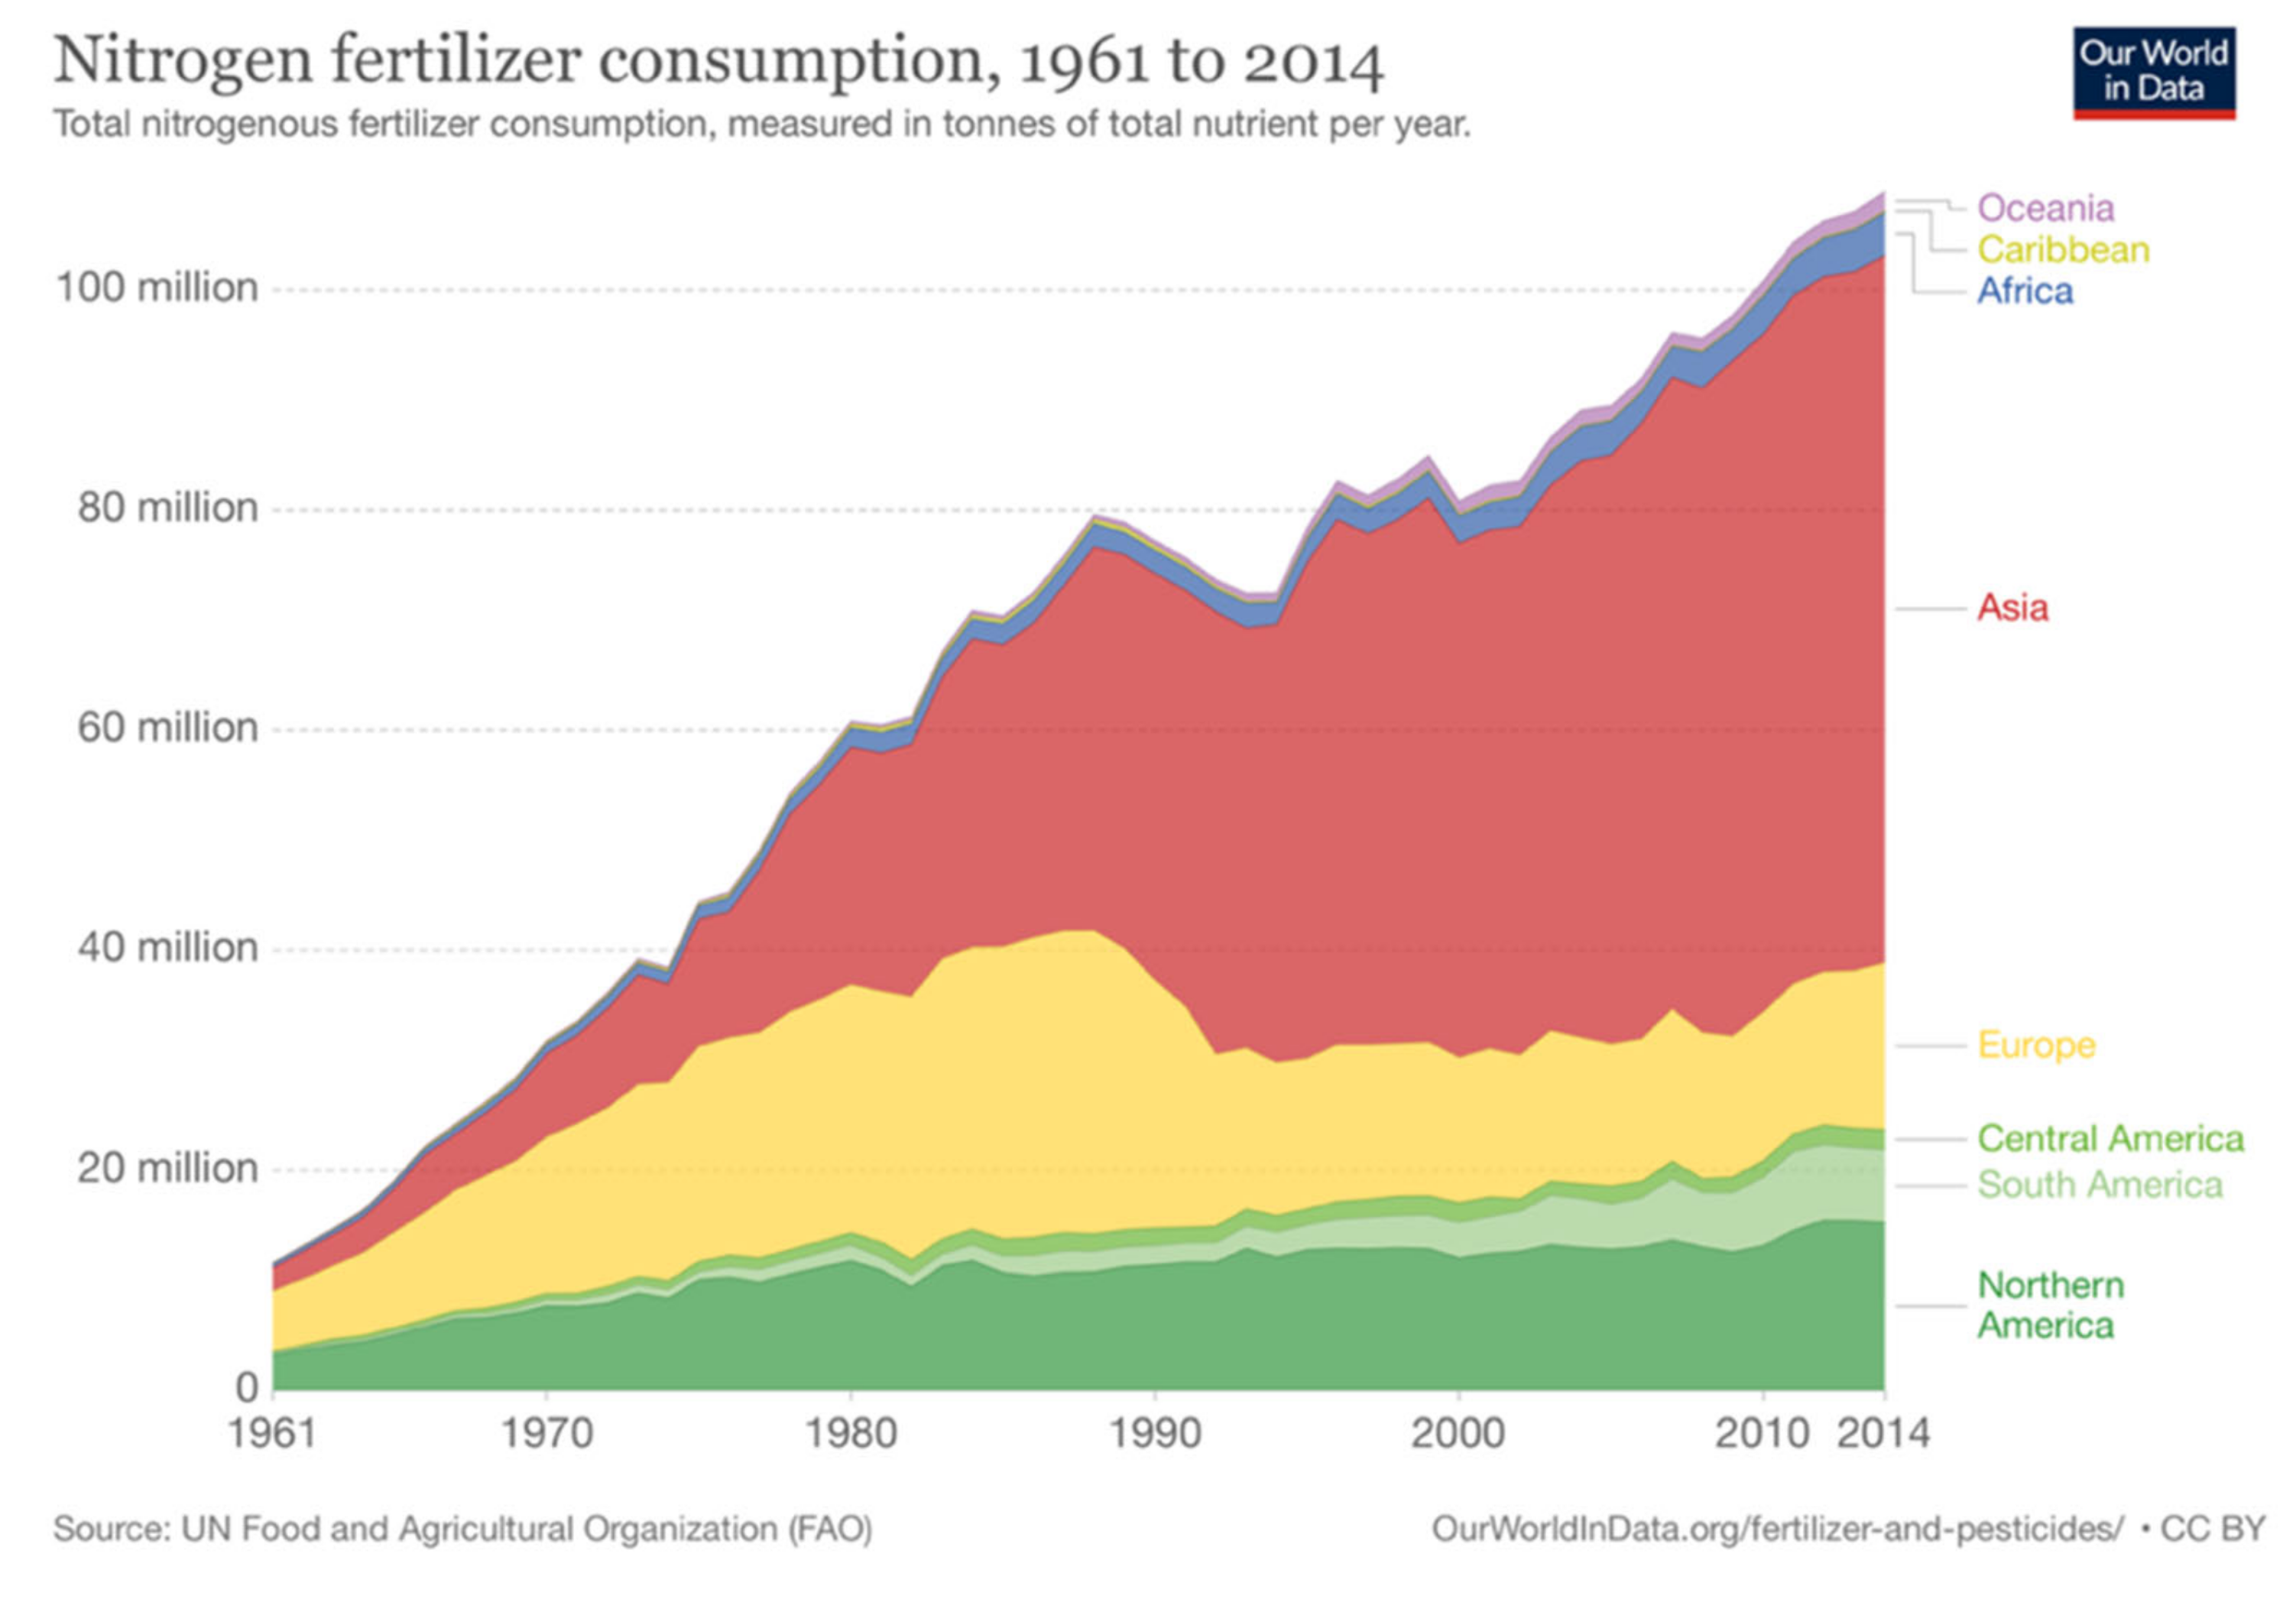
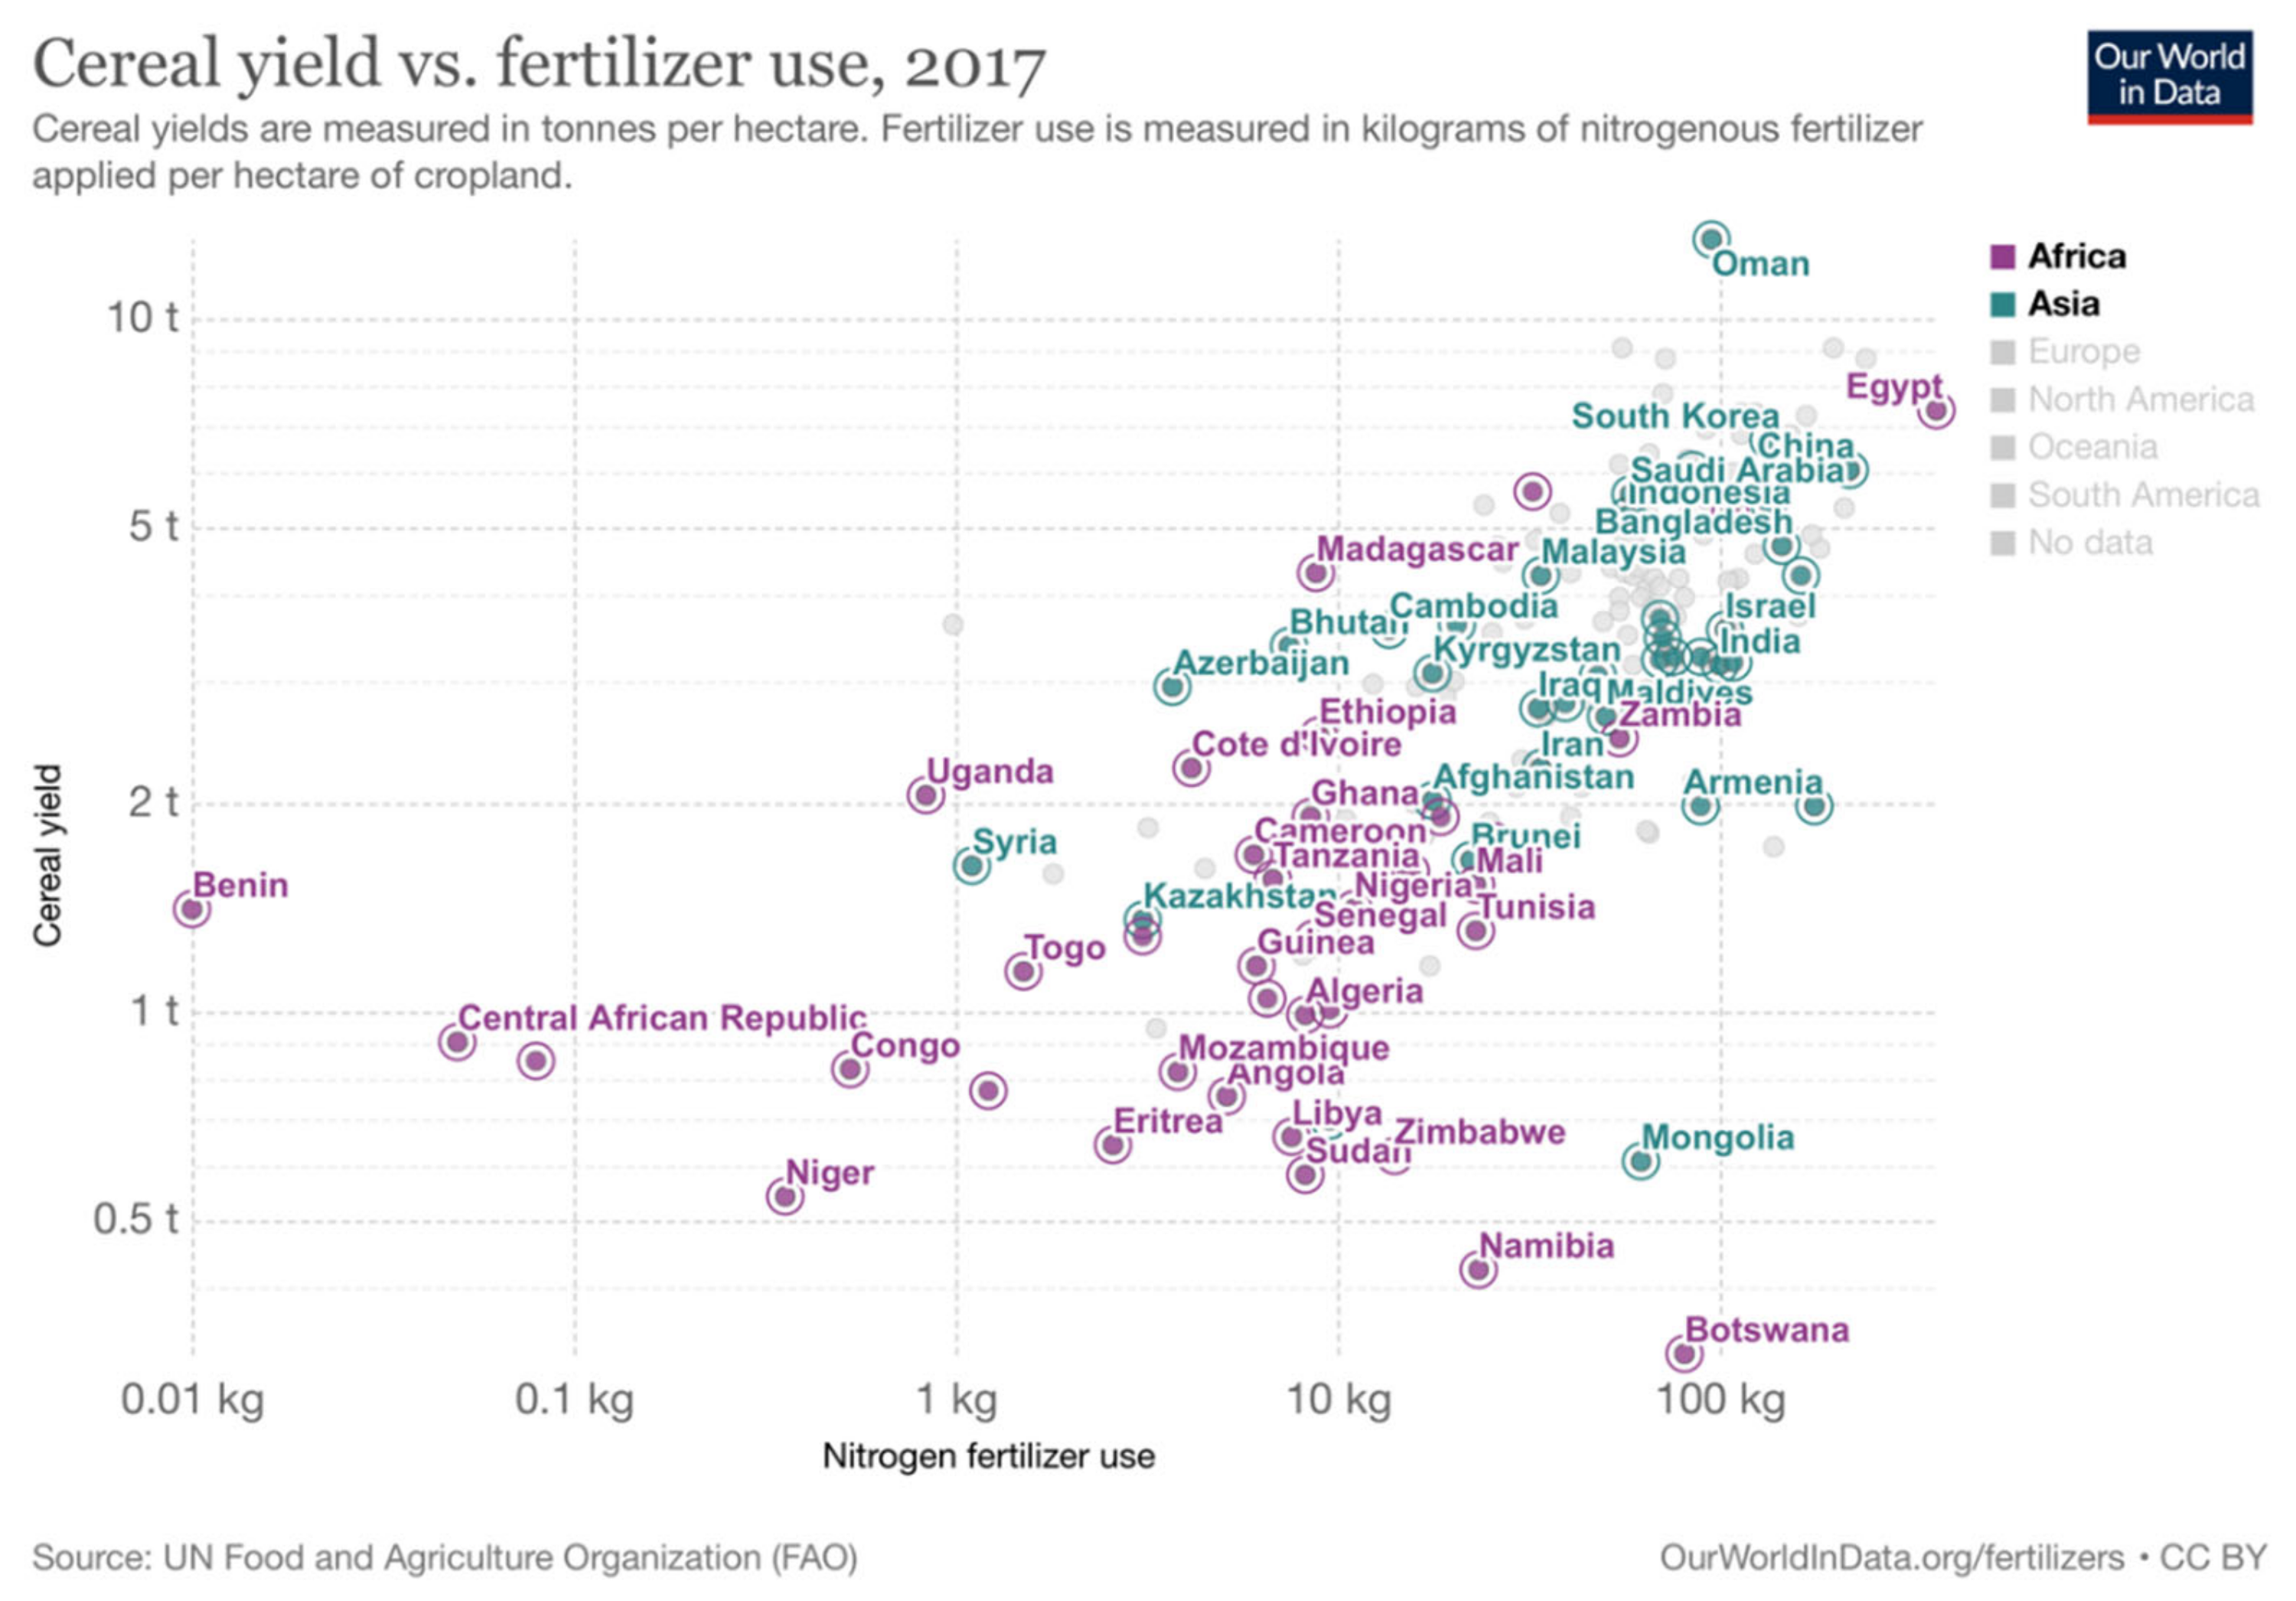
African agriculture, however, has not benefited from the invention of synthetic fertilizer. Figure 13 shows cereal yields and fertilizer use in African countries as compared with Asian countries. In terms of global fertilizer consumption, Africa remains a blip; most of the increase in consumption is in Asia, where yields are 10 times or more those of Africa. Fertilizer use is on the order of 10 to 50 kg per hectare in Africa, as compared with 100 to 500 kg in Asia (Figure 14).
For Africa to benefit from the use of fertilizer, it must make use of its reserves of natural gas. Natural gas is the most efficient energy source for the manufacture of fertilizer. Though a fossil fuel, it is roughly twice as carbon-efficient at generating power as coal is, while producing radically lower levels of water and land pollution. It occurs in many African countries including Algeria, Angola, the Democratic Republic of the Congo, Egypt, Libya, Mozambique, and Nigeria. Africa is estimated to have reserves of 624 trillion cubic feet of natural gas; using a share of these reserves to increase the production of fertilizer will result in significant productivity gains in agriculture.
The energy cost of producing fertilizers, particularly nitrate fertilizers, is high [11]. Scientific estimates suggest that the scale and intensity of the production of ammonia, a key ingredient in fertilizer manufactured with the Haber–Bosch process, accounts for 1-2 percent of global energy consumption and 3-5 percent of natural gas output [12]. In Bangladesh the power sector uses about 45 percent of natural gas, while the fertilizer sector consumes another 35 percent [13].

3.2. Water Control

Water is an essential input to growing food. Irrigation has played a significant role in ending famines and raising food consumption in India, the world’s largest agricultural water consumer at nearly 700 billion cubic meters per year. Since 1970, India’s production of cereals has grown at a faster rate than its population (238 percent versus 182 percent); increasing the share of irrigated land has played a significant role in food production (Figure 15). China is the world’s second-largest consumer of water for agriculture, using 385 billion cubic meters in 2015. In both countries, better water control, new crop varieties, and increased use of fertilizer have expanded agricultural output. In Africa the story is very different. Less than five percent of agricultural land is irrigated in most African countries. However, after a hiatus of 30 years several African governments have begun to invest in large-scale irrigation. Figure 16 shows the share of agricultural land that is irrigated around the world.
Investments in irrigation are central to raising productivity in agriculture [14,15,16]. Funding for and interest in irrigation waned in the 1980s due to environmental concerns, mismanagement of irrigation projects, and lack of donor support. Irrigation projects have not yielded expected returns and have suffered from poor governance, lack of market integration, and the degradation and consequent abandonment of irrigated land [17]. Pittock, Bjornlund and van Rooyen argue that the underperformance of irrigation in Africa is due to central control, which has resulted in a misalignment between government objectives and the needs of farmers [18].
Traditional irrigation has long been practiced in sub-Saharan Africa, but commercial-scale systems have yet to be put in place. North Africa has a relatively high percentage of irrigated land, but most countries south of the Sahara are largely dependent on rainfall. Zimbabwe is a case in point: in 1980–81, the country produced an annual harvest of 2 million tons of maize. Following a drought the next year, annual harvest fell to 1.4 million tons. By 1983 the annual harvest had plummeted to 600,000 tons due to lack of adequate irrigation to provide a buffer against erratic rainfall patterns [19]. In 1982 only seven African countries had 10 percent of their total cropped area irrigated [19]. This situation has remained largely unchanged, as there has been little investment in irrigation over several decades.
Irrigated farmland often yields two or more times the yield of land that is solely dependent on rainfall. However, a set of challenges—identified more than three decades ago—has prevented the large-scale adoption of irrigation in many African countries. These roadblocks include the high cost of large-scale irrigation systems in Africa compared with other parts of the world, as well as technical complexities arising from the topography of the land and the flow of major rivers [19]. Two-thirds of the region’s irrigated area is concentrated in five countries: Egypt, Madagascar, Morocco, South Africa, and Sudan [20].
These challenges must be overcome in order for Africa to grow more food. Production of rice, a common staple in sub-Saharan Africa, has the potential for much higher yields. Otsuka and Muraoka pointed out that 80 percent of lowland paddy fields in sub-Saharan Africa are rainfed [21]. Rice yields in Madagascar, the country with the largest harvested rice area, are relatively high—partly because the irrigation ratio in the country is about 50 percent. Table 1 describes the state of irrigation in Africa.
There is vast potential for irrigation development in sub-Saharan Africa, given the available water resources and the population of farmers that could benefit from productivity gains [20]. Employing a spatial production allocation model, You and colleagues showed that the amount of land that can be irrigated in Africa over 50 years is about 24 million hectares. They also estimated the internal rate of return for a small-scale irrigation project to be 28 percent, compared with 12 percent for a large dam-based project [20].
There may be greater potential for small-scale irrigation systems than for large ones. Merrey examined the recent renewed focus in international development on large-scale irrigation investments in sub-Saharan Africa, concluding that these projects often do not achieve the aims set out in project documents and that, in fact, large-scale projects have often been effective only when designed to support small-scale projects [23]. Other reasons for the unfavorability of larger projects include: (1) the lack of economic viability (for example, a 2020 study [24] found that a large-scale irrigation project like the one in Mwea, Kenya, if constructed today, would be only minimally viable and with an unrealistically high rice price, similar to that seen during the mini–rice crisis of 2008–13); (2) the tendency for even well-performing projects to suffer from deterioration due to lack of finances and human resources to provide regular maintenance; and (3) the fact that large-scale investments are more expensive per beneficiary than small-scale projects. Merrey [23] concluded that governments have incentives to attract large projects that generate votes and provide opportunities for employees of public irrigation agencies. International institutions are also positioned to make investments in large projects that do not require building the same kinds of support systems that farmer-led irrigation would require.
Small-scale irrigation, also known as distributed irrigation, has the advantage of lower unit cost, better performance outcomes, and environmental benefits in terms of reducing soil salinization, all as compared with large-scale irrigation projects. Some international lending institutions are partnering with local smallholder agricultural extension programs to provide financing to farmers for such small-scale projects [25]. For smallholder farmers in rural areas, solar-powered pumps are gaining traction. Diesel pumps cost about USD 400, with additional expenditures needed for maintenance and fuel. Small-scale solar water pumps, which have lower maintenance costs and do not depend on diesel, cost between USD 600 and USD 2000; financing is available with monthly payments ranging between USD 20 and USD 75. This solution has proven to be costly for some, but is a viable alternative for many smallholder farmers [26].
A randomized experiment that assigned some northern Benin villages photovoltaic-powered drip irrigation units (PVDIs) found increases in these villages’ living standards relative to nonbeneficiaries [27]. Further, in villages that received PVDIs, vegetable consumption increased to the recommended daily allowance. The authors showed that newer technologies can reverse historical trends; until recently, small-scale irrigation schemes in sub-Saharan Africa have mostly been unsuccessful.
Projects like Transforming Irrigation in Southern Africa (TISA), which comprised five irrigation investments focused on smallholders in Mozambique, Tanzania, and Zimbabwe between 2013 and 2017 [18], have also demonstrated that irrigation programs can be profitable if they are commercially focused and prioritize the maintenance of water-related infrastructure. TISA was a departure from previous irrigation projects; it successfully focused on smallholder irrigation needs and on setting smallholder farmers on a path to profitability. Under TISA, farmers were provided with soil monitoring tools to aid their decision making and agricultural innovation platforms were formed to crowdsource ideas on improving profitability. Sustainable water use, greater food security, and higher farm incomes were stated goals of the project. Most importantly, farmers moved away from subsistence and toward commercial farming, negotiating better contracts both upstream and downstream in the value chain. TISA can serve as model for newer and larger irrigation schemes in Africa, including the Bura and Mwea projects in Kenya, the Shire Valley Transformation Program in Malawi, and several projects in Niger, Nigeria, and other West African countries.
Other research has suggested a role for large-scale projects. Williams [28] evaluated the Large-Scale Irrigated Farming System (LIFS) model, whereby a public irrigation system distributes water over an area that is suitable for cultivation, and farmers lease land there to grow crops for sale. Williams noted that this model has not acquired popularity in Africa and that such projects tend to have mixed results. However, he argued that LIFS complements existing irrigation systems in Africa and thus has the potential to improve the resilience of agricultural production and livelihoods. Williams concluded that irrigation can play a positive role, given the underutilization of surface and groundwater together with increases in the demand for food. However, this role cannot be played out on a “business-as-usual” basis; lessons learned from past projects are of great importance in designing new ones that, among other things, allow for the use of surplus water for agroprocessing of raw agricultural products.
Higginbottom and others [29] examined the proportion of irrigation successfully delivered across 79 projects in Africa, finding that such projects consistently underdeliver; only 20 projects delivered water to more than 80 percent of the targeted area. The authors pointed to a lack of government capacity as one of the main reasons for underperformance. They also highlighted the perception of agricultural production as being a largely technical endeavor, which results in ignoring the behavior and cultivation methods of smallholder farmers (who tend to be underrepresented in official data) as well as the social structures and socioeconomic factors involved in agricultural production and livelihoods.
Many projects were likely overoptimistic from the start, an outcome of governments focusing on national food security goals that do not necessarily align with what is economically viable. Going forward, Higginbottom and others [29] suggested that improvements in irrigation program development and management will be required, along with the possibility of considering alternatives such as smaller-scale, farmer-led initiatives. Improved data on smallholder farmers and methods of cultivation will be necessary to understand past performance and to plan future projects. Large-scale irrigation projects can play a positive role in poverty alleviation if lessons are learned and practices improved [28].
It is unlikely that Africa can increase yields and productivity in the absence of large-scale irrigation. Yields are one-tenth those of Asia. Large-scale irrigation projects with significant energy requirements will be needed to transform the agricultural sector and meet the rising demand for food. New projects will benefit from the lessons of failed projects, from modern designs that incorporate energy-efficient technologies, and from substantial and continuing donor support. Careful cost-benefit analysis and a realistic assessment of state capacity are also important.
Large-scale projects such as dams and highways were undertaken in the United States and other rich countries when institutional capacity was low and regulatory standards were in the early stages of development. As in the case of rich countries, it is likely that institutional capacity in African countries will evolve side by side with infrastructure investments. These investments must not be held up by imposing present-day, rich-country standards on poor countries. Moreover, donors must not insist on “best practice” standards developed by other countries but rather enable the development of the institutional capacity necessary given the contexts and realities of poor countries [30].

3.3. Roads

Local food supply chains are often neglected by policymakers and donors, but are critical to the success of agriculture and the transition to industry. Domestic food supply chains provide the vast majority of food across sub-Saharan Africa and are hampered by poor roads and the lack of a reliable supply of transportation fuel. Imports are made more expensive by last-mile costs.
Transport connectivity is critical for growth, trade expansion, and connecting farmers to markets. However, there is a large and persistent gap in infrastructure in the region. Road density has been declining over the past two decades, while the density of the railroad network remains low. An Africa Infrastructure Country Diagnostic background paper published by the World Bank in 2008 [31] showed that roads per 1000 sq km of land averaged 944 km globally, but only 204 km in Africa. Worse still, only a quarter of these 204 km were paved. A more recent Brookings Institute article noted that low-income countries have approximately 134 km of paved road per 100 sq km of land, while Africa has about 31 km [32].
Road construction is expensive and energy intensive. One of the key materials required, among others, is asphalt—that is, petroleum in viscous liquid form. When used for road construction, it is in the form of a composite material known as asphalt concrete, which is 70 percent asphalt and 30 percent aggregate particles. Asphalt has the advantage of being recyclable, and is commonly used for road construction [33]. But asphalt also consumes a significant amount of energy. According to the U.S. Energy Information Administration, the petroleum refining sector (under which the production of asphalt falls) is the second most energy-intensive manufacturing industry in the United States [34]. While asphalt may be the most energy-consuming material used for road construction, concrete also consumes energy to heat calcium carbonate (limestone) to extremely high temperatures.
The process of producing asphalt has several stages: extraction, transportation and storage, heating, distillation, cooling, and final processing. The bulk of energy consumption happens in the distillation process. Energy is also required for heating to ensure fluidity after asphalt has been shipped to a concrete production plant.
The embodied energy (defined as the total amount of energy used in each process of a production chain) used in road construction is quite significant. Varying estimates of the embodied energy used in asphalt production come to an average of about 3 megajoules for each kilogram (about two pounds) of asphalt produced. This is equivalent to the energy required to power a typical household in the United States for one hour [35,36]. In total, road construction is estimated to require between 2 and 4 terajoules (about 600 and 1200 kWh) per lane-kilometer of roadway paved. For context, the energy needed to construct a kilometer-long one-lane road is equivalent to the energy contained in 23,000 gallons of conventional gasoline. Transportation fuels, critical to the proper functioning of road-based supply chains, are also expensive in Africa. 
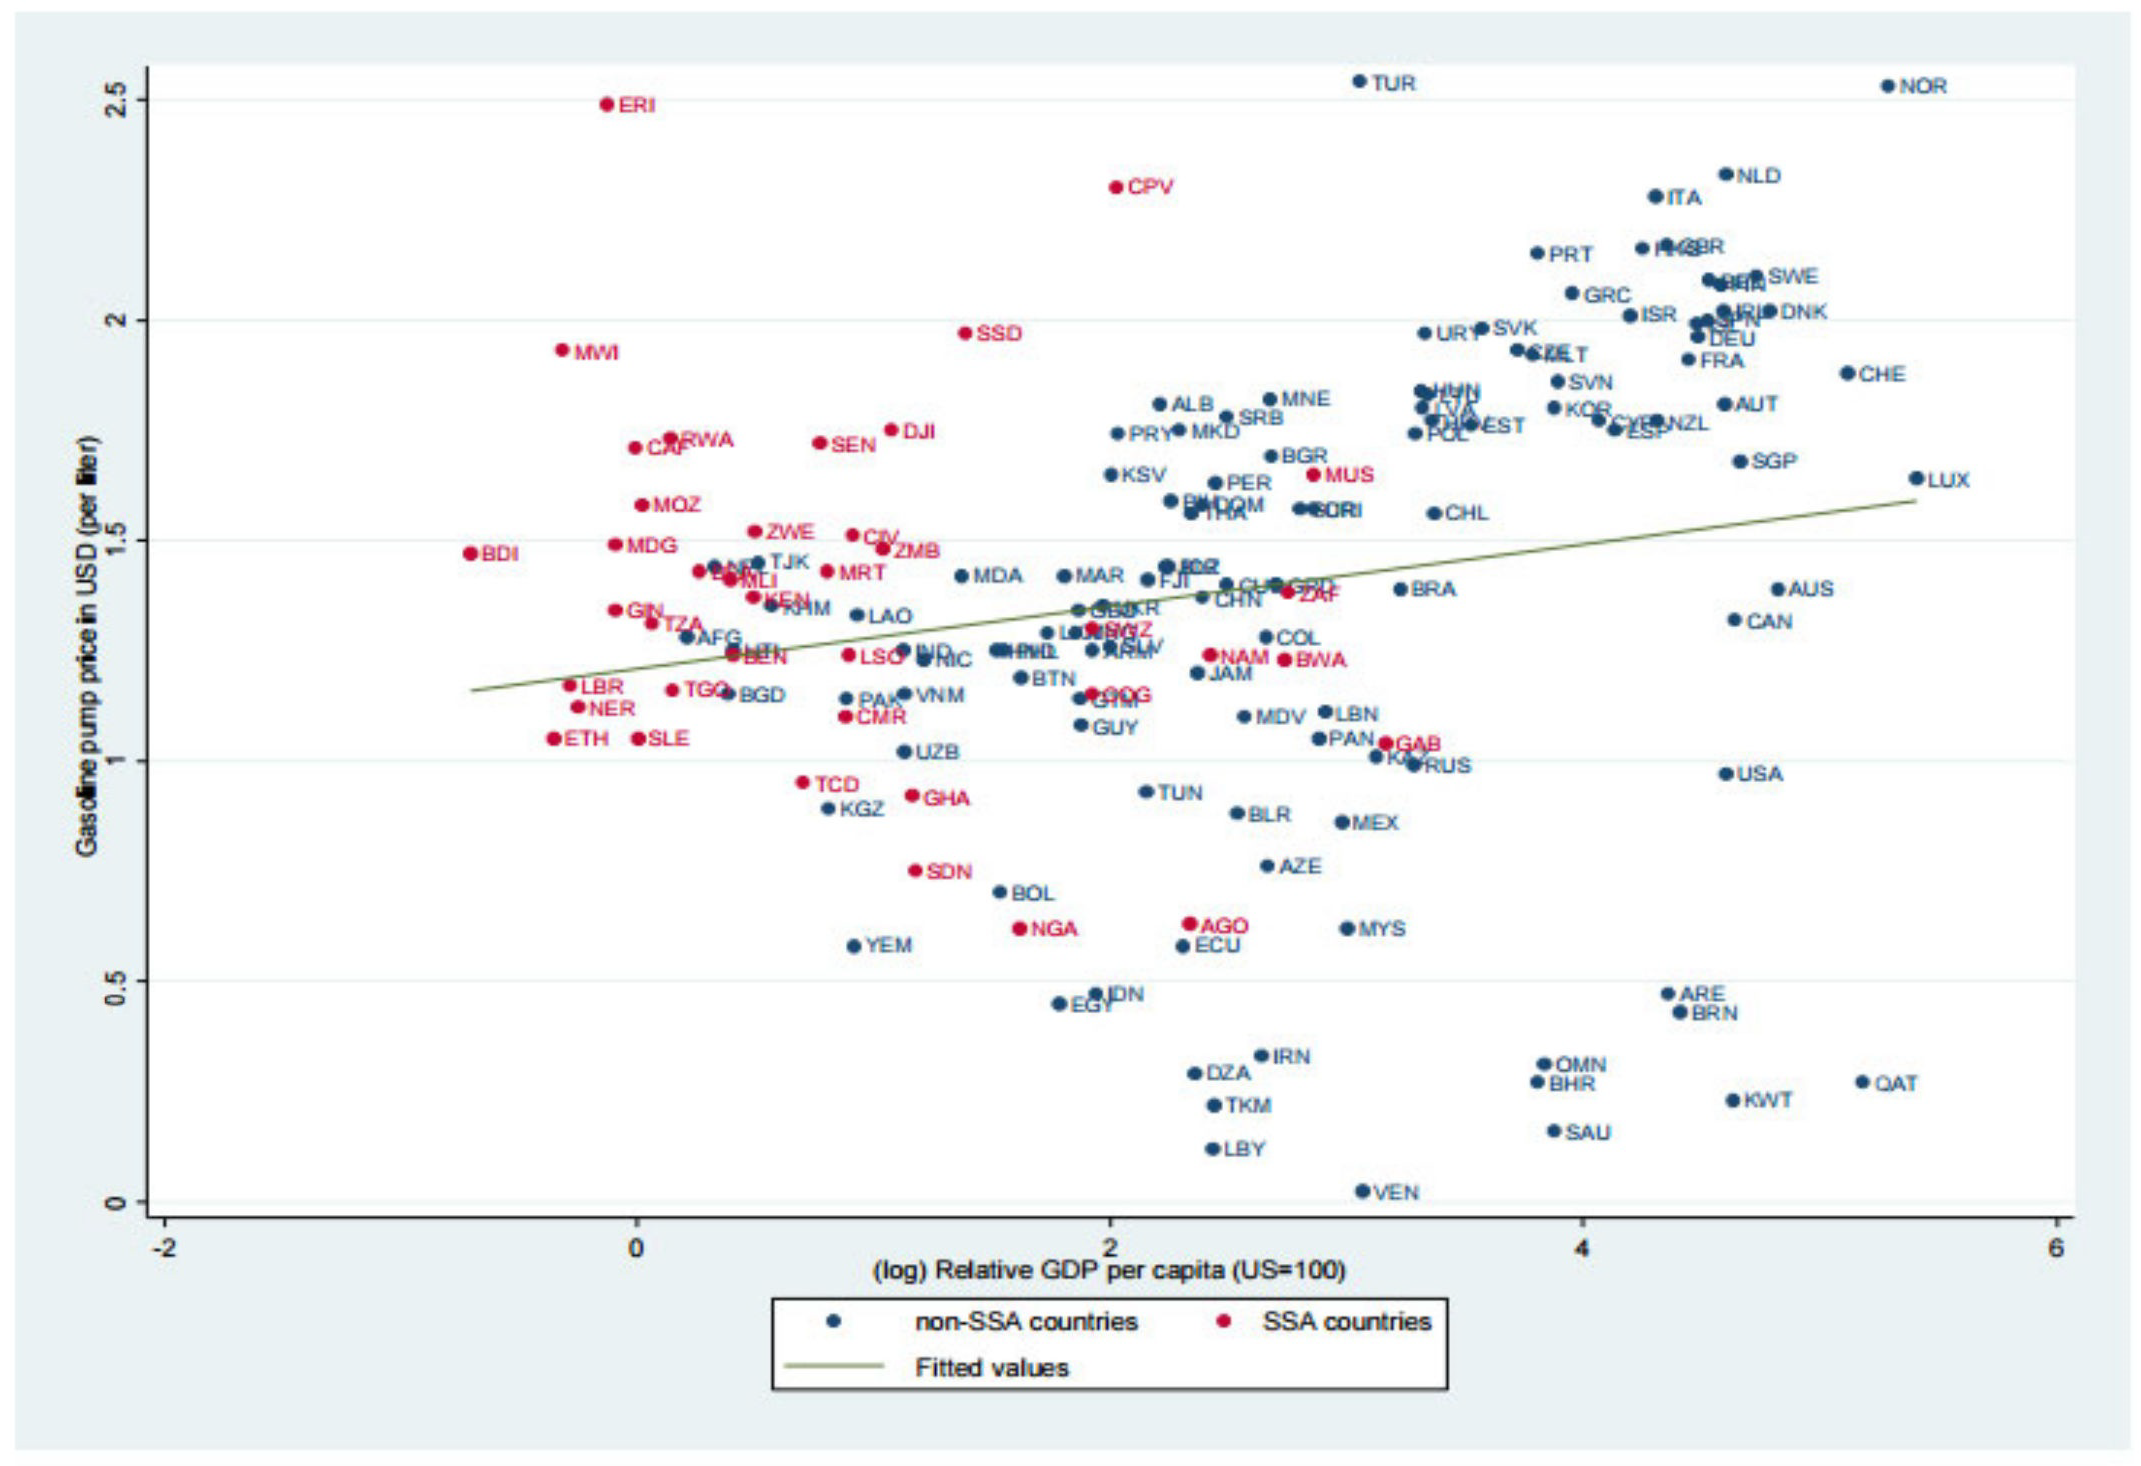
Figure 17 shows that gasoline prices at the pump are high relative to those in other countries at comparable income levels [6].

3.4. Cold Storage

A successful transformation in African agriculture will require serious investment in cold storage facilities, especially in rural areas. Communications will be part of this investment, but mobile phone technology has already solved most of that problem with minimal demand on the national power grid. Local solar suppliers can keep cell phones charged and solar-diesel hybrid systems can run most cell towers, but large-scale cold storage will require significant energy inputs from a range of energy sources that will likely include fossil fuels.
Postharvest losses are a major concern for most African countries. Defined as reductions in the quantity of food or in its quality making it unfit for consumption [37], losses occur in the production, post-harvesting, and processing stages of food production [38]. The extent of postharvest food losses in Africa is mostly unknown. Some studies argue that between 25 and 50 percent of farm production is lost globally [39,40]. The Food and Agriculture Organization of the United Nations (FAO) has reported that about 1.6 billion tons of perishable foods, worth over USD 1 trillion, goes to waste each year because of lack of proper postharvest storage [41].
A widely acknowledged cause of food losses is the lack of cold storage facilities. Combined with low rates of electricity access and the poor quality of the power supply in many sub-Saharan African countries, the lack of cold storage means that food often does not get to market. While there are no official statistics, postharvest food losses are understood to be high across the African continent. Anecdotal evidence suggests that as much as half of all food grown is lost due to lack of storage facilities.
In Kenya, most cold storage facilities are privately owned and concentrated in Nairobi. Private capacity is estimated to be 1790 tons per day. In the public sector, the Horticultural Crop Development Authority owns eight storage facilities, with a combined capacity of 205 tons per day [42]. The cost of cold storage is prohibitive for many farmers, forcing them to sell their produce to middlemen immediately after harvest, often at very low prices. In Nigeria, according to the International Food Policy Research Institute, 45 percent of fresh produce goes to rot for lack of cold storage, resulting in significant loss of income for about 93 million farmers [43]. In rural areas of northern Nigeria, where farmers grow fresh produce, access to cold storage is virtually nonexistent. Perishables grown in remote parts of northern Nigeria often have to travel long distances to the southern part of the country, and losses from the lack of cold storage facilities are high.
A 2018 Sustainable Energy for All study quantified the gap in cooling by identifying countries that are most susceptible to warming [44]. While the total number of people without electricity access (measured without consideration as to reliability) is estimated at about 700 million [45], most people without access are rural dwellers and a high share of those are smallholder farmers. In Nigeria, approximately 60 percent of rural residents lack access to electricity and consequently to any type of cooling technology, including cold storage. Nigeria is classified as one of the countries at greatest risk from lack of access to cooling, due to prolonged periods when temperatures will rise above 30 °C (86 °F). Two other African countries projected to be at high risk from lack of access to cooling are Mozambique and Sudan.
Rural farmers in Kenya are entering into partnerships with food-cooling companies to help with cold storage and distribution of farm produce to street vendors across cities [42]. Homegrown initiatives and investments in cold room chains by innovative local entrepreneurs across sub-Saharan Africa are contributing significantly to the provision of more cold rooms for smallholder farmers and the reduction of postharvest food losses.
Small-scale solutions to the problem of food losses can go only so far; rural electrification is critical to providing cold storage at scale. Kirubi and colleagues [46] found that before the arrival of electricity in local communities, preserving perishable produce posed a major challenge to farmers. Electrification enabled cold storage and reduced food losses. Nevertheless, there was also the challenge of education to demonstrate the advantages and benefits of cold storage to smallholder farmers, who were accustomed to traditional ways of preserving produce.

3.5. Governance

The success of large-scale investments in infrastructure and other areas will depend to some extent on the quality of governance. This leads to a much-debated question: why do some societies grow while others lag behind, and what does governance have to do with it? One explanation (perhaps tautological) is that important elements of society have wanted growth and focused their efforts on achieving a high rate of growth. East Asian countries such as Singapore, Taiwan, and South Korea were under a strategic, indeed existential imperative to grow [47]. Malaysia made a largely correct assumption that it could grow out of its sectarian tensions. For such a process to work, the elite had to get richer and also make deals of various types with various interests. Such deals, beyond creating an environment that enabled the entry of new players, preserved stability within the system. At the same time, the system was open enough to new players. The success of East Asia can be explained as much by this dynamic between the government and the private sector as by investments in infrastructure and social services.
Pritchett, Sen, and Werker [48] argue that many instances of sustained growth starting from a low level of development included a move from “disordered deals” to “closed, ordered deals” in which a small subset of actors could make large, profitable investments. But ordered deals may be more complex in the African context, where deals can be productive but also exploitative or stifling, and may result in stagnation as well. Closed deals in Algeria and Egypt, for example, have resulted in a stagnant economy and the persistence of crony capitalism. Algerian policy over the long haul has not been antigrowth; the country has had perhaps the world’s highest investment rate over the course of various resource booms. But large-scale state-driven investments have been directed to the resource sectors, not into anything that opened the economy to new entry.
The particular issue in many African countries is the disjuncture between the political elite and the business elite. Countries like Indonesia were fractured but had a long history of production and trade as well as a substantial modern domestic business class—large-scale, with international connections—that was not too exclusionary. In most African countries, there are not such classes among the autochthonous population. The result has been an extended period of tension between the business sector and the government that has hampered reinvestment and spurred capital flight. Closed deals have typically been designed to enable the political elite and their supporters to share in benefits that cannot be generated via market mechanisms.
Almost no African country has really faced—in the sense of expressed and acted on—an existential threat due to slow growth. But this may be changing. Rwanda is a country where the government, facing an impossible ethnic divide, has pushed for growth in order to create a threat of loss for future attempts to disrupt society. South Africa needs such a growth compact badly, but is not yet able to surmount distributional tensions with ethnic overtones. The government of Ghana has become focused on growth, as have the governments of Kenya, Senegal, and Tanzania. A young electorate, powered by mobile phones, is demanding better governance everywhere. On the other hand, population pressures both in the Sahel and elsewhere threaten some of the gains made thus far, and many governments have yet to deliver broad-based economic growth.
In the case of Ethiopia, Meles Zenawi served as the second prime minister of Ethiopia from 1995 to his death in 2012. After leading the Ethiopian People’s Revolutionary Democratic Front to victory in the country’s civil war, Meles was not particularly pro–financial markets or pro-business, but was very focused on economic growth and the development of the agricultural sector. Meles was resentful of Ethiopia’s image as a basket case and set out to change that. His base was largely rural, and he himself, being from a minority ethnic group, was in charge of a large coalition. Meles kept urban food prices low and invested in agriculture. His party had an agrarian base and focused on rural development, with economic growth as a dominant narrative. For Meles, economic growth was central to the survival of a country without oil or natural resources.
His successor Abiy Ahmed, from the Oromo ethnic group, has focused more on industrialization but is faced with an internal migration crisis and rising ethnic tensions. The Ethiopian army has perpetrated various human rights abuses in Tigray, reportedly having killed thousands of people [49]. At the same time, Abiy has been using the construction of the Grand Ethiopian Renaissance Dam (GERD) to generate nationalism [50]. Donations for the dam have been made by ordinary Ethiopians, and the ruling coalition sees GERD as central to its imperative of shared growth.
Despite the emphasis on economic growth, successive governments in Ethiopia have not made it easy for the private sector to operate within the country. Members of Ethiopia’s business community have often spent time in jail. Except for Kenya, most African countries have placed limits on the private sector or even at times destroyed it. In Nigeria, closed deals have created a small group of billionaires but have not benefited the broader population. Zambia has moved to a socialist model of growth. Broadly speaking, most countries have not created opportunities for the indigenous (autochthonous) private sector.
How have governments in Africa stayed in power without delivering economic growth? Some have enabled enclave economies (in mining, for example) that have generated revenues and created stable political coalitions. Others have turned to the donor community for budget support, which in turn has diminished the incentive to create a functioning state [51]. International agencies have focused on infrastructure, health, and education, but for the most part have not enabled the building of coalitions for effective management. Most political parties remain focused on rent extraction and patronage. In other words, the benefits of rent taking vastly exceed the benefits of economic growth. Members of the ruling elite have distributed rents and state revenues to their supporters (usually from the same ethnic group) in order to maintain power.
The challenge for most African countries has been to create a positive feedback loop from being in power to delivering public goods. Using case studies from Guinea, Ethiopia and Egypt, Borowski shows that when the growing demand for energy is aligned with the motives of the decisions makers who want to maintain power, new investments do occur [52]. These new investments must focus on sustainability in order to provide more than one generation of Africans with more food and energy [53].
There are some signs of change. Africa is rapidly becoming less of a sparsely populated continent. This context, where rents are to be split across more and more people, is bound to increase the stress on states to facilitate growth. Moreover, some of these rents are diminishing, for example through the widespread erosion of soil fertility. Interests related to business, investment, and trade are becoming more widespread and generating more cross-country linkages. On the other hand, there is also greater potential for failed states, notably in the Sahel, as well as political and distributional stresses in South Africa that will be difficult to overcome.
The delivery of public services is improving although problems remain, especially in the electricity sector. Africa’s central bankers are world-class, having guided the continent through the 2008 financial crisis in an exemplary manner. Africa’s parks and tourism resources have become better managed, and the number of people visiting the continent has steadily increased. Members of the African diaspora have brought resources and new business practices to their home countries, and greater regional coordination has resulted in the African Continental Free Trade Area and visa-free travel across the continent for most citizens of African countries.
Africa’s governance problems are complex. There are many questions: what are the drivers of stability and of a well-functioning state? What drives the creation and sustenance of a broad-based private sector? One thing to consider is where the interests of the political class and those of the business class are aligned. For example, power pools across multiple countries, such as the West Africa Power Pool, have worked well because the different players (drawn from the political and business classes) that are locked into the arrangement stand to lose substantial revenues and/or political power from a breakdown.

4. Conclusions: Economic Growth and Africa’s Carbon Footprint

This paper presents the argument that the priority for most African countries should be economic growth, first in agriculture and then in industry and services. Many of the interventions described here cannot be powered by renewables, at least not for the next several years. To address the gaps described in this paper, African countries will need access to a wide range of fuels, including oil and natural gas. Access to energy is critical; worries of an increased carbon footprint generated by economic growth are vastly superseded by worries that growth may not happen at all.
The interventions described in this paper call for a large expansion in access to energy in Africa. While difficult to quantify, significant investments in fertilizer, irrigation, roads, and cold storage will demand that the capacity to generate and distribute energy in various forms be vastly expanded from current (very low) levels. Electricity consumption is very low on the continent; per capita consumption of electricity in Ethiopia in one year is the same as the per capita consumption of electricity in the United States in four days. Figure 18 shows primary energy consumption for all of Africa compared with that of selected countries and the world. Primary energy includes fossil fuels (coal, oil, gas) as well as nuclear energy and modern renewables. Africa’s consumption has barely increased in half a century and remains at 5520 terawatt-hours (TWh), about half the level of India (which has about as many people as Africa). Africa’s consumption is 15 percent of the energy consumption of China, which clocks in at 39,361 TWh per year with roughly the same population as Africa, and about 17 percent of that of North America, which has less than half the African population. Most of the increase in Africa’s consumption is in South Africa. Figure 19 shows that even Bangladesh, which is poorer than Kenya or Ghana, is consuming more energy than some African countries.
Africa accounts for less than one percent of cumulative global carbon emissions. Some investments that are in the pipeline, such as the production of ammonia for fertilizer, have a larger carbon footprint than others; none of them will likely place Africa anywhere near the carbon footprint of rich countries in the near to medium term. Many countries will take a predominantly low-carbon path as they undergo structural transformation. Whatever the choice, the supply of energy must not be limited by international donors or other actors to renewable energy sources only.
Economic growth in Africa may lead to a reduction in emissions. A reduction in the use of biomass as households shift to cleaner fuels will be beneficial in terms of health, well-being, and the environment. Better roads and better sources of fuel will lead to lower levels of pollution and carbon emissions. Available empirical evidence shows that as countries become richer, they become less vulnerable to climate-related disasters. People with better access to education, health care, and housing cope better with heat waves and typhoons. Investments in energy to increase productivity and economic growth will also make African countries more resilient to climate change in the long term.

Funding

This research received no external funding.

Acknowledgments

I am grateful to Peter Timmer for several conversations on development and structural transformation. I would also like to thank Katie Auth, Murefu Barasa, Dan Blaustein-Rejto, Grieve Chelwa, Judd Devermont, Alan Gelb, Charles Kenny, Gyude Moore, Ted Nordhaus, Lant Pritchett, Alex Trembath, and Saloni Shah for comments and suggestions, and Kehinde Abiodun and Mallika Snyder for excellent research assistance. I am solely responsible for any errors.

Conflicts of Interest

The authors declare no conflict of interest.

References

  1. Timmer, C.P. The Agricultural Transformation. In Handbook of Development Economics; Chenery, H., Srinivasan, T.N., Eds.; Elsevier: Amsterdam, The Netherlands, 1988; Volume 1, pp. 275–331. [Google Scholar]
  2. Timmer, C.P. Agriculture and Economic Development Revisited. Agric. Syst. 1992, 40, 21–58. [Google Scholar] [CrossRef]
  3. Fox, L.; Senbet, L.W.; Simbanegavi, W. Youth Employment in Sub-Saharan Africa: Challenges, Constraints and Opportunities. J. Afr. Econ. 2016, 25, i3–i15. [Google Scholar] [CrossRef]
  4. McMillan, M.S.; Rodrik, D. Globalization, Structural Change and Productivity Growth. In Making Globalization Socially Sustainable; Bachetta, M., Jansen, M., Eds.; International Labour Organization: Geneva, Switzerland, 2011. [Google Scholar]
  5. McMillan, M. The Changing Structure of Africa’s Economies; Background Paper for The African Economic Outlook; African Development Bank: Abidjan, Cote d’Ivoire, 2013. [Google Scholar]
  6. Gelb, A.; Diofasi, A. What Determines Purchasing-Power-Parity Exchange Rates? Rev. d’Économie Développement 2016, 24, 93–141. [Google Scholar] [CrossRef]
  7. African Center for Economic Transformation. Agriculture Powering Africa’s Economic Transformation. African Center for Economic Transformation, 2017. Available online: https://acetforafrica.org/acet/wp-content/uploads/publications/2017/10/ATR17-full-report.pdf (accessed on 15 June 2021).
  8. Westland, T. Food Prices and the Little Divergence. Available online: https://tomwestland.com/2021/06/08/food-prices-and-the-little-divergence/ (accessed on 8 June 2021).
  9. International Comparison Program. Available online: https://www.worldbank.org/en/programs/icp (accessed on 1 May 2021).
  10. Gelb, A.; Ramachandran, V.; Meyer, C.J.; Wadhwa, D.; Navis, K. Can Sub-Saharan Africa Be a Manufacturing Destination? Labor Costs, Price Levels, and the Role of Industrial Policy. J. Ind. Compet. Trade 2020, 20, 335–357. Available online: https://link.springer.com/article/10.1007/s10842-019-00331-2 (accessed on 8 June 2021). [CrossRef]
  11. Mudahar, M.S.; Hignett, T.P. Energy Efficiency in Nitrogen Fertilizer Production. Energy Agric. 1985, 4, 159–177. [Google Scholar] [CrossRef]
  12. Baltrusaitis, J. Sustainable Ammonia Production. ACS Sustain. Chem. Eng. 2017, 5, 9527. [Google Scholar] [CrossRef] [Green Version]
  13. Quader, A.K.M.A. Natural Gas and the Fertilizer Industry. Energy Sustain. Dev. 2003, 7, 40–48. [Google Scholar] [CrossRef]
  14. Namara, R.E.; Hope, L.; Sarpong, E.O.; De Fraiture, C.; Owusu, D. Adoption Patterns and Constraints Pertaining to Small-Scale Water Lifting Technologies in Ghana. Agric. Water Manag. 2014, 131, 194–203. [Google Scholar] [CrossRef]
  15. Wichelns, D. Investing in Small, Private Irrigation to Increase Production and Enhance Livelihoods. Agric. Water Manag. 2014, 131, 163–166. [Google Scholar] [CrossRef]
  16. Xie, H.; You, L.; Wielgosz, B.; Ringler, C. Estimating the Potential for Expanding Smallholder Irrigation in Sub-Saharan Africa. Agric. Water Manag. 2014, 131, 183–193. [Google Scholar] [CrossRef]
  17. Bjornlund, H.; van Rooyen, A.; Stirzaker, R. Profitability and Productivity Barriers and Opportunities in Small-Scale Irrigation Schemes. Int. J. Water Resour. Dev. 2017, 33, 690–704. [Google Scholar] [CrossRef] [Green Version]
  18. Pittock, J.; Bjornlund, H.; van Rooyen, A. Transforming Failing Smallholder Irrigation Schemes in Africa: A Theory of Change. Int. J. Water Resour. Dev. 2020, 36, S1–S19. [Google Scholar] [CrossRef]
  19. Biswas, A.K. Irrigation in Africa. Land Use Policy 1986, 3, 269–285. [Google Scholar] [CrossRef]
  20. You, L.; Ringler, C.; Wood-Sichra, U.; Robertson, R.; Wood, S.; Zhu, T.; Nelson, G.; Guo, Z.; Sun, Y. What is the irrigation potential for Africa? A Comb. Biophys. Socioecon. Approach Food Policy 2011, 36, 770–782. [Google Scholar] [CrossRef] [Green Version]
  21. Otsuka, K.; Muraoka, R. A Green Revolution for Sub-Saharan Africa: Past Failures and Prospects. J. Afr. Econ. 2017, 26, i73–i98. [Google Scholar] [CrossRef]
  22. Svendsen, M.; Ewing, M.; Msangi, S. Measuring Irrigation Performance in Africa; IFPRI Discussion Paper 00894. Int. Food Policy Res. Inst. 2009. Available online: https://www.researchgate.net/publication/46442018_Measuring_Irrigation_Performance_in_Africa (accessed on 15 September 2021).
  23. Merrey, D. Large Scale Irrigation Investments in Sub-Saharan Africa: Is Big Beautiful? Water Alternatives Forum. 15 October 2020. Available online: www.water-alternatives.org/index.php/blog/african-irrigation (accessed on 12 December 2020).
  24. Kikuchi, M.; Mano, Y.; Njeru, T.; Merrey, D.; Otsuka, K. Economic Viability of Large-scale Irrigation Construction in 21st Century Sub-Saharan Africa: Centering around an Estimation of the Construction Costs of the Mwea Irrigation Scheme in Kenya; JICA-RI Working Paper No. 200; Japan International Cooperation Agency: Tokyo, Japan, 2020. [Google Scholar]
  25. Burney, J.A.; Naylor, R.L.; Postel, S.L. The Case for Distributed Irrigation as a Development Priority in Sub-Saharan Africa. Proc. Natl. Acad. Sci. USA 2013, 110, 12513–12517. [Google Scholar] [CrossRef] [Green Version]
  26. Lighting Africa. The Market Opportunity for Productive Use Leveraging Solar Energy (PULSE) in Sub-Saharan Africa. World Bank Group, 2019. Available online: https://www.lightingglobal.org/wp-content/uploads/2019/09/PULSE-Report.pdf (accessed on 8 June 2021).
  27. Burney, J.; Woltering, L.; Burke, M.; Naylor, R.; Pasternak, D. Solar-Powered Drip Irrigation Enhances Food Security in the Sudano-Sahel. Proc. Natl. Acad. Sci. USA 2010, 107, 1848–1853. [Google Scholar] [CrossRef] [PubMed] [Green Version]
  28. Williams, T. We Can Expand Large-Scale Irrigation in Africa—Carefully. CGIAR Research Program on Water, Land and Ecosystems: Thrive, 2019. Available online: https://wle.cgiar.org/thrive/2019/12/18/we-can-expand-large-scale-irrigation-africa-carefully (accessed on 8 June 2021).
  29. Higginbottom, T.P.; Adhikari, R.; Dimova, R.; Redicker, S.; Foster, T. Performance of Large-Scale Irrigation Projects in Sub-Saharan Africa. Nat. Sustain. 2021, 4, 501–508. [Google Scholar] [CrossRef]
  30. Andrews, M.; Pritchett, L.; Woolcock, M. Building State Capability; Oxford University Press: Oxford, UK, 2017. [Google Scholar]
  31. Gwilliam, K.; Foster, V.; Archondo-Callao, R.; Briceno-Garmendia, C.; Nogales, A.; Sethi, K. Africa Infrastructure Country Diagnostic: Roads in Sub-Saharan Africa (English); Summary of Background Paper No. 14; World Bank Group: Washington, DC, USA, 2008; Available online: http://documents.worldbank.org/curated/en/938171468194345853/Africa-infrastructure-country-diagnostic-roads-in-Sub-Saharan-Africa (accessed on 8 June 2021).
  32. Holtz, L.; Heitzig, C. Figures of the Week: Africa’s Spatial Distribution of Road Infrastructure. Brookings, 2021. Available online: https://www.brookings.edu/blog/africa-in-focus/2021/03/17/figures-of-the-week-africas-spatial-distribution-of-road-infrastructure/ (accessed on 8 June 2021).
  33. What Are the Materials Used in Road Construction? Multico Prime Power Inc., 19 September 2019. Available online: https://multico.com.ph/blog/materials-road-construction/ (accessed on 8 June 2021).
  34. U.S. Energy Information Administration. Available online: https://www.eia.gov/petroleum/ (accessed on 12 June 2021).
  35. Zapata, P.; Gambatese, J.A. Energy Consumption of Asphalt and Reinforced Concrete Pavement Materials and Construction. J. Infrastruct. Syst. 2005, 11, 9–20. [Google Scholar] [CrossRef]
  36. Energy and Road Construction—What’s the Mileage of Roadway? Pavement Interactive. Available online: https://pavementinteractive.org/energy-and-road-construction-whats-the-mileage-of-roadway/ (accessed on 5 May 2021).
  37. Grolleeaud, M. Post-harvest Losses: Discovering the Full Story—Overview of the Phenomenon of Losses during the Post-harvest System. FAO, Agro Industries and Post-harvest Management Service, 2002. Available online: https://agris.fao.org/agris-search/search.do?recordID=XF2016055548 (accessed on 20 December 2020).
  38. Parfitt, J.; Barthel, M.; MacNaughton, S. Food Waste within Food Supply Chains: Quantification and Potential for Change to 2050. Philos. Trans. R. Soc. B Biol. Sci. 2010, 365, 3065–3081. [Google Scholar] [CrossRef] [PubMed] [Green Version]
  39. Kitinoja, L. Use of Cold Chains for Reducing Food Losses in Developing Countries. PEF White Paper 13-03. Postharvest Education Foundation, 2013. Available online: http://www.postharvest.org/Cold_chains_PEF_White_Paper_13_03.pdf (accessed on 15 January 2021).
  40. Lipinski, B.; Hanson, C.; Lomax, J.; Kitinoja, L.; Waite, R.; Searchinger, T. Reducing Food Loss and Waste; Creating a Sustainable Food Future 2. World Resource Institute, 2016. Available online: https://pdf.wri.org/reducing_food_loss_and_waste.pdf (accessed on 8 June 2021).
  41. FAO (Food and Agriculture Organization of the United Nations). Available online: http://www.fao.org/food-loss-and-food-waste/flw-data (accessed on 25 July 2021).
  42. Karithi, E.M. Evaluation of the Efficacy of CoolbotTM Cold Storage Technology to Preserve Quality and Extend Shelf Life of Mango Fruits. Master’s Thesis, University of Kenya, Nairobi, Kenya, 2016. [Google Scholar]
  43. Ikegwuonu, N.C. ColdHubs: Addressing the Crucial Problem of Food Loss in Nigeria with Solar-Powered Refrigeration. International Food Policy Research Institute, 20 November 2018. Available online: https://www.ifpri.org/blog/coldhubs-addressing-crucial-problem-food-loss-nigeria-solar-powered-refrigiration (accessed on 8 June 2021).
  44. Miller, A.; Becque, R.; Hartley, B.; Uwamaliya, A.; Fleming, P. Chilling Prospects: Providing Sustainable Cooling for All. Sustainable Energy for All, 2018. Available online: https://www.seforall.org/sites/default/files/SEforALL_CoolingForAll-Report.pdf (accessed on 8 June 2021).
  45. International Energy Agency. Access to Electricity. SDG7: Data and Projections. 2020. Available online: https://www.iea.org/reports/sdg7-data-and-projections/access-to-electricity (accessed on 30 June 2021).
  46. Kirubi, C.; Jacobson, A.; Kammen, D.M.; Mills, A. Community-Based Electric Micro-grids Can Contribute to Rural Development: Evidence from Kenya. World Dev. 2009, 37, 1208–1221. [Google Scholar] [CrossRef]
  47. Amsden, A. South Korea and Late Industrialization; Oxford University Press: Oxford, UK, 1989. [Google Scholar]
  48. Pritchett, L.; Sen, K.; Werker, E. Deals and Development: The Political Dynamics of Growth Episodes; Oxford University Press: Oxford, UK, 2017. [Google Scholar]
  49. Walsh, D.; Dahir, A.L. Why Is Ethiopia at War with Itself? New York Times, 29 July 2021. [Google Scholar]
  50. Chen, H.; Swain, A. The Grand Ethiopian Renaissance Dam: Evaluating Its Sustainability Standard and Geopolitical Significance. Energy Dev. Front. 2014, 3, 11–19. [Google Scholar]
  51. Van de Walle, N. African Economies and the Politics of Permanent Crisis, 1979–1999; Political Economy of Institutions and Decisions Series; Cambridge University Press: Cambridge, UK, 2001. [Google Scholar]
  52. Borowski, P. Significance and Directions of Energy Development in African Countries. Energies 2021, 14, 4479. [Google Scholar] [CrossRef]
  53. Borowski, P.; Patuk, I. Environmental, social and economic factors in sustainable development with food, energy and eco-space aspect security. Present Environ. Sustain. Dev. 2021, 15, 153–169. [Google Scholar] [CrossRef]
Figure 1. Number of people employed in agriculture, 1801–2015.
Sustainability 13 10572 g001
Figure 2. Employment in agriculture vs. GDP per capita.
Sustainability 13 10572 g002
Figure 3. Share of employment in agriculture, industry and services, Kenya.
Sustainability 13 10572 g003
Figure 4. Share of employment in agriculture, industry, and services, Bangladesh.
Sustainability 13 10572 g004
Figure 5. Level of urbanization vs. GNP per capita, 1800 to 1980.
Sustainability 13 10572 g005
Figure 6. Urban population vs. GDP per capita.
Sustainability 13 10572 g006
Figure 7. Share of agriculture in GDP vs GNP per capita, 2017.
Sustainability 13 10572 g007
Figure 8. Share of agriculture in GDP vs. GDP per capita, 1801–2010.
Sustainability 13 10572 g008
Figure 9. Cereal yields in Africa and comparator countries. Source: African Center for Economic Transformation [7].
Sustainability 13 10572 g009
Figure 10. Food and non-alcoholic beverage price levels in Sub-Saharan Africa and comparator countries. Source: Author’s calculations, based on data from International Comparison Project [9] and Gelb and Diofasi [6]. Note: SSA = sub-Saharan Africa.
Sustainability 13 10572 g010
Figure 11. Change in cereal production, yield, and land use 1961–2018.
Sustainability 13 10572 g011
Figure 12. World population supported by synthetic nitrogen fertilizers.
Sustainability 13 10572 g012
Figure 13. Nitrogen fertilizer consumption, 1961–2014.
Sustainability 13 10572 g013
Figure 14. Cereal yield vs. fertilizer use, 2017.
Sustainability 13 10572 g014
Figure 15. Change in cereal production, yield, and land use in India, 1961–2018.
Sustainability 13 10572 g015
Figure 16. Share of irrigated agricultural land, 2015.
Sustainability 13 10572 g016
Figure 17. Gasoline prices at pump. Source: Gelb and Diofasi [6].
Sustainability 13 10572 g017
Figure 18. Primary energy consumption in Africa vs. selected regions.
Sustainability 13 10572 g018
Figure 19. Primary energy consumption in African countries vs. selected comparators.
Sustainability 13 10572 g019
Table 1. Selected irrigation indicators for Africa (percentages).
RegionShare of Cultivated Area Equipped for IrrigationAgricultural Water Withdrawal as Share of Total Renewable Water ResourcesDam Capacity as Share of Total Available Surface WaterGroundwater Pumped as Share of Total Renewable GroundwaterValue of Irrigated Output as Share of the Total Value of Agricultural Output
Northern28.1218.6203.8306.786.2
Sudano-Sahel6.921.89.738.158.3
Eastern2.64.95.53.15
Gulf of Guinea1.51.247.106.3
Central0.70.11.707.3
Southern4.26.29917.86.6
Indian Ocean Is.30.44.20.18.70
SSA Average3.51.311.217.524.5
Africa Average5.83.314.672.937.7
World Average17.75.27.6n/an/a
Source: Svendsen, Ewing, and Msangi [22]. Note: SSA = sub-Saharan Africa; n/a = not available.
Publisher’s Note: MDPI stays neutral with regard to jurisdictional claims in published maps and institutional affiliations.

