
To Act or Not to Act: Are Natural Landscapes a Key Force in the Resilience of Historic Urban Landscapes?


Abstract
:1. Introduction
2. Materials and Methods
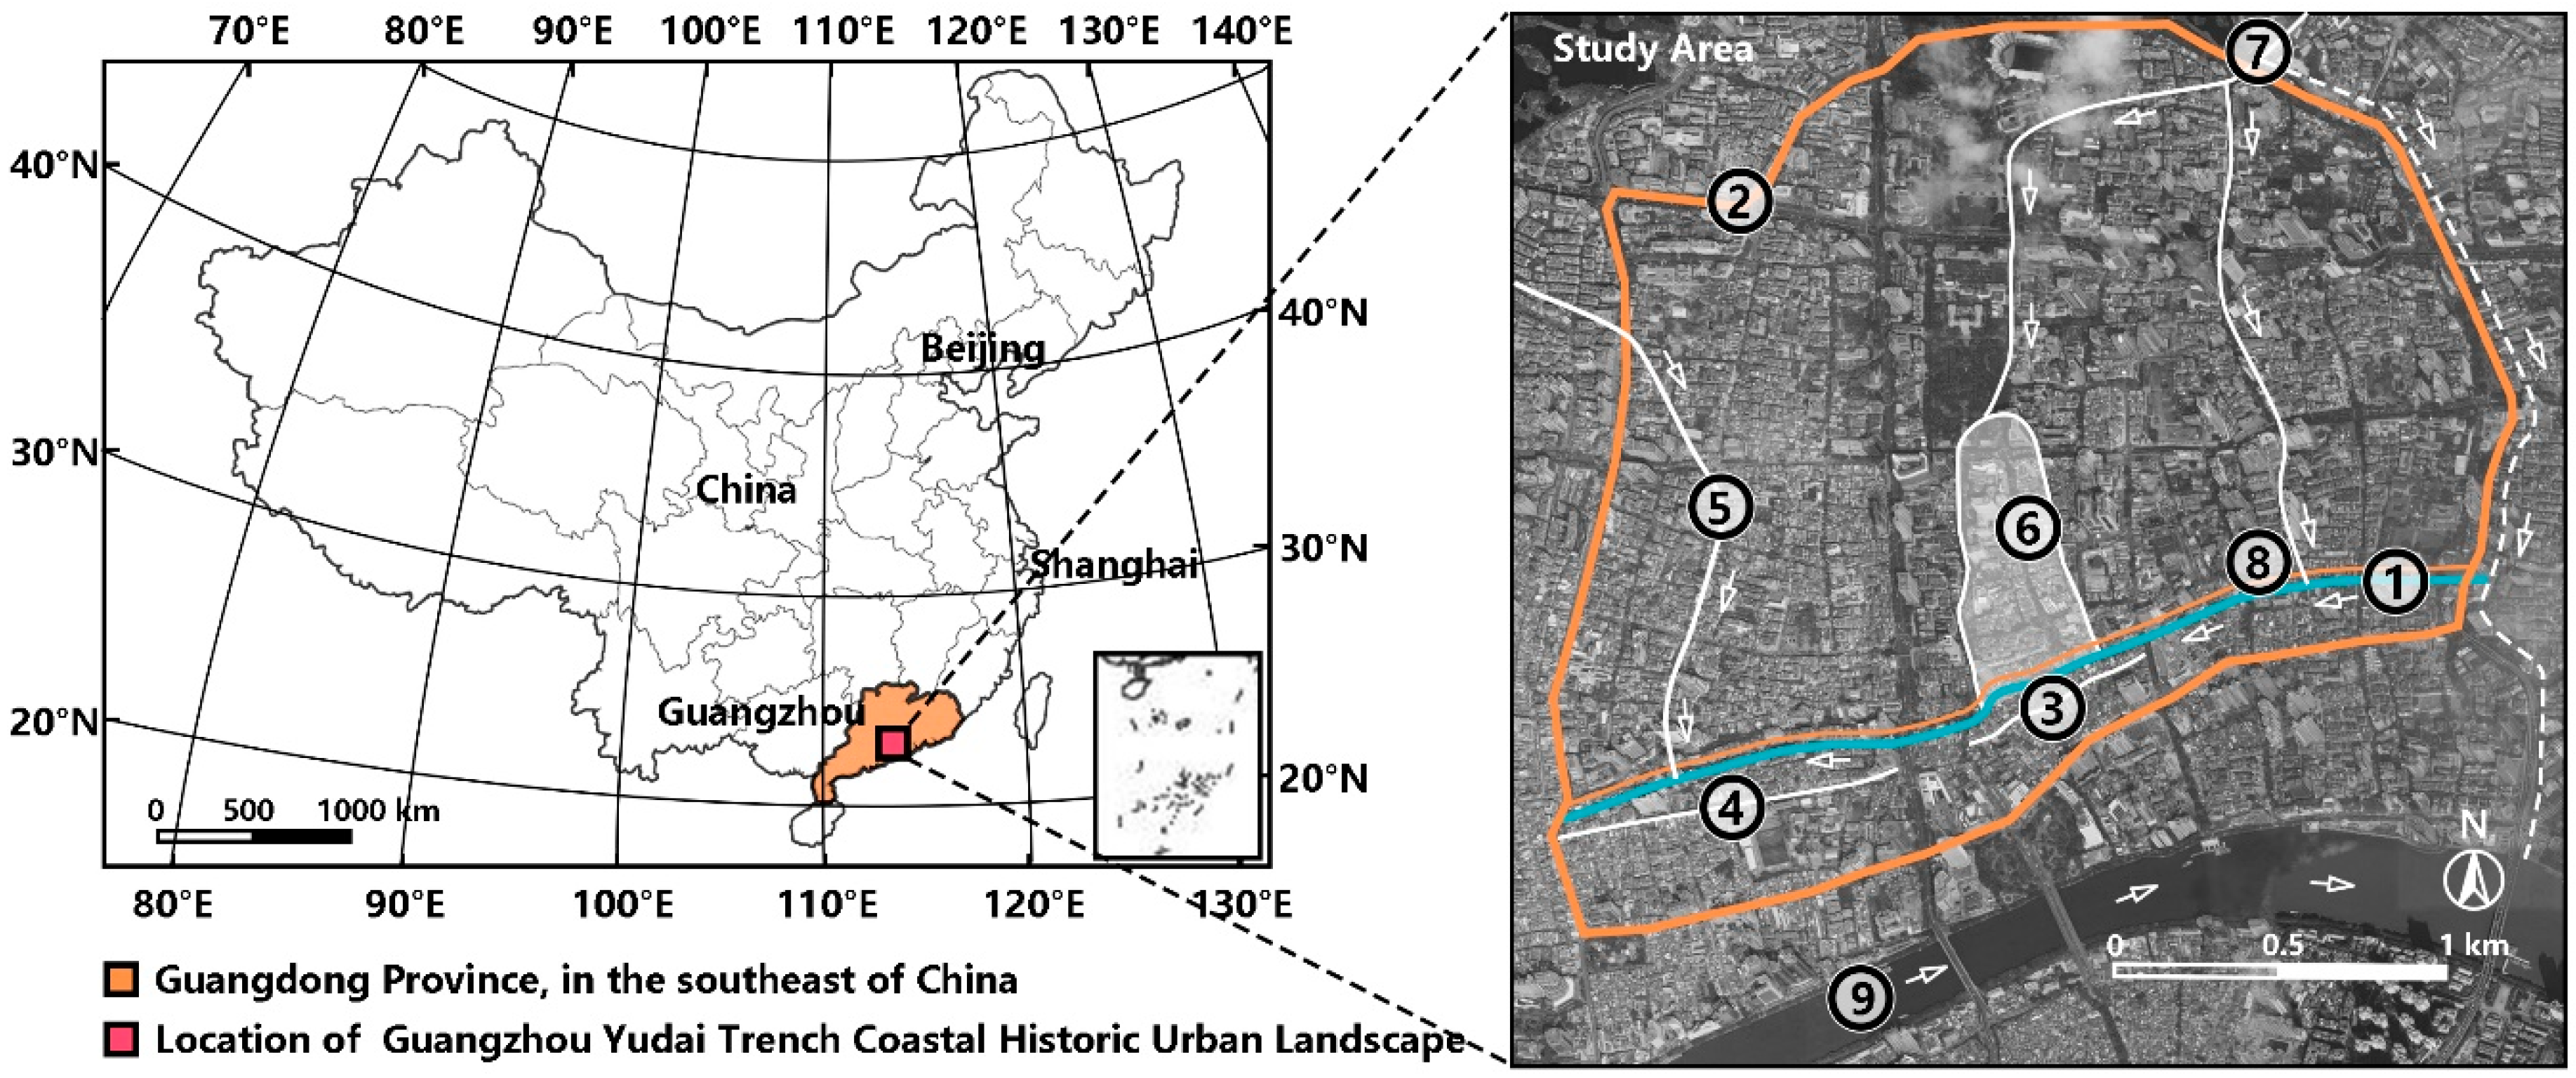
2.1. Study Area
2.2. Methodology
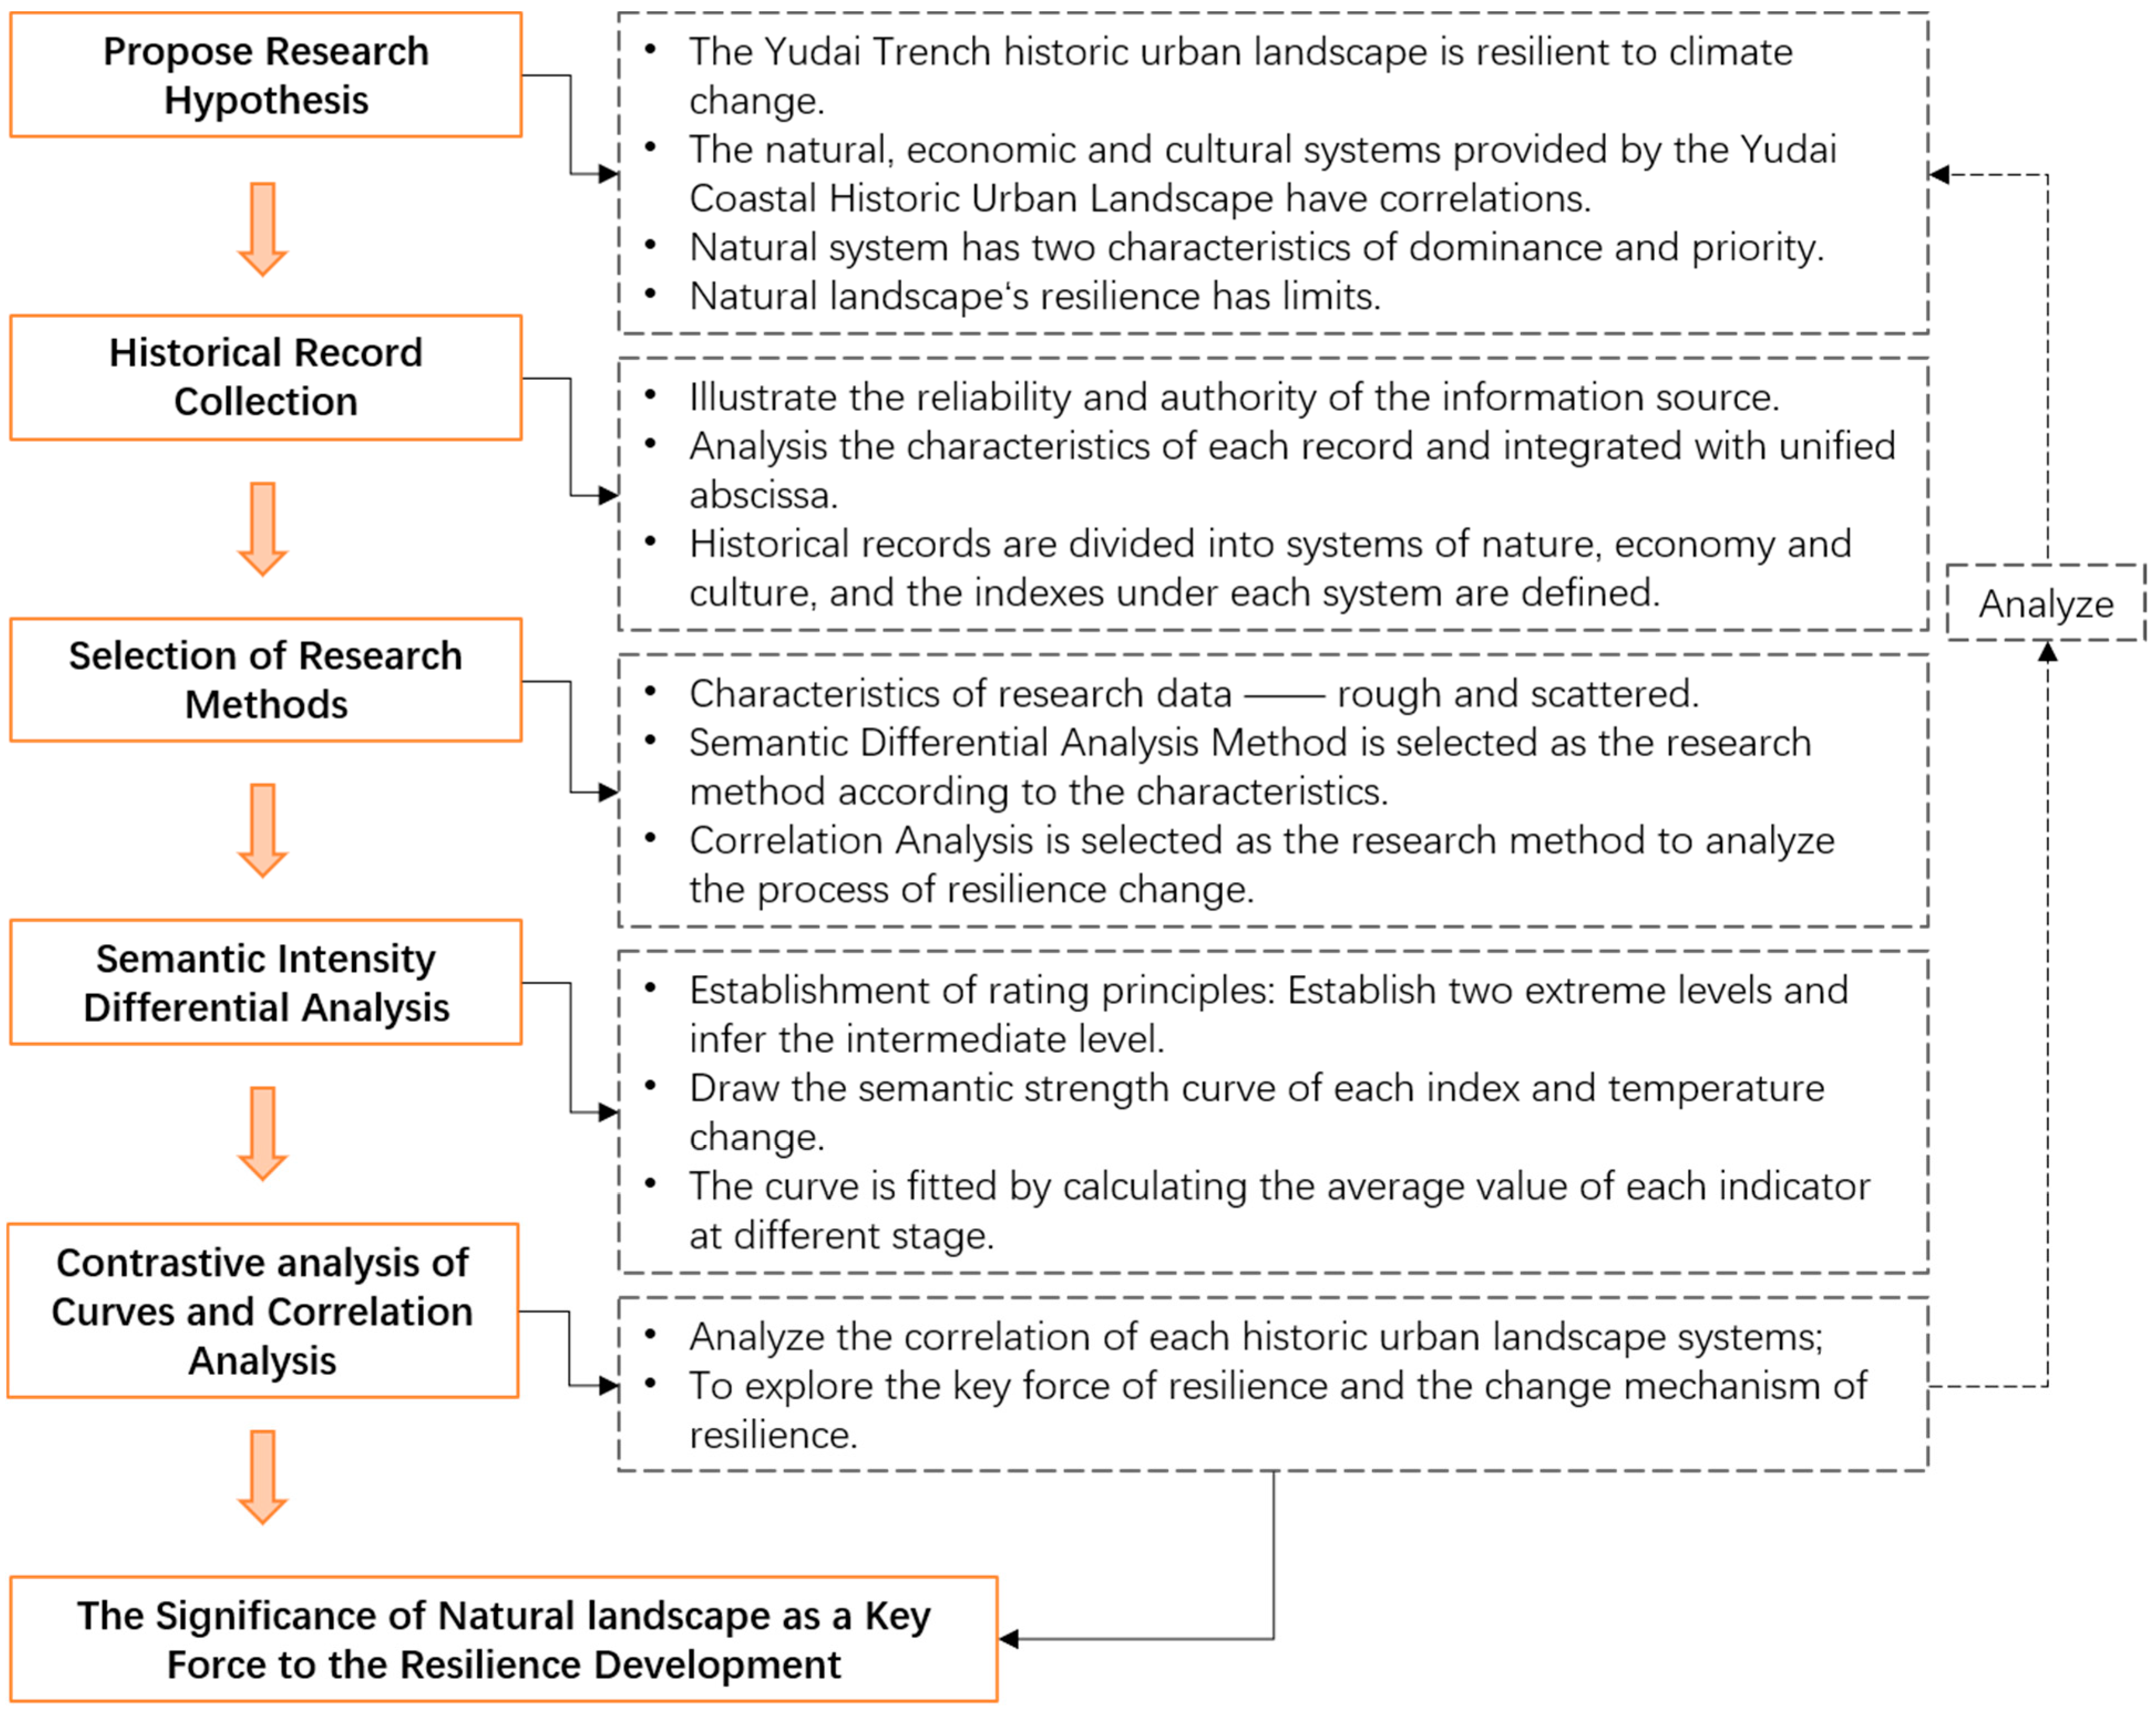
2.2.1. Research Framework
2.2.2. Characteristic Index of the Yudai Trench Historic Urban Landscape
2.2.3. Semantic Differential Analysis and Semantic Intensity Rating
2.2.4. Correlation Analysis of Climate Change and Natural, Economic, and Cultural Systems
2.3. Materials and Sources
- (1)
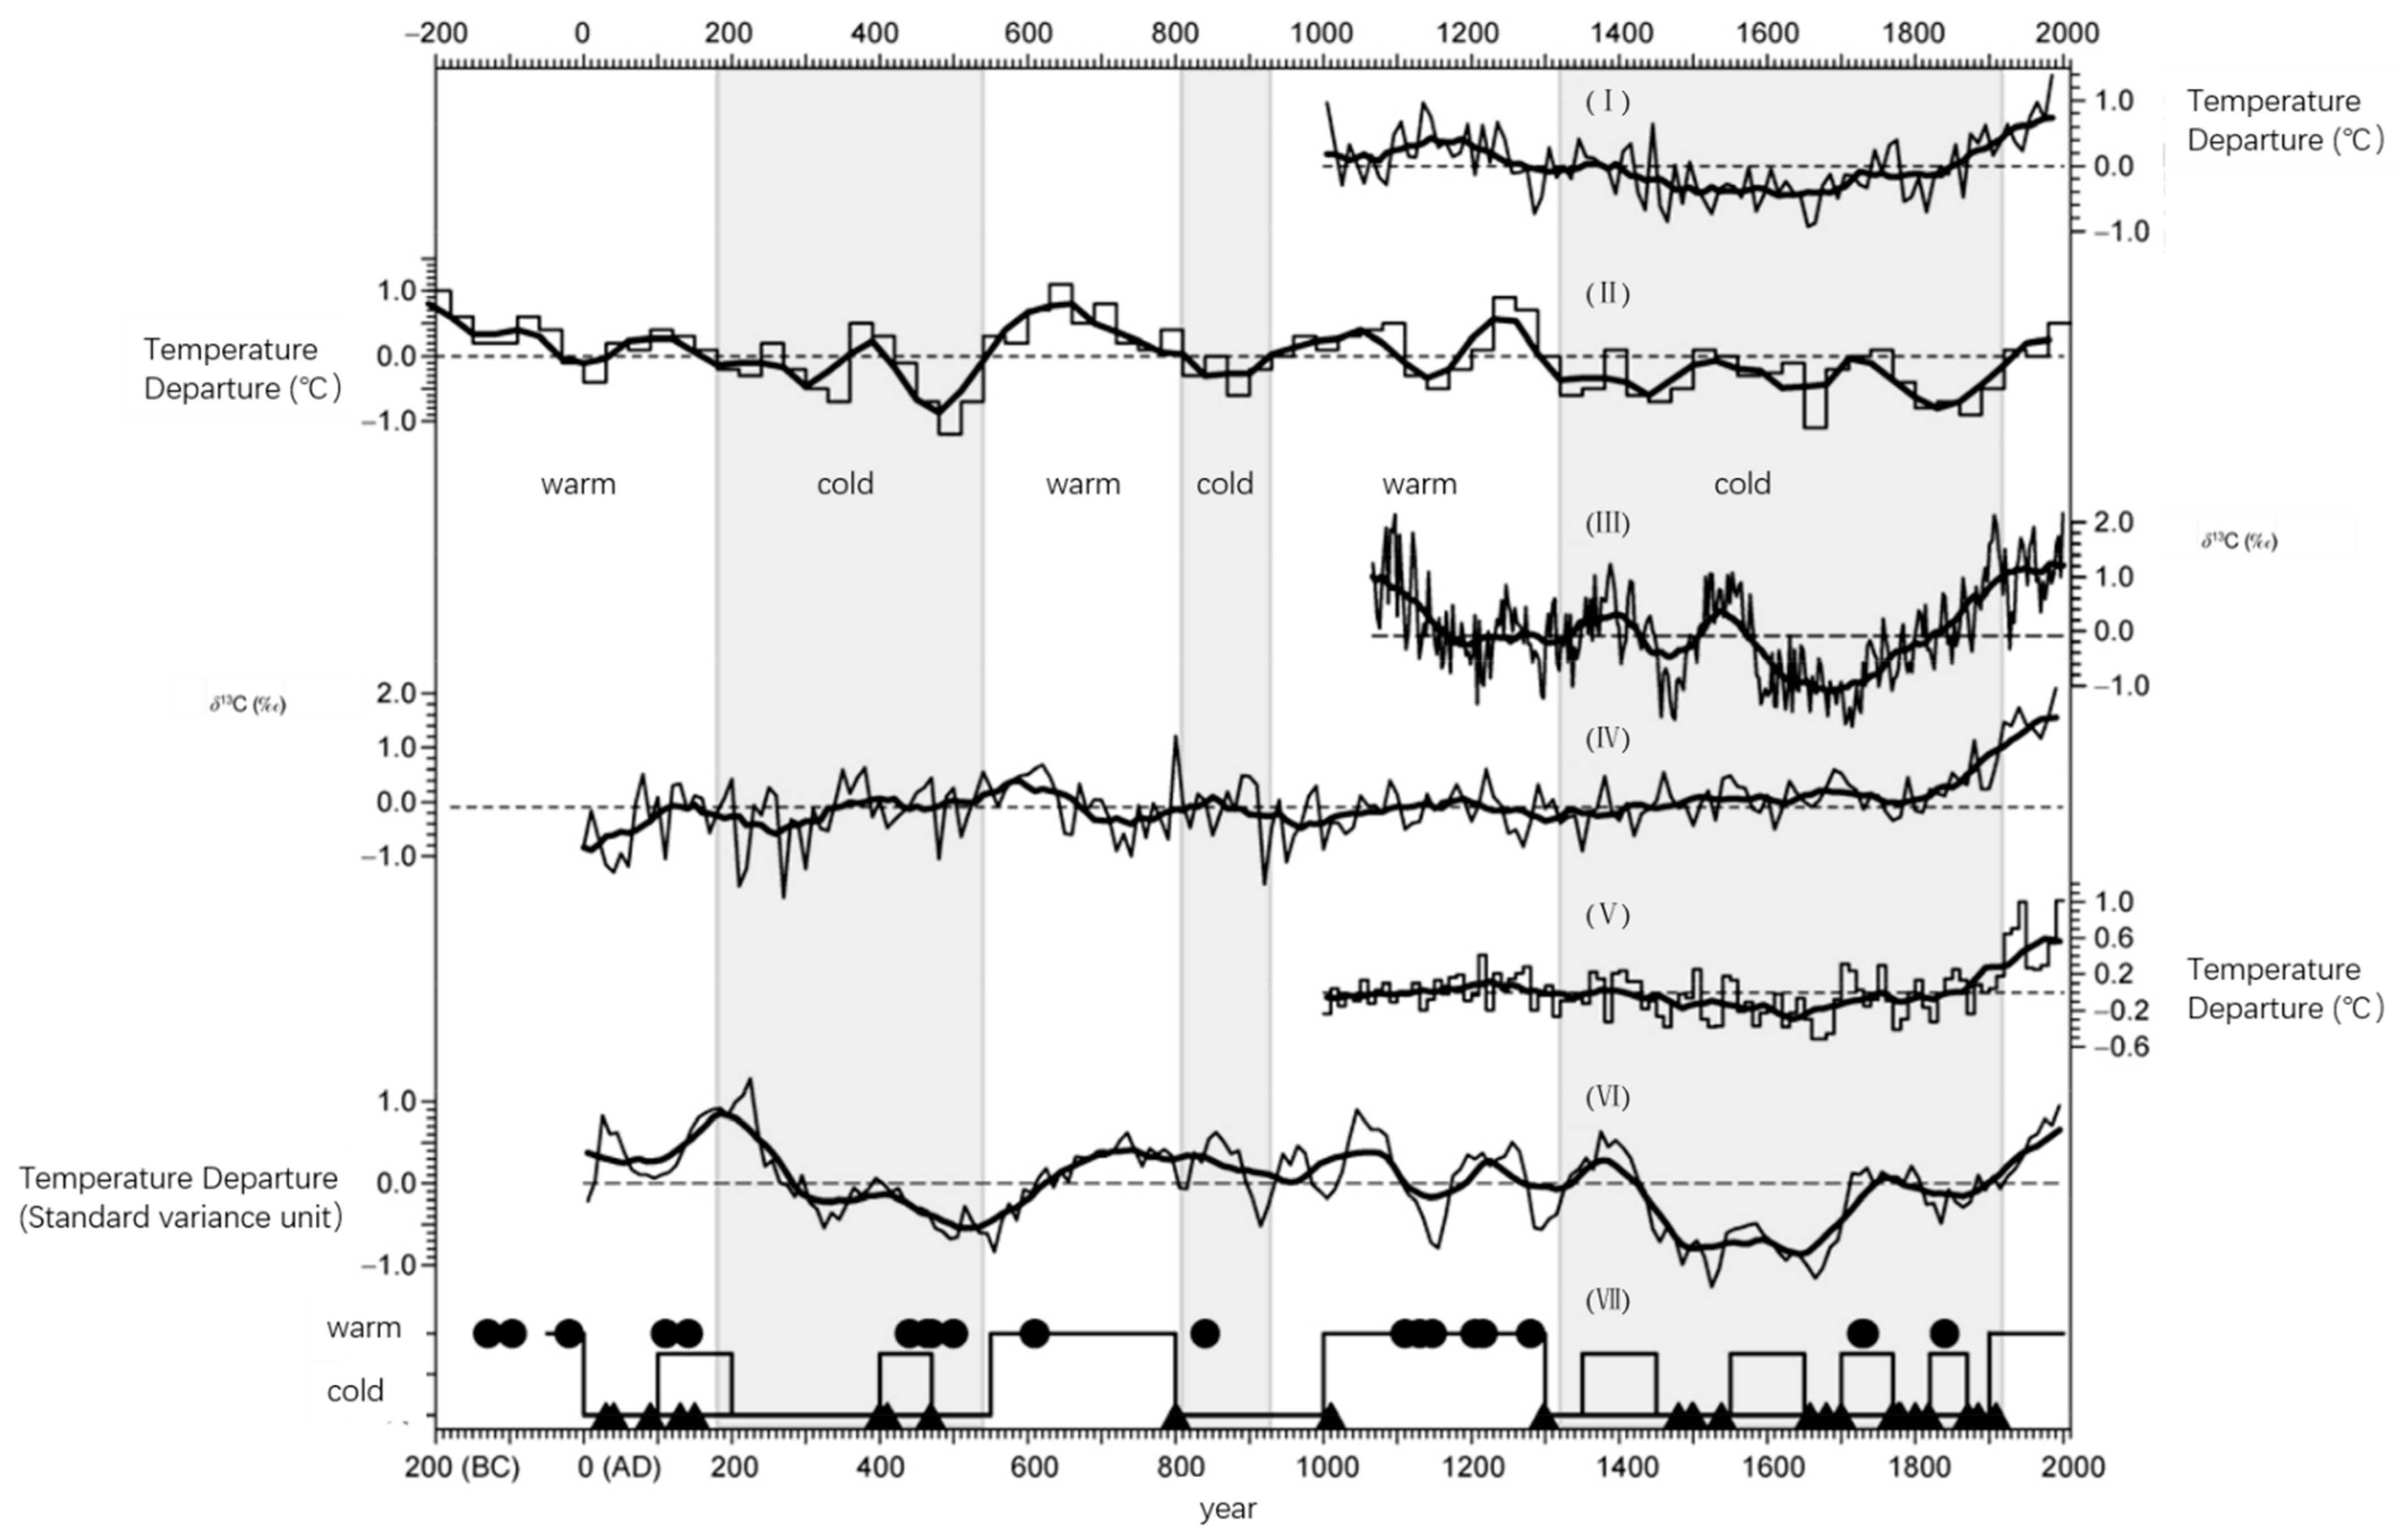
- Climate change data
- (2)
- Historical Records of Yudai Trench historic urban landscape
3. Results
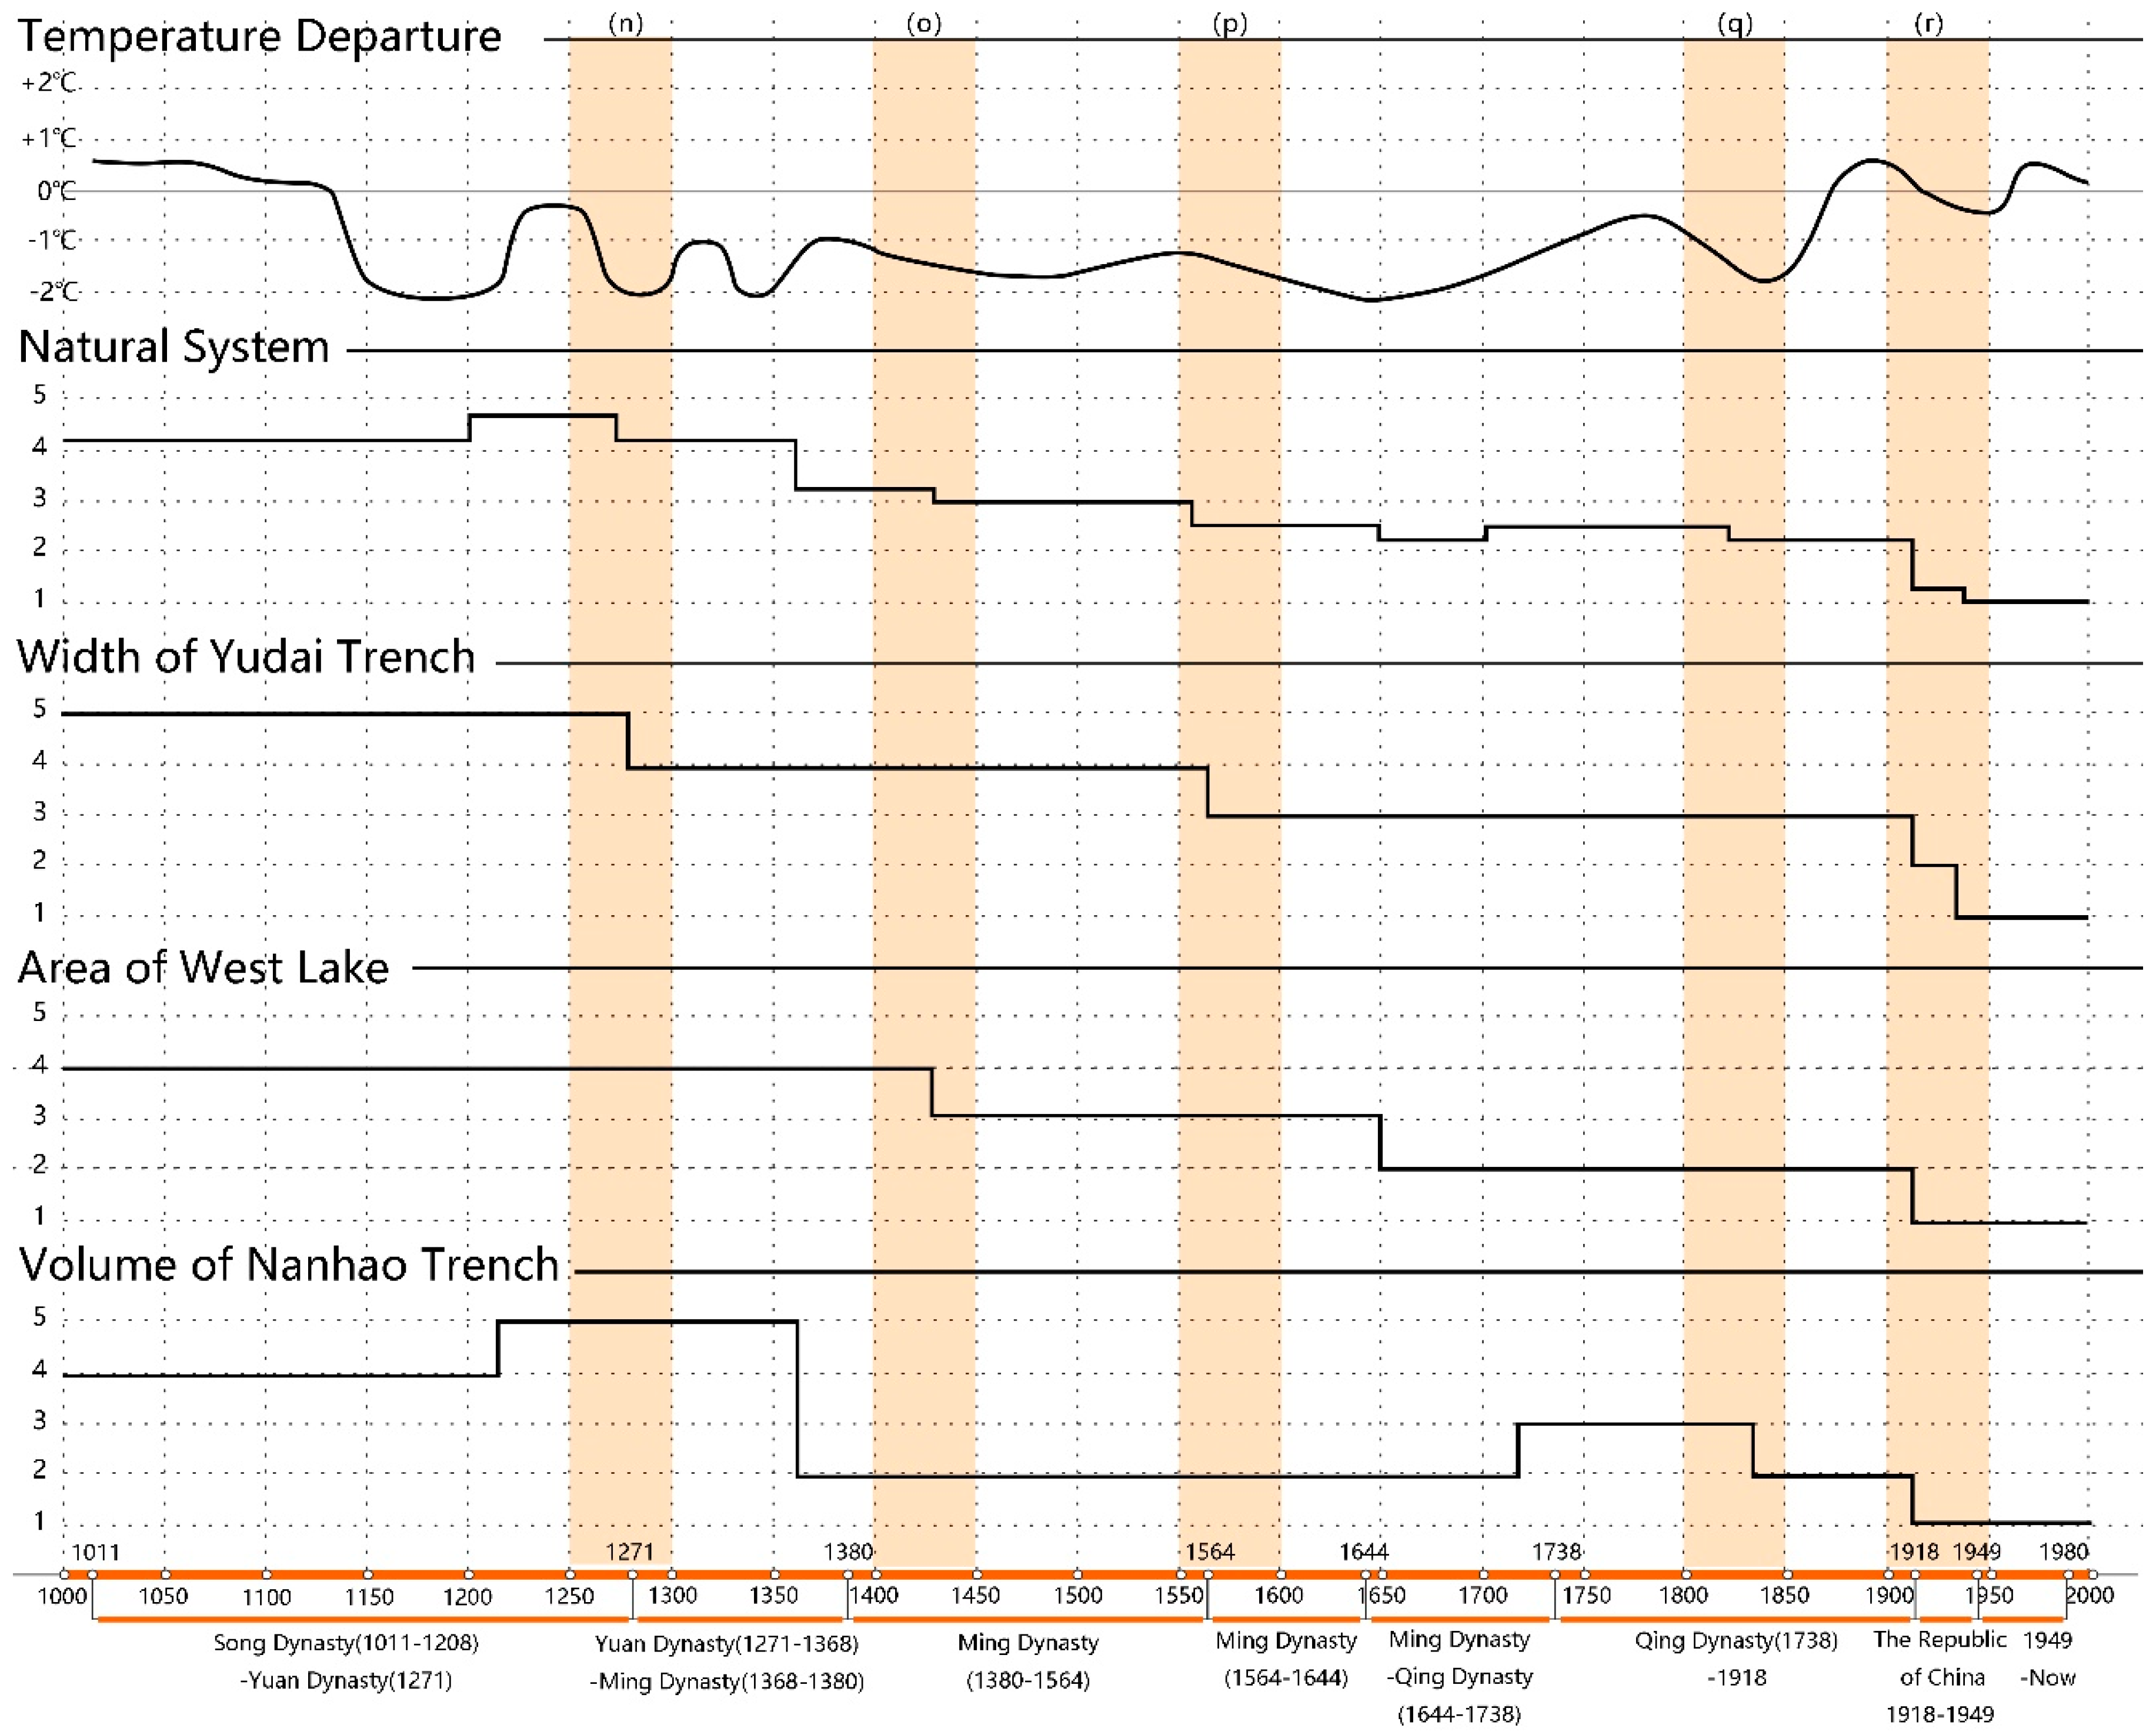
3.1. Yudai Trench Historic Urban Landscape Resisting Climate Change with Resilience
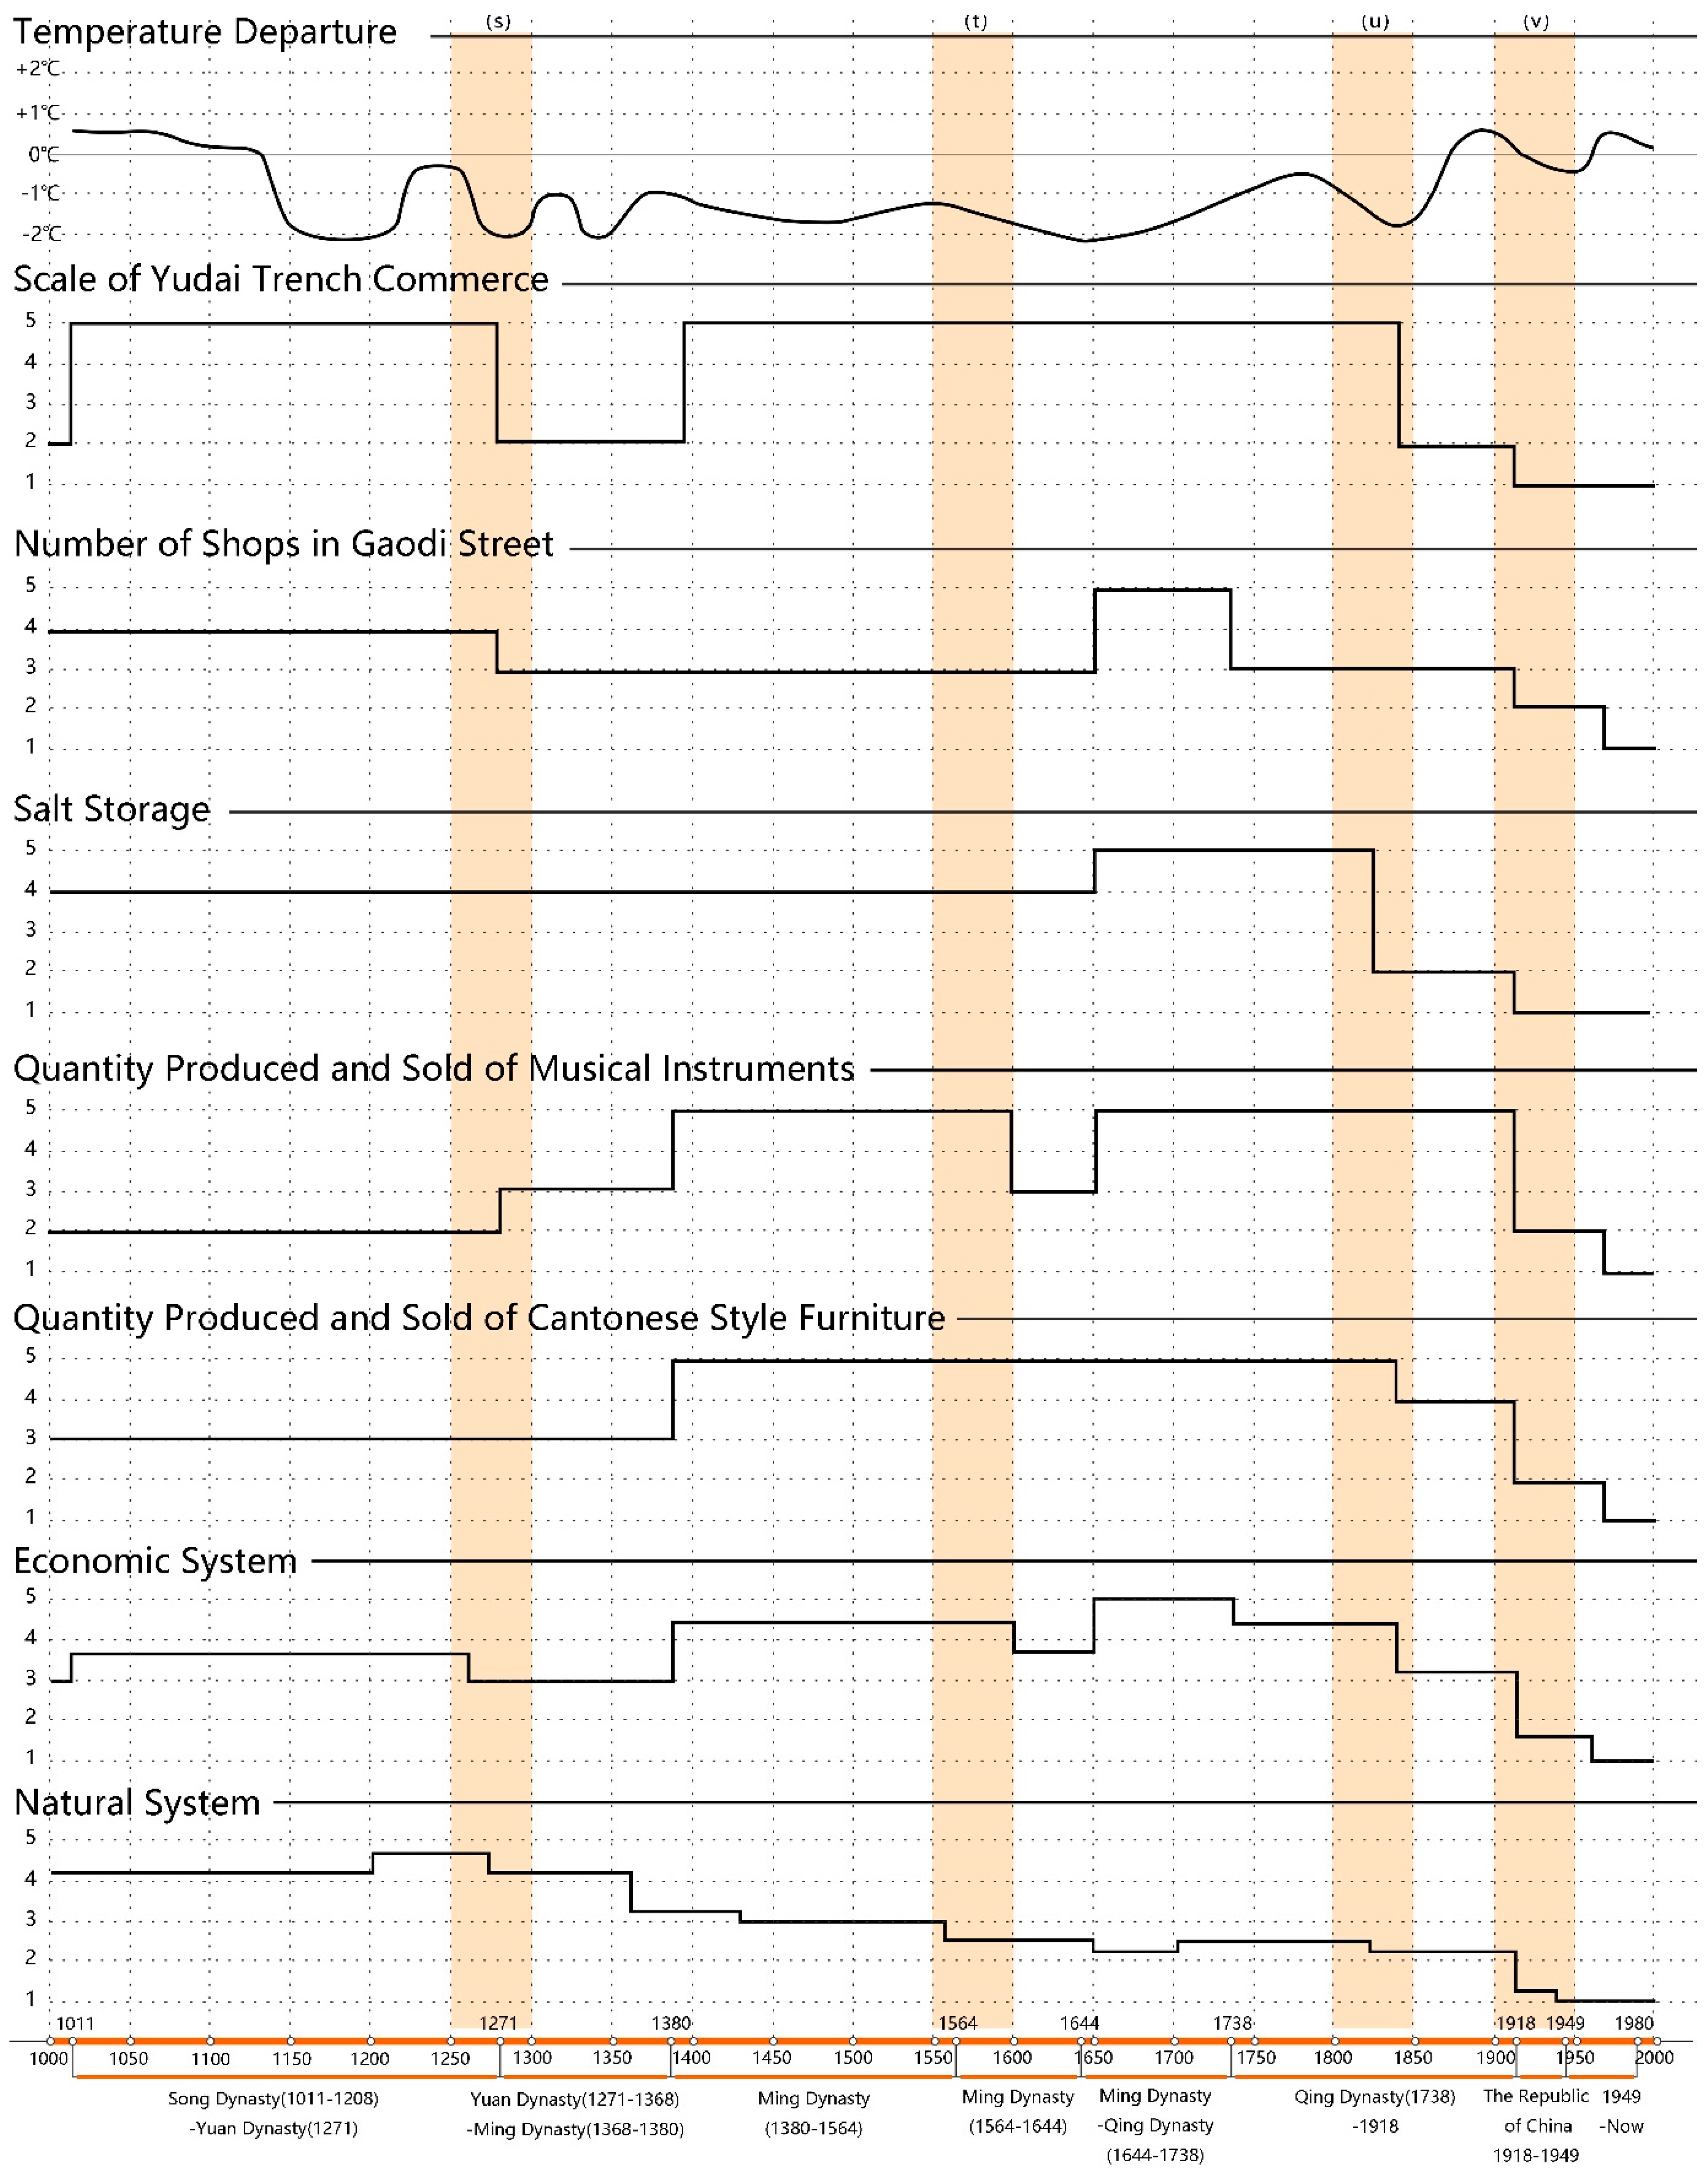
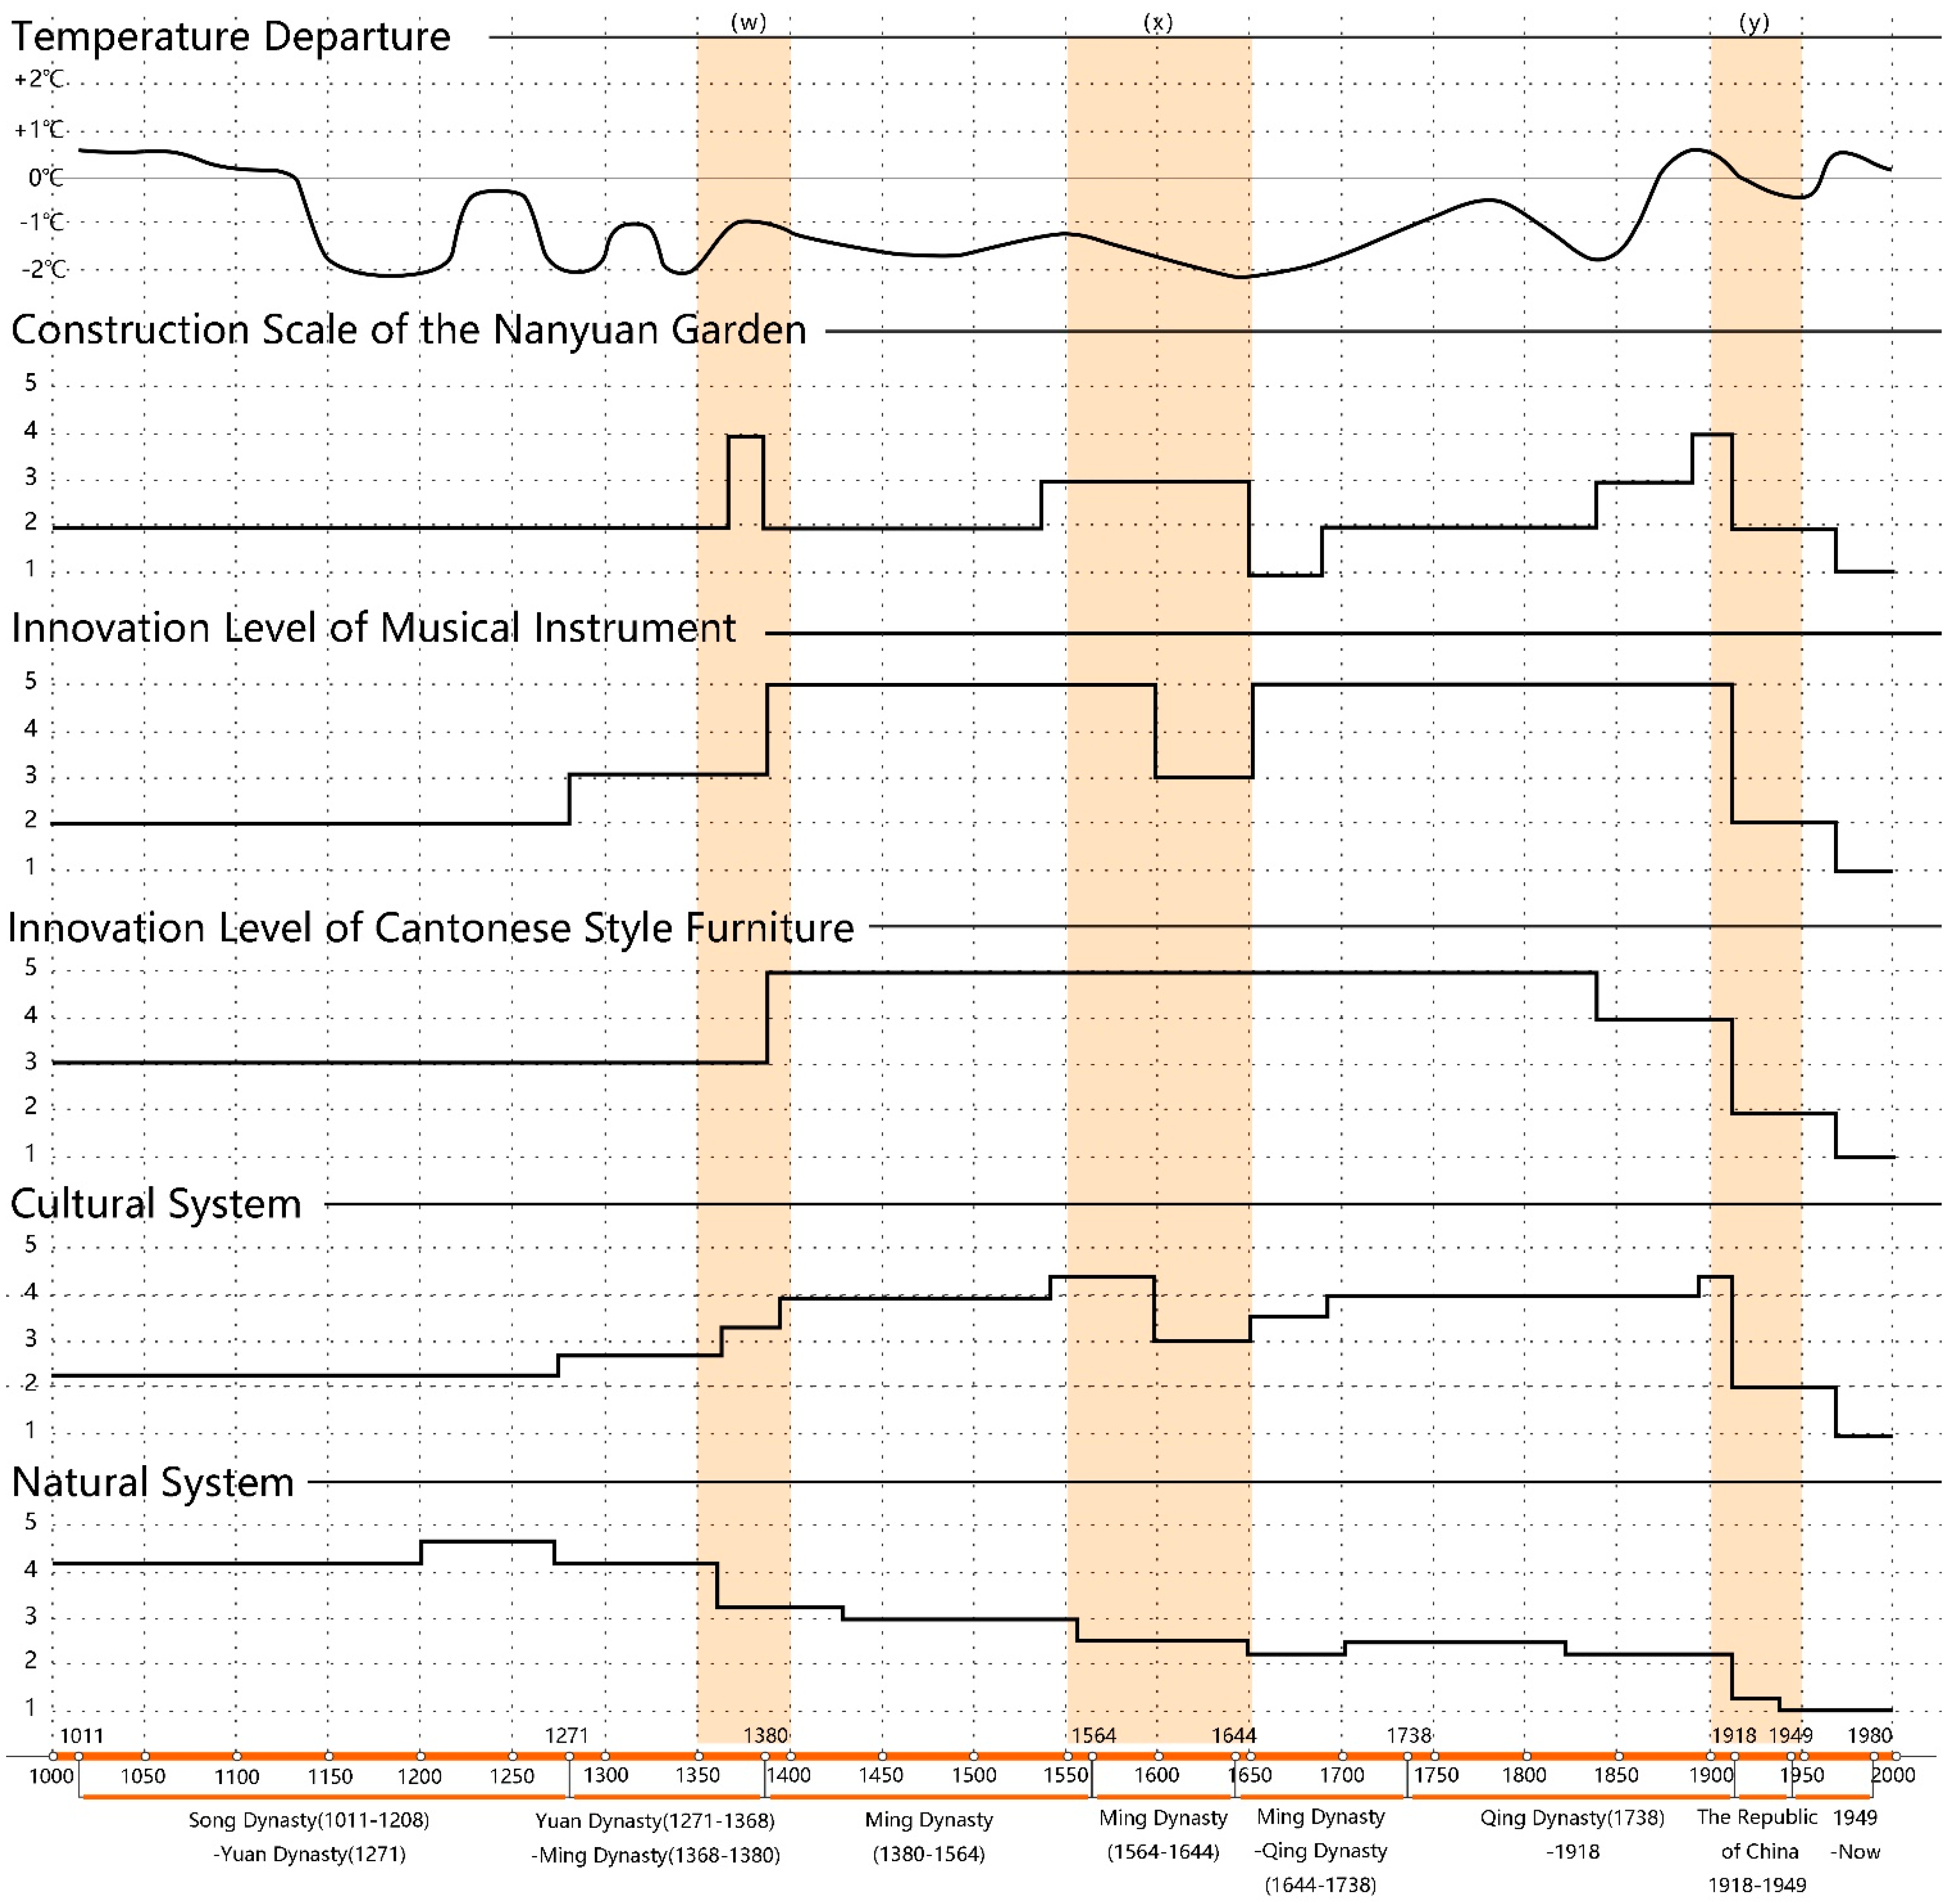
3.2. Correlations between Natural, Economic, and Cultural Systems
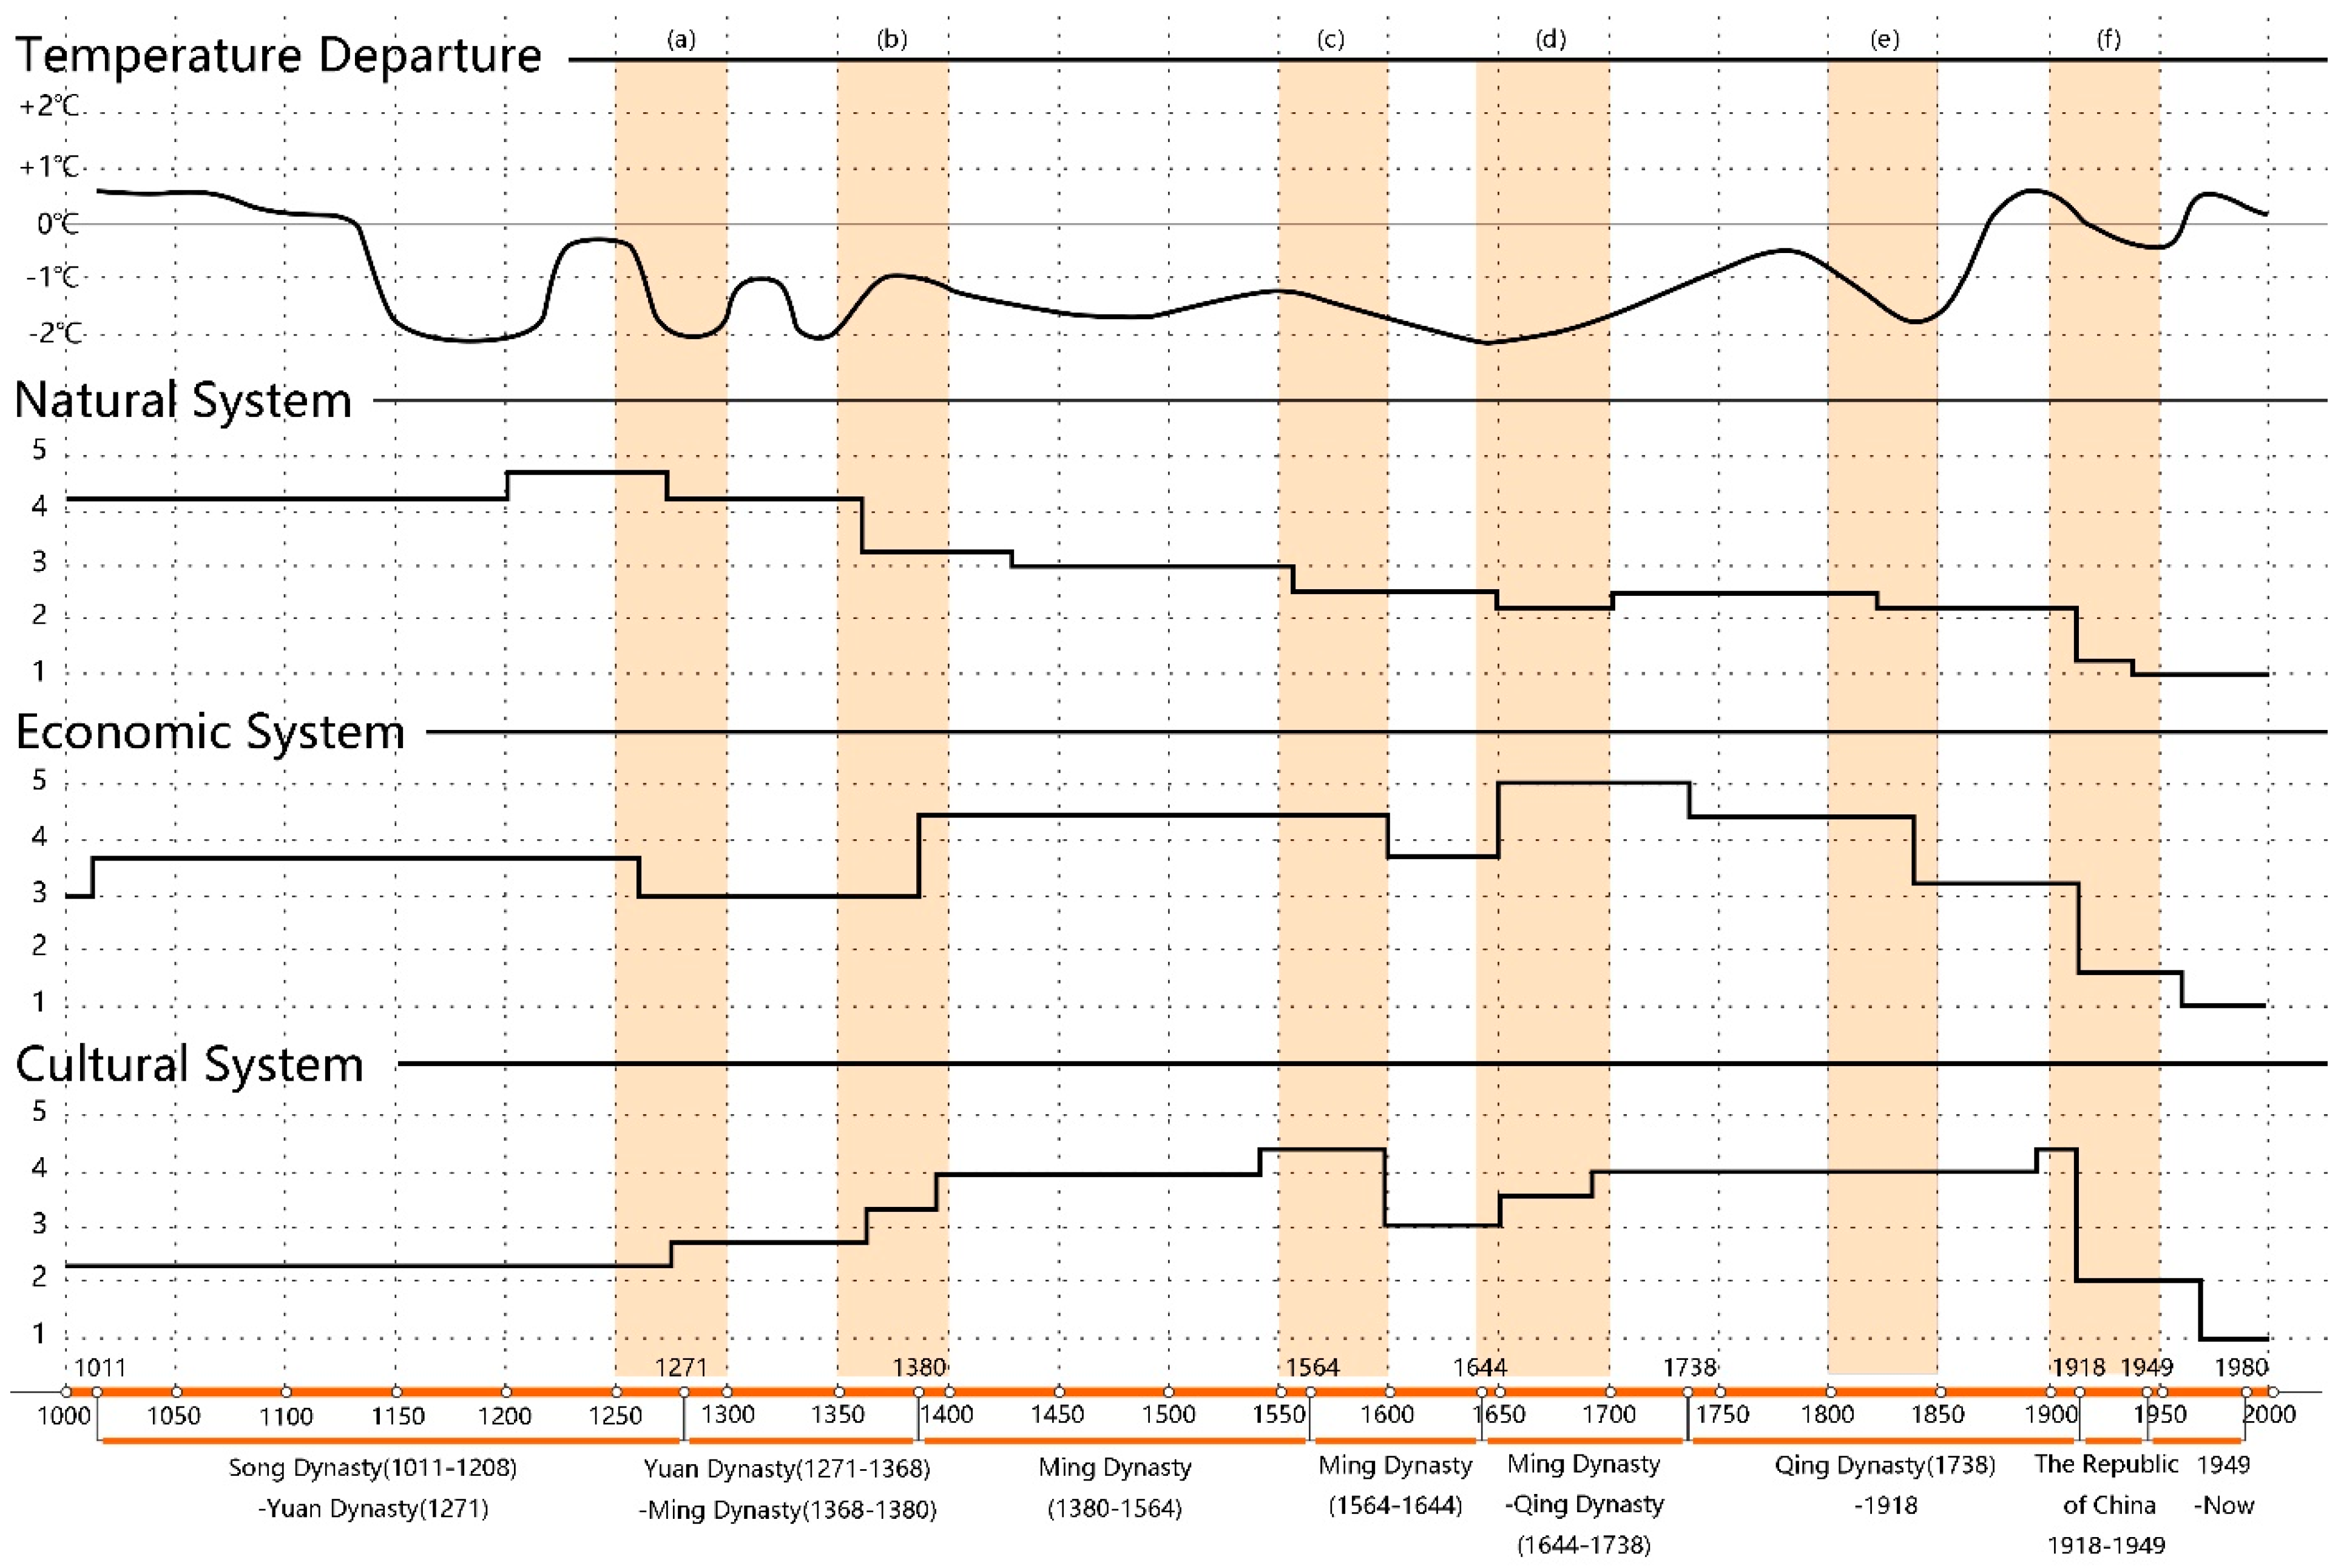
3.2.1. Periodic Changes with Temperature Changes among Natural, Economic, and Cultural Systems
3.2.2. Interaction between the Natural, Economic, and Cultural Systems
3.3. The Dominance and Priority of Natural Systems in Resilience Change
3.4. Resilience Change Characteristics of the Yudai Trench Historic Urban Landscape
3.4.1. The Long-Term and Short-Term Changes of the Resilience of the Yudai Trench Historic Urban Landscape
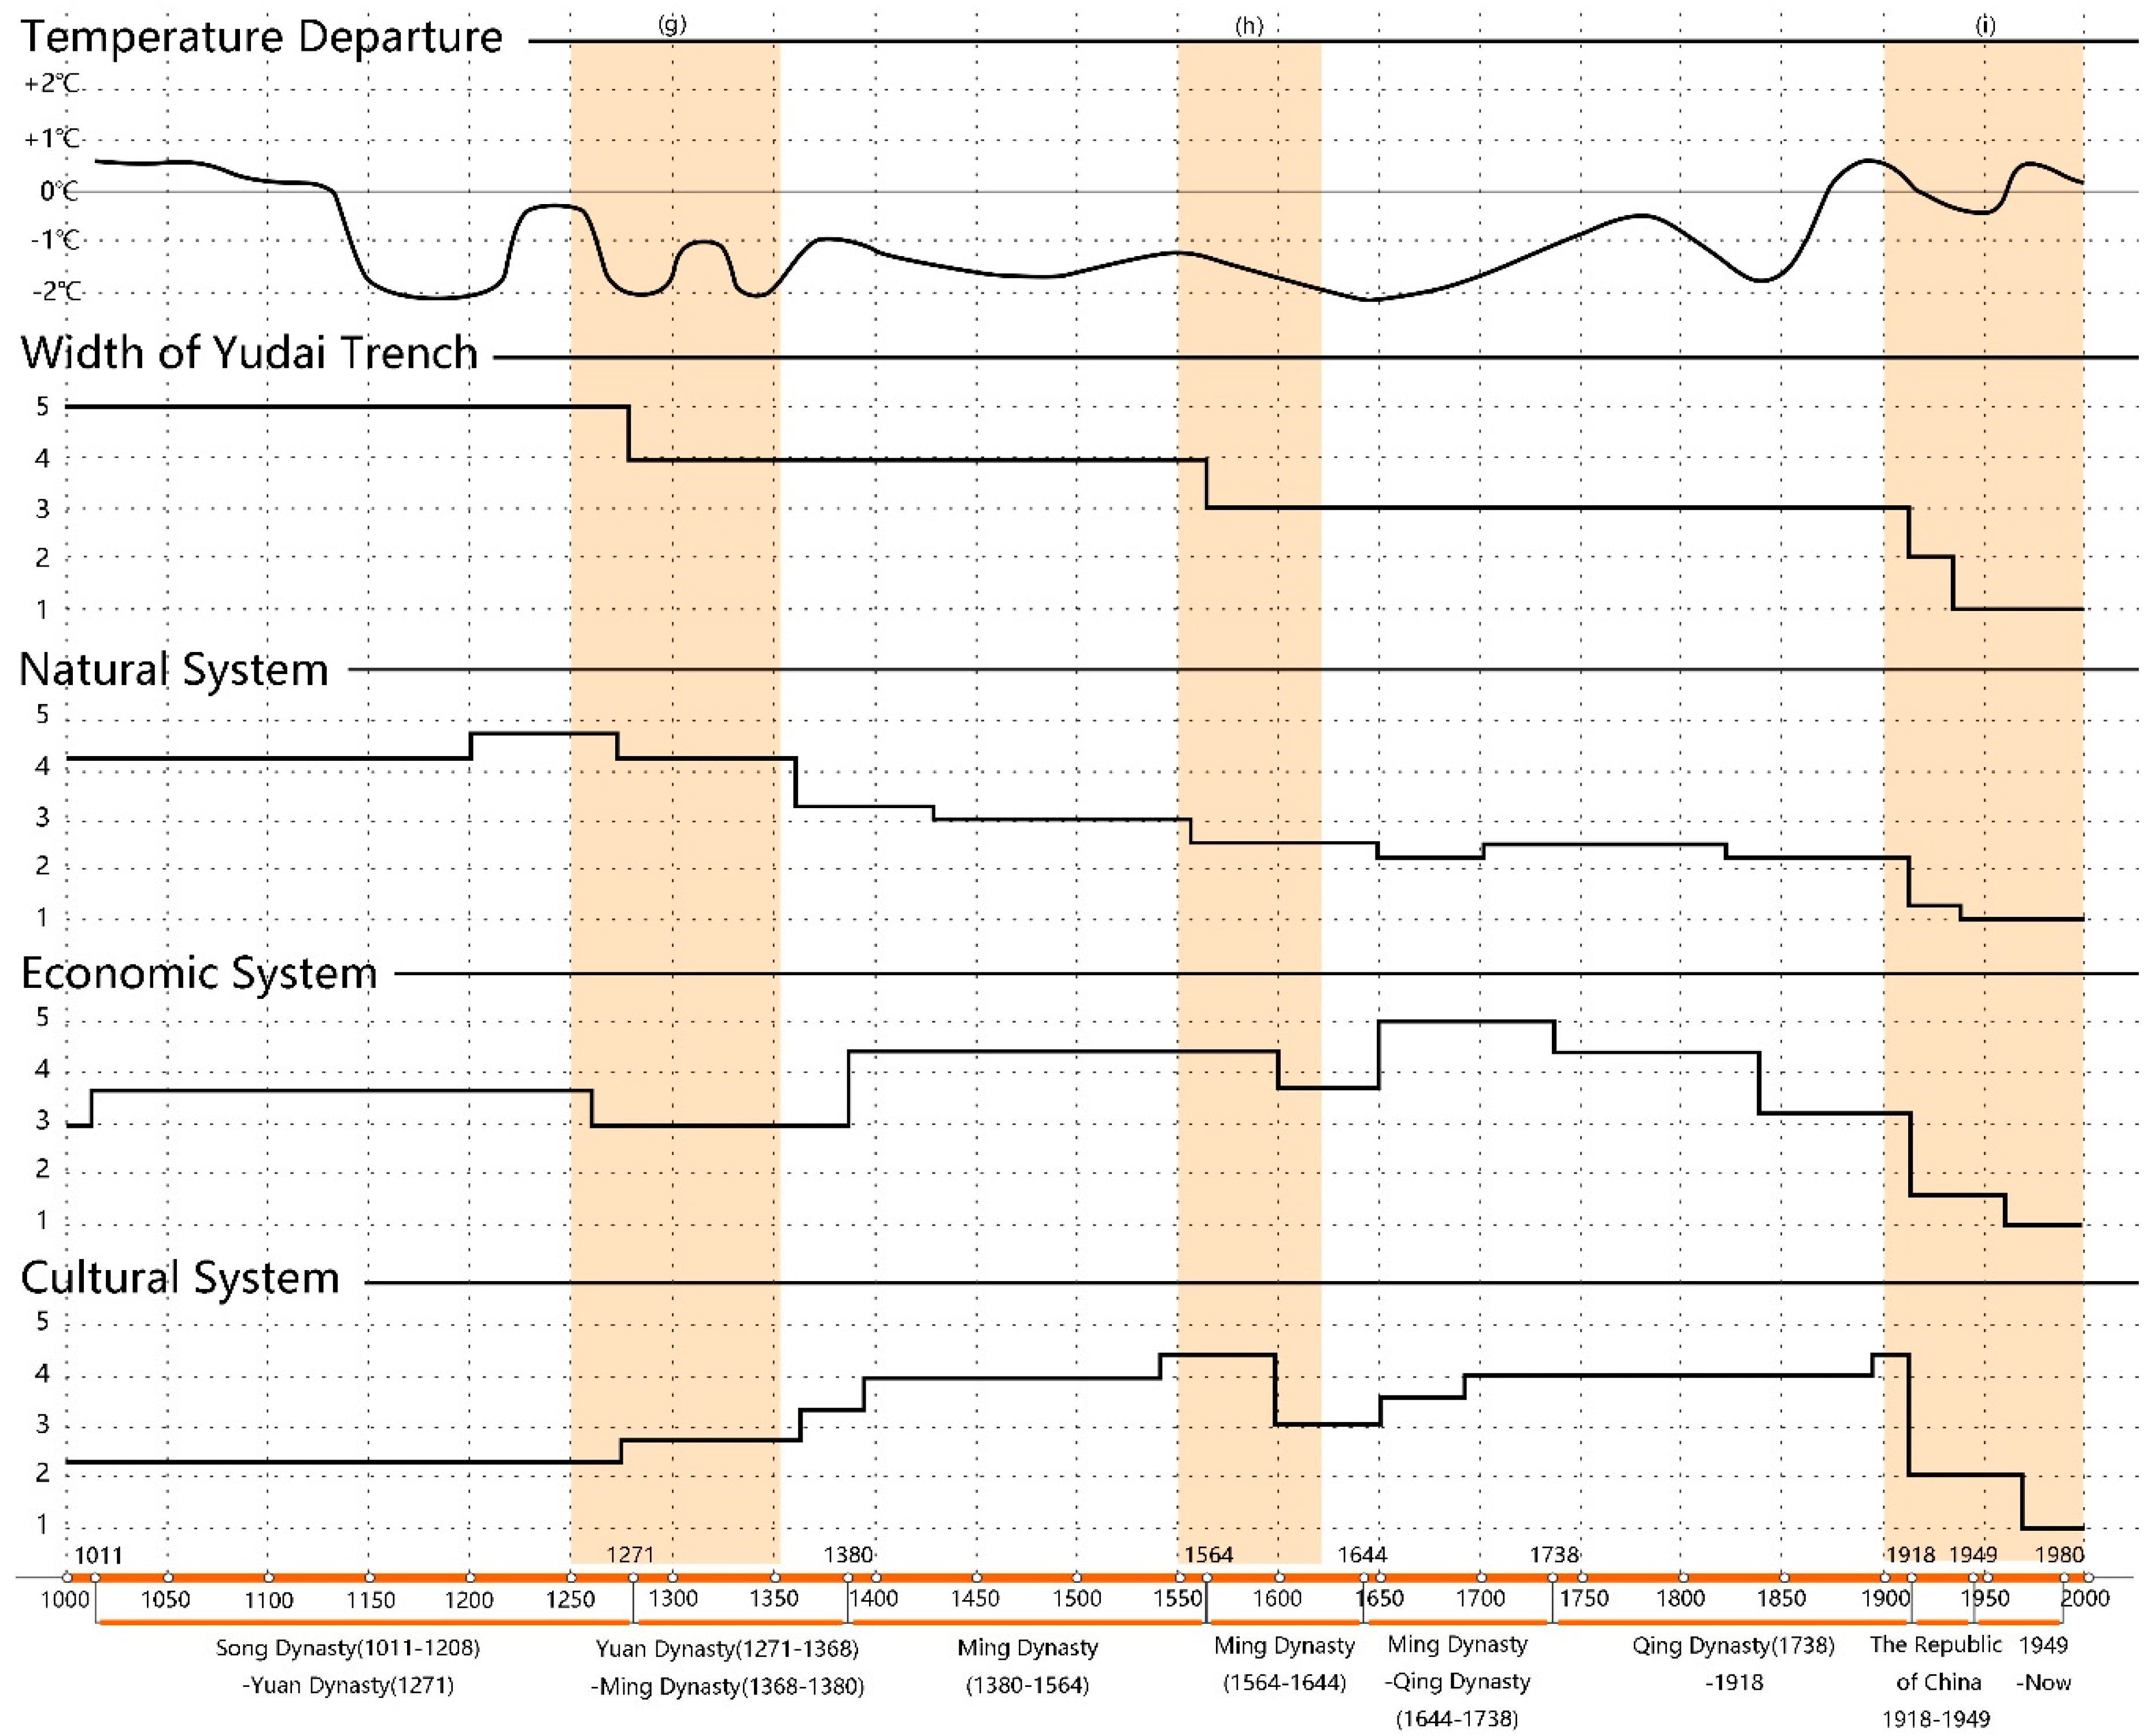
3.4.2. Natural Landscape Resilience Limit of the Yudai Trench Historic Urban Landscape
- (1)
- Late Yuan Dynasty and Early Ming Dynasty (1250–1400)
- (2)
- Late Ming Dynasty and Early Qing Dynasty (1550–1700)
- (3)
- Qing Dynasty to the beginning of the founding of China (1800–1950)
4. Discussion
4.1. Resilience to the Breakdown of the Yudai Trench Historic Urban Landscape as Result of the Collapse of the Natural Landscape
4.2. The Scenario of Guangzhou as Result of Resilience Development of the Yudai Trench Historic Urban Landscape
4.3. Study Limitations
5. Conclusions
Author Contributions
Funding
Institutional Review Board Statement
Informed Consent Statement
Data Availability Statement
Conflicts of Interest
Appendix A

| Serial Number | Place Name | Description |
|---|---|---|
| 1 | Yudai Trench | Yudai Trench is a moat excavated from the east to the west during the Song Dynasty, with the functions of shipping and disaster prevention. |
| 2 | Qing Dynasty City Wall | During the Qing Dynasty, the city wall of Guangzhou was divided the city into inner and outer cities, and the outer city wall contained the Yudai Trench. |
| 3 | Gaodi Street | Gaodi street has been prosperous since the Song Dynasty because of the convenient shipping of the Yudai Trench. It is the freight trading center of Guangzhou city. |
| 4 | Haopan Street | Haopan Street is a commercial street close to Yudai Trench, with prosperous trade. |
| 5 | Nanhao Trench | Nanhao Trench was an important traffic waterway excavated during the Song Dynasty. It was connected with the Yudai Trench and was one of the most prosperous areas in Guangzhou City in the past. |
| 6 | West Lake | The West Lake, which was excavated from a tributary of the Wenxi River at the end of the Tang Dynasty, carries the functions of a water source, flood resistance and storage, fire and disaster prevention, irrigation and shipping. |
| 7 | Wenxi River | The source of the Wenxi River was the Baiyun Mountain. Its east tributary flowed from south to north through the small north gate, and its west tributary was used as the water source of the West Lake. In the Ming Dynasty, the water of Wenxi no longer entered the city, but flowed away from the eastern wall. |
| 8 | Nanyuan Garden | Many poets gathered to set up the Nanyuan Garden because of the prosperity of the Yudai Trench and created Lingnan poetry. |
| 9 | The Pearl River | The urban water system of the ancient city of Guangzhou eventually converges into the Pearl River. |
Appendix B
| Emotional Intensity | 1 | 2 | 3 | 4 | 5 | |
|---|---|---|---|---|---|---|
| Overviews | Extreme Poor | Poor | Medium | Good | Extreme Good | |
| Contextual Description of Natural System | Natural Resources | Natural resources are abundant 1; Rich in natural water resources 2; There are many sources of food 3 | ||||
| Climate Disasters | Disastrous weather was less before the Ming Dynasty, but increased after the Ming Dynasty; Vulnerable to floods and droughts 4; Suffers from typhoon damage 5 | |||||
| Direct Description | Width of Yudai Trench | Culvert; Disappearance | 6 m (2 Zhang) wide; Sewage surges to the ground 7; Deposition; Water without a source 8; The trenches had no one to manage and clean up the dredging 9 | Merchants filled in the water to make land 10; Cross the river with a bridge 11; Less than 15 m (5 Zhang); Silt | Trench outlet blockage; It can only accommodate two boats 13 | Trench can withstand typhoon; The trench is 4800 m (160 Zhang) long, 63 m (20 Zhang) wide, and 9 m (3 Zhang) deep; Large ships can pass through |
| Area of West Lake | Broken stones and the remains of the lake 6 | Pond | Not as broad as in the Song and Yuan Dynasties 12; Lake silting in the throat; Artificially filled lake | White water rafting 14; West Lake shrank in area; The west side silted up, leaving only the east side | 450 m (150 Zhang) long; More than 1550 m (500 Zhang) in width; White water rafting | |
| Volume of Nanhao Trench | Big flood; Culvert | Easy to strand; 2 m wide; Loss of shipping benefits; Silt; Only 300 m | Dredge; Trench reopened to ships | Shipping is busy; Trench is large enough for ships to sail in | The river is 30 m (10 Zhang) wide and is called the little sea; No storm fear, and prepare for fire 15; Socioeconomic center | |
| Emotional Intensity | 1 | 2 | 3 | 4 | 5 | |
|---|---|---|---|---|---|---|
| Overviews | Extreme Poor | Poor | Medium | Good | Extreme Good | |
| Contextual Description of Economic System | Commercial scale | Destruction in the Yuan Dynasty led to a decline in trade | Disappearance of commercial value | Not as prosperous as in the Song and Yuan | ——————— | The people, the ships, the rich merchants, the precious goods were all gathered here 1; It was several times more prosperous than Qinhuai River commercial center 2; Commercial shops and art studios are everywhere 3 |
| Import and export | Guangzhou’s total import and export volume increased by 80%; The trade’s revenue is as high as 2 million, which accounts for 20% of the national revenue; There are many times more precious goods than before 4 | |||||
| Direct Description | Number of Shops in Gaodi Street | Commercial shops have been largely demolished | The number of shops has decreased | The decline in Gaodi Street commerce; changing from flourishing to decadence | Gaodi Street gradually developed | Business core area |
| Salt Storage | ——————— | Got into trouble and went bankrupt | ——————— | A place that produces salt | The salt industry is large and profitable; Treasured place 5 | |
| Quantity Produced and Sold of Cantonese Style Furniture | The furniture industry went bankrupt | ——————— | Court techniques laid the foundation | ——————— | There are rows and rows of workshops, and the market stretches for ten miles 6; The sources of wood raw materials are extensive; One of the three most famous furniture of the Qing Dynasty; Unique status | |
| Quantity Produced and Sold of Musical Instruments | Went bankrupt and disappeared | On the wane; Musical instruments are one of the commodities exported | ——————— | ——————— | Sells in distant markets overseas; The largest professional musical instrument production and sales street; The peak of the musical instrument industry | |
| Emotional Intensity | 1 | 2 | 3 | 4 | 5 | |
|---|---|---|---|---|---|---|
| Overviews | Extreme Poor | Poor | Medium | Good | Extreme Good | |
| Contextual Description of Cultural System | The Construction Scale of the Nanyuan Garden | Suffered destruction; Nanyuan Garden is destroyed and no longer exists | The literati were mentally wounded; Rebuild; Lingnan literature was not valued | Rebuild the Nanyuan Garden 1; old site; Become an office | Creation of poetry club; Ancestral hall was built in the Nanyuan Garden; Establish Guangya Book Concern | Literature seminars are held frequently in Nanyuan Garden 2 |
| Direct Description | The Innovation Level of Cantonese-Style Furniture | The furniture industry went bankrupt | ——————— | Court techniques laid the foundation | ——————— | Wood furniture is divided into different workshops according to different processes; Furniture combines ancient and modern essence, fusion of Chinese and foreign characteristics to form a unique style 3 |
| The Innovation Level of Musical Instrument | Went bankrupt and disappeared | On the wane; Musical instruments are one of the commodities exported | ——————— | ——————— | On the moon night, the music of musical instruments could be heard by the trench bank 4; Musical instruments have unique artistic characteristics | |
Appendix C

| Year | Temperature (x/°C) | Width of Yudai Trench | Area of West Lake | Volume of Nanhao Trench | Natural System Mean (y1) |
|---|---|---|---|---|---|
| 1000 | 0.40 | 5.00 | 4.00 | 4.00 | 4.33 |
| 1010 | 0.35 | 5.00 | 4.00 | 4.00 | 4.33 |
| 1020 | 0.25 | 5.00 | 4.00 | 4.00 | 4.33 |
| 1030 | 0.20 | 5.00 | 4.00 | 4.00 | 4.33 |
| 1040 | 0.10 | 5.00 | 4.00 | 4.00 | 4.33 |
| 1050 | 0.08 | 5.00 | 4.00 | 4.00 | 4.33 |
| 1060 | 0.05 | 5.00 | 4.00 | 4.00 | 4.33 |
| 1070 | 0.02 | 5.00 | 4.00 | 4.00 | 4.33 |
| 1080 | 0.00 | 5.00 | 4.00 | 4.00 | 4.33 |
| 1090 | −0.05 | 5.00 | 4.00 | 4.00 | 4.33 |
| 1100 | −0.15 | 5.00 | 4.00 | 4.00 | 4.33 |
| 1110 | −1.45 | 5.00 | 4.00 | 4.00 | 4.33 |
| 1120 | −1.60 | 5.00 | 4.00 | 4.00 | 4.33 |
| 1130 | −1.75 | 5.00 | 4.00 | 4.00 | 4.33 |
| 1140 | −1.80 | 5.00 | 4.00 | 4.00 | 4.33 |
| 1150 | −1.85 | 5.00 | 4.00 | 4.00 | 4.33 |
| 1160 | −1.80 | 5.00 | 4.00 | 4.00 | 4.33 |
| 1170 | −1.75 | 5.00 | 4.00 | 4.00 | 4.33 |
| 1180 | −1.70 | 5.00 | 4.00 | 4.00 | 4.33 |
| 1190 | −1.50 | 5.00 | 4.00 | 4.00 | 4.33 |
| 1200 | −0.40 | 5.00 | 4.00 | 4.00 | 4.33 |
| 1210 | −0.30 | 5.00 | 4.00 | 5.00 | 4.67 |
| 1220 | −0.25 | 5.00 | 4.00 | 5.00 | 4.67 |
| 1230 | −0.30 | 5.00 | 4.00 | 5.00 | 4.67 |
| 1240 | −0.75 | 5.00 | 4.00 | 5.00 | 4.67 |
| 1250 | −1.25 | 5.00 | 4.00 | 5.00 | 4.67 |
| 1260 | −1.75 | 5.00 | 4.00 | 5.00 | 4.67 |
| 1270 | −1.85 | 4.00 | 4.00 | 5.00 | 4.33 |
| 1280 | −1.80 | 4.00 | 4.00 | 5.00 | 4.33 |
| 1290 | −1.50 | 4.00 | 4.00 | 5.00 | 4.33 |
| 1300 | −1.00 | 4.00 | 4.00 | 5.00 | 4.33 |
| 1310 | −1.10 | 4.00 | 4.00 | 5.00 | 4.33 |
| 1320 | −1.80 | 4.00 | 4.00 | 5.00 | 4.33 |
| 1330 | −1.75 | 4.00 | 4.00 | 5.00 | 4.33 |
| 1340 | −1.60 | 4.00 | 4.00 | 5.00 | 4.33 |
| 1350 | −1.50 | 4.00 | 4.00 | 5.00 | 4.33 |
| 1360 | −1.25 | 4.00 | 4.00 | 2.00 | 3.33 |
| 1370 | −1.15 | 4.00 | 4.00 | 2.00 | 3.33 |
| 1380 | −1.00 | 4.00 | 4.00 | 2.00 | 3.33 |
| 1390 | −0.80 | 4.00 | 4.00 | 2.00 | 3.33 |
| 1400 | −0.90 | 4.00 | 4.00 | 2.00 | 3.33 |
| 1410 | −1.00 | 4.00 | 4.00 | 2.00 | 3.33 |
| 1420 | −1.10 | 4.00 | 4.00 | 2.00 | 3.33 |
| 1430 | −1.20 | 4.00 | 3.00 | 2.00 | 3.00 |
| 1440 | −1.25 | 4.00 | 3.00 | 2.00 | 3.00 |
| 1450 | −1.30 | 4.00 | 3.00 | 2.00 | 3.00 |
| 1460 | −1.35 | 4.00 | 3.00 | 2.00 | 3.00 |
| 1470 | −1.40 | 4.00 | 3.00 | 2.00 | 3.00 |
| 1480 | −1.45 | 4.00 | 3.00 | 2.00 | 3.00 |
| 1490 | −1.50 | 4.00 | 3.00 | 2.00 | 3.00 |
| 1500 | −1.45 | 4.00 | 3.00 | 2.00 | 3.00 |
| 1510 | −1.40 | 4.00 | 3.00 | 2.00 | 3.00 |
| 1520 | −1.30 | 4.00 | 3.00 | 2.00 | 3.00 |
| 1530 | −1.25 | 4.00 | 3.00 | 2.00 | 3.00 |
| 1540 | −1.20 | 4.00 | 3.00 | 2.00 | 3.00 |
| 1550 | −1.15 | 4.00 | 3.00 | 2.00 | 3.00 |
| 1560 | −1.10 | 3.00 | 3.00 | 2.00 | 2.67 |
| 1570 | −1.15 | 3.00 | 3.00 | 2.00 | 2.67 |
| 1580 | −1.20 | 3.00 | 3.00 | 2.00 | 2.67 |
| 1590 | −1.25 | 3.00 | 3.00 | 2.00 | 2.67 |
| 1600 | −1.35 | 3.00 | 3.00 | 2.00 | 2.67 |
| 1610 | −1.50 | 3.00 | 3.00 | 2.00 | 2.67 |
| 1620 | −1.60 | 3.00 | 3.00 | 2.00 | 2.67 |
| 1630 | −1.70 | 3.00 | 3.00 | 2.00 | 2.67 |
| 1640 | −1.75 | 3.00 | 3.00 | 2.00 | 2.67 |
| 1650 | −1.85 | 3.00 | 2.00 | 2.00 | 2.33 |
| 1660 | −1.75 | 3.00 | 2.00 | 2.00 | 2.33 |
| 1670 | −1.70 | 3.00 | 2.00 | 2.00 | 2.33 |
| 1680 | −1.65 | 3.00 | 2.00 | 2.00 | 2.33 |
| 1690 | −1.60 | 3.00 | 2.00 | 2.00 | 2.33 |
| 1700 | −1.55 | 3.00 | 2.00 | 2.00 | 2.33 |
| 1710 | −1.50 | 3.00 | 2.00 | 3.00 | 2.67 |
| 1720 | −1.40 | 3.00 | 2.00 | 3.00 | 2.67 |
| 1730 | −1.30 | 3.00 | 2.00 | 3.00 | 2.67 |
| 1740 | −1.20 | 3.00 | 2.00 | 3.00 | 2.67 |
| 1750 | −1.10 | 3.00 | 2.00 | 3.00 | 2.67 |
| 1760 | −0.95 | 3.00 | 2.00 | 3.00 | 2.67 |
| 1770 | −0.80 | 3.00 | 2.00 | 3.00 | 2.67 |
| 1780 | −0.65 | 3.00 | 2.00 | 3.00 | 2.67 |
| 1790 | −0.60 | 3.00 | 2.00 | 3.00 | 2.67 |
| 1800 | −0.50 | 3.00 | 2.00 | 3.00 | 2.67 |
| 1810 | −0.45 | 3.00 | 2.00 | 3.00 | 2.67 |
| 1820 | −0.50 | 3.00 | 2.00 | 3.00 | 2.67 |
| 1830 | −0.75 | 3.00 | 2.00 | 2.00 | 2.33 |
| 1840 | −1.00 | 3.00 | 2.00 | 2.00 | 2.33 |
| 1850 | −1.30 | 3.00 | 2.00 | 2.00 | 2.33 |
| 1860 | −1.40 | 3.00 | 2.00 | 2.00 | 2.33 |
| 1870 | −1.35 | 3.00 | 2.00 | 2.00 | 2.33 |
| 1880 | −1.25 | 3.00 | 2.00 | 2.00 | 2.33 |
| 1890 | −0.75 | 3.00 | 2.00 | 2.00 | 2.33 |
| 1900 | 0.00 | 3.00 | 2.00 | 2.00 | 2.33 |
| 1910 | 0.05 | 3.00 | 2.00 | 2.00 | 2.33 |
| 1920 | 0.00 | 2.00 | 1.00 | 1.00 | 1.33 |
| 1930 | −0.10 | 2.00 | 1.00 | 1.00 | 1.33 |
| 1940 | −0.20 | 1.00 | 1.00 | 1.00 | 1.00 |
| 1950 | 0.00 | 1.00 | 1.00 | 1.00 | 1.00 |
| 1960 | 0.25 | 1.00 | 1.00 | 1.00 | 1.00 |
| 1970 | 0.40 | 1.00 | 1.00 | 1.00 | 1.00 |
| 1980 | 0.55 | 1.00 | 1.00 | 1.00 | 1.00 |
| 1990 | 0.70 | 1.00 | 1.00 | 1.00 | 1.00 |
| 2000 | 0.85 | 1.00 | 1.00 | 1.00 | 1.00 |
| Year | Temperature (x/°C) | Scale of Yudai Trench Commerce | Number of Shops in Gaodi Street | Salt Storage | Quantity Produced and Sold of Cantonese Style Furniture | Quantity Produced and Sold of Musical Instruments | Economic System Mean (y2) |
|---|---|---|---|---|---|---|---|
| 1000 | 0.40 | 2.00 | 4.00 | 4.00 | 3.00 | 2.00 | 3.00 |
| 1010 | 0.35 | 5.00 | 4.00 | 4.00 | 3.00 | 2.00 | 3.60 |
| 1020 | 0.25 | 5.00 | 4.00 | 4.00 | 3.00 | 2.00 | 3.60 |
| 1030 | 0.20 | 5.00 | 4.00 | 4.00 | 3.00 | 2.00 | 3.60 |
| 1040 | 0.10 | 5.00 | 4.00 | 4.00 | 3.00 | 2.00 | 3.60 |
| 1050 | 0.08 | 5.00 | 4.00 | 4.00 | 3.00 | 2.00 | 3.60 |
| 1060 | 0.05 | 5.00 | 4.00 | 4.00 | 3.00 | 2.00 | 3.60 |
| 1070 | 0.02 | 5.00 | 4.00 | 4.00 | 3.00 | 2.00 | 3.60 |
| 1080 | 0.00 | 5.00 | 4.00 | 4.00 | 3.00 | 2.00 | 3.60 |
| 1090 | −0.05 | 5.00 | 4.00 | 4.00 | 3.00 | 2.00 | 3.60 |
| 1100 | −0.15 | 5.00 | 4.00 | 4.00 | 3.00 | 2.00 | 3.60 |
| 1110 | −1.45 | 5.00 | 4.00 | 4.00 | 3.00 | 2.00 | 3.60 |
| 1120 | −1.60 | 5.00 | 4.00 | 4.00 | 3.00 | 2.00 | 3.60 |
| 1130 | −1.75 | 5.00 | 4.00 | 4.00 | 3.00 | 2.00 | 3.60 |
| 1140 | −1.80 | 5.00 | 4.00 | 4.00 | 3.00 | 2.00 | 3.60 |
| 1150 | −1.85 | 5.00 | 4.00 | 4.00 | 3.00 | 2.00 | 3.60 |
| 1160 | −1.80 | 5.00 | 4.00 | 4.00 | 3.00 | 2.00 | 3.60 |
| 1170 | −1.75 | 5.00 | 4.00 | 4.00 | 3.00 | 2.00 | 3.60 |
| 1180 | −1.70 | 5.00 | 4.00 | 4.00 | 3.00 | 2.00 | 3.60 |
| 1190 | −1.50 | 5.00 | 4.00 | 4.00 | 3.00 | 2.00 | 3.60 |
| 1200 | −0.40 | 5.00 | 4.00 | 4.00 | 3.00 | 2.00 | 3.60 |
| 1210 | −0.30 | 5.00 | 4.00 | 4.00 | 3.00 | 2.00 | 3.60 |
| 1220 | −0.25 | 5.00 | 4.00 | 4.00 | 3.00 | 2.00 | 3.60 |
| 1230 | −0.30 | 5.00 | 4.00 | 4.00 | 3.00 | 2.00 | 3.60 |
| 1240 | −0.75 | 5.00 | 4.00 | 4.00 | 3.00 | 2.00 | 3.60 |
| 1250 | −1.25 | 5.00 | 4.00 | 4.00 | 3.00 | 2.00 | 3.60 |
| 1260 | −1.75 | 5.00 | 4.00 | 4.00 | 3.00 | 2.00 | 3.60 |
| 1270 | −1.85 | 2.00 | 3.00 | 4.00 | 3.00 | 3.00 | 3.00 |
| 1280 | −1.80 | 2.00 | 3.00 | 4.00 | 3.00 | 3.00 | 3.00 |
| 1290 | −1.50 | 2.00 | 3.00 | 4.00 | 3.00 | 3.00 | 3.00 |
| 1300 | −1.00 | 2.00 | 3.00 | 4.00 | 3.00 | 3.00 | 3.00 |
| 1310 | −1.10 | 2.00 | 3.00 | 4.00 | 3.00 | 3.00 | 3.00 |
| 1320 | −1.80 | 2.00 | 3.00 | 4.00 | 3.00 | 3.00 | 3.00 |
| 1330 | −1.75 | 2.00 | 3.00 | 4.00 | 3.00 | 3.00 | 3.00 |
| 1340 | −1.60 | 2.00 | 3.00 | 4.00 | 3.00 | 3.00 | 3.00 |
| 1350 | −1.50 | 2.00 | 3.00 | 4.00 | 3.00 | 3.00 | 3.00 |
| 1360 | −1.25 | 2.00 | 3.00 | 4.00 | 3.00 | 3.00 | 3.00 |
| 1370 | −1.15 | 2.00 | 3.00 | 4.00 | 3.00 | 3.00 | 3.00 |
| 1380 | −1.00 | 2.00 | 3.00 | 4.00 | 3.00 | 3.00 | 3.00 |
| 1390 | −0.80 | 5.00 | 3.00 | 4.00 | 5.00 | 5.00 | 4.40 |
| 1400 | −0.90 | 5.00 | 3.00 | 4.00 | 5.00 | 5.00 | 4.40 |
| 1410 | −1.00 | 5.00 | 3.00 | 4.00 | 5.00 | 5.00 | 4.40 |
| 1420 | −1.10 | 5.00 | 3.00 | 4.00 | 5.00 | 5.00 | 4.40 |
| 1430 | −1.20 | 5.00 | 3.00 | 4.00 | 5.00 | 5.00 | 4.40 |
| 1440 | −1.25 | 5.00 | 3.00 | 4.00 | 5.00 | 5.00 | 4.40 |
| 1450 | −1.30 | 5.00 | 3.00 | 4.00 | 5.00 | 5.00 | 4.40 |
| 1460 | −1.35 | 5.00 | 3.00 | 4.00 | 5.00 | 5.00 | 4.40 |
| 1470 | −1.40 | 5.00 | 3.00 | 4.00 | 5.00 | 5.00 | 4.40 |
| 1480 | −1.45 | 5.00 | 3.00 | 4.00 | 5.00 | 5.00 | 4.40 |
| 1490 | −1.50 | 5.00 | 3.00 | 4.00 | 5.00 | 5.00 | 4.40 |
| 1500 | −1.45 | 5.00 | 3.00 | 4.00 | 5.00 | 5.00 | 4.40 |
| 1510 | −1.40 | 5.00 | 3.00 | 4.00 | 5.00 | 5.00 | 4.40 |
| 1520 | −1.30 | 5.00 | 3.00 | 4.00 | 5.00 | 5.00 | 4.40 |
| 1530 | −1.25 | 5.00 | 3.00 | 4.00 | 5.00 | 5.00 | 4.40 |
| 1540 | −1.20 | 5.00 | 3.00 | 4.00 | 5.00 | 5.00 | 4.40 |
| 1550 | −1.15 | 5.00 | 3.00 | 4.00 | 5.00 | 5.00 | 4.40 |
| 1560 | −1.10 | 5.00 | 3.00 | 4.00 | 5.00 | 5.00 | 4.40 |
| 1570 | −1.15 | 5.00 | 3.00 | 4.00 | 5.00 | 5.00 | 4.40 |
| 1580 | −1.20 | 5.00 | 3.00 | 4.00 | 5.00 | 5.00 | 4.40 |
| 1590 | −1.25 | 5.00 | 3.00 | 4.00 | 5.00 | 5.00 | 4.40 |
| 1600 | −1.35 | 5.00 | 3.00 | 4.00 | 3.00 | 3.00 | 3.60 |
| 1610 | −1.50 | 5.00 | 3.00 | 4.00 | 3.00 | 3.00 | 3.60 |
| 1620 | −1.60 | 5.00 | 3.00 | 4.00 | 3.00 | 3.00 | 3.60 |
| 1630 | −1.70 | 5.00 | 3.00 | 4.00 | 3.00 | 3.00 | 3.60 |
| 1640 | −1.75 | 5.00 | 3.00 | 4.00 | 3.00 | 3.00 | 3.60 |
| 1650 | −1.85 | 5.00 | 5.00 | 5.00 | 5.00 | 5.00 | 5.00 |
| 1660 | −1.75 | 5.00 | 5.00 | 5.00 | 5.00 | 5.00 | 5.00 |
| 1670 | −1.70 | 5.00 | 5.00 | 5.00 | 5.00 | 5.00 | 5.00 |
| 1680 | −1.65 | 5.00 | 5.00 | 5.00 | 5.00 | 5.00 | 5.00 |
| 1690 | −1.60 | 5.00 | 5.00 | 5.00 | 5.00 | 5.00 | 5.00 |
| 1700 | −1.55 | 5.00 | 5.00 | 5.00 | 5.00 | 5.00 | 5.00 |
| 1710 | −1.50 | 5.00 | 5.00 | 5.00 | 5.00 | 5.00 | 5.00 |
| 1720 | −1.40 | 5.00 | 5.00 | 5.00 | 5.00 | 5.00 | 5.00 |
| 1730 | −1.30 | 5.00 | 5.00 | 5.00 | 5.00 | 5.00 | 5.00 |
| 1740 | −1.20 | 5.00 | 3.00 | 5.00 | 5.00 | 5.00 | 4.60 |
| 1750 | −1.10 | 5.00 | 3.00 | 5.00 | 5.00 | 5.00 | 4.60 |
| 1760 | −0.95 | 5.00 | 3.00 | 5.00 | 5.00 | 5.00 | 4.60 |
| 1770 | −0.80 | 5.00 | 3.00 | 5.00 | 5.00 | 5.00 | 4.60 |
| 1780 | −0.65 | 5.00 | 3.00 | 5.00 | 5.00 | 5.00 | 4.60 |
| 1790 | −0.60 | 5.00 | 3.00 | 5.00 | 5.00 | 5.00 | 4.60 |
| 1800 | −0.50 | 5.00 | 3.00 | 5.00 | 5.00 | 5.00 | 4.60 |
| 1810 | −0.45 | 5.00 | 3.00 | 5.00 | 5.00 | 5.00 | 4.60 |
| 1820 | −0.50 | 5.00 | 3.00 | 5.00 | 5.00 | 5.00 | 4.60 |
| 1830 | −0.75 | 5.00 | 3.00 | 5.00 | 5.00 | 5.00 | 4.60 |
| 1840 | −1.00 | 2.00 | 3.00 | 2.00 | 4.00 | 5.00 | 3.20 |
| 1850 | −1.30 | 2.00 | 3.00 | 2.00 | 4.00 | 5.00 | 3.20 |
| 1860 | −1.40 | 2.00 | 3.00 | 2.00 | 4.00 | 5.00 | 3.20 |
| 1870 | −1.35 | 2.00 | 3.00 | 2.00 | 4.00 | 5.00 | 3.20 |
| 1880 | −1.25 | 2.00 | 3.00 | 2.00 | 4.00 | 5.00 | 3.20 |
| 1890 | −0.75 | 2.00 | 3.00 | 2.00 | 4.00 | 5.00 | 3.20 |
| 1900 | 0.00 | 2.00 | 3.00 | 2.00 | 4.00 | 5.00 | 3.20 |
| 1910 | 0.05 | 2.00 | 3.00 | 2.00 | 4.00 | 5.00 | 3.20 |
| 1920 | 0.00 | 1.00 | 2.00 | 1.00 | 2.00 | 2.00 | 1.60 |
| 1930 | −0.10 | 1.00 | 2.00 | 1.00 | 2.00 | 2.00 | 1.60 |
| 1940 | −0.20 | 1.00 | 2.00 | 1.00 | 2.00 | 2.00 | 1.60 |
| 1950 | 0.00 | 1.00 | 2.00 | 1.00 | 2.00 | 2.00 | 1.60 |
| 1960 | 0.25 | 1.00 | 1.00 | 1.00 | 1.00 | 1.00 | 1.00 |
| 1970 | 0.40 | 1.00 | 1.00 | 1.00 | 1.00 | 1.00 | 1.00 |
| 1980 | 0.55 | 1.00 | 3.00 | 1.00 | 1.00 | 1.00 | 1.40 |
| 1990 | 0.70 | 1.00 | 3.00 | 1.00 | 1.00 | 1.00 | 1.40 |
| 2000 | 0.85 | 1.00 | 3.00 | 1.00 | 1.00 | 1.00 | 1.40 |
| Year | Temperature (x/°C) | Construction Scale of the Nanyuan Garden | Innovation Level of Cantonese Style Furniture | Innovation Level of Musical Instrument | Cultural System Mean (y3) |
|---|---|---|---|---|---|
| 1000 | 0.40 | 2.00 | 3.00 | 2.00 | 2.33 |
| 1010 | 0.35 | 2.00 | 3.00 | 2.00 | 2.33 |
| 1020 | 0.25 | 2.00 | 3.00 | 2.00 | 2.33 |
| 1030 | 0.20 | 2.00 | 3.00 | 2.00 | 2.33 |
| 1040 | 0.10 | 2.00 | 3.00 | 2.00 | 2.33 |
| 1050 | 0.08 | 2.00 | 3.00 | 2.00 | 2.33 |
| 1060 | 0.05 | 2.00 | 3.00 | 2.00 | 2.33 |
| 1070 | 0.02 | 2.00 | 3.00 | 2.00 | 2.33 |
| 1080 | 0.00 | 2.00 | 3.00 | 2.00 | 2.33 |
| 1090 | −0.05 | 2.00 | 3.00 | 2.00 | 2.33 |
| 1100 | −0.15 | 2.00 | 3.00 | 2.00 | 2.33 |
| 1110 | −1.45 | 2.00 | 3.00 | 2.00 | 2.33 |
| 1120 | −1.60 | 2.00 | 3.00 | 2.00 | 2.33 |
| 1130 | −1.75 | 2.00 | 3.00 | 2.00 | 2.33 |
| 1140 | −1.80 | 2.00 | 3.00 | 2.00 | 2.33 |
| 1150 | −1.85 | 2.00 | 3.00 | 2.00 | 2.33 |
| 1160 | −1.80 | 2.00 | 3.00 | 2.00 | 2.33 |
| 1170 | −1.75 | 2.00 | 3.00 | 2.00 | 2.33 |
| 1180 | −1.70 | 2.00 | 3.00 | 2.00 | 2.33 |
| 1190 | −1.50 | 2.00 | 3.00 | 2.00 | 2.33 |
| 1200 | −0.40 | 2.00 | 3.00 | 2.00 | 2.33 |
| 1210 | −0.30 | 2.00 | 3.00 | 2.00 | 2.33 |
| 1220 | −0.25 | 2.00 | 3.00 | 2.00 | 2.33 |
| 1230 | −0.30 | 2.00 | 3.00 | 2.00 | 2.33 |
| 1240 | −0.75 | 2.00 | 3.00 | 2.00 | 2.33 |
| 1250 | −1.25 | 2.00 | 3.00 | 2.00 | 2.33 |
| 1260 | −1.75 | 2.00 | 3.00 | 2.00 | 2.33 |
| 1270 | −1.85 | 2.00 | 3.00 | 3.00 | 2.67 |
| 1280 | −1.80 | 2.00 | 3.00 | 3.00 | 2.67 |
| 1290 | −1.50 | 2.00 | 3.00 | 3.00 | 2.67 |
| 1300 | −1.00 | 2.00 | 3.00 | 3.00 | 2.67 |
| 1310 | −1.10 | 2.00 | 3.00 | 3.00 | 2.67 |
| 1320 | −1.80 | 2.00 | 3.00 | 3.00 | 2.67 |
| 1330 | −1.75 | 2.00 | 3.00 | 3.00 | 2.67 |
| 1340 | −1.60 | 2.00 | 3.00 | 3.00 | 2.67 |
| 1350 | −1.50 | 2.00 | 3.00 | 3.00 | 2.67 |
| 1360 | −1.25 | 4.00 | 3.00 | 3.00 | 3.33 |
| 1370 | −1.15 | 4.00 | 3.00 | 3.00 | 3.33 |
| 1380 | −1.00 | 4.00 | 3.00 | 3.00 | 3.33 |
| 1390 | −0.80 | 2.00 | 5.00 | 5.00 | 4.00 |
| 1400 | −0.90 | 2.00 | 5.00 | 5.00 | 4.00 |
| 1410 | −1.00 | 2.00 | 5.00 | 5.00 | 4.00 |
| 1420 | −1.10 | 2.00 | 5.00 | 5.00 | 4.00 |
| 1430 | −1.20 | 2.00 | 5.00 | 5.00 | 4.00 |
| 1440 | −1.25 | 2.00 | 5.00 | 5.00 | 4.00 |
| 1450 | −1.30 | 2.00 | 5.00 | 5.00 | 4.00 |
| 1460 | −1.35 | 2.00 | 5.00 | 5.00 | 4.00 |
| 1470 | −1.40 | 2.00 | 5.00 | 5.00 | 4.00 |
| 1480 | −1.45 | 2.00 | 5.00 | 5.00 | 4.00 |
| 1490 | −1.50 | 2.00 | 5.00 | 5.00 | 4.00 |
| 1500 | −1.45 | 2.00 | 5.00 | 5.00 | 4.00 |
| 1510 | −1.40 | 2.00 | 5.00 | 5.00 | 4.00 |
| 1520 | −1.30 | 2.00 | 5.00 | 5.00 | 4.00 |
| 1530 | −1.25 | 2.00 | 5.00 | 5.00 | 4.00 |
| 1540 | −1.20 | 3.00 | 5.00 | 5.00 | 4.33 |
| 1550 | −1.15 | 3.00 | 5.00 | 5.00 | 4.33 |
| 1560 | −1.10 | 3.00 | 5.00 | 5.00 | 4.33 |
| 1570 | −1.15 | 3.00 | 5.00 | 5.00 | 4.33 |
| 1580 | −1.20 | 3.00 | 5.00 | 5.00 | 4.33 |
| 1590 | −1.25 | 3.00 | 5.00 | 5.00 | 4.33 |
| 1600 | −1.35 | 3.00 | 3.00 | 3.00 | 3.00 |
| 1610 | −1.50 | 3.00 | 3.00 | 3.00 | 3.00 |
| 1620 | −1.60 | 3.00 | 3.00 | 3.00 | 3.00 |
| 1630 | −1.70 | 3.00 | 3.00 | 3.00 | 3.00 |
| 1640 | −1.75 | 3.00 | 3.00 | 3.00 | 3.00 |
| 1650 | −1.85 | 1.00 | 5.00 | 5.00 | 3.67 |
| 1660 | −1.75 | 1.00 | 5.00 | 5.00 | 3.67 |
| 1670 | −1.70 | 1.00 | 5.00 | 5.00 | 3.67 |
| 1680 | −1.65 | 1.00 | 5.00 | 5.00 | 3.67 |
| 1690 | −1.60 | 2.00 | 5.00 | 5.00 | 4.00 |
| 1700 | −1.55 | 2.00 | 5.00 | 5.00 | 4.00 |
| 1710 | −1.50 | 2.00 | 5.00 | 5.00 | 4.00 |
| 1720 | −1.40 | 2.00 | 5.00 | 5.00 | 4.00 |
| 1730 | −1.30 | 2.00 | 5.00 | 5.00 | 4.00 |
| 1740 | −1.20 | 2.00 | 5.00 | 5.00 | 4.00 |
| 1750 | −1.10 | 2.00 | 5.00 | 5.00 | 4.00 |
| 1760 | −0.95 | 2.00 | 5.00 | 5.00 | 4.00 |
| 1770 | −0.80 | 2.00 | 5.00 | 5.00 | 4.00 |
| 1780 | −0.65 | 2.00 | 5.00 | 5.00 | 4.00 |
| 1790 | −0.60 | 2.00 | 5.00 | 5.00 | 4.00 |
| 1800 | −0.50 | 2.00 | 5.00 | 5.00 | 4.00 |
| 1810 | −0.45 | 2.00 | 5.00 | 5.00 | 4.00 |
| 1820 | −0.50 | 2.00 | 5.00 | 5.00 | 4.00 |
| 1830 | −0.75 | 2.00 | 5.00 | 5.00 | 4.00 |
| 1840 | −1.00 | 3.00 | 4.00 | 5.00 | 4.00 |
| 1850 | −1.30 | 3.00 | 4.00 | 5.00 | 4.00 |
| 1860 | −1.40 | 3.00 | 4.00 | 5.00 | 4.00 |
| 1870 | −1.35 | 3.00 | 4.00 | 5.00 | 4.00 |
| 1880 | −1.25 | 3.00 | 4.00 | 5.00 | 4.00 |
| 1890 | −0.75 | 4.00 | 4.00 | 5.00 | 4.33 |
| 1900 | 0.00 | 4.00 | 4.00 | 5.00 | 4.33 |
| 1910 | 0.05 | 5.00 | 4.00 | 4.00 | 4.33 |
| 1920 | 0.00 | 2.00 | 2.00 | 2.00 | 2.00 |
| 1930 | −0.10 | 2.00 | 2.00 | 2.00 | 2.00 |
| 1940 | −0.20 | 2.00 | 2.00 | 2.00 | 2.00 |
| 1950 | 0.00 | 2.00 | 2.00 | 2.00 | 2.00 |
| 1960 | 0.25 | 1.00 | 1.00 | 1.00 | 1.00 |
| 1970 | 0.40 | 1.00 | 1.00 | 1.00 | 1.00 |
| 1980 | 0.55 | 1.00 | 1.00 | 1.00 | 1.00 |
| 1990 | 0.70 | 1.00 | 1.00 | 1.00 | 1.00 |
| 2000 | 0.85 | 1.00 | 1.00 | 1.00 | 1.00 |
| Temperature Change | Natural System | Economic System | Cultural System | |
|---|---|---|---|---|
| Temperature Change | — | — | — | — |
| Natural System | 2.74 × 10−82 | — | — | — |
| Economic System | 0.90348 | 0.00040 | — | — |
| Cultural System | 1.92 × 10−87 | 0.86886 | 0.00009 | — |
| Period of Time | 1250—1400 | 1550–1700 | 1800–1950 | |||||||||
|---|---|---|---|---|---|---|---|---|---|---|---|---|
| Temperature Change | Natural System | Economic System | Cultural System | Temperature Change | Natural System | Economic System | Cultural System | Temperature Change | Natural System | Economic System | Cultural System | |
| Temperature Change | - | - | - | - | - | - | - | - | - | - | - | - |
| Natural System | 1.15 × 10⁻²⁵ | - | - | - | 1.52 × 10⁻³⁰ | - | - | - | 1.94 × 10⁻¹⁴ | - | - | - |
| Economic System | 4.60 × 10⁻²⁴ | 8.52 × 10⁻⁵ | - | - | 2.28 × 10⁻²⁶ | 1.58 × 10⁻¹² | - | - | 3.14 × 10⁻¹³ | 0.0021 | - | - |
| Cultural System | 1.30 × 10⁻²² | 7.67 × 10⁻⁷ | 0.0367 | - | 1.53 × 10⁻²⁵ | 1.19 × 10⁻⁸ | 0.0027 | - | 9.10 × 10⁻¹⁶ | 1.06 × 10⁻⁵ | 0.0263 | - |
References
- Bloom, D.E.; Canning, D.; Fink, G. Urbanization and the wealth of nations. Science 2008, 319, 772–775. [Google Scholar] [CrossRef] [PubMed] [Green Version]
- Di Giulio, M.; Holderegger, R.; Tobias, S. Effects of habitat and landscape fragmentation on humans and biodiversity in densely populated landscapes. J. Environ. Manag. 2009, 90, 2959–2968. [Google Scholar] [CrossRef] [PubMed]
- Fakhouri, L.A.; Haddad, N.A. Aspects of the architectural and urban heritage: From registers to conservation for adaptive and modern use at the historic cores of salt and irbid, jordan. Archnet-IJAR 2017, 11, 190–218. [Google Scholar] [CrossRef] [Green Version]
- Hou, H.; Estoque, R.C. Detecting Cooling Effect of Landscape from Composition and Configuration: An Urban Heat Island Study on Hangzhou. Urban For. Urban Green. 2020, 53, 12. [Google Scholar] [CrossRef]
- Jorgenson, A.K.; Burns, T.J. Effects of rural and urban population dynamics and national development on deforestation in less-developed countries, 1990–2000. Sociol. Inq. 2007, 77, 460–482. [Google Scholar] [CrossRef]
- Syrbe, R.U.; Neumann, I.; Grunewald, K.; Brzoska, P.; Louda, J.; Kochan, B.; Machac, J.; Dubova, L.; Meyer, P.; Brabec, J.; et al. The Value of Urban Nature in Terms of Providing Ecosystem Services Related to Health and Well-Being: An Empirical Comparative Pilot Study of Cities in Germany and the Czech Republic. Land 2021, 10, 341. [Google Scholar] [CrossRef]
- Wu, Z.J.; Zhang, Y.X. Water Bodies’ Cooling Effects on Urban Land Daytime Surface Temperature: Ecosystem Service Reducing Heat Island Effect. Sustainability 2019, 11, 787. [Google Scholar] [CrossRef] [Green Version]
- Muller, J. Transforming Our World: The 2030 Agenda for Sustainable Development 25 September 2015. In Reforming the United Nations: A Chronology; Muller, J., Ed.; Brill: Leiden, The Netherlands, 2016; Volume 7, pp. 223–263. [Google Scholar]
- Alberti, M. Simulation and Design of Hybrid Human-NaturalTechnological Systems. Technol. Archit. Des. 2017, 1, 135–139. [Google Scholar] [CrossRef]
- Liao, K.H. A Theory on Urban Resilience to Floods-A Basis for Alternative Planning Practices. Ecol. Soc. 2012, 17, 15. [Google Scholar] [CrossRef]
- Meerow, S.; Newell, J.P.; Stults, M. Defining urban resilience: A review. Landsc. Urban Plan. 2016, 147, 38–49. [Google Scholar] [CrossRef]
- Cerra, J.F. Inland Adaptation: Developing a Studio Model for Climate-adaptive Design as a Framework for Design Practice. Landsc. J. 2016, 35, 37–55. [Google Scholar] [CrossRef]
- Huang, L.; Xiang, W.N.; Wu, J.G.; Traxler, C.; Huang, J.Z. Integrating GeoDesign with Landscape Sustainability Science. Sustainability 2019, 11, 833. [Google Scholar] [CrossRef] [Green Version]
- Arnold, C.L.; Gibbons, C.J. Impervious surface coverage—The emergence of a key environmental indicator. J. Am. Plan. Assoc. 1996, 62, 243–258. [Google Scholar] [CrossRef]
- Kwak, Y.; Deal, B.; Mosey, G. Landscape Design toward Urban Resilience: Bridging Science and Physical Design Coupling Sociohydrological Modeling and Design Process. Sustainability 2021, 13, 4666. [Google Scholar] [CrossRef]
- Opdam, P.; Luque, S.; Nassauer, J.; Verburg, P.H.; Wu, J. How can landscape ecology contribute to sustainability science? Landsc. Ecol. 2018, 33, 1–7. [Google Scholar] [CrossRef] [Green Version]
- UNESCO (United Nations Educational, Scientific and Cultural Organization). Recommendation on the historic urban landscape. In Proceedings of the Records of the General Conference 36th Session, Paris, France, 15 October–10 Novermber 2011. [Google Scholar]
- Cao, S.Y.; Liu, X.N.; Er, H.A. Dujiangyan Irrigation System—A world cultural heritage corresponding to concepts of modern hydraulic science. J. Hydro-Environ. Res. 2010, 4, 3–13. [Google Scholar] [CrossRef]
- DeCandido, R.; Calvanese, N.; Alvarez, R.V.; Brown, M.I.; Nelson, T.M. The naturally occurring historical and extant flora of Central Park, New York City, New York 1857–2007. J. Torrey Bot. Soc. 2007, 134, 552–569. [Google Scholar] [CrossRef]
- Li, K.; Xu, Z.F. Overview of Dujiangyan Irrigation Scheme of ancient China with current theory. Irrig. Drain. 2006, 55, 291–298. [Google Scholar] [CrossRef]
- Zhang, L.X.; Yang, Z.F.; Voinov, A.; Gao, S. Nature-inspired stormwater management practice: The ecological wisdom underlying the Tuanchen drainage system in Beijing, China and its contemporary relevance. Landsc. Urban Plan. 2016, 155, 11–20. [Google Scholar] [CrossRef]
- Ginzarly, M.; Houbart, C.; Teller, J. The Historic Urban Landscape approach to urban management: A systematic review. Int. J. Herit. Stud. 2019, 25, 999–1019. [Google Scholar] [CrossRef]
- Shamsuddin, S.; Sulaiman, A.B.; Amat, R.C. Urban Landscape Factors That Influenced the Character of George Town, Penang Unesco World Heritage Site. In Proceedings of the ASEAN Conference on Environment-Behaviour Studies (AcE-Bs) on Way of Life—Socio-Economic and Cultural Context, King Mongkuts Inst Technol Ladkrabang (KMITL), Fac Architecture, Bangkok, Thailand, 16–18 July 2012; pp. 238–253. [Google Scholar]
- Gravagnuolo, A.; Girard, L.F. Multicriteria Tools for the Implementation of Historic Urban Landscape. Qual. Innov. Prosper. 2017, 21, 186–201. [Google Scholar] [CrossRef]
- Girard, L.F. Toward a Smart Sustainable Development of Port Cities/Areas: The Role of the “Historic Urban Landscape” Approach. Sustainability 2013, 5, 4329–4348. [Google Scholar] [CrossRef] [Green Version]
- Veldpaus, L.; Roders, A.R.P.; Colenbrander, B.J.F. Urban Heritage: Putting the Past into the Future. Hist. Environ. Policy Pract. 2013, 4, 3–18. [Google Scholar] [CrossRef]
- Chahardowli, M.; Sajadzadeh, H.; Aram, F.; Mosavi, A. Survey of Sustainable Regeneration of Historic and Cultural Cores of Cities. Energies 2020, 13, 2708. [Google Scholar] [CrossRef]
- Rodwell, D. Reconnecting the city: The historic landscape approach and the future of urban heritage. J. Archit. Conserv. 2015, 21, 136–138. [Google Scholar] [CrossRef]
- Zhang, L.; Cong, C.; Pan, H.Z.; Cai, Z.P.; Cvetkovic, V.; Deal, B. Socioecological informed comparative modeling to promote sustainable urban policy transitions: Case study in Chicago and Stockholm. J. Clean Prod. 2021, 281, 12. [Google Scholar] [CrossRef]
- Mortberg, U.; Haas, J.; Zetterberg, A.; Franklin, J.P.; Jonsson, D.; Deal, B. Urban ecosystems and sustainable urban development-analysing and assessing interacting systems in the Stockholm region. Urban Ecosyst. 2013, 16, 763–782. [Google Scholar] [CrossRef]
- Tillman, J. Design for Human Ecosystems; Island Press: Washinton, DC, USA, 1999. [Google Scholar]
- Zeng, Z.X. Guangzhou Historical Geography, 1st ed.; Zhang, J.X., Ed.; Guangdong People’s Publishing House: Guangzhou, China, 1991; pp. 153–195. (In Chinese) [Google Scholar]
- Qu, D.J. Guangdong Xinyu; China Publishing House: Shanghai, China, 1985; pp. 460–476. (In Chinese) [Google Scholar]
- Oudin, L.; Salavati, B.; Furusho-Percot, C.; Ribstein, P.; Saadi, M. Hydrological impacts of urbanization at the catchment scale. J. Hydrol. 2018, 559, 774–786. [Google Scholar] [CrossRef] [Green Version]
- Wu, J.Y.; Thompson, J.R.; Kolka, R.K.; Franz, K.J.; Stewart, T.W. Using the Storm Water Management Model to predict urban headwater stream hydrological response to climate and land cover change. Hydrol. Earth Syst. Sci. 2013, 17, 4743–4758. [Google Scholar] [CrossRef] [Green Version]
- Zope, P.E.; Eldho, T.I.; Jothiprakash, V. Hydrological impacts of land use-land cover change and detention basins on urban flood hazard: A case study of Poisar River basin, Mumbai, India. Nat. Hazards 2017, 87, 1267–1283. [Google Scholar] [CrossRef]
- Guzman, P.; Roders, A.R.P.; Colenbrander, B. Impacts of Common Urban Development Factors on Cultural Conservation in World Heritage Cities: An Indicators-Based Analysis. Sustainability 2018, 10, 853. [Google Scholar] [CrossRef] [Green Version]
- Zhao, Y.; Xiao, L. Analysis on the landsense creation of Chinese classical poetry and mountains-and-waters painting based on landsenses ecology. Int. J. Sustain. Dev. World Ecol. 2020, 27, 292–296. [Google Scholar] [CrossRef]
- Joohyun, L. Western Artists visiting Trading Ports in China: Focusing on Macau, Canton and Hongkong. J. Korean Mod. Contemp. Art Hist. 2014, 28, 113–143. [Google Scholar]
- Cai, Y.A. Cantonese-Style Furniture in Qing Dynasty, 1st ed.; Shanghai Bookstore Publishing House: Shanghai, China, 2001; p. 53. (In Chinese) [Google Scholar]
- Osgood, C.E. The Measurement of Meaning; University Of Illinois Press: Champaign, IL, USA, 1967. [Google Scholar]
- Bradley, M.M.; Lang, P.J. Measuring emotion: The Self-Assessment Manikin and the semantic differential. J. Behav. Ther. Exp. Psychiatry 1994, 25, 49–59. [Google Scholar] [CrossRef]
- Ahmad, S.N.; Laroche, M. How Do Expressed Emotions Affect the Helpfulness of a Product Review? Evidence from Reviews Using Latent Semantic Analysis. Int. J. Electron. Commer. 2016, 20, 76–111. [Google Scholar] [CrossRef]
- Li, C.L.; Li, X.G.; Zhao, W. On the Optimization of Rural Settlement Space Planning Method Based on Semantic Analysis of Ancient Poetry—A Case Study of the Chengdu Plain. Chin. Landsc. Archit. 2020, 36, 76–81. (In Chinese) [Google Scholar] [CrossRef]
- Song, C.R.; Ikei, H.; Igarashi, M.; Takagaki, M.; Miyazaki, Y. Physiological and Psychological Effects of a Walk in Urban Parks in Fall. Int. J. Environ. Res. Public Health 2015, 12, 14216–14228. [Google Scholar] [CrossRef] [PubMed]
- Natori, Y.; Chenoweth, R. Differences in rural landscape perceptions and preferences between farmers and naturalists. J. Environ. Psychol. 2008, 28, 250–267. [Google Scholar] [CrossRef]
- Beza, B.B. The aesthetic value of a mountain landscape: A study of the Mt. Everest Trek. Landsc. Urban Plan. 2010, 97, 306–317. [Google Scholar] [CrossRef]
- Jeon, J.Y.; Jo, H.I. Effects of audio-visual interactions on soundscape and landscape perception and their influence on satisfaction with the urban environment. Build. Environ. 2020, 169, 12. [Google Scholar] [CrossRef]
- Baron, J.S.; Poff, N.L.; Angermeier, P.L.; Dahm, C.N.; Gleick, P.H.; Hairston, N.G.; Jackson, R.B.; Johnston, C.A.; Richter, B.D.; Steinman, A.D. Meeting ecological and societal needs for freshwater. Ecol. Appl. 2002, 12, 1247–1260. [Google Scholar] [CrossRef]
- Kingsford, R.T.; Basset, A.; Jackson, L. Wetlands: Conservation’s poor cousins. Aquat. Conserv. Mar. Freshw. Ecosyst. 2016, 26, 892–916. [Google Scholar] [CrossRef] [Green Version]
- Zhou, H.J.; Shi, P.J.; Wang, J.A.; Yu, D.Y.; Gao, L. Rapid Urbanization and Implications for River Ecological Services Restoration: Case Study in Shenzhen, China. J. Urban Plan. Dev. ASCE 2011, 137, 121–132. [Google Scholar] [CrossRef]
- Fang, X.R.; Fan, F. Hundred Odes of South China Sea; Tai Tung Book Company: Hongkong, China, 1977. (In Chinese) [Google Scholar]
- Qiu, J.C. Antiquities of Canton, 1st ed.; Guangdong People’s Publishing House: Guangzhou, China, 1993; Volume 1, p. 97. (In Chinese) [Google Scholar]
- Guzman, P. Assessing the sustainable development of the historic urban landscape through local indicators. Lessons from a Mexican World Heritage City. J. Cult. Herit. 2020, 46, 320–327. [Google Scholar] [CrossRef]
- Zhu, K.Z. A preliminary study on climate change in China during the last five thousand years. Sci. China 1973, 2, 168–169. (In Chinese) [Google Scholar]
- Ge, Q.S.; Zheng, J.Y.; Fang, X.Q.; Man, Z.M.; Zhang, X.Q.; Zhang, P.Y.; Wang, W.C. Winter half-year temperature reconstruction for the middle and lower reaches of the Yellow River and Yangtze River, China, during the past 2000 years. Holocene 2003, 13, 933–940. [Google Scholar] [CrossRef] [Green Version]
- Ge, Q.S.; Zheng, J.Y.; Hao, Z.X.; Liu, Y.; Li, M.Q. Recent advances on reconstruction of climate and extreme events in China for the past 2000 years. J. Geogr. Sci. 2016, 26, 827–854. [Google Scholar] [CrossRef] [Green Version]
- Wei, Z.D.; Fang, X.Q.; Su, Y. Climate change and fiscal balance in China over the past two millennia. Holocene 2014, 24, 1771–1784. [Google Scholar] [CrossRef]
- Wei, Z.; Fang, X.; Su, Y. A preliminary analysis of economic fluctuations and climate changes in China from BC 220 to AD 1910. Reg. Environ. Chang. 2015, 15, 1773–1785. [Google Scholar] [CrossRef]
- Wei, Z.D.; Rosen, A.M.; Fang, X.Q.; Su, Y.; Zhang, X.Z. Macro-economic cycles related to climate change in dynastic China. Quat. Res. 2015, 83, 13–23. [Google Scholar] [CrossRef]
- Ruan, Y. Guangdong Annals; Shanghai Classics Publishing House: Shanghai, China, 1990; Volume 7. (In Chinese) [Google Scholar]
- Huang, F.Y. Records of Guangzhou City, 1st ed.; Guangdong People’s Publishing House: Guangzhou, China, 1994. (In Chinese) [Google Scholar]
- Barrientos, F.; Martin, J.; De Luca, C.; Tondelli, S.; Gomez-Garcia-Bermejo, J.; Casanova, E.Z. Computational methods and rural cultural & natural heritage: A review. J. Cult. Herit. 2021, 49, 250–259. [Google Scholar] [CrossRef]
- Pham, V.; Nghiem, S.V.; Pham, C.V.; Luu, M.P.T.; Bui, Q.T. Urbanization impact on landscape patterns in cultural heritage preservation sites: A case study of the complex of Hue Monuments, Vietnam. Landsc. Ecol. 2021, 36, 1235–1260. [Google Scholar] [CrossRef]
- Fagan, B. The Little Ice Age: How Climate Made History 1300–1850; Basic Books: New York, NY, USA, 2001. [Google Scholar]
- Zhang, D.D.; Brecke, P.; Lee, H.F.; He, Y.Q.; Zhang, J. Global climate change, war, and population decline in recent human history. Proc. Natl. Acad. Sci. USA 2007, 104, 19214–19219. [Google Scholar] [CrossRef] [Green Version]
- Styers, D.M.; Chappelka, A.H.; Marzen, L.J.; Somers, G.L. Developing a land-cover classification to select indicators of forest ecosystem health in a rapidly urbanizing landscape. Landsc. Urban Plan. 2010, 94, 158–165. [Google Scholar] [CrossRef]
- Weng, Q.H.; Yang, S.H. Managing the adverse thermal effects of urban development in a densely populated Chinese city. J. Environ. Manag. 2004, 70, 145–156. [Google Scholar] [CrossRef] [PubMed]


| Index Attribute | Index | Index Description |
|---|---|---|
| Natural System Index | The width of the Yudai Trench | The width reflects the city’s ability to cope with typhoons and floods. |
| The area of the West Lake | The area is a measure index of the water used for citizens’ living and working requirements and disaster prevention in Guangzhou. | |
| The volume of the Nanhao Trench | The volume is an index of Guangzhou’s ability to store water, replenish water, and deal with disasters such as floods and droughts. | |
| Economic System Index | The scale of Yudai Trench commerce | The index reflects the commercial scale of the core business district of Guangzhou. |
| The number of shops in Gaodi Street | It reflects the economic prosperity of the Yudai Trench historic urban landscape. | |
| Salt storage | It reflects the economic prosperity of the Yudai Trench historic urban landscape. | |
| Quantity of musical instruments produced and sold | It is the index of export trade of the Yudai Trench historic urban landscape | |
| Quantity of Cantonese-style furniture produced and sold | It is the index of wood imports and furniture exports of the Yudai Trench historic urban landscape. | |
| Cultural System Index | The construction scale of Nanyuan Garden | It is the index that can reflect the active degree of literati activities around the Yudai Trench historic urban landscape. |
| The innovation level of musical instruments | It reflects the index of the craft level and the aesthetic level of citizens. | |
| The innovation level of Cantonese-style furniture | It is the index of the culture’s ability to absorb and innovate foreign aesthetic culture and advanced technology. |
| Type of Emotional Vocabulary | Emotional Vocabulary | Level of Semantic Differential |
|---|---|---|
| Direct description | 450 m (150 Zhang) long 1; more than 1550 m (500 Zhang) in width 2 | 5 |
| The west side silted up, leaving only the east side 3; the West Lake shrank in area in the Southern Song Dynasty 4 | 4 | |
| The lake is silting in the throat 5 | 3 | |
| It is just a big pond in the school 6 | 2 | |
| Only a few springs remain 7; only ruined stones remain 8 | 1 | |
| Contextual description | The scenic spots in Guangzhou 9; not as broad as in the Song and Yuan Dynasties 10; take a boat on the lake 11 | — |
| Temperature Change | Natural System | Economic System | Cultural System | |
|---|---|---|---|---|
| Temperature Change | 1.000 | — | — | — |
| Natural System | −0.211 *** | 1.000 | — | — |
| Economic System | −0.483 | 0.197 *** | 1.000 | — |
| Cultural System | −0.427 *** | −0.192 | 0.752 *** | 1.000 |
| Period of Time | 1250—1400 | 1550–1700 | 1800–1950 | |||||||||
|---|---|---|---|---|---|---|---|---|---|---|---|---|
| Temperature Change | Natural System | Economic System | Cultural System | Temperature Change | Natural System | Economic System | Cultural System | Temperature Change | Natural System | Economic System | Cultural System | |
| Temperature Change | 1.000 | - | - | - | 1.000 | - | - | - | 1.000 | - | - | - |
| Natural System | −0.662 *** | 1.000 | - | - | 0.658 *** | 1.000 | - | - | −0.494 *** | 1.000 | - | - |
| Economic System | 0.496 *** | −0.343 *** | 1.000 | - | −0.149 *** | −0.691 *** | 1.000 | - | −0.350 *** | 0.910 *** | 1.000 | - |
| Cultural System | 0.695 *** | −0.933 *** | 0.603 ** | 1.000 | 0.624 *** | 0.041 *** | 0.619 *** | 1.000 | −0.504 *** | 0.944 *** | 0.805 ** | 1.000 |
| Period of Time | Yuan Dynasty and Early Ming Dynasty | Late Ming and Early Qing | Qing Dynasty until the Founding of China | ||||||
|---|---|---|---|---|---|---|---|---|---|
| Decline Period (1250–1300) | Stable Period (1300–1350) | Recovery Period (1350–1400) | Decline Period (1550–1600) | Stable Period (1600–1650) | Recovery Period (1650–1700) | Decline Period (1800–1850) | Stable Period (1850–1900) | Collapse Period (1900–1950) | |
| Width of Yudai Trench | 5 → 4 | 4 | 4 | 4 → 3 | 3 | 3 | 3 | 3 → 2 | 2 → 1 |
| Area of West Lake | 4 | 4 | 4 | 3 | 3 | 3 → 2 | 2 | 2 | 2 → 1 |
| Volume of Nanhao Trench | 5 | 5 | 4 → 2 | 2 | 2 | 2 | 3 → 2 | 2 | 2 → 1 |
| Economic System | 3.6 → 3 | 3 | 3 → 4.4 | 4.4 → 3.6 | 3.6 | 3.6 → 5 | 4.6 → 3.2 | 3.2 | 3.2 → 1.6 |
| Cultural System | 2.3 → 2.67 | 2.67 | 2.67 → 4 | 4.33 → 3 | 3 | 3 → 4 | 4 | 4 → 4.33 | 4.33 → 2 |
Publisher’s Note: MDPI stays neutral with regard to jurisdictional claims in published maps and institutional affiliations. |
© 2021 by the authors. Licensee MDPI, Basel, Switzerland. This article is an open access article distributed under the terms and conditions of the Creative Commons Attribution (CC BY) license (https://creativecommons.org/licenses/by/4.0/).
Share and Cite
Gao, W.; Chen, G.; Jiang, F.; Shen, J.; Wang, Y. To Act or Not to Act: Are Natural Landscapes a Key Force in the Resilience of Historic Urban Landscapes? Sustainability 2021, 13, 10356. https://doi.org/10.3390/su131810356
Gao W, Chen G, Jiang F, Shen J, Wang Y. To Act or Not to Act: Are Natural Landscapes a Key Force in the Resilience of Historic Urban Landscapes? Sustainability. 2021; 13(18):10356. https://doi.org/10.3390/su131810356
Chicago/Turabian StyleGao, Wei, Gengyu Chen, Fanying Jiang, Jiake Shen, and Yuncai Wang. 2021. "To Act or Not to Act: Are Natural Landscapes a Key Force in the Resilience of Historic Urban Landscapes?" Sustainability 13, no. 18: 10356. https://doi.org/10.3390/su131810356
APA StyleGao, W., Chen, G., Jiang, F., Shen, J., & Wang, Y. (2021). To Act or Not to Act: Are Natural Landscapes a Key Force in the Resilience of Historic Urban Landscapes? Sustainability, 13(18), 10356. https://doi.org/10.3390/su131810356