Article

The Field of “Public Health” as a Component of Sustainable Development—Poland Compared to the European Union

by
Agnieszka Strzelecka
Department of Econometrics and Statistics, Faculty of Management, Czestochowa University of Technology, Armii Krajowej 19B, 42-200 Czestochowa, Poland
Sustainability 2021, 13(18), 10351; https://doi.org/10.3390/su131810351
Submission received: 28 July 2021 / Revised: 6 September 2021 / Accepted: 14 September 2021 / Published: 16 September 2021

Abstract

:
The objective of the article is to analyse selected indicators of sustainable development in the field of “public health”, especially those related to health and health-related inequalities. The article focuses on the analysis of indicators in the field of “public health” presented by Eurostat. These indicators were presented in terms of averages and medians. Moreover, the paper indicates the amount of funds allocated for prevention in health care. In addition, the cluster method was used to identify EU countries similar to each other in terms of the leading indicator of sustainable development (SD). The study was conducted using annual data for 2010–2019 for Poland as compared to other EU countries. The study used data from the Eurostat and OECD databases. In almost all of the analysed countries, in relation to the demographic and health situation, there is a close link between the financial situation, health and inequalities in health-related fields. Patients’ sense of safety has decreased in Poland, which is the result of the growing consumption of health services and emerging problems with the availability of health care services as well as environmental pollution. Among others, the percentage of people with health problems and low income has increased. Although the percentage of unmet needs resulting from income inequalities has decreased over the past year in the analysed groups of countries, it is still high in Poland. The low level of expenditure on prevention makes these difficulties even more severe. In summary, capturing changes in indicators describing public health in the context of its impact on sustainable development plays a key role in balancing out inequalities in the EU countries and in managing a common policy.

1. Introduction

The concept of sustainable development is perceived as a determinant of the socio-economic development of countries, which consists of integrating political, economic and social activities while maintaining a natural balance and the sustainability of the basic needs of individual communities or citizens, both of the present generation and future generations [1]. Considering this concept, it is possible to discuss three components of sustainable development—economic component, ecological component, and human component.
The first one refers to the development of the economies of individual countries. This development is intended to reduce the negative effect on the environment. It should be perceived as a multidimensional process and aim at accelerating economic growth, reducing inequalities in every area of life and eradicating poverty. The second one indicates the link between actual economic development and the environment. The ecological development is closely linked to the rights of environmental protection, ecological balance, and is oriented to meet specific practical requirements, such as the protection and renewal of natural resources. The third component takes social interactions, relationships and patterns of human behaviour into account. It is oriented to socio-cultural stability, prevention or treatment of “social diseases”, promotion of education and training, and protection and promotion of human health. In addition, it is clear from the assumptions of sustainable development that this concept can ensure the safe functioning of humans and the environment [2,3].
In the EU sustainable development strategy, under the priority “public health”, the promotion of public health on equal terms and the improvement of protection against health threats was set as objective 3 (Ensuring a healthy life for all people of all ages and promoting well-being) [4,5]. Life expectancy (LY) and healthy life expectancy (HLY) are the most commonly taken into account for monitoring this priority. These variables are usually explained by operational indicators, which are deaths from chronic diseases, suicides, unmet health care needs resulting from income inequalities, and long-term illnesses or health problems [6].
As a rule, the effects of modern health-related hazards are only visible after some time and are mainly related to the existence of social and economic inequalities among members of a society. This is closely related to the possibility of limiting medical consumption or carrying out appropriate pro-health prophylaxis. Taking into account the fact that one of the basic needs of the population is the use of health care, it seems necessary to guarantee the amount of funds required to cover the consumption of medical services, and indirectly guarantee the safety of beneficiaries. This is because it has a significant effect on the management of health care facilities and the provision of medical services to patients and ensuring their safety in this area. For this reason, it is extremely important to draw attention to the risks arising from social conditions or environmental pollution [7]. In addition, COVID-19 and its effect on health inequalities involve a great risk. In addition, COVID-19 and its effects on health inequalities involve great risk, particularly due to the inadequacy of health care systems such as the lack of equipment their adaptation in hospitals and the shortage of medical personnel [8]. The global epidemic threat has led to a rapid increase in the role of health protection and health policy, which has been reflected in contacts between countries [9]. In addition, overcoming problems concerning health [10,11] and living conditions of people with financial difficulties, e.g., in connection with their business activities becomes a priority. Inequalities not only in public health but also in economy are increasing [12,13].
In this context, all international regulations play an important role, for instance the Rio Declaration on Environment and Development from 1992, which clearly indicates the importance of health in the concept of sustainable development. This is true even more as the idea of sustainable development is the basis of a new development paradigm, according to which the socio-economic model is to be based on progress ensuring a better quality of life and protection of the natural environment [5,14]. Therefore, in the context of sustainable development, it is extremely important to consider the Renewed Sustainable Development Strategy of 2006, in which public health is one of the key challenges. The main goal of this challenge is “Promoting public health on equal terms and improving protection against health-related hazards” [15]. Similarly, the promotion of health is an important element of the Europe 2020 strategy—“A strategy for smart, sustainable and inclusive growth”. In this document, “Strengthening health promotion and prevention, reducing social inequalities” is part of the “European Platform against Poverty”, which is an initiative under the priority “Growth Contributing to Social Inclusion”. As part of the above programmes, the task of ensuring economic, social and territorial cohesion is undertaken, through enabling the poor and socially excluded to actively participate in social life [16]. Other important programmes in the Europe 2020 strategy include the following projects: “European Innovation Partnership on Active and Healthy Aging” [17] and “Together for Health” [18]. The first one focuses on increasing the average number of years Europeans live in good health, e.g., by improving health and quality of life, and the second one on promoting health in ageing Europe, protecting citizens against health risks and supporting health systems and new health technologies [6,19].
The above-mentioned projects are closely related to the documents on investing in health care [20]. Investments will relate to the health of the society (primarily its promotion and prevention), minimising health inequalities and combating social exclusion, or maximising the sense of security among patients. Considering public health an aspect of sustainable development, it can be observed that all issues related to the monitoring of sustainable development in the area of current health policy and related factors play an increasingly important role [21,22]. In EU documents, public health matters have become more the subject of common policy.
Taking this into account, an assumption was made that the economic and environmental factors determining public health affect sustainable development in the broadly understood environment, and their monitoring may affect the development of health policy. In this regard, the question arises as to which group of countries Poland should aspire to improve its operational indicators of sustainable development in the field of “public health” and improve expenditure on health prevention.
Therefore, the aim of the article is to assess the progress in the pursuit of sustainable development in the field of public health in three groups: Poland, EU countries (excluding Croatia), and countries belonging to the EU since 2004.

2. Literature Review

Health inequalities are a consequence of social inequalities and their reduction is now becoming a public health priority [23,24,25]. The provision and consumption of health services obliges countries to ensure that the society is able to use medical care and to allocate the appropriate amount of funds for this purpose. This undoubtedly affects the health situation of the population [26], and the latter affects various economic, environmental and health policy factors [27,28]. This is confirmed by various studies showing links between health and economic growth [29,30,31,32]. According to the researchers, the experience of other countries is very helpful here, because it allows for applying solutions in health care in the form appropriate for a given country [33]. In addition, in the process of human capital management in health care organisations, great importance is attached to the global strategy for improving the health of employees [34]. Therefore, cooperation between the institutions to exchange information on how to ensure the best working conditions in a rapidly changing environment is a very important issue [35,36]. Given that the majority of beneficiaries use public health services and that the amount of financial resources allocated from public sources depends mainly on income, it can be assumed that the higher the level of this indicator, the more funds go to the health system [25,37,38], and this translates indirectly into improving the health situation of citizens and their life expectancy [39]. Life expectancy is explained by GDP per capita in approx. 70%, and by health expenditure in approx. 73% [40]. It should be stressed that the percentage of GDP devoted to public health care, including prevention, has a significant effect on ensuring that health needs are met by providers. However, this share varies from country to country [41], being low in the countries of Central and Eastern Europe [42,43], and this is not conducive to addressing social inequalities, including in public health [44]. This makes the connection between health and elements of sustainable development increasingly clear [45]. The SD approach allows for a holistic view of all causes of adverse health effects [46]. The implementation of the sustainable development concept and monitoring of its realisation require clarification of the measurement method and the identification of the measuring instruments [47]. While all researchers agree on the complexity of the sustainable development concept, their approach to the design of SD indicators often differs. Some propose a quantitative expression of these quantities, others recommend constructing indicators according to the principle: from the problem to its solution [48]. Different approaches to the design and reporting of SD indicators mean that there is no common system for these indicators for all countries [49]. However, in order to ensure methodological consistency and international comparability, Eurostat proposed a set of SD indicators [50]. In the field of public health, Eurostat and the European Commission have proposed indicators, six of which relate to health and health inequalities [51]. Their identification is an important factor in addressing health problems, especially since all countries pay great attention to issues related to inequalities in health care [52]. However, capturing these inequalities requires a range of data that is not always available. In addition, there are significant differences in national reporting, particularly in the comparability of the information gathered [53]. However, it was decided to resolve this issue, all the more so because it seeks to deepen (increase) European integration in every sphere of activity, and therefore in health. To this end, it was decided to provide aggregated data in order to improve the comparability of information regarding social inequalities [53].
Sustainable development in public health is most frequently measured by the life expectancy index at birth, which gives some idea of the level of health of the population [54]. In Poland, this indicator is increasing and it is increasingly possible to meet the conviction that old age is an important stage in the individual’s life and contributes to the preparation of various spheres of socio-economic life in the present and future times, especially as the population of older people [55]. The tendency to prolong the life of the population can also be observed around the world [56], whereby health inequalities are most frequently exacerbated. This is mainly due to lower income levels (lower occupational activity), health problems and lower mobility of people [55]. It should be emphasised that demographic changes, including the population ageing, poses a threat to the sustainability of EU health systems, and actions can be taken to address health inequalities linked to social, economic and environmental factors by promoting healthy ageing [57].
As inequalities in access to health services can lead to health deterioration (especially during and after the COVID-19 “era”), countries have taken action for sustainable development. In defining the objectives of the action in the 2030 Agenda, it was pointed out that the public health objective can be achieved through, e.g., more efficient financing of health care [58]. It is the size of the level of health expenditure that primarily describes the efficiency of the health system in each country [59]. Expenditure on preventive health services is of particular importance, as it is its size, which can contribute to reducing the incidence of chronic diseases. However, in this case, health inequalities are not only the result of economic factors, but also of social, environmental and political factors. This is particularly evident during the COVID-19 pandemic [8,60], where differences in household income mean that people are coping very differently with the crisis caused by this infectious disease [61,62]. The pandemic has a negative effect on both public health and the economy. In addition, global environmental governance and the fight against many environmental crises are significantly hampered [63]. The threats posed by the COVID-19 pandemic are a major challenge to achieving the SDGs. According to Kaczmarek, their implementation will, therefore, be difficult, and the real effect of the pandemic will only be seen once it is over [64].
From this point of view, it is extremely important to assess the monitoring of sustainable development, which is often the starting point in the decision-making process in health care. It comes from the fact that the EU emphasises both the responsibility for health and reducing health inequalities. Comparative analyses enable taking corrective measures including a specific path of economic development, emphasising the most important social issues.
Therefore, the following research hypotheses were formulated:
  • The analysis of operational indicators of sustainable development in the field of public health makes it possible to monitor the commitment of countries to improving health and levelling social inequalities that determine the health condition.
  • The results of international comparisons provide information that is a benchmark for the development of the appropriate public health policy in each country.

3. Materials and Methods

In the study, the author uses the currently binding set of sustainable development indicators for the European Union, directly referring to the EU’s Renewed Sustainable Development Strategy. One of the leading indicators here is “Life expectancy average and healthy years”, for which the operational indicator is “Health and health-related inequalities”.
However, due to the complexity of the issue, the study was carried out in two parts. The first one was to monitor the indicator “health and health inequalities”, the second one to show groups of countries where the leading indicator functions in a similar way.
  • Part I
In order to consider the problem of this operational indicator in the area of “public health”, the paper focused on a set of variables describing this indicator. The countries included in the research group are countries belonging to the European Union throughout the duration of the analysis. Due to the different time of accession to the EU and the different level of socio-economic development of countries, the study was conducted for three groups. The first one consists of only one country—Poland. The second one includes all European Union members (excluding Croatia). The third group includes countries that joined the European Union in 2004 and 2007. The data refer to the years 2010–2019.
The arithmetic mean and the median were calculated to highlight the change of the “public health” sustainable development leading indicator. Moreover, the analysis of the number of people suffering from lifestyle diseases depending on the quintile of population income was carried out. The medium-term rate of changes for preventive expenses, the dynamics of air pollution, and noise-related nuisance were determined.
A geometric mean was used to determine the medium-term rate of change. This mean is determined by the following formula:
G = y 2 y 1 . y 3 y 2 .... y n y n 1 n 1 = y n y 1 n 1
where: y—level of the phenomenon in the period t; t = 1, …, n; G—geometric mean.
  • Part II
In this section, the study uses the method of multidimensional statistical analysis, in which the following set of representative characteristics was adopted to assess the similarity and differences between EU countries in terms of years lived in good health:
1.
Economic factors
-
Expenditure on prevention in health care (in USD per PPP per person)
-
Household expenditure in health care (in USD according to PPP per person)
2.
Consumption of medical services
-
Number of medical consultations in health care (number of consultations per person)
3.
Environmental factors
-
Air pollution with PM10 dust (µg/m3)
-
Number of people exposed to noise (percentage of the total number of people)
Each of the variables was given on a quotient scale and was a cumulative value within each country. The study was performed country-by-country, but Portugal and the United Kingdom were not included due to the lack of data on the number of medical consultations in health care.
To research the phenomenon in the last three years of the study, the classification was based on cross-sectional data for 2017–2019. The analysis used the agglomerative hierarchical clustering method (Ward’s method), which allowed for the presentation of the formation of successive clusters of higher and higher orders with specific bond distances. The obtained dendrite made it possible to indicate the similarities and differences between the studied objects from the point of view of the analysed features.
All variables were normalised each year by applying the quotient transformation, and the Euclidean distance was used as the measure of distance [65,66].
The first step of the Ward method is the normalisation. It is applied usually because of the possible scale differences among the variables; thus, the data should be normalised [67]:
z i j = x i j x o j
where: xij—the value of the j-th variable for the i-th unit (i = 1, …, n; j = 1, …(k); xoj—mean value for the j-th variable (reference point); n—number of objects; k—number of variables.
Then, the distance matrix between the countries was determined. To calculate it, a measure of the Euclidean distance was used:
d i h = j = 1 k ( z i j z h j ) 2
where: zij—standardised values of the j-th variable for the i-th object; zhj—standardised values of the j-th variable for the h-th object.
The countries were grouped on the basis of a distance matrix by a method which is characterised by “…the highest efficiency of structure recognition in the data matrix describing the analysed objects…” [66], starting from a single-element cluster, through one that connects the countries which are most similar to each other, and ending with one connecting all the studied objects.
In each part, the information was taken from the websites of Eurostat and OECD. The choice of the study period was decided by the availability of data, and the quantities were given as intensity indicators or converted per person by purchasing power parity (PPP). All studies were performed in Statistica 13.3.

4. Results

To assess the health situation of societies, measures such as life expectancy (LE) and the number of healthy life years (HLY) are mainly used. Both of these indicators make it possible to know indirectly how changing living conditions affect the improvement of health and life expectancy, i.e., how the leading indicator of sustainable development changes.
In Poland, the LE indicator is usually shorter than the EU-27 average, but longer than for the EU-12 countries (Table 1).
Considering the life expectancy of people in the EU-27 countries in all the analysed years, it can be observed that in each case, women lived longer than men by approximately 5.7 years, on average. In the case of the EU-12 countries, this difference was even greater—approx. 7 years. Similarly to the tendencies in the groups described above, also in Poland this difference is in favour of women and was on average 8 years. The smallest difference was visible in 2019 (approx. 7.8 years). Comparing this year and the year immediately preceding, it can be observed that the analysed indicator increased for both Polish women and Poles, but for men, the increase was 0.5% and was 0.3 percentage points higher than that for women. However, in both groups, the majority of people were above the average age, which is not a favourable situation.
In the case of Poland, it can be observed that the indicator fluctuates slightly for life expectancy from year to year.
The situation is a bit different when it comes to living in good health. Among the EU countries, women in Latvia (2013, 2015–2019) have the shortest life, and in Slovakia in the remaining years. The same tendency can be observed for men, except in Latvia for 2013–2019, in 2012 in Estonia, and in the first two years of the study in Slovakia (Table 2).
Based on the information from Table 2, it can be stated that the number of healthy years in Poland showed different trends depending on gender—it was variable among women and rather constant in men. However, over the entire period of the study, year by year, this indicator increased (in both cases it is a slight increase) by approx. 0.4%. In 2019, in Poland, the “advantage” over the countries belonging to the EU-27 groups related only to women and amounted to approx. 1.2 years. The opposite is true for men—for them, the indicator fell by 1.3 years. However, when it comes to the prevalence of people reaching the age above or below the average, a distinction can be made between the analysed groups. The analysis of the situation in the group of the EU-27 countries (negative asymmetry) is different than in the group of “new” countries. The first group is dominated by people for whom HLY is lower than the average, and the second group is dominated by people with the HLY index below the average.
The above indicators are largely based on information on the number and causes of deaths, i.e., negative health measures.
The issue of inequalities in health care is mainly described in relation to mortality rates, taking chronic diseases into account (Table 3). According to WHO, at least 60% of people in the world die of chronic diseases [68], of which 50% occur in people over 70 years of age.
The analysis of Table 3 indicates that, regardless of the country, among all deaths, cardiovascular diseases (over 38%) and cancer (over 24%) were the largest group. The percentage of diabetic patients also increased.
In this context, attention should be paid to the falling number of suicides (Figure 1), which is likely due to greater prevention, including an increasing number of psychological counselling and reporting by health care professionals.
Based on the information from Figure 1, it can be observed that in Poland, the presented share is lower than in the other groups. However, in 2018, as compared to particular countries, Poland recorded a higher index than Italy (5.6 points), Spain (4.1 points), Luxembourg (3.9 points), and Great Britain (3.8 points). This is probably associated with a higher level of health care and greater accessibility to it. In Lithuania, this index is twice as high, which is probably the result of a smaller number of possibilities in covering the basic needs of the society.
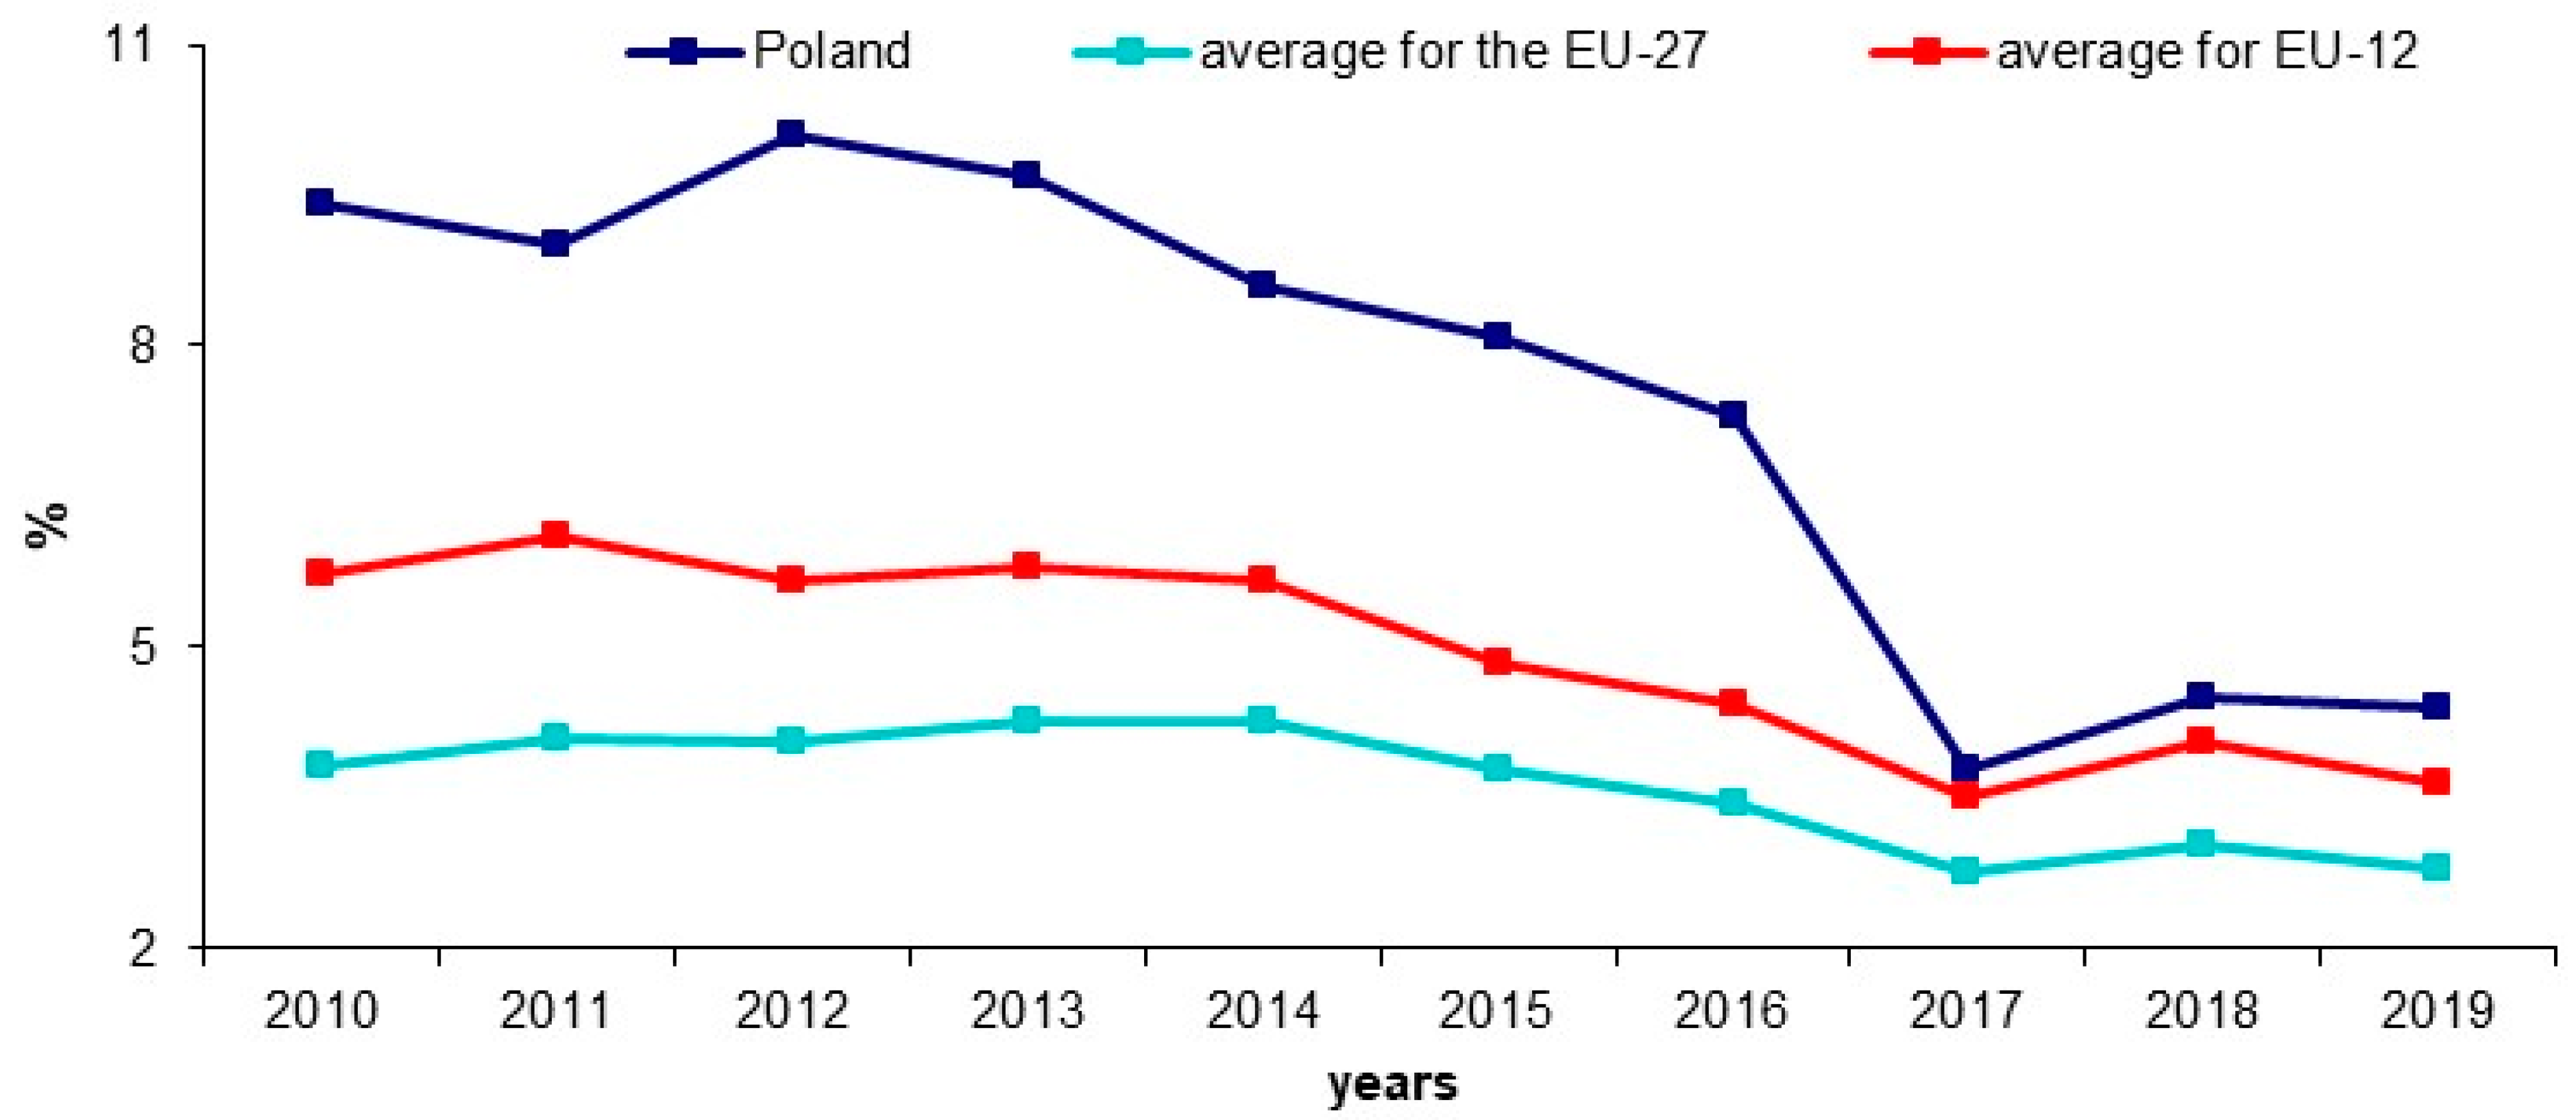
Another very important problem considered in the aspect of public health is unmet health care needs (too expensive or long waiting, too long travel to the place of obtaining health services, lack of knowledge of a good doctor or specialist, fear of being misdiagnosed during treatment, or inappropriate treatment of patients) as a result of income inequality (Figure 2).
Figure 2 shows that since 2013, the percentage of the population having problems with obtaining health care has decreased in all groups, with the exception of 2018. Compared to 2017, the EU average increased by approx. 0.4 percentage points, and the highest increase was noted in Poland, by as much as 0.7 percentage points. In the last year of the research in EU countries from 2004, this was at the level of 3.7%.
The above indicator is closely related to the number of people suffering from inconvenience caused by long-term illness or health problems, the number of which depends on their income. Considering the change in the percentage of the number of people experiencing inconvenience caused by long-term illness or health problems, it can be said that in the entire analysed period (in almost every country studied), there was an increase in this value, with the exception of Spain, Italy, the Netherlands, Romania and Slovenia. Among these countries, the average rate of decrease was in Italy (96.17%), and the lowest in Slovenia (99.94%). The only country with a permanent increase in the percentage of people suffering from diseases or health problems for many years is Lithuania, where this number increased on average by 3.08% and was one of the highest. In Lithuania, the geometric mean was only 0.55 percentage points lower than in the Czech Republic and 0.78 points lower than in Germany. The biggest difference in the medium-term rate of changes was observed between Lithuania and Italy and amounted to approximately 6.9 percentage points. In Poland, fluctuations in this size are noticeable, although in 2019, compared to every other year, the percentage of people surveyed here increased; in the entire period under study, it grew by an average of approx. 1.8%. In 2019, compared to 2018, only in two EU-12 countries, namely in Slovakia and Latvia, a higher level of the average rate of change can be observed compared to Poland.
In 2017–2019, the percentage of these people was the highest among those with the lowest income and decreased along with an increase in income—a higher quintile (Table 4).
The analysis of Table 4 shows that in the case of all groups, until 2016, on average, the most respondents belonged to the second income quintile. In the following years, the situation changed. The highest percentage of the analysed people is visible in the group with the lowest income, which is mainly related to the financial difficulties faced by health care in Latvia and Estonia. In these countries, it is most likely related to the existing solutions in health care and the size and quality of commitments made by governments in terms of the health care. Moreover, in all the analysed groups, people whose percentage was higher than the average were dominant.
Two issues are closely related to health inequalities, namely, exposure to air pollution by particulate matter and excessive noise. According to the author, the production of toxic chemicals is also an important issue, but due to the lack of data on a country-by-country basis, this issue was omitted.
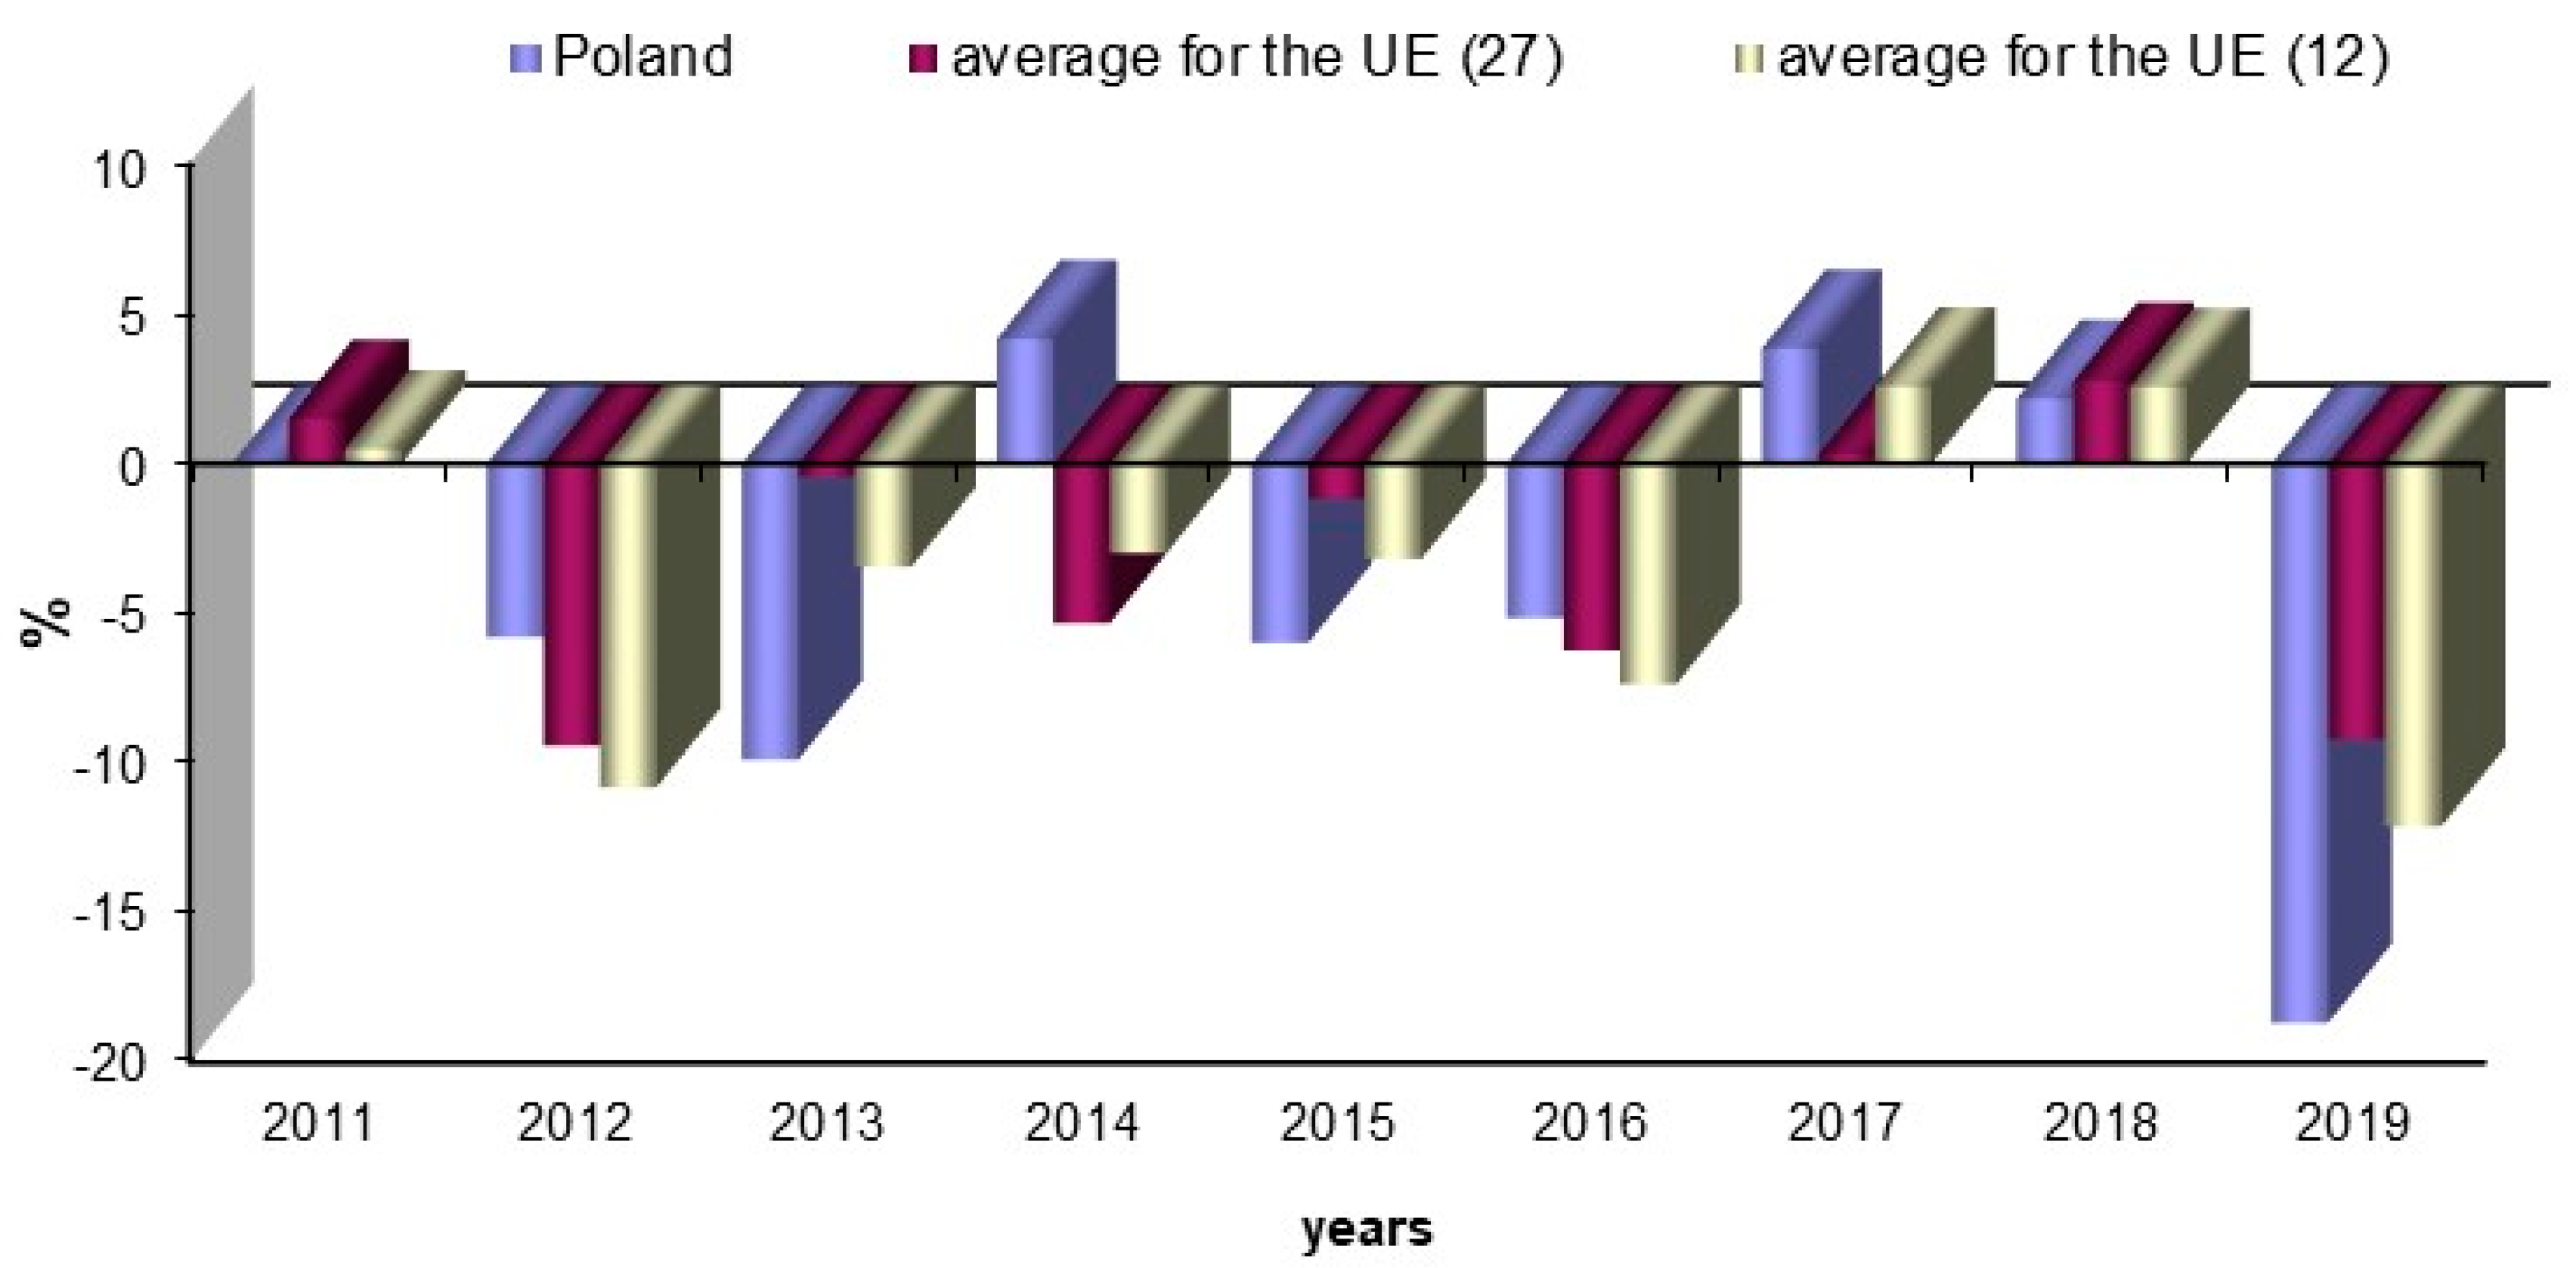
When considering the exposure to air pollution, the above-average impact of PM10 dust was taken into account (Malta was omitted due to lack of data). The analyses show that this exposure decreased in the last year, the highest being in the Czech Republic (21.3%) and Austria (20.2%). In Poland, it ranks fourth in this ranking, just behind Estonia by 0.1 percentage point. Only two countries recorded an increase: Lithuania (9.5%) and Greece (1.5%). In the entire EU, a decline can also be noted, but “only” by 9.2% (Figure 3).
Considering the effect of noise on human health, it can be concluded that, compared to the previous year, the situation (for citizens) is more favourable in the last year of the study than in 2017 and 2018. Nevertheless, the levels of the presented indexes oscillate in the entire studied period, a decreasing trend can be observed. (Table 5). The reason for the decrease in the percentage of people experiencing nuisance in their place of residence could be, e.g., the actual reduction in the noise level, but also a change in the perception of this inconvenience.
In addition to the issues of public health, it is also worth noting the amount of funds allocated in this area, including in relation to GDP (which indirectly affects the quality and quantity of provided services). According to Björnberg, there is a large correlation between the mentioned expenses and the results of treatment [69]. This is why the expenditure on prevention in the area of health care can improve the effects of chronic disease therapy in each of the analysed countries.
Based on Figure 4, it can be observed that in all country groups, health-related expenditure on prevention increased on average from year to year, but the increase is the smallest for the group of “old” EU countries. Considering the above expenditure in constant prices from 2010 according to PPP, it can be observed that the least for this purpose was spent in Slovakia (USD 47.14), and the most was spent in highly developed countries such as Great Britain and Germany. In the latter two countries, in 2013–2019, expenditure on prevention increased on average from year to year by 0.93% and 2.99%, respectively. While in 2019, the most was spent on prevention in Great Britain (0.51% of GDP) and Italy (0.38% of GDP), Great Britain, Germany, and the Netherlands spend the most per person. In 2018, compared to 2010, the following amounts were allocated for prevention per person according to PPP: Great Britain, USD 185.2; Germany, USD 178.9; Sweden, USD 163.6. In Poland, this indicator was approx. 4.1 times lower and amounted to USD 47.2. In 2018, this index was smaller only in three countries: Slovakia, Greece, and Latvia. The difference was USD 31.8, USD 19.5, and USD 0.4, respectively.
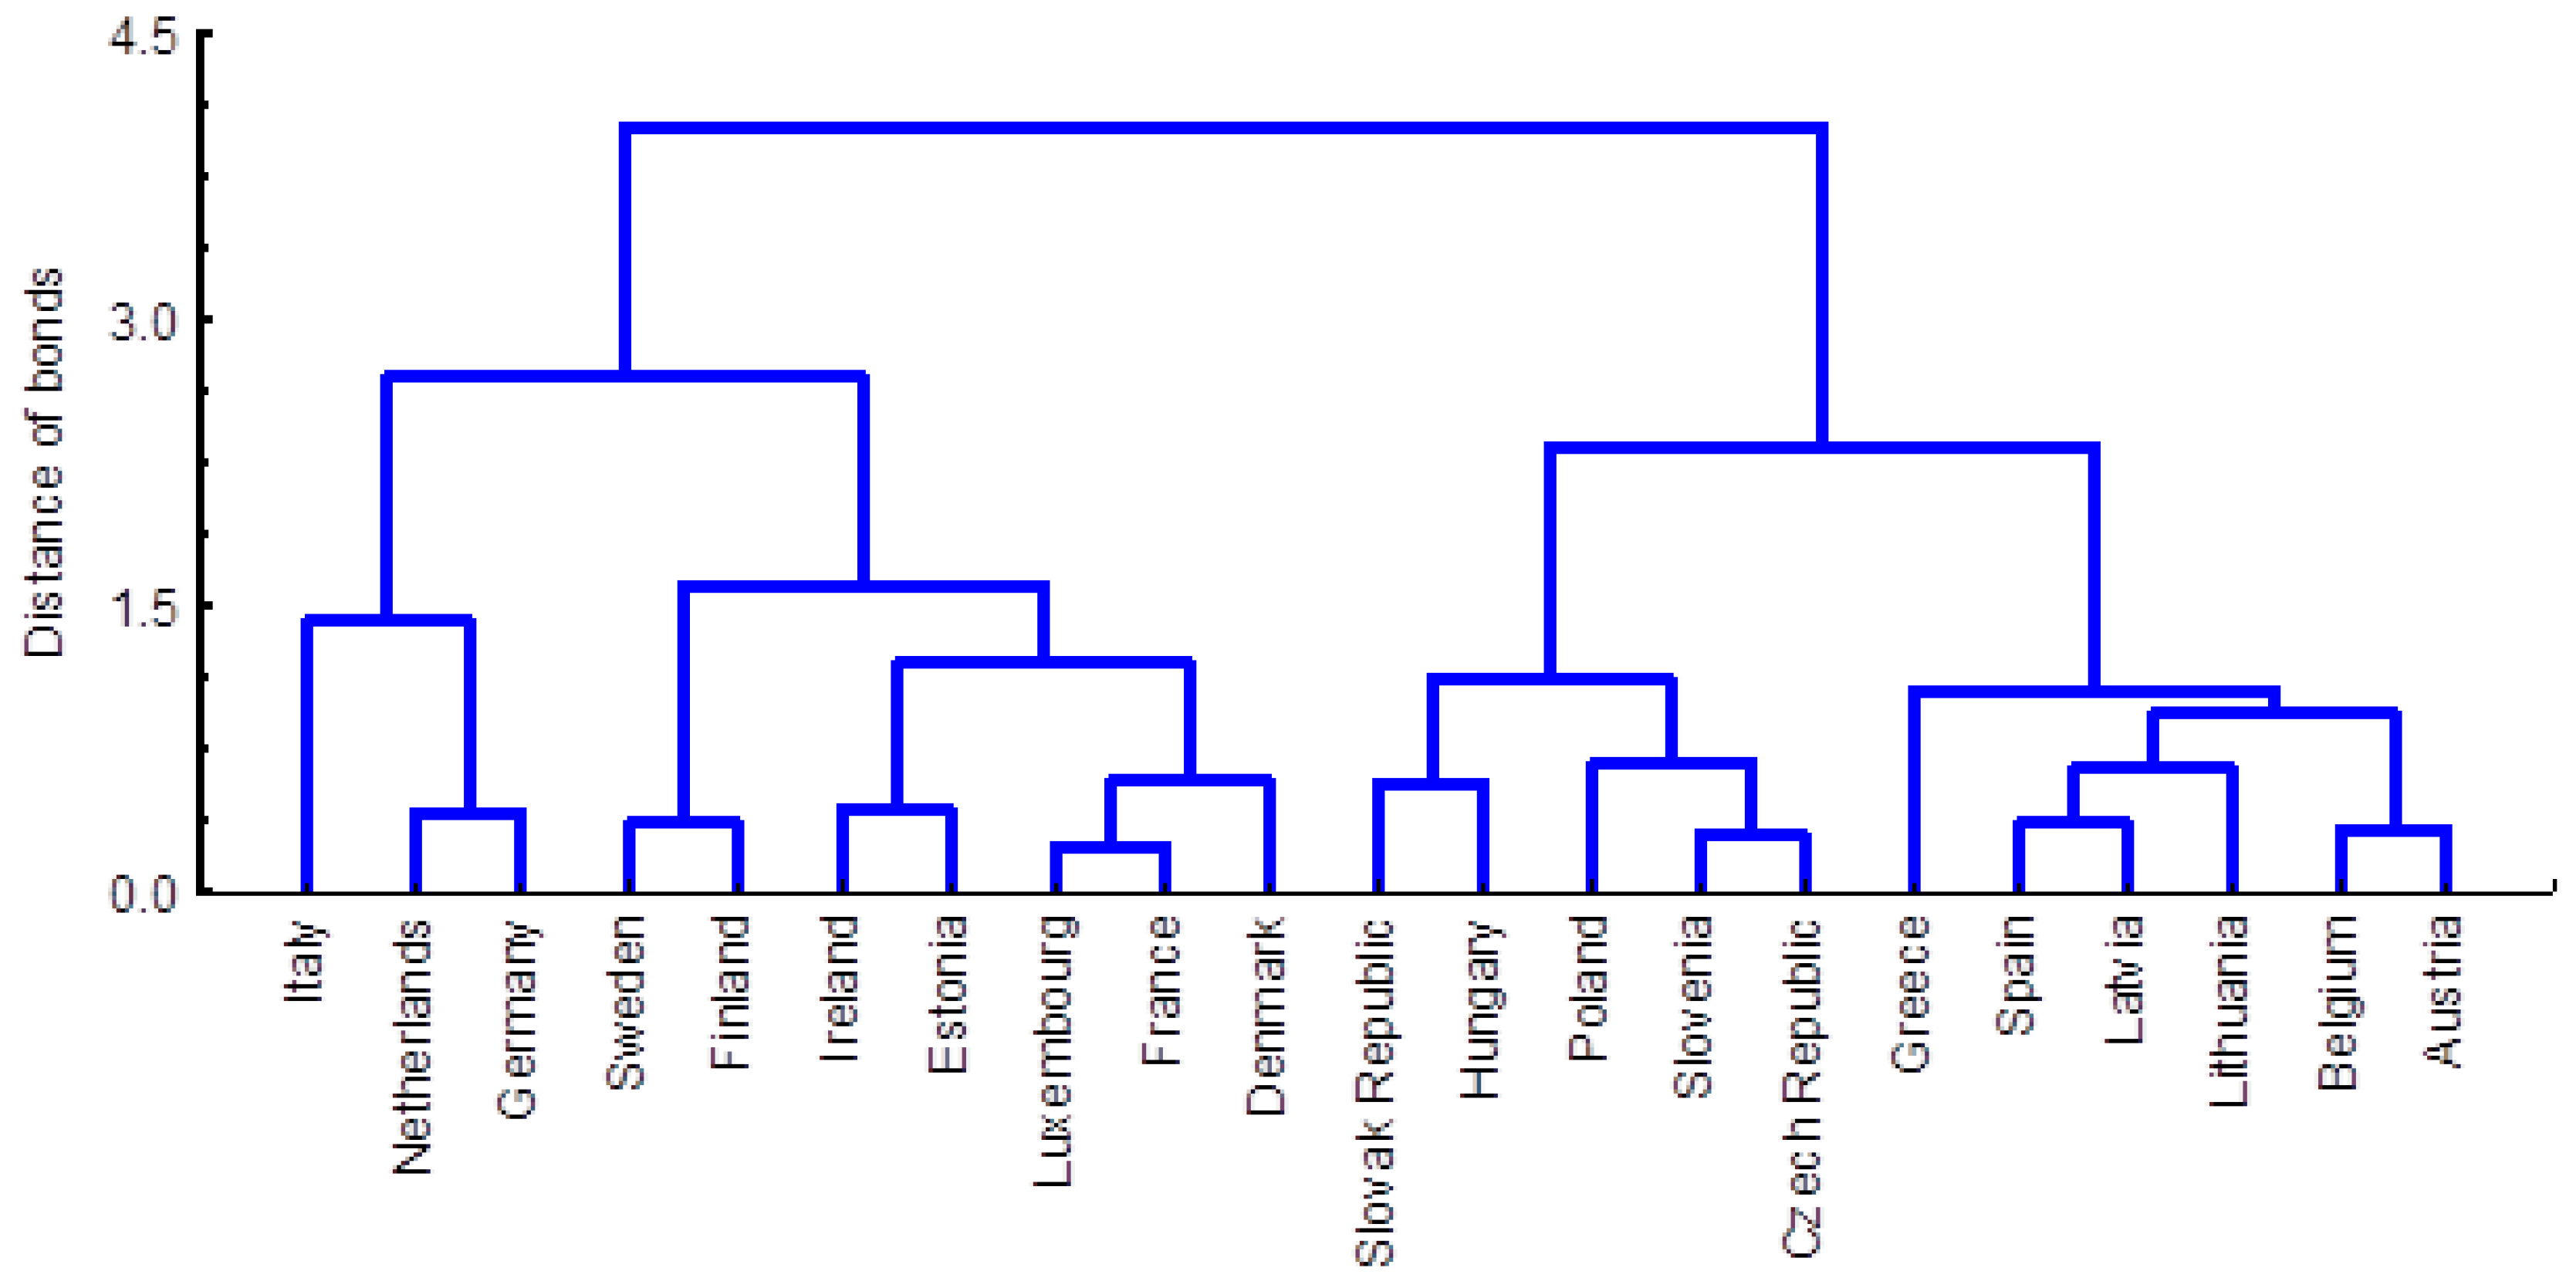
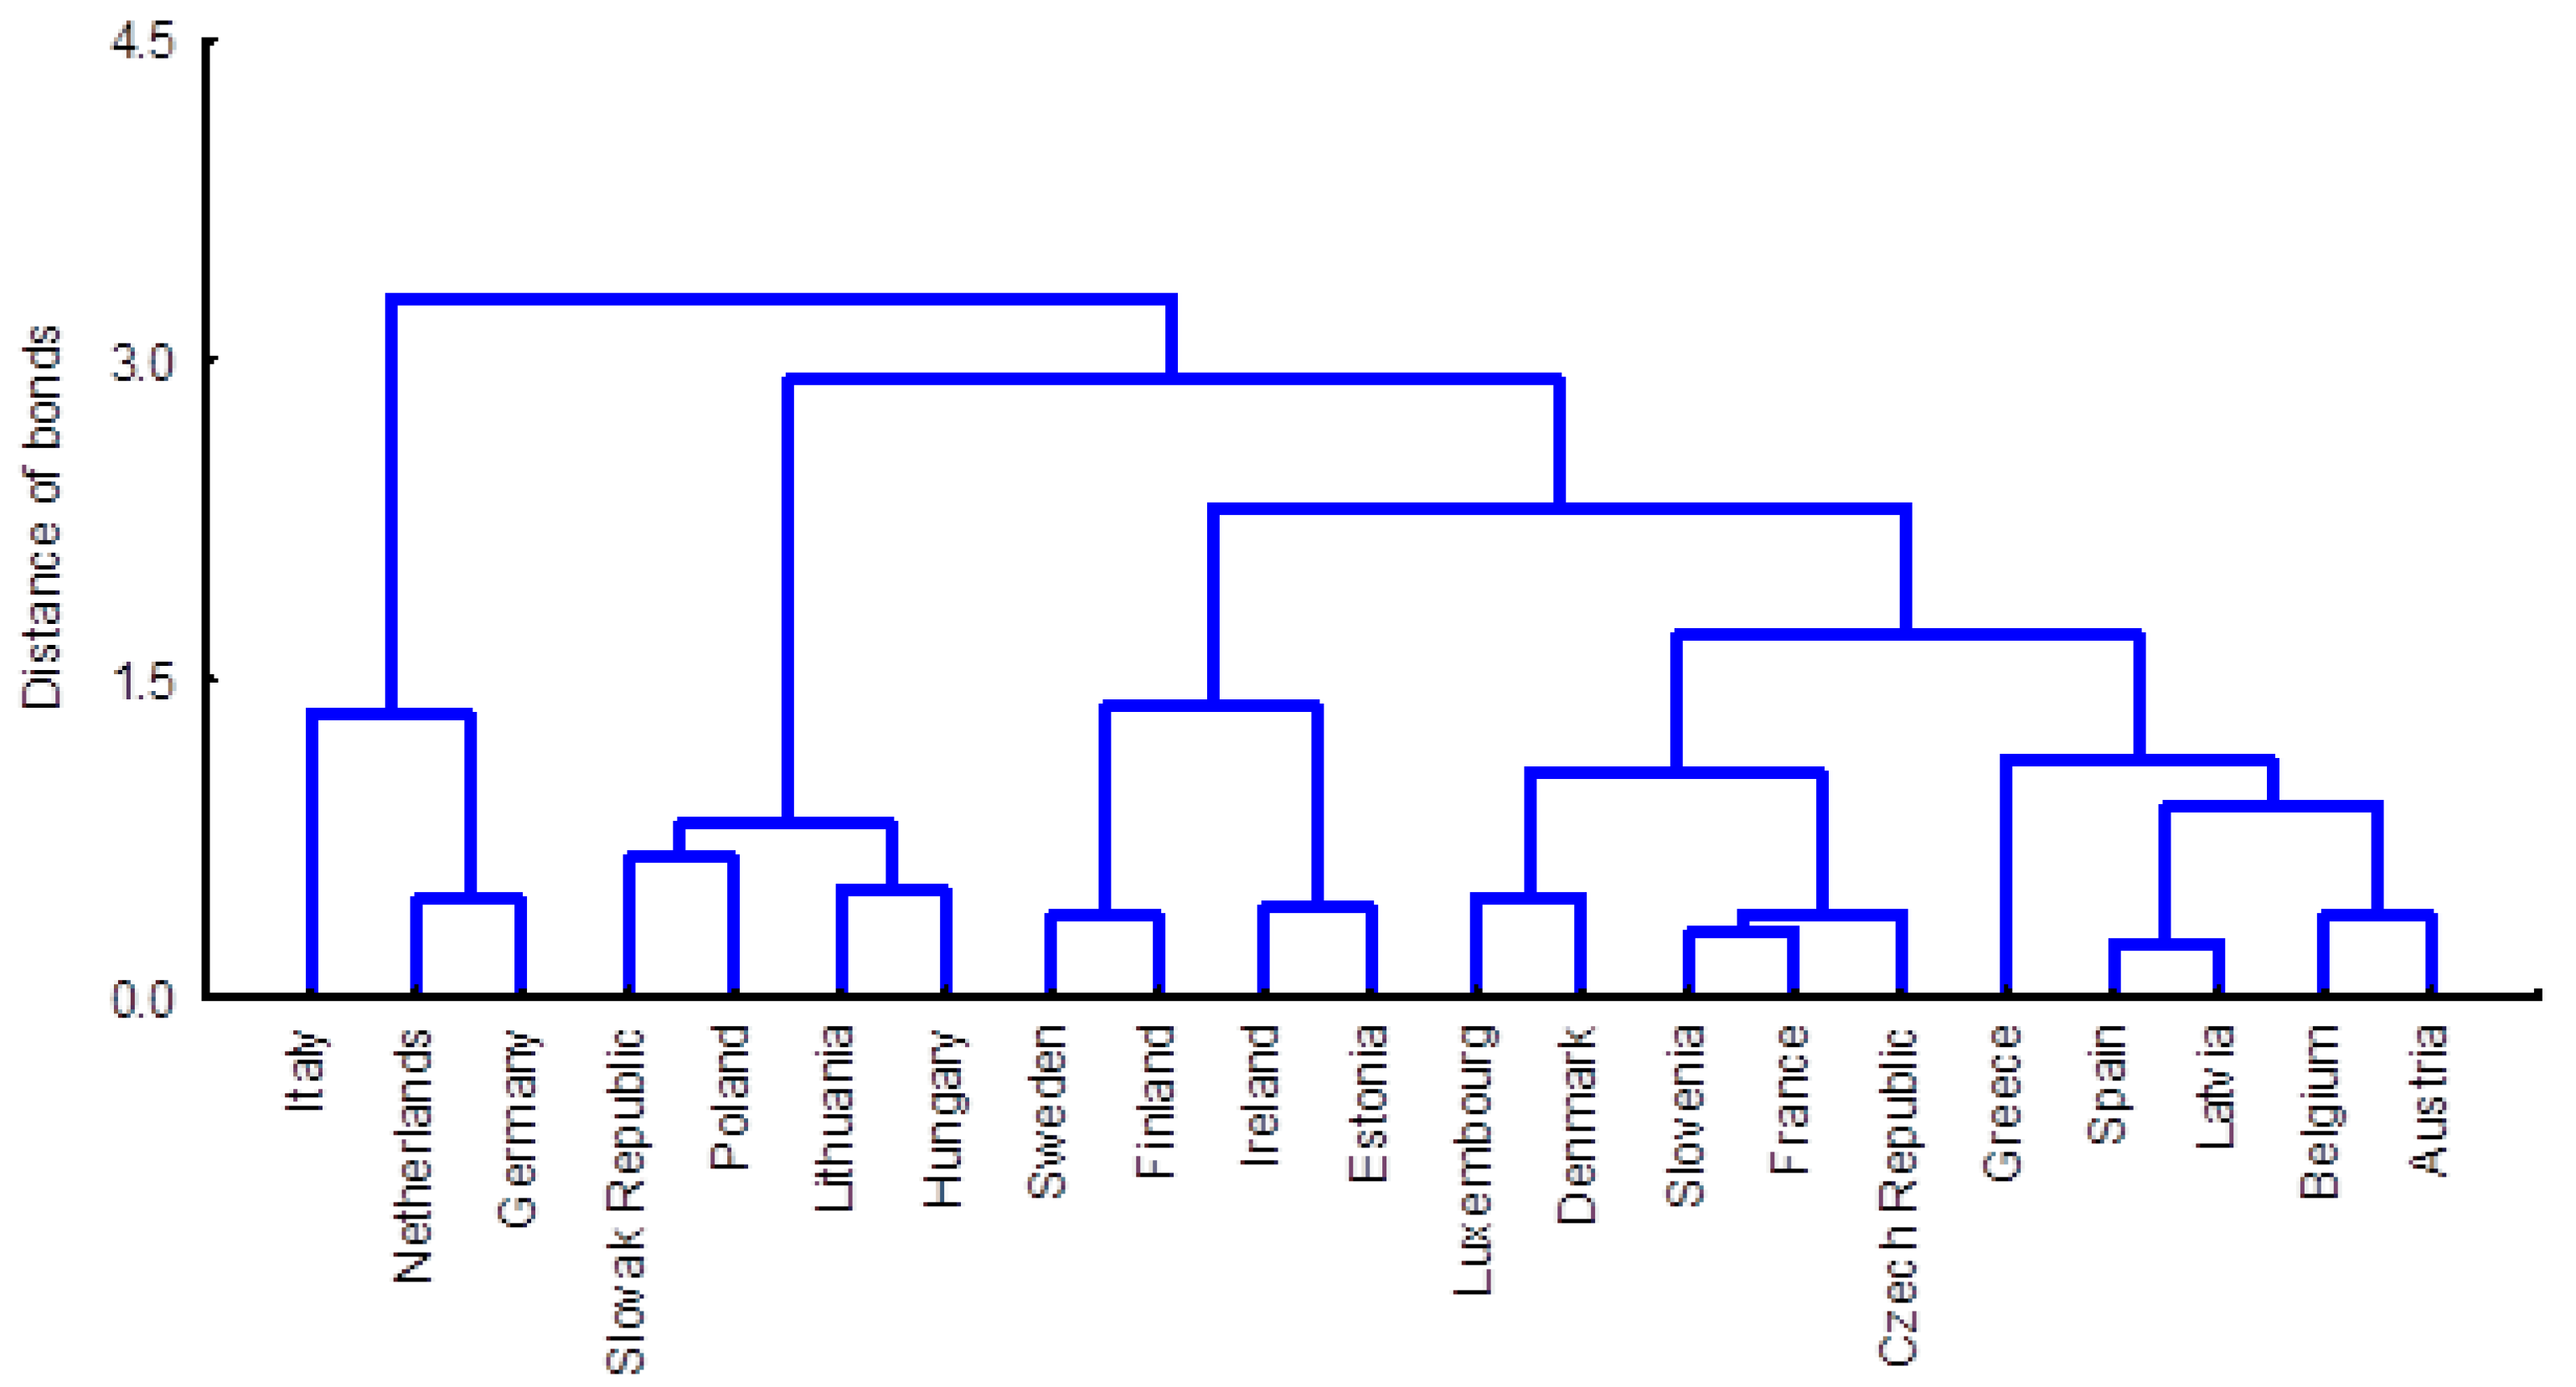
Due to the fact that one of the sustainable development goals [70] is to significantly reduce health inequalities in particular countries and between them, the author attempted to complement the analysis. For this purpose, an assessment related to which countries are similar to each other and which differ in terms of healthy life years was performed, taking the set of analysed characteristics into account. For this study, Ward’s agglomerative method was applied, because most frequently the results of groupings are presented graphically using the so-called connection tree known as a dendrogram (Figure 5, Figure 6 and Figure 7).
The analysis of the leading indicator of sustainable development presented in Figure 5, Figure 6 and Figure 7 shows that at the binding level below 1.5, a different number of groups of countries with a similar structure of healthy life years can be distinguished:
-
Four (2017–2018):
1.
Italy, Netherlands, Germany
2.
Sweden, Finland, Ireland, Estonia, Luxembourg, France, Denmark
3.
Slovakia, Hungary, Poland, Slovenia, Czech Republic
4.
Greece, Spain, Latvia, Lithuania, Belgium, Austria
-
Five (2019):
1.
Italy, Netherlands, Germany
2.
Slovakia, Poland, Lithuania, Hungary
3.
Sweden, Finland, Ireland, Estonia
4.
Luxembourg, Denmark, Slovenia, France, Czech Republic
5.
Greece, Spain, Latvia, Belgium, Austria
Among them, the greatest similarity in terms of the examined features was shown by Slovenia and the Czech Republic (2017), Luxembourg and France (2018), and Spain and Latvia (2019). The distances between these regions were the smallest in terms of the analysed features.
When looking at the position of Poland, it can be observed that it always formed a cluster of the so-called “new” EU countries. In 2017–2018, these included Slovenia and the Czech Republic, while in 2019, it was Slovakia. Poland, although at a different level of connection, is still in the group of countries belonging to the EU since 2004. This shows that it is necessary to compensate for the differences in the sustainable development leading indicator under analysis, especially in relation to the following countries: Italy, Netherlands, Germany, Austria, and Belgium. Poland creates a cluster with these countries only on the penultimate and last level of connection.

5. Discussion

Public health is one of the key challenges for sustainable development, as there is a close link between health and health inequalities. For this reason, great importance is attached to improving health in the context of sustainable development of individual regions. This is due to the fact that health depends on various issues, and so it is related to the environment (e.g., climate, sustainable production and consumption, management of natural resources), economy (e.g., prosperity of the society), and demographic factors. Therefore, cooperation between all public organisations, enterprises, or private institutions is necessary under these conditions [71]. Mutual exchange of information between institutions makes it possible to ensure the safety and health of employees [72], more so as changes in the structure of societies characterise all countries. The continuously aging population has serious consequences for the strategy of sustainable development, especially in terms of the economy. The result is that Europe will become the oldest continent [73]—along with the increase in life expectancy, it is predicted that in the next 50 years, the number of people over 60 will increase 5 times [74], and in 2050, these people will constitute every fifth inhabitant of the Earth [75,76]. This phenomenon is favoured by the improvement of nutrition, living conditions, and changing the mentality of societies, which translates into increased care for one’s health, greater detection and treatment of diseases, as well as better hygiene in the place of residence and work. In Poland, there was an increase in the demand for medical services and goods, which so far did not enjoy much or any interest on the part of recipients. Moreover, the approach of Polish society to taking care of their own health and preventive health care has changed positively. Such a change certainly caused an increase in medical consumption, and thus an increase in the proposed medical services (higher standards and the use of new technologies). In addition, the conviction that having a private health policy always guarantees quick and high-quality health care services is also of great importance, and this is essential for working people who (generally) do not have time to wait for visits to doctor’s offices. Such a tendency is visible especially among women, which translates into the level of the HLY index, which can be explained by the growing number of elderly and disabled people, underfunding of the health system, ineffectiveness in the activities of medical entities, and large inequalities in access to health care.
However, due to demographic changes, the material situation of elderly or disabled people and their increasing share in the consumption of health services should be taken into account [77,78]. In their case, the amount of the illness or retirement pension received is essential, and this translates into the place of the benefit. When observing the changes in the age structure of the population, it can be concluded that in the future, in line with the levelling of health inequalities, changes in the organisation of health care will be necessary [79,80,81]. The new solutions are to increase the safety of patients with regard to the possibility of using medical services.
Although prevention in groups of people suffering from serious chronic diseases (e.g., cancer, cardiovascular diseases) is at an increasing level, environmental pollution and the use of chemicals in food products contribute to the increase in mortality from these diseases. Although the mortality rates resulting from chronic diseases vary from country to country, the rates indicating the percentage of deaths of a particular disease in the total number of deaths have changed much in none of them (in some countries, it does not change at all) [41,82]. Therefore, it seems that the decline in mortality rates due to chronic diseases can be explained by a higher level of service provision, including the use of new medical technologies [83,84,85] and greater public awareness in this regard.
The increase in the ratio of unmet needs in Poland can be explained by the economic growth observed in recent years and the improvement (too slow and insufficient in relation to the needs) in access to health care. In addition, it should be remembered that there is a large variation in the income of the population and the organisation or financing of health care in each country [86]. This is confirmed by the fact that in Poland, one of the most frequently reported unmet needs is the waiting time for a medical service and limitations in the population’s earnings, while in Latvia, this variation is confirmed by excessive payments for health services in relation to the public’s population’s earnings.
Therefore, there is no doubt that the consumption of medical services is financed from public funds. The differences in the amount allocated to prevention in Poland and other EU countries result from large discrepancies in the amount of expenditure on health protection, and thus on prevention [87]. The society’s needs for health care consumption are increasing, and this is closely related to aging populations. In this case, the growing number of elderly and disabled people translates into greater health needs—there are more and more elderly people, and fewer people able and willing to pay health insurance contributions [79,88,89]. In terms of the economy, problems are mainly related to the increasingly smaller resources of the workforce, with simultaneous increase in the number of economically inactive people requiring very intensive medical care.
In Poland, due to the lack of a comprehensive, coherent, and efficient health prophylaxis system and the low level of funds allocated for this purpose, it is difficult to assess preventive programmes, especially their impact on the health of the population.
However, a comparison of Poland to other EU countries may contribute to achieving the sustainable development goals, e.g., by reducing health inequalities [90]. The European Union’s strategy for sustainable development can guide the actions of international and national institutions, especially in terms of poverty reduction and social inclusion. According to the author, monitoring of sustainable development indicators in public health is now very important in investigating the progress in the field of public health, the environment, and economic factors. This is crucial, all the more so since public health issues and basic measures for assessing the health situation of the population are important in the EU strategy. The presented comparisons can be used to assess and develop new solutions in the field of public health at the local, national, and international level. The analysis of expenditure on preventive health is very important, as this expenditure constitutes an increasingly important part of GDP, and this indirectly improves the health of the society. To conclude, the difficulties mentioned here are the reasons why special attention should be paid to the issues of public health in strategic documents of the European Union relating to the matters regarding sustainable development.

6. Conclusions

The presented comparative analysis of public health showed that, regardless of the groups created, there is a growing tendency in the studied countries of the European Union when it comes to life expectancy, which confirms the commonly observed demographic changes. Due to the fact that women pay more attention to caring for their own health, their advantage over men (when it comes to continuing life and living in good health) is significant. This is especially true for people with disabilities or chronic diseases, which is a non-advantageous situation, mainly from the point of view of the amount of household income.
Moreover, based on the presented research results, it can be concluded that along with the emerging problems in obtaining income at a satisfactory level for people, there are limitations in access to medical care, which reduces their sense of security. It manifests itself in a large percentage of the population with health problems and low income.
Moreover, air pollution with dust and high noise has have a significant impact on the health of the society. Both variables have a significant effect on the emergence or aggravation of numerous diseases, and thus may become the cause of serious problems that could prevent further professional work. In 2019, both indicators, as a rule in the analysed countries, fell, but earlier, they fluctuated. Compared to the previous year, in Poland, there was an increase in 2018 and a decrease in 2019. If this tendency continued, we could talk about an optimistic situation.
Based on the information provided by the dendrogram, it may be tempting to conclude that when all countries are considered together, the disparity between countries is reduced and, consequently, the distance between them is shortened. This is indicated by the fact that over the years, all countries form a final cluster at an ever-lower level (the last link was established in 2017 at the level of approx. 4.17, and two years later, it was approx. 3.28). It can be concluded from the analysis that the groups created and listed on the dendrograms consist of countries with a similar level of expenditure on health care, quality of life or exposure to factors hazardous to the health of the society. Therefore, one may say that the analysed indicator in the field of “public health” requires verification of the health policy and the prevention of environmental pollution as well as management of environmental resources in line with the principle of sustainable development. This will be a long-term process and its results will certainly depend on the level of economic development, more so as the functioning of health care as a public sector depends on the state of the economy and the policies pursued by the government. At present, there are no significant changes in the allocation of resources in the health systems of different countries, and yet health inequalities are the result of an uneven distribution of health resources. While there are transformations in the health sectors, they are insufficient, especially in the context of reducing health inequalities in all areas and in all countries. Although GDP per capita and the life expectancy index are increasing, in Poland, for example, there has been no significant optimisation of the resources used to provide benefits. Therefore, in trying to improve the functioning of health systems, the state of health of the population, the quality of care, and patient satisfaction, it is necessary to compare the organisation and financing of health care. Besides, it should be remembered that demographic, institutional, epidemiological, and financial factors have a strong impact on people involved in the management of therapeutic entities.
Summing up, the general conclusion that can be drawn from the analysis of the presented indicators comes down to the statement that the situation is not satisfactory (e.g., lower HLY, low expenditure on prevention). Therefore, it seems necessary to verify the social policy, including the health policy, and to intensify efforts to achieve sustainable development in the area of public health in the European Union.
However, the author would like to emphasise that the presented analyses may constitute the starting material for further research on sustainable development indicators in the field of “public health”, especially in such a dynamically changing environment. The current study was limited due to the availability of data, as information was sought from one, possibly two, sources. In the opinion of the author, it is also necessary to include a greater number of variables in the analyses to make it possible to assess the actual progress in equalising the differences in health policy between countries. Further research should also include an assessment of the achievement of public health objectives in the context of environmental risks and the fight against poverty, especially in the era of the COVID-19 pandemic.

Funding

This research received no external funding.

Data Availability Statement

Publicly available datasets were analyzed in this study. This data can be found here: www.oecd.org and https://ec.europa.eu/eurostat/data/database, accessed on 15 September 2021.

Conflicts of Interest

The author declares no conflict of interest.

References

  1. The Act of 27 April 2001 Environmental Protection Law. J. Laws 2001, 62, 627.
  2. Kozaczyński, W. Sustainable development and human safety. Bezpieczeństwo Teor. Prakt. 2012, 4, 75–83. [Google Scholar]
  3. Misztal, P. Sustainable Development and Quality of Life in Poland Compared to other OECD Member Countries. Eur. Res. Stud. J. 2021, 24, 663–675. [Google Scholar] [CrossRef]
  4. Sulmicka, M. Public health in the light of sustainable development strategy monitoring indicators. Polityka Społeczna 2010, 11–12, 5–11. [Google Scholar]
  5. United Nations. The Sustainable Development Agenda—United Nations Sustainable Development. Available online: https://www.un.org/sustainabledevelopment/development-agenda/ (accessed on 10 October 2020).
  6. Mazur-Wierzbicka, E. Public health as the element of sustainable development–The comparative analysis. Poland against the background of the European Union. Studia Ekon. Zesz. Nauk. 2017, 310, 53–68. [Google Scholar]
  7. Roorda, N.; Corcoran, P.B.; Weakland, J.P. Fundamentals of Sustainable Development. 2012. Available online: https://sustainabledevelopment.un.org/sdgs (accessed on 20 August 2021).
  8. Iwuoha, J.C.; Jude-Iwuoha, A.U. Covid-19: Challenge to SDG and Globalization. Electron. Res. J. Soc. Sci. Humanit. 2020, 2, 103–115. [Google Scholar]
  9. Orłowska, J.; Pawłowska, Z.; Rösler, J. The European Cooperation and Competition within Health Policies during the COVID-19 Pandemic. Available online: https://wnpid.amu.edu.pl/__data/assets/pdf_file/0031/217489/6.-Orlowska,-Pawlowska,-Rosler,-Europejska-wspolpraca-i-rywalizacja-w-zakresie-polityk-zdrowotnych-w-dobie-pandemii-COVID-19.pdf (accessed on 19 August 2021).
  10. Gabrijelcic, M. COVID-19. Available online: https://eurohealthnet.eu/COVID-19 (accessed on 18 August 2021).
  11. Stafford, H. Even if You are Virus-Free, COVID-19 is Affecting Your health. Here’s what to Do. Available online: https://scopeblog.stanford.edu/2020/03/13/even-if-you-are-virus-free-covid-19-is-affecting-your-health-heres-what-to-do/ (accessed on 18 August 2021).
  12. Bergamini, E. How COVID-19 is Laying Bare Inequality. Available online: https://www.bruegel.org/2020/03/how-covid-19-is-laying-bare-inequality/ (accessed on 18 August 2021).
  13. Blundell, R.; Costa Dias, M.; Joyce, R.; Xu, X. Covid-19 and Inequalities. Available online: https://www.ifs.org.uk/inequality/covid-19-and-Inequalities/ (accessed on 18 August 2021).
  14. Tsalis, T.A.; Malamateniou, K.E.; Koulouriotis, D.; Nikolaou, I.E. New challenges for corporate sustainability reporting: United Nations’ 2030 Agenda for sustainable development and the sustainable development goals. Corp. Soc. Responsib. Environ. Manag. 2020, 27, 1617–1629. [Google Scholar] [CrossRef]
  15. Council of the European Union. Renewed EU Sustainable Development Strategy, Bruksela 2006, 26 June 2006, 10917/06. Available online: https://data.consilium.europa.eu/doc/document/ST-10917-2006-INIT/en/pdf (accessed on 6 July 2021).
  16. The Europa 2020 Strategy Indicators. Available online: https://stat.gov.pl/cps/rde/xbcr/gus/POZ_Wskazniki_Europa2020.pdf (accessed on 1 July 2021).
  17. European Commission. Taking forward the Strategic Implementation Plan of the European Innovation Partnership on Active and Healthy Ageing, Communication from the Commission to the European Parliament and the Council, Brussels 2012, COM 83 final. Available online: https://eur-lex.europa.eu/LexUriServ/LexUriServ.do?uri=COM:2012:0083:FIN:EN:PDF (accessed on 6 July 2021).
  18. European Commission. Together for Health: A Strategic Approach for the EU 2008–2013, Commission of the European Communities, Brussels 2007, COM 630 Final. Available online: https://ec.europa.eu/commission/presscorner/detail/en/IP_07_1571 (accessed on 6 July 2021).
  19. Helbostad, J.L.; Vereijken, B.; Becker, C.; Todd, C.; Taraldsen, K.; Pijnappels, M.; Aminian, K.; Mellone, S. Mobile Health Applications to Promote Active and Healthy Ageing. Sensors 2017, 17, 622. [Google Scholar] [CrossRef] [PubMed]
  20. European Commission. Investing in Health—Commission Staff Working Document, Commission Staff Working Document Social Investment Package; European Commission: Brussels, Belgium, 2013; Available online: https://ec.europa.eu/health/sites/default/files/policies/docs/swd_investing_in_health.pdf (accessed on 6 July 2021).
  21. Bornemann, B.; Weiland, S. The UN 2030 Agenda and the Quest for Policy Integration: A Literature Review. Politics Gov. 2021, 9, 96–107. [Google Scholar] [CrossRef]
  22. Sherman, J.D.; Thiel, C.; MacNeill, A.; Eckelman, M.J.; Dubrow, R.; Hopf, H.; Lagasse, R.; Bialowitz, J.; Costello, A.; Forbes, M.; et al. The Green Print: Advancement of Environmental Sustainability in Healthcare. Resour. Conserv. Recycl. 2020, 161, 104882. [Google Scholar] [CrossRef]
  23. Wypych-Ślusarska, A.; Głogowska-Ligus, J.; Słowiński, J. Social determinants of health inequalities. Nurs. Public Health 2019, 9, 229–236. [Google Scholar] [CrossRef]
  24. Mackenbach, J.P.; Valverde, J.R.; Artnik, B.; Bopp, M.; Brønnum-Hansen, H.; Deboosere, P.; Kalediene, R.; Kovács, K.; Leinsalu, M.; Martikainen, P.; et al. Trends in health inequalities in 27 European countries. Proc. Natl. Acad. Sci. USA 2018, 115, 6440–6445. [Google Scholar] [CrossRef] [PubMed] [Green Version]
  25. Rokicki, T.; Perkowska, A.; Ratajczak, M. Differentiation in Healthcare Financing in EU Countries. Sustainability 2020, 13, 251. [Google Scholar] [CrossRef]
  26. Singh, S.R. Public Health Spending and Population Health. Am. J. Prev. Med. 2014, 47, 634–640. [Google Scholar] [CrossRef] [PubMed]
  27. Kiselakova, D.; Stec, M.; Grzebyk, M.; Sofrankova, B. A Multidimensional Evaluation of the Sustainable Development of European Union Countries—An Empirical Study. J. Compet. 2020, 12, 56–73. [Google Scholar] [CrossRef]
  28. Zakrzewska, B. Sustainable development and quality of life. Autobus Tech. Eksploat. Syst. Transp. 2019, 22, 38–41. [Google Scholar] [CrossRef]
  29. Bloom, D.E.; Canning, D.; Graham, B.S. Longevity and Life-cycle Savings. Scand. J. Econ. 2003, 105, 319–338. [Google Scholar] [CrossRef] [Green Version]
  30. Alsan, M.; Bloom, D.E.; Canning, D. The effect of population health on foreign direct investment inflows to low- and middle-income countries. World Dev. 2006, 34, 613–630. [Google Scholar] [CrossRef]
  31. Sala-i-Martin, X.; Doppelhofer, G.; Miller, R.I. Determinants of long-run growth: A Bayesin averaging of classical estimates (BACE) approach. Am. Econ. Rev. 2004, 94, 813–835. [Google Scholar] [CrossRef] [Green Version]
  32. Jakubowska, A.; Horváthová, Z. Economic Growth and Health: A Comparative Study of the EU Countries. Econ. Sociol. 2016, 9, 158–168. [Google Scholar] [CrossRef] [Green Version]
  33. Toader, E.; Firtescu, B.-N.; Oprea, F. Determinants of Health Status and Public Policies Implications—Lessons for Romania. Transylv. Rev. Adm. Sci. 2017, 52, 128–147. [Google Scholar] [CrossRef] [Green Version]
  34. Niciejewska, M.; Kiriliuk, O. Occupational health and safety management in “small size” enterprises, with particular emphasis on hazards identification. Prod. Eng. Arch. 2020, 26, 195–201. [Google Scholar] [CrossRef]
  35. Machado, C.M.L.; Scavarda, A.; Kipperc, L.M.; Santad, R.; Ferrer, M. Sustainability at the Healthcare Organizations: An Analysis of the Impact on the Environment, Society and Economy. Chem. Eng. Trans. 2015, 45, 727–732. [Google Scholar] [CrossRef]
  36. Sakharina, I.K.; Kadarudin, K.; Patittingi, F.; Hasrul, M.; Latif, B.; Palutturi, S. The impact of green human resource practices on environmental performance. Pol. J. Manag. Stud. 2020, 22, 470–486. [Google Scholar] [CrossRef]
  37. Łyszczarz, B.; Nojszewska, E. Determinants of health care expenditure in Europe. Rocz. Kol. Anal. Ekon. Szkoła Główna Handlowa 2015, 39, 183–197. [Google Scholar]
  38. Piekut, M. Health care expenditure in households—International comparison. Ekon. Zarządzanie 2014, 6, 79–96. [Google Scholar] [CrossRef]
  39. Nowak, W. Macroeconomic Determinants of Life Length. Available online: http://repozytorium.uni.wroc.pl/Content/118591/PDF/01_03_W_Nowak_Makroekonomiczne_uwarunkowania_dlugosci_zycia.pdf (accessed on 20 August 2021).
  40. Ryć, K.; Skrzypczak, Z. Epidemic indicators and their economic determinants. In Health Care in the World; Ryć, K., Skrzypczak, Z., Eds.; LEX a Wolters Kluwer Business: Warsaw, Poland, 2011; pp. 19–48. [Google Scholar]
  41. OECD Home Page. Available online: www.oecd.org (accessed on 15 June 2021).
  42. Faliński, P. Investment risk management based on quotations of oil companies, oil and dollar. Zesz. Nauk. Uniw. Przyr. Humanist. Siedlcach Ser. Adm. Zarządzanie 2021, 53, 37–45. [Google Scholar] [CrossRef]
  43. Tambor, M.; Klich, J.; Domagała, A. Financing Healthcare in Central and Eastern European Countries: How Far Are We from Universal Health Coverage? Int. J. Environ. Res. Public Health 2021, 18, 1382. [Google Scholar] [CrossRef] [PubMed]
  44. Miladinov, G. Socioeconomic development and life expectancy relationship: Evidence from the EU accession candidate countries. Genus 2020, 76, 1–20. [Google Scholar] [CrossRef]
  45. Aftab, W.; Siddiqui, F.J.; Tasic, H.; Perveen, S.; Siddiqi, S.; Bhutta, Z.A. Implementation of health and health-related sustainable development goals: Progress, challenges and opportunities—A systematic literature review. BMJ Glob. Health 2020, 5, e002273. [Google Scholar] [CrossRef]
  46. Zalewska, M. Limitations of the set of public health indicators monitored in the context of sustainable development. Probl. Zarz. 2015, 13, 247–260. [Google Scholar] [CrossRef]
  47. Bluszcz, A. Methods of evaluation of the level of sustainable development—Poland on the background of the European Union. Sci. Pap. Silesian Univ. Technol. Organ. Manag. Ser. 2017, 2017, 35–44. [Google Scholar] [CrossRef]
  48. Bal-Domańska, B.; Bieńkowska, A. Sustainable development in documents of Eurostat and the Polish Central Statistical Office. Śląski Przegląd Stat. 2014, 12, 225–235. [Google Scholar] [CrossRef]
  49. Teneta-Skwiercz, D. The sustainable development measurement indicators—Poland against the background of the European Union countries. Pr. Nauk. Uniw. Ekon. Wrocławiu 2018, 516, 121–132. [Google Scholar] [CrossRef]
  50. Urbaniec, M. The sustainable development measurement system in the European Union. Acta Univ. Lodz. Folia Oeconomica 2015, 2, 147–163. [Google Scholar] [CrossRef]
  51. Seke, K.; Petrovic, N.; Jeremic, V.; Vukmirović, J.; Kilibarda, B.; Martic, M. Sustainable development and public health: Rating European countries. BMC Public Health 2013, 13, 77. [Google Scholar] [CrossRef] [PubMed] [Green Version]
  52. Hosseinpoor, A.R.; Bergen, N.; Schlotheuber, A.; Grove, J. Measuring health inequalities in the context of sustainable development goals. Bull. World Health Organ. 2018, 96, 654–659. [Google Scholar] [CrossRef]
  53. Asma, S.; Lozano, R.; Chatterji, S.; Swaminathan, S.; Marinho, M.D.F.; Yamamoto, N.; Varavikova, E.; Misganaw, A.; Ryan, M.; Dandona, L.; et al. Monitoring the health-related Sustainable Development Goals: Lessons learned and recommendations for improved measurement. Lancet 2020, 395, 240–246. [Google Scholar] [CrossRef]
  54. European Commission. Reducing Health Inequalities in the European Union. 2011. Available online: https://akademia.nfz.gov.pl/wp-content/uploads/2016/05/KE3010290PLC.pdf (accessed on 22 August 2021).
  55. Kauf, S. Higher education—A factor in sustainable regional development. Sci. Pap. Silesian Univ. Technol. Organ. Manag. Ser. 2017, 2017, 93–102. [Google Scholar] [CrossRef]
  56. Girum, T.; Muktar, E.; Shegaze, M. Determinants of life expectancy in low and medium human development index countries. Med. Stud. 2018, 34, 218–225. [Google Scholar] [CrossRef]
  57. Kuszewski, K. “The national health programme” as a tool of the state health policy. In Health of Polish People; Ciura, G., Ed.; Studia BAS: Warsaw, Poland, 2009; Volume 4, pp. 51–77. [Google Scholar]
  58. Rój, J. Inequality in the Distribution of Healthcare Human Resources in Poland. Sustainability 2020, 12, 2043. [Google Scholar] [CrossRef] [Green Version]
  59. Rabiej, E. Transformation of the health care system in Poland—On the way to sustainable development. In Finansowanie Zadań Publicznych w Polsce; Russel, P., Ed.; Studia BAS: Warsaw, Poland, 2017; Volume 4, pp. 121–142. [Google Scholar]
  60. Gostin, L.O.; Friedman, E.A. Health Inequalities. Häst. Cent. Rep. 2020, 50, 6–8. [Google Scholar] [CrossRef]
  61. Bambra, C.; Riordan, R.; Ford, J.; Matthews, F. The COVID-19 pandemic and health inequalities. J. Epidemiol. Community Health 2020, 74, 964–968. [Google Scholar] [CrossRef] [PubMed]
  62. Mishra, V.; Seyedzenouzi, G.; Almohtadi, A.; Chowdhury, T.; Khashkhusha, A.; Axiaq, A.; Wong, W.Y.E.; Harky, A. Health Inequalities During COVID-19 and Their Effects on Morbidity and Mortality. J. Health Leadersh. 2021, 13, 19–26. [Google Scholar] [CrossRef]
  63. Nerini, F.F.; Henrysson, M.; Swain, A.; Swain, R.B. Sustainable Development in the Wake of Covid-19. Available online: https://assets.researchsquare.com/files/rs-63414/v1/9a1b26f1-34c2-40ee-8e3c-179898e11d34.pdf?c=1614773047 (accessed on 22 August 2021).
  64. Kaczmarek, F. The COVID-19 Pandemic and the Sustainable Development Goals. In The COVID-19 Pandemic Consequences: The World and Economy; Hajder, K., Kacperska, M., Donaj, Ł., Eds.; Wydawnictwo Naukowe Uniwersytetu im. Adama Mickiewicza: Poznan, Poland, 2020; pp. 159–172. [Google Scholar]
  65. Panek, T. Statistical Methods of Multidimensional Comparative Analysis; Oficyna Wydawnicza Szkoły Głównej Handlowej: Warsaw, Poland, 2009; 343p. [Google Scholar]
  66. Malina, A. The Multidimensional Analysis of the Spatial Diversification of the Poland’s Economic Structure According to Voivodeships; Wydawnictwo Akademii Ekonomicznej w Krakowie: Krakow, Poland, 2004; 232p. [Google Scholar]
  67. Eszergár-Kiss, D.; Caesar, B. Definition of user groups applying Ward’s method. Transp. Res. Procedia 2017, 22, 25–34. [Google Scholar] [CrossRef]
  68. Wang, F. The roles of preventive and curative health care in economic development. PLoS ONE 2018, 13, e0206808. [Google Scholar] [CrossRef] [PubMed]
  69. Björnberg, A. Euro Health Consumer Index 2017 Raport Health Consumer Powerhouse. 2018. Available online: https://healthpowerhouse.com/ehci-2017/ (accessed on 1 July 2021).
  70. OECD. Agenda for Sustainable Development 2030: In the Direction of Successful Implementation in Poland. 2017. Available online: https://www.oecd.org/poland/Better-Policy-Series-Poland-Nov-2017-PL.pdf (accessed on 21 June 2021).
  71. Ulewicz, R.; Blašková, M. Sustainable development and knowledge management from the stakeholders’ point of view. Pol. J. Manag. Stud. 2018, 18, 363–374. [Google Scholar] [CrossRef]
  72. Bambra, C.; Gibson, M.; Sowden, A.; Wright, K.; Whitehead, M.; Petticrew, M. Working for health? Evidence from systematic reviews on the effects on health and health inequalities of organisational changes to the psychosocial work environment. Prev. Med. 2009, 48, 454–461. [Google Scholar] [CrossRef] [PubMed] [Green Version]
  73. Jakovljevic, M. Population ageing alongside health care spending growth. Srp. Arh. Celok. Lek. 2017, 145, 534–539. [Google Scholar] [CrossRef]
  74. Burzyńska, M.; Marcinkowski, J.T.; Bryła, M.; Maniecka-Bryła, I. Life Expectancy and Healthy Life Years as the basic evaluation measures of the population health situation. Probl. Hig. Epidemiol. 2010, 91, 530–536. [Google Scholar]
  75. Łobodzińska, A. Aging society as a challenge to sustainable development. Geogr. Studies. 2016, 144, 127–142. [Google Scholar] [CrossRef]
  76. Marszowski, R.; Drobek, L. Selected aspects of demographic changes and its impact on the labor market and education. Sci. Pap. Sil. Univ. Technol. Organ. Manag. Ser. 2020, 2020, 193–206. [Google Scholar] [CrossRef]
  77. Hady, J.; Leśniowska, M. Analysis of Polish healthcare system financing in 2000–2009. Financ. Internet Quart. 2013, 9, 1–11. [Google Scholar]
  78. De Meijer, C.; Wouterse, B.; Polder, J.; Koopmanschap, M. The effect of population aging on health expenditure growth: A critical review. Eur. J. Ageing 2013, 10, 353–361. [Google Scholar] [CrossRef] [PubMed] [Green Version]
  79. Van Eenoo, L.; Declercq, A.; Onder, G.; Finne-Soveri, H.; Garms-Homolová, V.; Jónsson, P.V.; Dix, O.H.; Smit, J.H.; van Hout, H.P.; van der Roest, H.G. Substantial between-country differences in organising community care for older people in Europe—A review. Eur. J. Public Health 2016, 26, 213–219. [Google Scholar] [CrossRef] [Green Version]
  80. Cristea, M.; Noja, G.G.; Stefea, P.; Sala, A.L. The Impact of Population Aging and Public Health Support on EU Labor Markets. Int. J. Environ. Res. Public Health 2020, 17, 1439. [Google Scholar] [CrossRef] [PubMed] [Green Version]
  81. Nieszporska, S. Priorities in the Polish health care system. Eur. J. Health Econ. 2016, 18, 1–5. [Google Scholar] [CrossRef] [Green Version]
  82. Eurostat Home Page. Available online: www.ec.europa.eu/eurostat (accessed on 17 June 2021).
  83. Djellal, F.; Gallouj, F. Innovation in hospitals: A survey of the literature. Eur. J. Health Econ. 2006, 8, 181–193. [Google Scholar] [CrossRef]
  84. Jacobs, R.J.; Lou, J.Q.; Ownby, R.; Caballero, J. A systematic review of eHealth interventions to improve health literacy. Health Inform. J. 2014, 22, 81–98. [Google Scholar] [CrossRef] [PubMed]
  85. Silva, B.M.; Rodrigues, J.J.; Díez, I.D.L.T.; López-Coronado, M.; Saleem, K. Mobile-health: A review of current state in 2015. J. Biomed. Inform. 2015, 56, 265–272. [Google Scholar] [CrossRef] [Green Version]
  86. Strzelecka, A. The analysis of public health care expenditure in the selected EU countries as the basis of the decision making process in the common health policy. In Proceedings of the 3rd International Conference on European Integration 2016, Ostrava, Czech Republic, 19–20 May 2016. [Google Scholar]
  87. Ivanková, V.; Rigelský, M.; Kotulič, R.; Gonos, J. The governance of efficient healthcare financing system in OECD countries. Pol. J. Manag. Stud. 2020, 21, 179–194. [Google Scholar] [CrossRef]
  88. Golinowska, S.; Tabor, M. Sources of health care funding. Zdr. Publiczne Zarządzanie 2014, 12, 205–217. [Google Scholar]
  89. Jarzebski, M.P.; Elmqvist, T.; Gasparatos, A.; Fukushi, K.; Eckersten, S.; Haase, D.; Goodness, J.; Khoshkar, S.; Saito, O.; Takeuchi, K.; et al. Ageing and population shrinking: Implications for sustainability in the urban century. npj Urban Sustain. 2021, 1, 1–11. [Google Scholar] [CrossRef]
  90. Carrilero, N.; García-Altés, A.; Mendicuti, V.M.; García, B.R. Do governments care about socioeconomic inequalities in health? Narrative review of reports of EU-15 countries. Eur. Policy Anal. 2021, 1–16. [Google Scholar] [CrossRef]
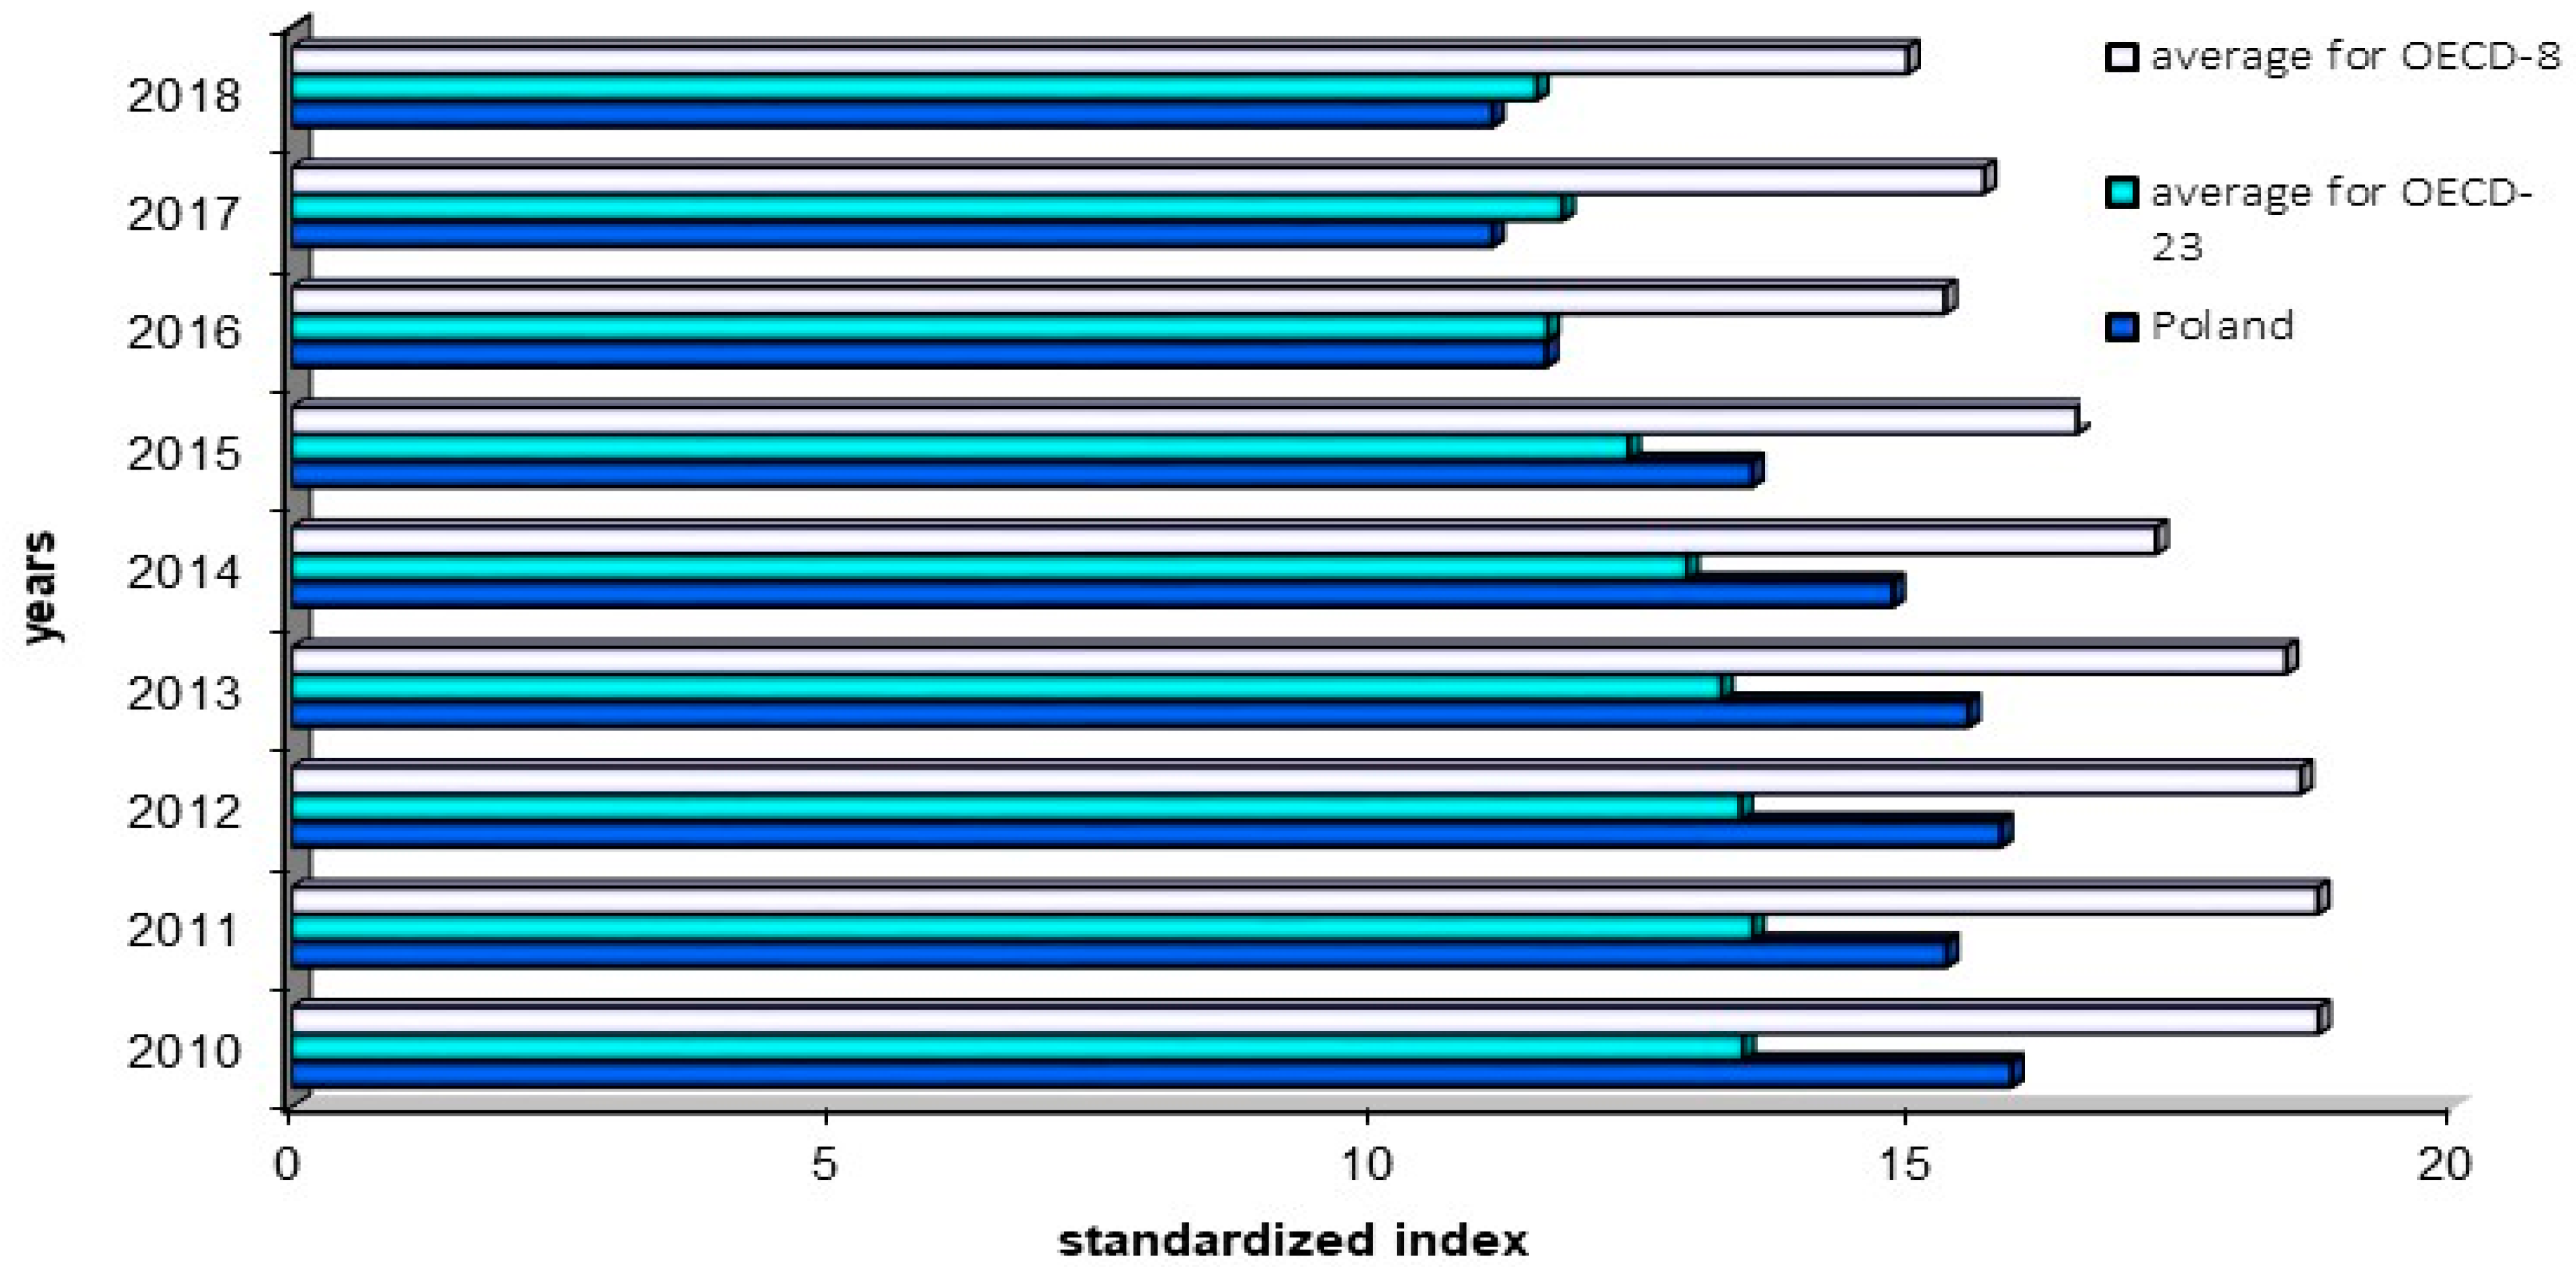
Figure 1. Share of suicides per 100,000 people in Poland and OECD countries (standardised index). Source: Own study based on OECD.
Sustainability 13 10351 g001
Figure 2. Unmet needs resulting from income inequalities in the studies country groups (in %). Source: Own study based on Eurostat.
Sustainability 13 10351 g002
Figure 3. Chain relative increments of exposure to PM10 dust in the studied country groups in 2011–2019 (percent). Source: Own study based on Eurostat.
Sustainability 13 10351 g003
Figure 4. Medium-term tempo of change in expenditure on prevention in health care in 2013–2019 (percent). Source: Own study based on OECD.
Sustainability 13 10351 g004
Figure 5. Ward’s dendrogram in 2017. Source: Own study based on OECD.
Sustainability 13 10351 g005
Figure 6. Ward’s dendrogram in 2018. Source: Own study based on OECD.
Sustainability 13 10351 g006
Figure 7. Ward’s dendrogram in 2019. Source: Own study based on OECD.
Sustainability 13 10351 g007
Table 1. Life expectancy by gender in the studied groups of countries in 2010–2019.
GroupsThe Statistical Measure2010201120122013201420152016201720182019
Women
Poland80.781.181.181.281.781.682.081.881.781.9
27 EU countriesaverage82.082.382.382.682.982.783.083.083.183.4
median83.083.183.183.283.683.483.683.983.984.2
Countries belonging to the EU since 2004average80.280.580.681.081.281.081.581.481.681.8
median80.080.580.580.781.180.981.481.381.381.6
Men
Poland72.272.572.673.073.773.573.973.973.774.1
27 EU countriesaverage75.776.076.276.676.976.977.277.377.477.7
median77.577.978.078.178.778.778.978.979.179.3
Countries belonging to the EU since 2004average72.672.973.173.673.973.974.374.474.574.9
median71.471.972.172.972.973.273.673.873.874.2
Source: Own study based on Eurostat.
Table 2. Healthy life years divided into gender in the studied groups of countries in 2010–2019.
GroupsThe Statistical Measure2010201120122013201420152016201720182019
Women
Poland62.363.262.862.762.763.264.663.564.364.1
27 EU countriesaverage61.761.762.161.862.261.762.762.162.162.9
median62.362.062.662.262.362.763.162.061.862.6
Countries belonging to the EU since 2004average60.860.361.161.361.960.962.160.861.062.0
median60.560.161.060.961.259.759.860.360.761.9
Men
Poland58.559.159.159.259.860.161.360.660.560.9
27 EU countriesaverage60.861.161.361.261.461.462.161.761.862.2
median61.362.162.162.062.061.562.660.661.561.8
Countries belonging to the EU since 2004average58.658.459.159.459.759.260.359.359.360.1
median57.357.658.458.959.058.859.759.459.860.8
Source: Own study based on Eurostat.
Table 3. Percentage share of deaths according to causes in the total number of deaths in 2010–2019.
Groups2010201120122013201420152016201720182019
Neoplasms
Poland25.425.525.625.526.626.727.326.526.326.5
Average for the 27 EU countries25.626.025.826.026.625.726.225.825.926.1
Average for EU countries since 200423.323.623.624.024.524.024.424.024.424.7
Diabetes mellitus
Poland1.71.81.91.91.82.12.12.22.22.3
Average for the 27 EU countries2.12.12.12.22.32.32.32.32.32.4
Average for EU countries since 20042.02.01.92.22.32.32.32.32.52.6
Diseases of the circulatory system
Poland50.549.949.649.749.749.749.549.849.449.4
Average for the 27 EU countries42.342.041.841.040.540.339.539.138.238.0
Average for EU countries since 200451.151.050.950.149.849.849.048.847.847.7
Cerebrovascular diseases
Poland9.49.59.08.58.27.77.57.67.27.1
Average for the 27 EU countries10.19.99.69.59.39.18.98.68.58.3
Average for EU countries since 200412.112.011.711.711.611.211.110.810.710.5
Chronic lower respiratory diseases
Poland1.92.01.92.01.71.81.71.81.71.6
Average for the 27 EU countries3.13.03.13.13.13.23.13.23.23.2
Average for EU countries since 20042.02.02.02.22.22.32.22.22.22.2
Source: Own study based on Eurostat.
Table 4. Percentage of people suffering from long-term illnesses or health problems depending on the level of income in the surveyed country groups in 2010–2019.
Groups2010201120122013201420152016201720182019
First quintile
Poland36.135.535.434.335.336.438.643.045.246.6
Average for the 27 EU countries36.235.836.236.737.238.738.840.942.242.5
Average for EU countries since 200436.235.837.337.238.139.940.744.246.146.3
Second quintile
Poland37.338.238.737.937.039.640.643.041.942.5
Average for the 27 EU countries37.137.637.738.838.639.739.040.039.640.1
Average for EU countries since 200437.839.039.140.039.441.241.042.941.742.4
Third quintile
Poland36.034.636.435.436.238.538.939.738.840.7
Average for the 27 EU countries31.532.631.932.833.033.833.534.033.133.0
Average for EU countries since 200432.333.132.432.733.433.733.334.233.432.9
Fourth quintile
Poland31.334.033.033.733.534.934.337.334.134.2
Average for the 27 EU countries27.027.227.328.428.128.928.529.728.828.6
Average for EU countries since 200427.427.827.127.627.527.927.829.428.127.7
Source: Own study based on Eurostat.
Table 5. Dynamics of the percentage of people exposed to noise in 2011–2019.
Groups201120122013201420152016201720182019
2010 = 100%
Poland86.489.490.086.879.684.981.587.080.4
Average for the 27 EU countries105.1105.2104.1101.196.696.195.396.392.5
Average for EU countries since 2004102.499.098.894.285.183.581.582.377.2
Previous year = 100%
Poland86.4103.5100.796.491.8106.695.9106.892.5
Average for the 27 EU countries96.7100.199.097.195.599.599.2101.196.0
Average for EU countries since 200495.196.799.895.390.498.097.7101.093.8
Source: Own study based on Eurostat.
Publisher’s Note: MDPI stays neutral with regard to jurisdictional claims in published maps and institutional affiliations.