Abstract
The present study was focused on heavy metal distribution patterns and the associated ecological risk assessment in the adjoining sediment of the Hindon River in Muzaffarnagar Region (U.P.), India. Lead (Pb), zinc (Zn), copper (Cu), cadmium (Cd), nickel (Ni), iron (Fe), aluminum (Al), sodium (Na), and potassium (K) were estimated from six sediment samples (Atali A and B, Budhana A and B, and Titavi A and B). The concentration of the heavy metals Zn, Pb, Cu, Ni, and Cd ranged from 25.5–74.7 mg kg−1, 29.8–40.6 mg kg−1, 7.0–29.2 mg kg−1, 14.7–21.8 mg kg−1, and 0.96–1.2 mg kg−1, respectively and followed the sequence Zn > Pb > Cu > Ni > Cd, while major elements followed the sequence Na > Fe > Al > K. The enrichment factor (EF) and geo-accumulation index (Igeo) revealed that Atali A showed the highest enrichment and followed the sequence Zn > Cu > Pb > Ni > Cd. Contamination factor (CF) and contamination degree (CD) depicted that all of the sites (except Titavi B) were moderately to considerably contaminated. The highest degree of contamination (CF, CD, and PLI, pollution load index) was observed at Titavi A followed by Atali A and Budhana A. Eco-toxicological risk assessment (RI) indicated that the sites were moderately contaminated, predominantly by Ni and Pb and Zn. The results revealed that the metal contamination in sediment is alarming and might pose an adverse threat to ecosystem health.
1. Introduction
Heavy metal pollution in aquatic ecosystems has gained utmost concern because of its persistence and bioaccumulation nature [1,2]. Generally, heavy metals mainly enter aquatic ecosystems (e.g., lakes, rivers, reservoirs, and wetlands) by means of industrial or sewage discharge [3,4,5,6,7]. Apart from this, atmospheric deposition and anthropogenic activities have accelerated the accumulation of heavy metal levels in the aquatic ecosystems [8]. In particular, heavy metal pollution is inflicting damage upon rivers locally, especially in developing countries and has attracted the attention of scientific communities [9].
In a riverine ecosystem, sediments are considered as environmental indicators of metal pollution due to their high physico-chemical stability [1,10]. They also serve as both a source and sink of heavy metals [11,12]. Additionally, sedimental chemical analysis provides valuable information about the anthropogenic activities that have prevailed in these ecosystems [1]. Further, they are considered to be carriers of different contaminants into aquatic ecosystems. In the marine system’s natural condition, most of the heavy metals are quickly deposited into the bottom sediment after their entry into the riverine system and are concentrated in higher amounts than in water and are particularly introduced into the bottom sediment by means of adsorption and co-precipitation [13]. In addition to this, heavy metal levels in sediments are also desorbed or resuspended when the riverine ecosystem’s physiochemical or hydrological conditions change. This causes secondary pollution in the riverine body [14,15]. Therefore, heavy metal accumulation in sediment directly regulates benthic organisms and indirectly controls the trophic structure of other organisms [12,16] and endangers the health conditions of aquatic ecosystems. Accordingly, the investigation of bottom sediments is of paramount importance to evaluate the distribution of metal contamination and subsequent heavy metal accumulation in sediment since its distribution is regulated by sedimentation processes and do not undergo rapid changes due to varied external conditions [1]. Therefore, bottom sediment assessment is an excellent tool not only to study contaminant distribution but also to improve management strategies through the reconstruction of historical contaminant inputs [17].
The Hindon River is one of the prime tributaries of the Yamuna River and is one of the key drivers in Muzaffarnagar, Uttar Pradesh. It originates in the Saharanpur district from the upper Sivaliks in Uttar Pradesh, coordinates 35°05′ N and 77°08′ E (origin) to 28°04′ N and 77°04′ E (mouth). It flows between the Ganges and Yamuna through Muzaffarnagar, Meerut, Baghpat, Ghaziabad, and Gautam Buddh Nagar districts and stretches about 400 km [10]. It supports many highly densely populated cities of western Uttar Pradesh. The Hindon River is also a vital river fulfilling the demand for both industrial clusters (mainly sugar, paper, distilleries, chemical industries, and slaughterhouses) and agriculture [18]. As per the Uttar Pradesh Pollution Control Board estimate, around 674 million tons of waste enter into the Hindon River annually, with 595 MLD being sewage and 78 MLD being industrial effluent from 453 industries located in the catchment area [19]. Accordingly, the health conditions of the Hindon River (water and sediment) have rapidly deteriorated due to the increase in heavy metal discharge over the past few decades due to various municipal and industrial activities, mainly by the mining and metallurgical industries [10,20]. In addition to this, the discharge of partially/untreated wastewater from urban and industrial premises as well as non-point sources are continuously polluting the Hindon River to varying degrees. Several researchers have demonstrated pollution levels caused by heavy metals in different tributaries of the Yamuna River as well as of the Yamuna River basin [8,21,22]. However, until today, not a single study has demonstrated a metal distribution pattern, their accumulation in bottom sediment, their possible sources, or an associated risk assessment of the Hindon River. Accordingly, for the first time, the present study determined the metal levels in the bottom sediment of the Hindon River.
The objectives of the current investigation were to (1) assess the occurrence and distribution of metals (Cd, Zn, Pb, Cu, Fe, Al, Ni, Na, and K) in the bottom sediment of the Hindon River, (2) evaluate the spatial distribution pattern, and (3) assess the pollution status and complete a metal-mediated risk assessment using pollution indices such as the enrichment factor (EF), the geo-accumulation index (Igeo), the contamination factor (CF), the contamination degree (CD), the pollution load index (PLI), and the ecological risk index (RI).
2. Materials and Methods
2.1. Study Area
The present study was conducted along a natural river, the Hindon River near the Muzaffarnagar district of Uttar Pradesh, India. The Hindon River flows through industrial clusters and the highly populated rural communities of western Uttar Pradesh. In addition, the Hindon River passes under a bridge and the town of Budhana. The studied area was the village of Tatavi, the town of Bhudhana, and the village of Atali in the Muzaffarnagar region (Figure 1). These sites are situated along the river.
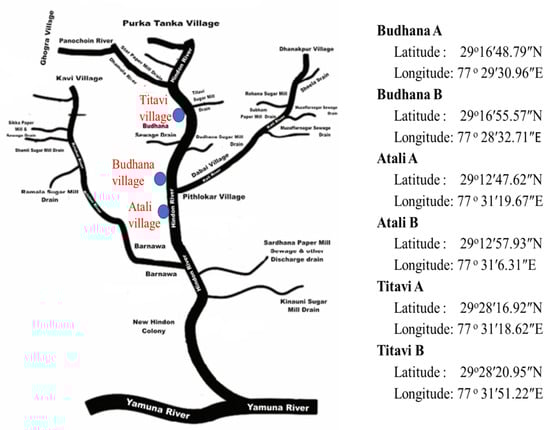
Figure 1.
Map of the study area showing the sampling location sites.
2.2. Sediment Collection and Processing
For this study, sediments were collected from six sampling sites from Atali, Budhana, and Titavi along the Hindon River. From each village, two samples were collected. Out of six soil samples, three samples were taken from near the riverbank (A) for each village, and the other three samples were taken 4 to 5 km away from the riverbed (B) of each village. Generally, the surface sediment samples were collected from depths of about 1 to 1.5 feet by using a trowel and were immediately placed in airtight plastic bags. These air-tight bags were then brought to the laboratory and were dried in an oven (60 °C for 24 h) in the laboratory, crushed using a mortar pestle, and sieved through a 600-micron mesh for metal analysis.
2.3. Sediment Sample Analysis
For the metal analysis, 1 g of the homogenized mixed sediment samples was digested using a concentrated HNO3 and HClO4 mixture (3:1) in a 250 mL beaker (USEPA Method 3051A-2007). Upon placing the beakers on an electric-driven heating-plate, the heating plate was switched on (45 °C for 60 min) for digestion. The appearance of a clear solution indicated complete digestion, and this process was performed through repeated acidification. After that, the solution was filtered using Whatman 45 filter paper and was diluted with Milli-Q water to a 50 mL volume. Finally, this solution was used for the analysis of different metal levels. The Pb, Fe, Cd, Cu, Al, Zn, and Ni contents were analyzed using atomic absorption spectroscopy (AAS) following standard calibration procedure and using E-Merck elemental standards in triplicate. The Na and K levels were analyzed using flame atomic absorption (Flame AAS) in triplicate [23]. The precision and accuracy of the analytical methods were analyzed using NIST reference material in triplicate (Department of Commerce, USA). The precision and recovery of the process were detected as < 4% and 88% to 110%, respectively.
2.4. Different Pollution Indices for Assessing Metal Contamination
2.4.1. Geo-Accumulation Index (Igeo)
This index was used to determine the heavy metal pollution load in the study area, and it was calculated by following equation:
where Csample represents the heavy metal sediment concentration, and Cbackground represents the heavy metal geochemical background concentration (mg kg−1). The constant 1.5 was used to minimize anthropogenic influences (mainly weathering and lithogenic effects). The index was classified as follows: practically unpolluted (Class 0, Igeo ≤ 0); unpolluted to moderately polluted (Class 1, 0 < Igeo ≤ 1); moderately polluted (Class 2, 1 < Igeo ≤ 2); moderately to heavily polluted (Class 3, 2 < Igeo ≤ 3); heavily polluted (Class 4, 3 < Igeo ≤ 4); heavily to extremely polluted (Class 5, 4 < Igeo ≤ 5); and extremely polluted (Class 6, Igeo > 5) [24].
2.4.2. Enrichment Factor (EF)
The EF was used to determine the metal abundance in the sediment. It was calculated by comparing the metal level with the reference metal level. Generally, Mn, Al, and Fe were used as the reference metals. In this study, iron was used as a reference metal due to its natural origin (98%) greatly dominating its contribution. The EF was defined as follows:
where (M/Fe)sample indicates the sample metal and reference metal ratio, and (M/Fe)background indicates the background and reference metal ratio. EF was categorized as follows: deficiency to minimal enrichment (EF < 2); moderate enrichment (EF = 2 to 5); significant enrichment (EF = 5 to 20); very high enrichment (EF = 20 to 40); and extremely high enrichment (EF > 40) [25].
2.4.3. Contamination Factor (CF)
The contamination factor (CF) is generally used to identify the sources of heavy metal contamination as well as to monitor contaminant levels. The CF was calculated based on the following equation:
where Mc was the sample metal concentration, and Bc was the background metal concentration. The CF values were categorized into four grades: low contamination (Class 1, CF < 1); moderate contamination (Class 2, 1 ≤ CF ≥ 3); considerable contamination (Class 3, 3 ≤ CF < 6); and very high contamination (Class 4, CF > 6) [26].
2.4.4. Contamination Degree (CD)
The CD is a basic sediment quality measurement index. It is the sum of all of the individual metal CF values in a particular site. The CD value was classified into the following groups [1]: low contamination degree (Class 1, CD < 6); moderate contamination (class 2, 6 ≤ CD < 12); considerable contamination (Class 3, 12 ≤ CD < 24); and extreme contamination, indicating serious anthropogenic pollution (Class 4, CD > 24).
2.4.5. Pollution Load Index (PLI)
The PLI is another simplistic sediment quality assessment index. It was defined as the geometric mean of the n number of a metal’s CF value at a particular site and was calculated by the below formula:
where n represents metal number and where CF indicates the contamination factor. PLI was classified as follows: perfect pollution state (PLI = 0), baseline pollutants present (PLI = 0 to 1), and progressive deterioration (PLI > 1) [27].
2.4.6. Ecological Risk Index (RI)
The ecological risk index (RI), formulated in 1980 by Hakanson, and was used to determine the metal-mediated ecological risk in the sediment. It assessed metal-mediated combined ecological and environmental toxicity, and the following equations were used to calculate the RI:
where Tri and Eir were the toxic response factor and the potential ecological risk factor, and Cbackground and Csample represent the background and measured concentration, respectively. The Tri values for Cd, Ni, Cu, Pb, and Zn, all taken from literature, were 30, 5, 5, 5, and 1, respectively [28]. The Eir value was classified into following grades: low risk (Class 1, Eir < 40); moderate risk (Class 2, 40 ≤ Eir < 80); considerable risk (Class 3, 80 ≤ Eir < 160); high risk (Class 5, 160 ≤ Eir < 320); and very high risk (Class 5, Eir > 320). On the other hand, the RI value was categorized into the following grades: low risk (Class 1, RI < 150); moderate risk (Class 2, 150 ≤ RI < 300); considerable risk (Class 3, 300 ≤ RI < 600); and very high risk (Class 4, RI > 600).
2.4.7. Data Analysis
The obtained analyzed data were first verified to check normality by the Shapiro–Wilk test using the SPSS statistical package (version 26.0; IBM Corp., Armonk, NY, USA). The Pearson correlation was conducted to check the relationship among the parameters at p < 0.05 [10,14,22]. Principal component analysis (PCA) analysis was conducted to identify the contributing sources for metal distribution variation [8,18,25]. Microsoft Excel 2019 was used for graph preparation and index calculations.
3. Results and Discussion
3.1. Major Elements Spatial Distribution in Sediments
Figure 2 demonstrates the spatial distribution pattern of the major elements. The order of the examined of major elements was as follows: Na > Fe > Al > K. The concentrations of Na in the sediment ranged from 63.6 to 248 mg kg−1. The sediment from Atali contained the highest Na concentration (248 and 150 mg kg−1, respectively), whereas the lowest Na concentration was observed at Titavi (130 and 63.6 mg kg−1, respectively). The higher Na level at Atali (particularly at Atali A) could be explained by the higher amount of suspended solids carried by the river water, as this site is very close to the Hindon River bed. Similar to our findings, Khan et al. [29] recorded higher major elements near the river site. It is likely that the sediment from Atali contained the highest Al concentrations (1.06 and 0.55 mg kg−1, respectively), whereas the lowest Na concentration was observed at Budhana (0.66 and 0.53 mg kg−1, respectively). These elements largely represent the clay mineral content in the sediments as well as in the feldspar, amphiboles, and pyroxenes [30]. The higher Na level at the Atali A site could be explained by higher amount of suspended solids being carried by river water, as this site is close to the bed of the Hindon River. Similar to our findings, Khan et al. [29] recorded higher amounts of major elements such as Al and K near the river site, but the values were comparatively higher than the present findings (7.28 to 11.65% and 6.31 to 7.99%, respectively. In addition to this, the recorded Al level is much lower than the permissible limit, 10,000–300,000 mg kg−1.
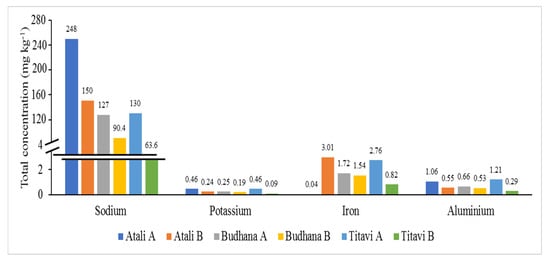
Figure 2.
Spatial distribution of major metals in the sediment samples from the study area.
The Fe concentrations ranged from 0.04 to 3.01 mg kg−1. The permissible limit of iron in soil is 7000–550,000 mg kg−1, which indicates that the amounts in our study were well below the permissible level. Generally, clay minerals are responsible for the silt–clay fraction; accordingly, this means that the river carries more iron [29]. In addition to this, iron oxides or iron hydroxides play a crucial role in toxic environments as heavy metal scavengers [29,31]. A very high Fe level could be attributed to higher suspended solid loads carried by the river as industry effluents. However, the present Fe level was comparatively lower than that of the coast of the Bay of Bengal (8.95 to 14.56%) [29]. The K concentrations ranged from 0.09 to 0.46 mg kg−1. The distribution pattern was almost the same for all of the measured samples. This condition could be due to the weathering of the basic and ultra-basic igneous rocks of the riverbed [29]. It is noteworthy to mention that generally, these elements are concentrated at surface (upper slope), possibly due to upward migration within the sediment column. Further, they act as a chemical sink for other metals [29]. However, the present K level was comparatively lower than the sediment values those from the coast of the Bay of Bengal (6.31 to 7.99%) [29].
3.2. Heavy Metals Spatial Distribution in Sediments
Figure 3 demonstrates the spatial distribution pattern of the heavy metals. The metals showed the order Zn > Pb > Cu > Ni > Cd. The findings of the present investigation indicate that the tested heavy metals were within the permissible limit of the interim sediment quality guidelines (ISQG) for freshwater sediments, except for Cd (Table 1). The Zn, Pb, Cu, Ni, and Cd concentrations ranged from 25.5–74.7 mg kg−1, 29.8–40.6 mg kg−1, 7–29.2 mg kg−1, 14.7–21.8 mg kg−1, and 0.96–1.2 mg kg−1, respectively. The average level showed the order Zn (51.62 mg kg−1) > Pb (34.7 mg kg−1) > Cu (18.93 mg kg−1) > Ni (16.58 mg kg−1) > Cd (0.55 mg kg−1). However, the present Pb, Cu, Ni, and Cd levels were comparatively higher than the sediment values from the coast of the Bay of Bengal, which were 0.01–1.42 (0.4 ± 0.163) mg kg−1, 0.38–0.66 (0.53 ± 0.02) mg kg−1, 0.01–0.23 (0.08 ± 0.001) mg kg−1, and 2.8–6.1 (4.0 ± 1.65) mg kg−1, respectively [29].
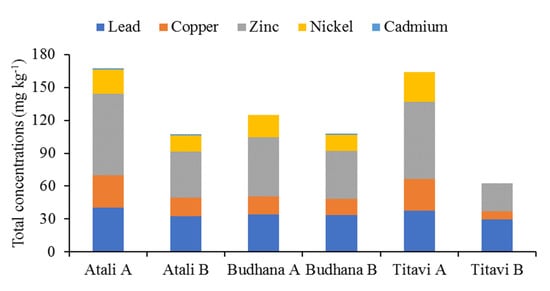
Figure 3.
Spatial distribution of heavy metals in the sediment samples from the study area.

Table 1.
Standard sediment heavy metal concentrations of the IRS (Indian River System), USEPA, WRS (World River System), ASV (average shale values), and TRV (toxicity reference values) [22].
The average value of Zn in the sediment samples was recorded as 74.7 mg kg−1 at Atali A, 41.8 mg kg−1 at Atali B, 53.8 mg kg−1 at Budhana A, 43.8 mg kg−1 at Budhana B, 70.1 mg kg−1 at Titavi A, and 25.5 mg kg−1 at Titavi B. The Zn level was found below the proposed permissible limits of the USEPA, TRV, ASV, and the WRS; however, the Zn level exceeded the IRS limit (Table 1). The observed Zn concentrations were primarily due to pesticides, smelting and fertilizers used in agriculture, association with sulfides, organic compounds, Fe/Mn oxides/hydroxides, and microbial activities [32,33]. Additionally, the higher Zn levels compared to other metals also imply the influence of factors such as water flow, organic matter, and, most importantly, nutrient element concentrations [33]. Zinc is one of the essential metals that regulates enzymatic activity in biological systems. However, high Zn concentration may cause chlorosis, rot, and may retard growth and development in plants and, at the same time, cause gastrointestinal misery, pancreatic harm, loose bowels, and sickliness n in animals [34]. In addition to this, industrial waste disposal can be considered to be another prime reason for the abnormal levels of Zn in the study area [35].
The average Pb value in the sediment sample was recorded as 40.6 mg kg−1 at Atali A, 32.5 mg kg−1 at Atali B, 33.9 mg kg−1 at Budhana A, 33.7 mg kg−1 at Budhana B, 37.7 mg kg−1 at Titavi A, and 29.8 mg kg−1 at Titavi B. The Zn level was found above the permissible limits of the USEPA, TRV, and ASV [22]. This high Pb level might be due to industrial effluents, sewage outfall, and other local factories. However, anthropogenic inputs such as lead-based automobiles and antifouling paints were thought to be the prime sources [29]. The consistently higher Pb levels in the current study compared to those of Ni and Cu is because of soluble Fe–Mn oxide fraction, which is due to the precipitation of industrial, agricultural, and domestic sewage and the higher sedimental retention of soluble oxides [29]. In fact, these effluents bring more suspended solids along with clay and silt, which allows for more Pb absorption the from water, which accumulates in the bottom sediment due to the higher sedimentation rate, and hence, higher Pb values were recorded [23]. Higher Pb levels pose threat to fishery resources. In plants, (beyond 5 mg kg−1) it causes severe growth retardation, discoloration, and morphological abnormalities, which cause adverse effects on aquatic biota [34,36,37]. The highest Cu values was recorded at Atali A (29.2 mg kg−1) and Titavi A (28.8 mg kg−1), and these values much higher than the IRS standard (28 mg kg−1). However, the observed Cu values were below the USEPA, WRS and ASV permissible limits, but the values were well above the TRV value [22]. Cu is very dangerous to invertebrates, fishes, and aquatic plants, even in minimal amounts, and is more dangerous than other heavy metals, with the exception of mercury. In particular, compared to terrestrial plants, the Cu was absorbed three times more by aquatic plants [38]. Therefore, higher Cu values cause damage to cell membrane integrity and restrain root development [34]. The observed Ni level was well below the standard value set by the IRS (37 mg kg−1). However, the Ni level (22.7 mg kg−1) was well above the standard TRV value, i.e., 16 mg kg−1 [39]. According to the TRV value, all of the sites were quite polluted, which might cause toxic effects to aquatic plants and biota. This finding suggests an anthropogenic contribution in the form of effluents [29]. It is likely that cadmium is also highly toxic to aquatic biota, and sewage sludge, mine wastes, metallurgical industries, and municipal effluents were thought to be the prime sources of Cd [29]. A relatively high concentration of Cd was recorded at all of the sampling sites. The observed Cd level was exceeded the USEPA, ASV and TRV standards, which indicates that it has great potential to cause toxicity to aquatic species [22,34].
3.3. Correlation and PCA Analysis of Studied Metal Levels
Metals detected in the sediment samples of the Hindon River showed different correlation levels with each other (Table 2). Pb showed a very high positive relation with Cu, Zn, Al, K, and Na. A study of correlations also depicted that Cu displayed high relation with Pb, Zn, Al, and K, while Zn was highlight correlated with Al Pb, Cu, and K. Ni was only highly correlated with only Al. Al was highly related with Cu, Pb, Zn, Ni, and K, while Na was only highly correlated with Pb. The K also showed a higher correlation with Zn, Pb, Cu, and Al. Na showed positive correlations with all of the studied elements except for Fe. Na was detected in higher quantities than all of the other metals, which indicates that Na acts as regulating factor for optimal microbial activities in sediment and in the distribution of other metals [33]. Generally, a high correlation between two heavy metals indicates that they come from similar pollution sources or that they share analogous transformation and migration processes [33]. Accordingly, a good high correlation in this study was found between the Pb, Zn, Cu, Al, and K metal pairs, indicating that common anthropogenic sources with mutual dependence on metal level in Hindon River and similar geochemical characteristics. Similar to our findings, Singh et al. [22] recorded a positive correlation among the studied heavy metals from the sediment of the Ghaghara River, India. In addition to this, Suresh et al. [40] demonstrated that a higher relation between metals indicated a common origin of the studied metals with mutual dependence and similar behavior. On the other hand, a weak relationship among heavy metal pairs indicates that metal distribution is controlled by geochemical incidences rather than by any single element. Additionally, PCA analysis was performed to identify the metal contamination source. The Kaiser–Meyer–Olkin (KMO) value was found to be 0.982 (i.e., KMO > 0.5). The PCA results generated two PCs with eigenvalues greater than 1 and a cumulative variance of 87.38% (Table 3). The PCA (Component 1) results showed strong positive loadings for almost all of the metals except Cd and Fe (Figure 4). Component 2 showed strong positive loading for Fe and Ni (Figure 4). The strong loading for almost all of the metals indicate similar contamination sources, particularly discharge from untreated domestic, industrial, and agricultural sewage [18,25]. The metal levels in the Hindon River sediment determined that the river is moderately to severely polluted, and this has been verified by PCA. PCA depicted that the moderate to severe pollution in Hindon river basin is due to the direct discharge from untreated domestic, industrial, and agricultural sewage from surrounding areas [18].
Table 2.
Correlation data of heavy metals in adjoining sediments of Hindon River.
Table 3.
Varimax factor loading matrix, eigenvalues, and variances for sediment samples from the Hindon river.
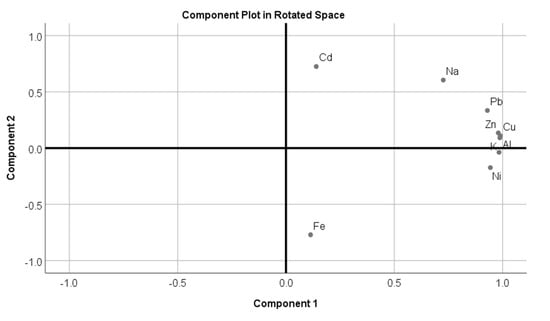
Figure 4.
Rotated component plot for sediment samples from the Hindon River.
3.4. Heavy Metal Pollution Level Assessment by Indices
Sedimental heavy metal analysis is used as a sensitive contamination indicator in aquatic ecosystems [41]. The elevation of metal levels in sediments generally exerts a toxic impact on aquatic ecosystems. However, the assessment of the overall pollution level was a challenging task. In this study, we used different indices to evaluate the sediment pollution, namely Igeo, EF, CF, CD, PLI, and finally, RI.
The Igeo index value of the study area is presented in Table 4. The observed Igeo value indicates that the Zn value showed moderate to extreme pollution, while Igeo value of Cd showed moderate to strong pollution. With few exceptions Cu, Ni, and Pb also exhibited moderate to extreme pollution. This finding indicates that all of the sites were strongly contaminated by most metals. Based on average values of Igeo, sediments from the study area were enriched with metals in the following order: Zn > Cu > Pb > Ni > Cd. In addition to this, the pollution levels for the sites were as follows: Atali A > Atali B > Budhana A > Titavi A > Budhana B > Titavi B. Contrary to our findings, Al Obaidy et al. [1] reported that the mean Igeo values of the sediments from the Tigris River showed the order Cd > Pb > Cr > Ni > Cu > Zn and that downstream was adversely polluted due to receiving industrial waste compared to the upstream sediment samples. In another study, Jumbe and Nandini [42] reported a different trend for the Igeo values of lake sediment samples, depicting the levels as Co > Pb > Ni > Cu > Zn > Cd > Cr > Mn.
Table 4.
The Igeo and EF values in sediment samples from the study area.
The enrichment factor is generally used to determine metal abundance. Our study showed the EF order was Ni > Pb > Zn > Cu > Cd (Table 4). The findings indicate that the sediment samples were extremely enriched with Ni and Pb. Contrary to our findings, Al Obaidy et al. [1] reported that the sedimental EF values from the Tigris River showed the order Cd > Pb > Cr > Ni > Cu > Zn and that downstream was adversely polluted due to receiving high amounts of industrial waste and other waste from the city compared to the upstream sediment samples. Among the sites, high EF values for all of the metals were observed at Atali A (e.g., 10,568.46 for Pb, 3858.01 for Cu, 4030.41 for Zn, 28,373.46 for Ni, 741.88 for Cd) followed by Budhana A, Titavi A, Budhana B, Titavi B, and Atali B. The comparatively higher observed EF values at Atali A could be explained by the fact that this site might continuously receive wastewater and other waste from surrounding areas with higher quantities [1]. Additionally, this site was very close to the riverbed.
Generally, the contamination factor is used to assess the anthropogenic effect on bed sediment quality. The average CF value for the different heavy metals were Ni > Pb > Zn > Cu > Cd (Table 5). The study area was highly polluted with Ni (CF > 6), moderately to considerably contaminated with Pb, moderately contaminated with Zn and Cu, and practically unpolluted by Cd (CF < 1). The CF value was seen to be the most extreme for Ni at Titavi A followed by Budhana A, Atali A, Budhana B, Atali B, and Titavi B. Among all of the sites, the Atali A site recorded the highest CF value (3.56) for Pb, which was followed by Titavi A, Budhana A, Budhana B, Atali B, and Titavi B. Metals such as Cu and Ni were within CF Class 2, showing the highest value at Atali A, while Cd coincided with Class 1, and the highest value was also recorded at Atali A. The overall study indicated that the sites have a considerable level of pollution all together. Contrary to our findings, Al Obaidy et al. [1] reported that the CF value of sediments from the Tigris River showed the order Cd > Pb > Cr > Ni > Cu > Zn, while the order Ni > Fe > Cd > Mn > Cu > Pb was noted in coastal sediment samples from the Bay of Bengal [29]. Furthermore, a moderate to considerable degree of contamination (CD, 6 to 24) was observed at the study sites, with the exception of Titavi B, indicating higher anthropogenic pollution (Table 5). The highest CD was found at Titavi A, followed by Atali A, Budhana A, Budhana B, Atali B, and Titavi B. The higher pollution level at Titavi A is mainly due to the river receiving waste materials, as the site is very close to the Sharanpur City drain, the Star Paper Mill waste drain, and other waste receiving canals. Al Obaidy et al. [1] reported a higher contamination level (CD) in downstream sediment samples compared to upstream samples, as downstream areas receive high amounts of industrial waste and other waste from the surrounding city.
Table 5.
The CF, CD, and PLI values of heavy metals of the study area.
Generally, the PLI value indicates the overall toxicity assessment of a particular area. The recorded PLI value of the study area is represented in Table 5. The PLI value of all of the sampling sites ranged between 0.82 and 2.31, indicating moderate to high pollution. Contrary to our findings, Al Obaidy et al. [1] reported PLI values from 2.74 to 3.47, while Jumbe and Nandini [42] recorded PLI output in lake sediment as Ni > Pb > Cd > Cu > Cr > Co > Zn > Mn. In our study, the lowest PLI output was noted at Titavi B, indicating minimal anthropogenic impact, while all other sites showed values above 1, indicating progressive deterioration by different anthropogenic activities. In particular, the highest PLI value, which was recorded at Titavi A, Budhana A, and Atali A, reflects a comparatively higher occurrence of studied heavy metals, indicating that these sites are considerably influenced by different anthropogenic activities. Additionally, the PLI values for all of the metals was greater than 1, indicating that all sites were contaminated to some extent by metals [29]. Overall, PLI gives comprehensive information about the pollution status of the study area and the nature of riverbed sediment.
The environmental risk assessment in heavy metal-contaminated sediment is mainly governed by their total content and subsequent speciation [41,43]. The gradation of Eir and RI values are presented in Table 6. The Eir values in the study area showed the order Ni > Pb > Cd > Cu > Zn. The Eir values for Ni at the different sampling stations exhibit a moderate (Atali A, Titavi A and Budhana A) to low (Atali B, Titavi B and Budhana B) risk level. The other metals for all of the other sampling sites were within the low-risk category (Eir < 40) (Table 6). The recorded RI value in our study ranged from 15.09 to 84.97 (average 60.17), indicating moderate ecological risks caused by heavy metals (Table 6). The sediment of all of the sampling sites has a RI < 150, indicating low ecological risks. The present risk value was much lower than the value (269.90) recorded by Nayek et al. [43] in effluent channel sediments.
Table 6.
The Eir and RI values in sediment samples of study area.
4. Conclusions
Distributions of concerning heavy metals have been examined to evaluate the pollution status and eco-toxicological aspects. The order of the examined major elements was Na > Fe > Al > K, while the order of heavy metals was Zn > Pb > Cu > Ni > Cd. Different indices such as the Igeo, EF, CD, CF, PLI and RI were used to evaluate pollution status and eco-toxicological aspects. The Igeo and EF data revealed that sediments from the study area were enriched in descending concentrations of Zn > Cu > Pb > Ni > Cd, with Atali A showing the highest enrichment in particular. In addition to this, the CF and CD values demonstrated that all of the sites showed a moderate to a considerable degree of contamination, except Titavi B, which indicated higher anthropogenic pollution. In particular, the highest degree of contamination was observed at Titavi A followed by Atali A and Budhana A. Consequently, the PLI value showed that the overall sediment pollution was the highest at Titavi A followed by Budhana A and Atali A. Further, the observed PLI values (>1 for all metals and sampling sites, except Titavi B) indicated the progressive deterioration of the sites by heavy metal pollution. Eco-toxicological risk assessment indicated a moderate degree of metal contamination, mainly dominated by Ni, Pb, and Zn. These findings indicate that the degree of metal contamination in the sampled sediments is at an alarming stage, which might adversely impact ecosystem health in the near future. Therefore, immediate attention and integrated risk assessment approaches for implementing efficient management strategy are needed to reduce the threat of pollution and to maintain ecological sustainability.
Author Contributions
B.P.S., M.C., P.S., M.G. and M.K. contributed to the design and implementation of research, formal analysis, and manuscript final draft preparation. All authors have read and agreed to the published version of the manuscript.
Funding
This research received no specific grant from any funding agency.
Institutional Review Board Statement
Not applicable.
Informed Consent Statement
Not applicable.
Data Availability Statement
The data presented in this study are available on request from the corresponding author.
Acknowledgments
Authors are thankful to the Environmental Engineering Laboratory, Department of Civil Engineering, SRM Institute of Science and Technology, Modinagar, Ghaziabad, India, and would like to acknowledge the facilities and support provided to conduct this research.
Conflicts of Interest
The authors declare that they have no conflict of interest.
Abbreviations
| AAS | Atomic Absorption Spectroscopy |
| CF | Contamination factor |
| CD | Contamination degree |
| ASV | Average shale values |
| EF | Enrichment factor |
| IRS | Indian River System |
| MLD | Minimal liquid discharge |
| PLI | Pollution load index |
| RI | Ecological risk index |
| TRV | Toxicity reference values |
| WRS | World River system |
References
- Al Obaidy, A.H.M.J.; Talib, A.H.; Zaki, S.R. Environmental assessment of heavy metal distribution in sediments of Tigris River within Baghdad city. Int. J. Adv. Res. 2014, 2, 947–952. [Google Scholar]
- Ashraf, S.; Naveed, M.; Afzal, M.; Seleiman, M.F.; Al-Suhaibani, N.A.; Zahir, Z.A.; Mustafa, A.; Refay, Y.; Alhammad, B.A.; Ashraf, S.; et al. Unveiling the potential of novel macrophytes for the treatment of tannery effluent in vertical flow pilot constructed wetlands. Water 2020, 12, 549. [Google Scholar] [CrossRef] [Green Version]
- Kamboj, N.; Choudhury, M. Impact of solid waste disposal on ground water quality near Gazipur dumping site, Delhi, India. J. Appl. Natural Sci. 2013, 5, 306–312. [Google Scholar] [CrossRef] [Green Version]
- Chen, R.; Chen, H.; Song, L.; Yao, Z.; Meng, F.; Teng, Y. Characterization and source apportionment of heavy metals in the sediments of Lake Tai (China) and its surrounding soils. Sci. Total Environ. 2019, 694, 133819. [Google Scholar] [CrossRef] [PubMed]
- Li, Z.; Liu, J.; Chen, H.; Li, Q.; Yu, C.; Huang, X.; Guo, H. Water environment in the Tibetan Plateau: Heavy metal distribution analysis of surface sediments in the Yarlung Tsangpo River Basin. Environ. Geochem. Health 2019, 42, 2451–2469. [Google Scholar] [CrossRef]
- Seleiman, M.F.; Santanen, A.; Mäkelä, P.S. Recycling sludge on cropland as fertilizer–advantages and risks. Conserv. Recycl. 2020, 155, 104647. [Google Scholar] [CrossRef]
- Choudhury, M.; Jyethi, D.S.; Dutta, J.; Purkayastha, S.P.; Deb, D.; Das, R.; Roy, G.; Sen, T.; Bhattacharyya, K.G. Investigation of groundwater and soil quality near to a municipal waste disposal site in Silchar, Assam, India. Int. J. Energy Water Res. 2021. [Google Scholar] [CrossRef]
- Singh, H.; Singh, D.; Singh, S.K.; Shukla, D.N. Assessment of river water quality and ecological diversity through multivariate statistical techniques, and earth observation dataset of rivers Ghaghara and Gandak, India. Int. J. River Basin Manag. 2017, 15, 1–14. [Google Scholar] [CrossRef]
- Shahid, M.J.; Ali, S.; Shabir, G.; Siddique, M.; Rizwan, M.; Seleiman, M.F.; Afzal, M. Comparing the performance of four macrophytes in bacterial assisted floating treatment wetlands for the removal of trace metals (Fe, Mn, Ni, Pb, and Cr) from polluted river water. Chemosphere 2020, 243, 125353. [Google Scholar] [CrossRef]
- Sharma, R.; Kumar, A.; Singh, N.; Sharma, K. Impact of seasonal variation on water quality of Hindon River: Physicochemical and biological analysis. SN Appl. Sci. 2021, 3, 28. [Google Scholar] [CrossRef]
- Purkayastha, S.P.; Choudhury, M.; Paul, C.D.D. Arsenic contamination in ground water is a serious threat in the North Karimganj block of Karimganj district, Southern part of Assam, India. J. Chem. Pharmaceut. Res. 2015, 7, 371–378. [Google Scholar]
- Huang, Z.; Liu, C.; Zhao, X.; Dong, J.; Zheng, B. Risk assessment of heavy metals in the surface-sediment at the drinking water source of the Xiangjiang River in South China. Environ. Sci. Eur. 2020, 32, 23. [Google Scholar] [CrossRef]
- Shylesh Chandran, M.N.; Mohan, M.; Ramasamy, E.V. Risk assessment of heavy metals in Vembanad Lake sediments (south-west coast of India), based on acid-volatile sulfide (AVS)-simultaneously extracted metal (SEM) approach. Environ. Sci. Pollut. Res. 2018, 25, 7333–7345. [Google Scholar] [CrossRef]
- Liang, A.; Wang, Y.; Guo, H.; Bo, L.; Zhang, S.; Bai, Y. Assessment of pollution and identification of sources of heavy metals in the sediments of Changshou Lake in a branch of the three gorges reservoir. Environ. Sci. Pollut. Res. 2015, 22, 16067–16076. [Google Scholar] [CrossRef] [PubMed]
- Kouidri, M.; Youcef, N.D.; Benabdellah, I.; Ghoubali, R.; Bernoussi, A.; Lagha, A. Enrichment and geoaccumulation of heavy metals and risk assessment of sediments from coast of Ain Temouchent (Algeria). Arab. J. Geosci. 2016, 9, 354. [Google Scholar] [CrossRef]
- Fu, J.; Zhao, C.; Luo, Y.; Liu, C.; Kyzas, G.Z.; Luo, Y.; Zhao, D.; An, S.; Zhu, H. Heavy metals in surface sediments of the Jialu River, China: Their relations to environmental factors. J. Hazard. Mater. 2014, 270, 102–109. [Google Scholar] [CrossRef] [PubMed]
- Lara-Martín, P.A.; Renfro, A.A.; Cochran, J.K.; Brownawell, B.J. Geochronologies of pharmaceuticals in a sewage-impacted estuarine urban setting (Jamaica Bay, New York). Environ. Sci. Technol. 2015, 49, 5948–5955. [Google Scholar] [CrossRef] [PubMed]
- Mishra, S.; Kumar, A.; Shukla, P. Study of water quality in Hindon River using pollution index and environmetrics. Desalin. Water Treat. 2015, 57, 19121–19130. [Google Scholar] [CrossRef]
- Uttar Pradesh Pollution Control Board. Action Plan for Restoration of Polluted Stretch of River Hindon from District Saharanpur to District Ghaziabad. 2019. Available online: http://www.uppcb.com/pdf/PRIORITY-I/RIVER-HINDON-5july19.pdf (accessed on 30 June 2019).
- Kumar, D.; Kumar, V.; Kumari, S. Study on water quality of Hindon river (tributary of Yamuna River). Rasayan J. Chem. 2018, 11, 1477–1484. [Google Scholar] [CrossRef]
- Singh, B.P.; Kumar, Y. Physicochemical Characteristic of Hindon River, Uttar Pradesh (India). IOSR J. Environ. Sci. Toxicol. Food Technol. 2016, 10, 35–38. [Google Scholar]
- Singh, A.; Pandey, R.; Singh, S.K.; Shukla, D.N. Assessment of heavy metal contamination in the sediment of the River Ghaghara, a major tributary of the River Ganga in Northern India. Appl. Water. Sci. 2017, 7, 4133–4149. [Google Scholar] [CrossRef]
- Robin, R.S.; Muduli, P.R.; Vishnu Vardhan, V.B.K.; Ganguly, D.; Abhilash, K.R.; Balasubramanian, T. Heavy metal contamination and risk assessment in the marine environment of Arabian sea, along the southwest coast of India. Am. J. Chem. 2012, 2, 191–208. [Google Scholar]
- Müller, G. Index of Geoaccumulation in Sediments of the Rhine River. Geojournal 1969, 2, 108–118. [Google Scholar]
- Loska, K.; Wiechuya, D. Application of principle component analysis for the estimation of source of heavy metal contamination in surface sediments from the Rybnik Reservoir. Chemosphere 2003, 51, 723–733. [Google Scholar] [CrossRef]
- Hakanson, L. Ecological risk index for aquatic pollution control. A sedimentological approach. Water Res. 1980, 14, 975–1001. [Google Scholar] [CrossRef]
- Mohiuddin, K.M.; Zakir, H.M.; Otomo, K.; Sharmin, S.; Shikazono, N. Geochemical distribution of trace metal pollutants in water and sediments of downstream of an urban river. Int. J. Environ. Sci. Technol. 2010, 7, 17–28. [Google Scholar] [CrossRef] [Green Version]
- Teng, Y.; Wu, J.; Lu, S.; Wang, Y.; Jiao, X.; Song, L. Soil and soil environmental quality monitoring in China: A review. Environ. Int. 2014, 69, 177–199. [Google Scholar] [CrossRef]
- Khan, M.Z.H.; Hasan, M.R.; Khan, M.; Aktar, S.; Fatema, K. Distribution of heavy metals in surface sediments of the Bay of Bengal Coast. J. Toxicol. 2017, 2017, 9235764. [Google Scholar] [CrossRef] [PubMed]
- Liu, S.; Shi, X.; Liu, Y.; Zhu, Z.; Yang, G.; Zhu, A.; Gao, J. Concentration distribution and assessment of heavy metals in sediments of mud area from inner continental shelf of the East China Sea. Environ. Earth Sci. 2011, 64, 567–579. [Google Scholar] [CrossRef]
- Waldichuk, M. Biological availability of metals to marine organisms. Mar. Pollut. Bull. 1985, 16, 7–11. [Google Scholar] [CrossRef]
- Higgins, S.A.; Jaffe, B.E.; Fuller, C.C. Reconstructing sediment age profiles from historical bathymetry change in San Pablo bay, California. Estuar. Coast. Shelf Sci. 2007, 73, 165–174. [Google Scholar] [CrossRef]
- Wang, Y.; Hu, J.; Xiong, K.; Huang, X.; Duan, S. Distribution of heavy metals in core sediments from Baihua Lake. Procedia Environ. Sci. 2012, 16, 51–58. [Google Scholar] [CrossRef] [Green Version]
- Sharma, A.; Malaviya, P.; Choudhury, M.; Paul, C. Performance of germination, development, yield, and pigment on irrigation with untreated paint industry wastewater on Tagetes erecta L. var Pusa basanti. Ann. Romanian Soc. Cell Biol. 2021, 25, 2103–2115. [Google Scholar]
- Partha, V.; Murthya, N.N.; Saxena, P.R. Assessment of heavy metal contamination in soil around hazardous waste disposal sites in Hyderabad city (India): Natural and anthropogenic implications. E3 J. Environ. Res. Manag. 2011, 2, 27–34. [Google Scholar]
- Seleiman, M.F.; Al-Suhaibani, N.; El-Hendawy, S.; Abdella, K.; Alotaibi, M.; Alderfasi, A. Impacts of long- and short-term of irrigation with treated wastewater and synthetic fertilizers on the growth, biomass, heavy metal content, and energy traits of three potential bioenergy crops in arid regions. Energies 2021, 14, 3037. [Google Scholar] [CrossRef]
- Ali, S.; Abbas, Z.; Seleiman, M.F.; Rizwan, M.; YAVAŞ, İ.; Alhammad, B.A.; Shami, A.; Hasanuzzaman, M.; Kalderis, D. Glycine betaine accumulation, significance and interests for heavy metal tolerance in plants. Plants 2020, 9, 896. [Google Scholar] [CrossRef] [PubMed]
- IISc. IISc Environmental Handbook—Documentation on Monitoring and Evaluating Environmental Impacts, Compendium of Environmental Standards. Centre for Ecological Sciences–Indian Institute of Science. 2001. Available online: http://bis.ces.iisc.ernet.in/energy/HC270799/HDL/ENV/START.HTM (accessed on 11 May 2021).
- USEPA. National Recommended Water Quality Criteria-Correction—United State Environmental Protection Agency EPA 822-Z-99-001. 1999. Available online: http://www.epa.gov./ostwater/pci/revcom (accessed on 11 May 2021).
- Suresh, G.; Ramasamy, V.; Meenakshisundaram, V.; Venkatachalapathy, R.; Ponnusamy, V. Influence of mineralogical and heavy metal composition on natural radionuclide contents in the river sediments. Appl. Radiat. Isot. 2011, 69, 1466–1474. [Google Scholar] [CrossRef]
- Jain, C.K.; Singhal, D.C.; Sharma, M.K. Metal pollution assessment of sediment and water in the river Hindon, India. Environ. Monit. Assess. 2005, 105, 193–207. [Google Scholar] [CrossRef]
- Jumbe, A.S.; Nandini, N. Heavy Metals analysis and sediment quality values in urban lakes. Am. J. Environ. Sci. 2009, 5, 678–687. [Google Scholar] [CrossRef]
- Nayek, S.; Gupta, S.; Saha, R.N. Heavy metal distribution and chemical fractionation in water, suspended solids and bed sediments of industrial discharge channel: An implication to ecological risk. Res. J. Chem. Environ. 2013, 17, 26–33. [Google Scholar]
Publisher’s Note: MDPI stays neutral with regard to jurisdictional claims in published maps and institutional affiliations. |
© 2021 by the authors. Licensee MDPI, Basel, Switzerland. This article is an open access article distributed under the terms and conditions of the Creative Commons Attribution (CC BY) license (https://creativecommons.org/licenses/by/4.0/).