Article

Obtaining Data Values from Tourist Preferences

1
Advance/CSG, ISEG-Universidade de Lisboa, Portugal & CINAV, Escola Naval, Instituto Universitário Militar, Base Naval de Lisboa, 2810-001 Almada, Portugal
2
CITTA—Research Centre for Territory, Transports and Environment & FEUP-Faculty of Engineering of University of Porto, 4200-465 Porto, Portugal
3
CIMA-Research Centre in Mathematics and Applications & Azores University, 9500-321 Ponta Delgada, Portugal
*
Author to whom correspondence should be addressed.
Sustainability 2021, 13(18), 10276; https://doi.org/10.3390/su131810276
Submission received: 31 July 2021 / Revised: 27 August 2021 / Accepted: 3 September 2021 / Published: 14 September 2021

Abstract

:
Satisfied customers are the main sustainability factor for the viability of any activity, and tourism has increasing relevance to the global economy and the economic development of many regions. In order to create better matches between tourist demands and preferences and the local supply, an understanding of tourists as decision makers is necessary. The aim of this work is to introduce a mathematical model that explains the decision-making process of tourists, other consumers, and tourism business managers. We used a mathematical model, taking into consideration the preferences of individuals and their strengths during the exploration and use of tourism resources. The integration of preferences into an IT tool provided extra support to the decisions of tourists and allowed better choices to be made in the execution of travel plans. In addition, the model can be used by resource managers. Understanding how tourists make decisions in each different situation can improve the allocation of available resources to satisfy their expectations. The proposed model is also adaptable to situations where it is necessary to decide among different options with a high degree of complexity.

1. Introduction

The tourism industry has been growing steadily over the past few decades. While its impacts on the environment are debatable [1,2,3], its socioeconomic impacts are not [4,5]. Due to its potential for the development of rural areas, regional development policies are increasingly incorporating tourism into their strategies. A good-practice recommendation for regional development planning is to involve local stakeholders and to consider tourists’ demands and preferences [6], which is also helpful for local businesses. Tourists represent a special category of consumer that, in the majority of cases, really does not know the products and services they will consume. Their preferences can only be known by asking each individual, or by extrapolating from preferences expressed by previous tourists. Another important way of understanding tourist preferences, especially when there are no historical data, is to identify the push and pull motivation factors of the visitors of a destination, so that travel and consumer patterns can be adjusted in accordance with future demand [7].
Traditional economics is based on the rationality of consumption; that is, the idea that consumers make decisions based on maximizing personal utility. However, when it comes to leisure activities, people often make decisions based on non-rational criteria. Tourists, for example, are more complex decision makers because they are displaced from their environment and have only a limited knowledge of the place they are visiting.
In the current market, competition is global, and consumers are demanding customized products, such that both consumers and suppliers need to take into consideration many variables, which generates contradictions and sometimes decision conflicts. From the consumer’s perspective, the quantity and diversity of the possible alternatives may lead to difficulties making a decision: How should feasible alternatives be evaluated? The level of difficulty increases exponentially for composite products, such as a family car or the activities to be carried out during a holiday, because these have multiple features or items, and the assessment of each of them is based on qualitative factors. From the supplier’s point of view, the need to adapt quickly to client preferences and deal with a high level of uncertainty while maintaining production efficiency, which can affect resource management. In order to help both consumers and suppliers to make decisions, it is necessary to develop evaluation algorithms and tools to take account of as much information as possible, including information that might usually be regarded as irrelevant.
With the development of information and communication technologies (ICT), traditional industries are gradually moving towards being “smart industries”, wherein collecting and sharing data helps industries, like traditional tourism, evolve [8]. Using datasets to understand consumer preferences can help suppliers design offers that might better match tourist demands. Extracting and using data offers new opportunities to improve productivity and efficiency [9,10], but it also presents new challenges [11]. In order to obtain an effective advantage, ICT must be presented in universal and adjustable models, address physical and emotional/experiential dimensions, and consider the different needs and values of the different stakeholders, especially those of the tourist/client [12]. Tourists’ and other consumers’ decision-making has been studied from different perspectives: from the motivation to consume (the push factor) [13,14] to the attractiveness of the destination or product (the pull factor) [15,16], or both [17,18]. For example, the location and existing resources are pull factors when assessing the attractiveness of a potential destination [16,19,20].
To improve the understanding of tourist behavior and to improve sustainable resource management, multiple-criteria decision-making (MCDM) models are often used to help with managerial decision making [21,22,23], including in tourism [24,25]. So far, we have not identified an intuitive mathematical formulation with a practical perspective that can integrate consumer decision-making based on resource characteristics with ICT tools, such as phone apps.
The purpose of this work was to introduce a mathematical model based on MCDM and fuzzy tools to merge the quantitative factors of the resource characteristics of resources with the qualitative factors of consumer preferences in relation to these characteristics. The proposed model, as a management tool, will benefit both sides: First, it will enable tourists to evaluate different options quantitatively, thereby making their decision-making simpler and more rational. Second, resource managers and suppliers, based on the knowledge of their customers’ preferences, will be able to predict their needs more efficiently. Third, when consumers and suppliers use a common tool based on the same algorithm, further adjustments between supply and demand will benefit both.
When it is embedded in a tourism IT application, this model will help (1) tourists to select resources that better suit their preferences according to their type, accessibility or cost; (2) tourism service providers simulate and obtain data related to a tourist’s consumer profile; and (3) tourism authorities gain better knowledge of the destination activities and needs of the interested parties. Therefore, a synthetic example of how this model applies to tourism is presented.
This document comprises six sections. Besides this introduction, section two offers a summarized theoretical background concerning decision-making, section three identifies the principles and methodology in the model’s construction, section four presents the proposed model, and section five offers a practical and generic example for model implementation, which is followed by a conclusion.

2. Background

Every day, we are faced with situations in which we must make rational decisions from among different options. Consumption decisions, though, are not always rational, and violate the rules of economic utility theory [26]. Preferences, or heart reasons, play an important role in a consumer’s decision [27], yet often, managers make decisions based on historical consumption data or intuition [28]. Understanding how consumers decide will help managers adjust products or services to improve consumer satisfaction and manage the available resources better [29].
The hypothesis that tourism can generate economic growth has been the subject of several studies since an initial paper on it was published in 2002 [30]. Since then, the tourism-led growth hypothesis has found general approval in dozens of studies using Granger causality testing, although several exceptions were noted [31]. Nevertheless, due to the limited number of countries studied, and the concentration on countries receiving a significant number of tourists, the hypothesis should be considered with caution. The extent to which the economic growth of a country is tourism-led depends on issues such as its economic development, political stability, and governmental institutions [32].
Investments in the tourism industry tend to concentrate on locations with better infrastructure that can accommodate mass tourism [33,34]. On the other hand, tourism, although challenging, is one of the few promising economic activities for rural development in light of ageing and shrinking rural populations, and decreased job opportunities [35,36]. Tourism can reduce poverty and narrow the development gap [37,38]. Tourism’s importance is not limited to the economy; it can be an essential factor in the sustainable development of society and the environment, especially in small, isolated, or underdeveloped regions [39,40]. For instance, the nature-based tourism trend that has emerged in the recent decades could bring economic benefits while encouraging environmental protection and sustainable resource management [41].
The extent to which destinations address tourist demands influences their economic success. Satisfied tourists are more likely to return and recommend the destination to others [42]. With the evolving socio-cultural changes, new consumer demands emerge, and businesses need to adapt. Independent tourists are a special category because they are out of their normal environment, and intend to cut back their daily routine, such that their consumption decisions are affected by factors unique to each person and destination, as presented in Table 1.
For each tourist destination, it is possible to identify common features. Those in urban areas tend to offer cultural and social interactions concentrated in a relatively small area, with transport multiple options. Destinations in mainly rural or uninhabited areas tend to focus on activities based on the nature and ethnography of the region, and cover larger areas, often requiring a tourist-dedicated means of transport. A common trend for both types of location is to provide tourists with programs that include a set of resources and travel between them. These proposed itineraries simplify the task of having to choose which resources to use or visit.
A special category of resources is walking trails, because they are both an individual resource and a set of resources. They are not restricted to one geographical point, but to a set of points mapped on a line. Although they are more related to natural environments, they may exist, in whole or in part, in rural or urban areas. The tourist preferences and satisfaction factors for walking trails are different from those for other types of resources, as shown by Bichler and Peters [44].
When we refer to a set of resources, an itinerary, the planning requirement is greater. In order to ensure tourist satisfaction, it is sometimes necessary to include flexibility and variations that satisfy the preferences of each user. Knowing the decision-making process of tourists can bring advantages for managers and tourists themselves. For managers, it is essential for the definition of the strategy of a tourist destination, or for managing resources efficiently. For tourists, having access to information on resources adjusted to their preferences is an added value. If, in addition, an itinerary of activities is proposed, making decisions will be simplified. The more efficient management of resources, and the resulting improvement in visitor satisfaction, will create a positive spiral of development for the tourism destination and its regions.
According to Saaty [45], before a decision can be made, the issue must be known, as well as all of the aspects of the decision: its need and purpose, criteria, sub-criteria, stakeholders, and the possible alternatives. Because a set of objectives and related criteria may conflict, there needs to be process that can resolve the issue. In each decision-making process, it is possible to use different techniques for multi-objective optimization. When there are several combinations of resolutions that can optimize the criteria, and if the decision maker is to have the freedom to choose among them, the most appropriate is a method based on an approximation to the Pareto frontier. This method identifies a set of possible solutions and the border values that optimize each of the criteria under analysis. The selection of the best solution can be reached by using the decision-maker’s preference, or by applying an auxiliary optimization problem [46]. Despite the importance of the fact that the Pareto-optimal concept enables the optimization of multi-objective problems, researchers like Mattson and Messac [47] believe that its use as a conceptual tool has not yet been fully explored. Figure 1 represents a possible solution region (A) and its restriction by applying the Pareto frontiers to four user preference criteria. The darker region (B) is the set of restricted possible options for a specific user. This technique simplifies decision-making (from A to B), and at the same time allows the decision maker some degree of freedom of choice (area of the B region).
In a practical way, in order to help tourists to decide among resources or sets of resources, and to assist resource managers, it is necessary to develop the proper tools, and for this there is a large set of informatics tools and apps that identify resources and their features. However, an excess of information can be a source of noise, so the tool must reduce the large quantity of viable sets to a smaller number of resource sets in a smart way by considering tourist preferences and integrating additional information, like health, about each individual. Here, we present a solution to this problem using a mathematical model that behaves like a multicriteria model to produce solutions using the strength of modern fuzzy mathematical models.
Zadeh [48,49] proposed the theory of “fuzzy”, or diffuse, sets as a way of assigning rationality to the uncertainty created by human imprecision and vagueness. This theory is especially powerful when considering the ideas and appreciations of people based on complexity, excess data, or unreliable information. Its main contribution is the possibility of representing vague knowledge in quantitative terms to allow the application of mathematical operators to subjects shrouded in relativity and dependent on the will of human judgment. Fuzzy theory, therefore, represents the knowledge of decision-makers in a more natural and realistic way, and quantifies human imprecision [50].

3. Materials and Methods

3.1. Methodology

Multi-objective optimization problems (MOPs) require the consideration of multiple and conflicting criteria [51]. Purely in mathematical terms, MOPs can identify an optimal solution, but when the decisions are affected by uncertainty and human irrationality, fuzzy logic can be adopted to obtain suitable solutions to specific problems [51,52,53]. Knowing the preferences of the decision-maker, user, or consumer can help us to select the best possible solution [51].
The modelling of decision-making in relation to the selection of one option over others must adjust the different options to the preferences of the decision-maker. In order to ensure that all factors and interrelationships are quantified, we chose to include all of them in a single function. In order to include quantifications resulting from relative human evaluations, this multicriterial function included fuzzy mathematical concepts similar to the ones used in Wang [50].
The assessment and comparison of simple and homogeneous resources can be an easy procedure, but often the number of resources that affects a decision is large and heterogeneous. Making a choice among different options can be performed by assigning each option a value, or weight, that results from the quantification of each of its characteristics by the decision-maker. However, because some resources have a preponderant value regarding the objective to be optimized, resources should not all be quantified according to the same standard. Some should have a reinforced value. These cases, identified as a k- r e s o u r c e , or simply k , must be processed independently so that their reinforced value can be met. Resources of normal value will be identified as a p- r e s o u r c e , or simply by p .
Definition 1: k- r e s o u r c e s and p- r e s o u r c e s . The identifiers k- r e s o u r c e and p- r e s o u r c e are defined as the matrices of dimension 1 × n , the entries of which are the n resources of the same type existing in the network. For example, if k- r e s o u r c e = T , then the resources from family T are considered to have a weight with the reinforced value T 1     T n ; that is, T = [ T 1 T n ] .
Definition 2: Resources. If z = r + s , then the totality of the different types of resources in the network and the set of them can be given as X = { X ( 1 ) ,   X ( 2 ) ,   ,   X ( r ) ,   X ( r + 1 ) ,   ,   X ( r + s ) } .
The k- r e s o u r c e and p- r e s o u r c e are subsets of X . Let us assume that k- r e s o u r c e = { X ( 1 ) ,     X ( 2 ) ,   ,   X ( r ) } and p- r e s o u r c e = { X ( r + 1 ) ,   ,   X ( r + s ) } are disjoint sets. Straightaway, it follows that #k- r e s o u r c e = r   and #p- r e s o u r c e = s . The exponent j is used to generically identify each of the various types of k- r e s o u r c e and p- r e s o u r c e . We can have, for example, X ( 1 ) = T ; that is, X ( 1 ) represents the family of resource T , and then [ T 1 T n ] = [ X 1 ( 1 )   X 2 ( 1 )     X n ( 1 ) ] .
Definition 3: Resources used. X * X is the set of resources in the network consumed by the user.
Definition 1.
Diagonal matrix of the k- r e s o u r c e : Define X ( k ) ^ as the diagonal matrix in which the elements of the main diagonal are the resources of type X 1 ( k ) to X n ( k ) ; that is,
X ( k ) ^ = [ X 1 ( k ) 0 0 X 2 ( k ) 0 0 0 0 0 0 0 0 X n 1 ( k ) 0 0 X n ( k ) ] .
In Definition 1, the diagonal in the matrix X ( k ) ^ has quantitative information related to all of the resources from the family type represented by k . Given that the influence of the different resources on the decision may not be homogeneous in the model’s objective function, the weight of the k- r e s o u r c e will be calculated as shown in Equation (1), if k- r e s o u r c e = X .
X ( k ) × X ( k ) ^ = [ X 1 ( k ) 2 X 2 ( k ) 2 X n ( k ) 2 ]
Thus, it is ensured that k- r e s o u r c e s have a quadratic, non-linear growth due to the reinforced value in the structure of the study. If | X i ( k ) | < 1 , we have a reduced weight resource, and it will have a lower contribution to the global value of the objective function. In the opposite way, if | X i ( k ) | < 1 , we have a reinforced weight resource, and it will have a higher influence. In this way, we can deduce that the resources X i ( k ) , which have quantitative information very close to zero or very high, will have a significant influence on the model’s objective function value.
Definition 2.
Resource reputation metrics: Consider a set of resource references R E F = { r e f 1 ,   r e f 2 ,   } , with variable size depending on the amounts of the valuation indices of a resource that are available in a given database. Each of the references in the database will compete to assign a weight,  p i , to each resource  X m ( j ) , following three possible valuation parameters depending on the characteristics of each reference. If the reference r e f i R E F is like the local official tourism guide handbook database, it will assign the value of 1.5 to the resource X m ( j ) ; if it is mentioned in the highlighted section, the value = 1; if it is revealed in the remaining sections, the value = 0 if it is not referenced. If the reference  r e f i R E F is related to the official tourism site or an equivalent site database, we assigned the value 1 if it was mentioned, and 0 otherwise. If the reference  r e f i R E F is Tripadvisor or a similar database, we assigned a value determined by the weighted average of the assessments made by the users, depending on the scale used and the number of users in the database. In addition, each reference, r e f i ,   applies an importance factor,  f i , in the valuation of the resource, such that f i = 1 . The resource reputation metric is the norm.
X m ( j ) = f i × p i ,   for   each   j ,   with   i = 1 ,   2 ,   ,   # R E F ,   with   m = 1 ,   2 ,   ,   n .
Definition 3.
Weight of the resource: The function weight of the resource is the function W X :   X m ( j ) X .
W X ( X m ( j ) ) = X m ( j ) d ,   for   each   j ,   with   m = 1 , 2 ,   , n
Definition 4.
Matrix of resource weights: The matrix of the resource weights X m ( j ) is, for each j, the matrix
[ P X ( X 1 ( j ) ) P X ( X 2 ( j ) )   P X ( X n ( j ) ) ] = [ X 1 ( j )   X 2 ( j )     X n ( j ) ]  
For reasons of simplicity, we represented the weight matrix of the k- r e s o u r c e s by X k and the weight matrix of the p- r e s o u r c e s by X p .
In addition to the reasons relating to the resource’s characteristics, there are intrinsic factors that determine the consumer’s decision. Because it is not always possible to recognize preferences in a complete and objective way, quantification is difficult. In this sense, we chose to create two levels of user value preferences: one related to the proportion of the comparative preference among different families of resources, and the other related to the quantitative preference for each feature of the resource that was relevant to the decision.
Definition 5.
Preference per resource type: The map Π X   = Π { X ( 1 ) ,   X ( 2 ) ,   ,   X ( z ) }   is defined as the preference assigned by the user to each type of resource family. For simplicity, if the preference of a k- r e s o u r c e is being calculated, it will be represented by  Π k   , and the preference of a p- r e s o u r c e will be  Π p   .
Definition 6.
Preference assigned to each resource by distinct user profiles: The function
A ^ P U   : X z × n × # P U  
is defined as the preference assigned to each resource by the distinct user profiles in such a way that for the resources X m ( j ) X , the function shows the preference given by a specific user profile to each resource. It considers the resource characteristics X m ( j ) and the profiles P U that can be applied to the user U , to arrive at expression (4):
A ^ P U ( X m ( j )   ) = C X m ( j )   ,   P U  
The elements of the matrix C are the values obtained by a questionnaire that collected users’ comparative preferences regarding the characteristics of the potentially available resources, X m ( j ) .
Definition 7.
Preference assigned to each resource by the user-adjusted profile: The function
A   : X z × n  
is the constraint of function (4), such that, for the resources X m ( j ) X , the function image expresses a personal user preference for each resource. Considering the characteristics of the resources X m ( j ) , and selecting only one profile, the function generates the profile most suitable for the user U , with the intention of obtaining expression (5).
A P U ( X m ( j )   ) = A ( X m ( j )   ) = C X m ( j )   ,   P U   ,   for   a   fixed   P U  
In expression (5), the fixed P U corresponds to the most suitable profile for a specific user. For simplicity, let A ( X m ( j ) ) be represented by A X . Thus, if it is being calculated, the accessibility to a k- r e s o u r c e will be represented by A k   and by A p   for the accessibility to a p- r e s o u r c e . To simplify the A X calculation, we needed to define a distance between the different users’ preferences.
Definition 8.
Preference distance: Consider the matrix C = C [ i   j ] and the column vector P [ i ] . The preferred distance is defined as
d j ( C , P ) = C P j = M i n { N [ j ] } ,   with   j = 1 ,   ,   # P U
with
N [ j ] = i = 1 n × z ( C [ i   j ] P [ i ] ) 2 ,   for   each   j = 1 ,   ,   # P U
The selection of the most suitable profile is performed by calculating the deviation for each element, with P U varying from 1 to the maximum number of profiles in relation to the profile of the user under analysis.
C X m ( j )   ,   P U  
After calculating the values, the fit profile P U is the profile j , which gives the lowest value of d j ( C , P ) .
When considering resource networks more comprehensively, they can have a material or immaterial existence. In the second case, we can give, as an example, the specific culture of a region or community. When we talk about resources such as monuments, a pedestrian route, or a social event, they have a physical existence in space. If we want to evaluate their accessibility in terms of availability, we have to consider time, as some of them are not always accessible. If we want to represent the proximity of each available resource to the preferences of the tourist, we generate a “conceptual network of resources”, where the edges represent the distances between the resource characteristics (nodes) and decision-maker preferences. The accessibility of a node can be evaluated according to different measures, such as the node degree or the distance to reach it. When the edges have associated weights that influence the level of accessibility, these must be considered. In this case, it is the distance of the consumer to the nodes that corresponds to the valuation of the edges to be used, i.e., the path, and this should be taken as an accessibility factor.
Definition 9.
Geographic distance to the resource: Consider U, the position that the potential user fills in the network. Thus, we have the distance from the user’s position to the resource X m ( j ) for some  j with  m = 1 ,   2 ,   , calculated by (8).
d X , U = | ( X m ( j ) U ) |
After assigning the order of the node where the resource  X m ( j ) is located, the distance for some   j with  m = 1 ,   2 ,   . , is given by  ( X m ( j ) ) .
Definition 10.
Accessibility level: Let Θ : X , such that for the resources
X m ( j ) X ,     m = 1 ,   2 ,   ,
where each function image expresses the level of accessibility of each node where the resources are located to obtain the expression (9).
Θ ( X m ( j ) ) = o n ( X m ( j ) )   .   | ( X m ( j ) U ) |
For simplification, let us represent  Θ ( X m ( j ) ) by  Θ X . Thus, if it is being calculated, the accessibility to a k- r e s o u r c e will be represented by  Θ k ,   and by  Θ p   for accessibility to a p- r e s o u r c e .
Definition 11.
Objective function: Let the model’s objective function be defined as shown in (10).
Ψ ( X ) = k Π k .   Θ k   . A k   . ( X ^ k   .   X k ) + p Π p .   Θ p . A p . X p
The model represented by the map Ψ is dynamic. It allows different values over time as the resources that integrate it, and the values that are attached to them, vary. The different values of Ψ and the data for each resource are stored in a vector, but only the highest values are selected. This procedure will allow the proposal of the resource structure that provides the highest value, without discarding the remaining ones.
The application of the function is subject to restrictions that change with the different practical applications and proposed objectives. The objective function takes on extreme values depending on the region in which it is applied, and on the accessibility of the resources and user preferences. The minimum value of 0 units was obtained for the total non-use of resources.
The foundation of a matrix where the entries have the values of Ψ   ( X ) makes the generalization process to enable the application of the model to various situations easier. Broadly speaking, this model can be adjusted to any situation where it is necessary to set a strategy to use different resources based on the preferences of its users. For a more detailed identification of the restrictions and general presentation of the model, please see [28].

3.2. An Example of the Implementation

In order to make the implementation of the proposed model more perceptible, a simplified application example is introduced.
Scenario: A couple (Alpha and Beta), each with very different personal interests, decides to take a holiday in a small, isolated village. Alpha enjoys contact with nature and knows the history and culture of the local people; Beta prefers social life and contact with culture. “Fireland”, a small region much appreciated by tourists, consists of a small village surrounded by a vast green area, where the main attractions are related to its volcanic origin. Social resources, like monuments, an ethnographic museum, and several places to eat are also available. Alpha and Beta arrive by public transport and have seven hours until the return transport to their hotel, so they must carefully select which resources to visit. At the destination, travel is on foot. The scenario presented in Figure 2; although it is based on real data, it is necessarily simplified.
According to information obtained previously from their hotel, the tourist resources available on that day are those shown in Table 2. In addition to their identification, a classification of each resource is presented. Their relevance considers the number of visitors in previous years and the references on websites specializing in tourism. Based on the principle defined in Equation (1), the resources that have a greater attractiveness for tourists assume a reinforced decision-making value. The accessibility of each resource was calculated according to its distance at each moment of decision, as well as the route’s degree of difficulty for a pedestrian. As the start and end point of the journey, the village’s first bus stop was considered, located near the T2 resource. The average time of use of each resource and the preference expressed by both tourists in relation to each classification is also presented.
To identify the different viable alternatives, it was necessary to estimate the distances between the resources and the travel time, considering the type of transport used. In order to build a matrix of the distances, it was first necessary to create a network showing the available resources (shapes) and the paths that make the visits possible (edges), as represented in the graph in Figure 3.
The identification of the different possible sets of resources, i.e., the itinerary, considered possible restrictions, such as the start point, the intended end point, mandatory resources, and time constraints. An example of the mandatory use of a resource is a restaurant, which was required only once during the stay. By calculating the utility value or satisfaction that the tourist obtains with each option, based on the objective Ψ function, Equation (10), it is possible to arrange the alternatives, thus easing the tourist’s decision-making process. Table 3 presents two different ways to use the tool to support tourist decision-making: individual resource or itinerary selection.
For the individual resource selection, a decision was made in the moment without prior planning; that is, the tourist was touring the territory and, after using a resource, decided on the next resource to visit. In this case, we selected resources directly accessible from the start point (T2, N6, S1, S2 and N2) and those that were in the vicinity defined as the radius of the circumference covering the maximum distance intended by the tourist. The N2 resource was excluded because it was outside the vicinity. The values of the potential satisfaction obtained by using each resource are presented in the first part of Table 3.
The itinerary selection was made as a planned tour. The choice of resources was linked to consumer preferences, and the order of consumption minimized distance or time. In this case, itinerary A was built considering what the normal selection would be for a tourist who prefers natural resources, like Alpha, starting with the resource most valued at the start point and at each resource point. Itinerary B considered tourists who prefer social resources, like Beta. Itinerary C is a balance of both options, another possible itinerary to be identified.
The percentage value, presented in Table 3, refers to the ratio of satisfaction for each alternative, with the value to be obtained from the use of all of the available resources. From the values obtained for the planning of an itinerary for the whole day, it is possible to mention the following:
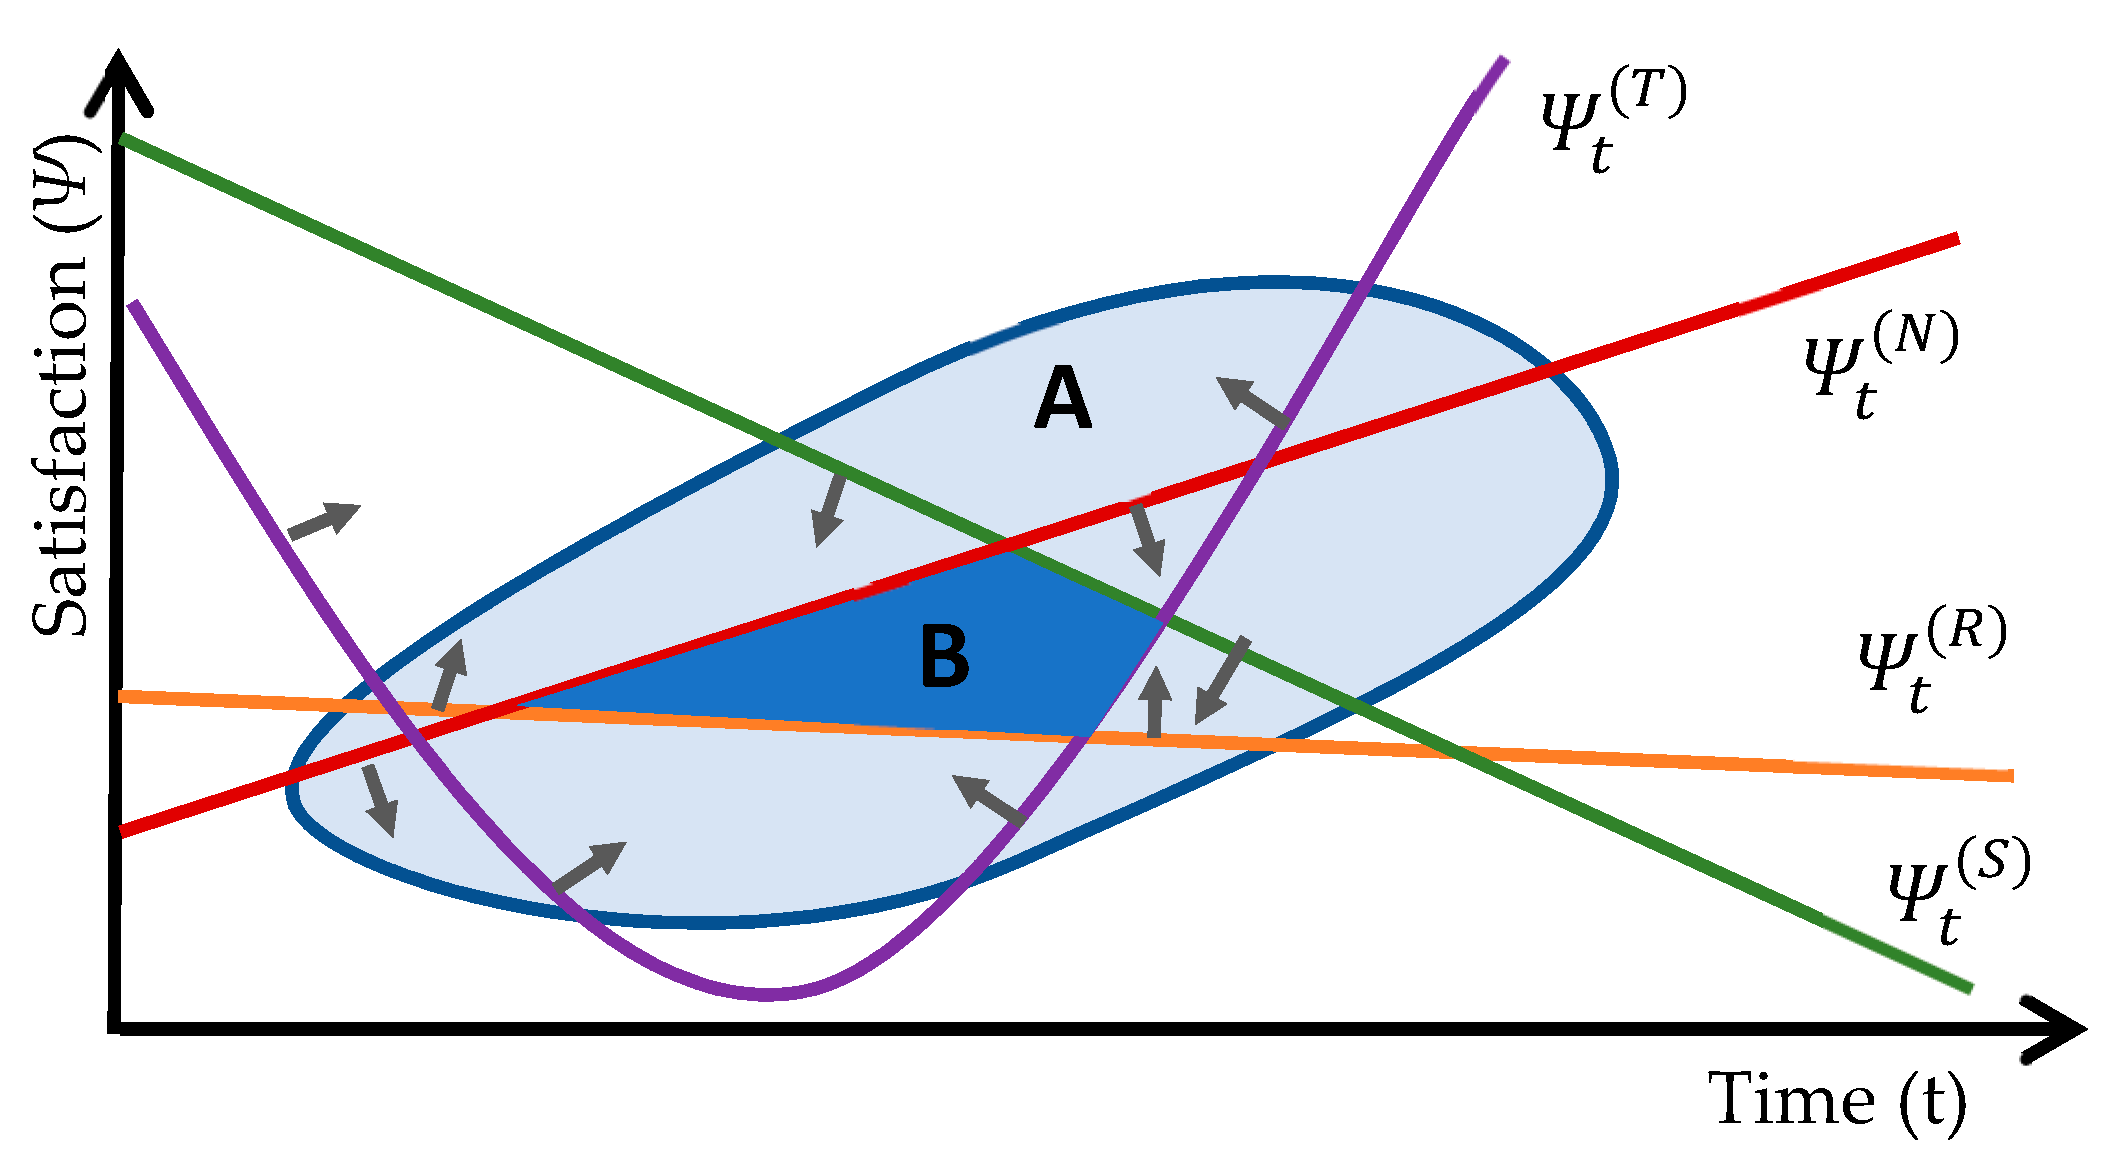
  • Itinerary A includes a pedestrian walk in a natural environment, five natural resources and a restaurant. Of the three, this is the one that includes more nature resources (N + T), so is more adjusted to tourists with a nature profile, as is the case for Alpha. The values obtained from Ψ showed this: a nature tourism fan can achieve a relative satisfaction of 72%, compared to 16% for a social tourist.
  • Itinerary B—Of the three, B is the most balanced, with four nature resources, three social resources and a restaurant. The Ψ value presents this balance in both profiles (51% and 58%). It will be a good compromise option for our tourist couple.
  • Itinerary C—With four social and two nature resources and a restaurant, this is the one that would be the most suitable itinerary for tourists with a profile identical to Beta. The high value obtained (90%) is explained by the fact that this is a natural resource destination, and the itinerary included all of the resources most valued by tourists in the social category. Again, the values obtained for Ψ met what would be the expected relative value.
The decisions made by the tourists at each node of the network updated the decision-pattern database, enabling a learning system. The historical data of the options related to resource use contributed to the updating of the value of the intrinsic relevance of each resource.
For managers and stakeholders who supply tourist resources, knowing the decision of each tourist profile in each situation enables more accurate planning and more efficient management.

4. Discussion

The sustainability of any activity must consider the triple bottom line of economic, social and environmental factors. We achieve sustainability when it is possible to plan activities efficiently, which gives value to consumer satisfaction. By working with consumer preferences related to resource features, our model enhances tourist consumption because it provides better access to resources and improved decision making.
As shown in Table 3 in Section 3.1, each consumer assigns a different value to each resource according to its characteristics and personal preferences; consequently, the quantitative value for Ψ was different for each type of resource and consumer. For example, Ψ Alpha ( N 2 ) = 8.86 was greater than Ψ Alpha ( S 1 ) = 0.40 or Ψ Alpha ( S 2 ) = 0.3 , showing that Alpha preferred natural resources to social ones. For Beta, Ψ Beta ( S 1 ) = 10.56 was greater than Ψ Beta ( N 2 ) = 2.17 or Ψ Beta ( T 2 ) = 0.55 , showing that Beta preferred social resources to natural ones.
Although Beta had a preference for social resources, the model assigned a higher value to N6 than S2. This can be explained by the fact that N6 had hidden social characteristics that Beta did not recognize but which Ψ identified as relevant to Beta’s profile. This result followed the Ψ construction, where each resource was not closed; that is, it was not entirely dedicated to just one feature. Therefore, even a natural resource can have some social components, and can share characteristics with other resources that can be uncovered and measured with the help of Ψ.
Nevertheless, beyond the importance of each resource to the consumer, there are other factors, e.g., accessibility and time, which can influence the choice of each resource. When resources are geographically dispersed, as normally happens in tourism, accessibility and time are important, as they can restrict the consumer’s itinerary proposed, which limits the number of resources to be used.
Using itineraries A, B and C as examples, among others that could have been created for Alpha and Beta and submitted to the Ψ evaluation, it is easy to see that itinerary A was the best choice for Alpha and itinerary C the best for Beta, but together the choice of itinerary had to be subjected to negotiation to fulfill both profiles. With the help of Ψ, the decision makers evaluated an itinerary that was acceptable. Then, defining the minimum value of 50% for each component, Ψ i ( A ) , Ψ i ( B ) and Ψ i ( C ) , for i { Alpha ,   Beta } ,   to be classified as acceptable by the group’s elements, we observed in Table 3 that itinerary B was the only one that fulfilled this requirement.
Constructed as a tool to help decision-making processes, our model helps resource managers obtain the most sustainable option. Then, considering the example in this paper, if most tourists visiting Fireland have a nature profile, like Alpha, a high demand for resource T2 is to be expected. With this information, business managers may increase related services, creating, for example, support food services, or a gear shop near N2 or N3, in the middle of the T2 walking trail, to add economic value. Furthermore, authorities can reinforce the security and build optimized plans of use for T2 by providing sustainable alternatives, as it is almost common sense that better resource planning leads to more satisfied customers.

5. Conclusions

Tourism is of special relevance to the global economy, and to the sustainability of many regions. The greater the satisfaction from tourists, the greater the sustainability of the activity and of the region, especially in economic terms. On the other hand, to improve suitability, managers of tourism resources must meet the needs and preferences of the tourists. It is therefore vital that tourists make better consumer decisions to achieve the highest level of satisfaction so that managers can forecast demand in a way that is adjusted to reality.
The proposed model, based on multi-objective optimization and fuzzy logic, quantifies the level of satisfaction to be achieved from the consumption of a good or a set of goods. It considers not only the characteristics of the good under assessment but also user preferences in relation to its features. The model was conceived in a generic way to allow for its adjustment to different consumption situations, and to enable the identification of intrinsic and external resource characteristics. Because the diversity of human beings dictates the non-homogeneity of their behavior, different user profiles were considered. By increasing the weight (relevance) of resources with greater relevance to the user profile, it was possible to obtain results with greater amplitude, thereby reducing the ambiguity.
The inclusion of the function in a computer application allows not only the calculation of satisfaction but also the accumulation of historical data for each consumer profile, making the system capable of becoming more and more accurate.
The proposed function is particularly suitable for tourism, as shown in the example, but it can be adapted to other situations where goods vary in their characteristics, such as the purchase of a house, car or training course.
As the main limitations, we identified the non-existence of a real case study application that would categorically confirm the robustness and suitability of the model. Future lines of investigation can focus on testing the proposed model in different consumption situations wherein consumer preferences are relevant.

Author Contributions

Conceptualization, A.F. and J.C.; Data curation, A.F.; Formal analysis, J.C. and Á.C.; Funding acquisition, J.C.; Investigation, A.F., J.C. and E.R.; Methodology, J.C. and Á.C.; Project administration, A.F. and J.C.; Resources, A.F.; Software, A.F.; Supervision, A.F.; Validation, A.F., J.C., E.R. and Á.C.; Visualization, A.F.; Writing—review and editing, A.F., J.C., E.R. and Á.C. All authors have read and agreed to the published version of the manuscript.

Funding

This work was supported by FCT, the Portuguese national funding agency for science, research and technology, Portugal. Projects UIDB/04674/2021.

Institutional Review Board Statement

Not applicable.

Informed Consent Statement

Not applicable.

Data Availability Statement

The data presented in this study are available on request from the corresponding author.

Acknowledgments

The authors would like to express their appreciation to TRENMO S.A. for its support.

Conflicts of Interest

The authors declare no conflict of interest. The funders had no role in the design of the study; in the collection, analyses, or interpretation of data; in the writing of the manuscript, or in the decision to publish the results.

References

  1. Sharpley, R. Tourism and sustainable development: Exploring the theoretical divide. J. Sustain. Tour. 2000, 8, 1–19. [Google Scholar] [CrossRef]
  2. Budeanu, A. Sustainable tourist behaviour—A discussion of opportunities for change. Int. J. Consum. Stud. 2007, 31, 499–508. [Google Scholar] [CrossRef]
  3. Nocca, F. The Role of Cultural Heritage in Sustainable Development: Multidimensional Indicators as Decision-Making Tool. Sustainability 2017, 9, 1882. [Google Scholar] [CrossRef] [Green Version]
  4. Souza, T.V.S.B.; Thapa, B.; Rodrigues, C.G.O.; Imori, D. Economic impacts of tourism in protected areas of Brazil. J. Sustain. Tour. 2019, 27, 735–749. [Google Scholar] [CrossRef]
  5. Zhuang, X.; Yao, Y.; Li, J.J. Sociocultural impacts of tourism on residents of world cultural heritage sites in China. Sustainability 2019, 11, 840. [Google Scholar] [CrossRef] [Green Version]
  6. Lankford, S.V. Attitudes and perceptions toward tourism and rural regional development. J. Travel Res. 1994, 32, 35–43. [Google Scholar] [CrossRef]
  7. Fieger, P.; Prayag, G.; Bruwer, J. ‘Pull’motivation: An activity-based typology of international visitors to New Zealand. Curr. Issues Tour. 2019, 22, 173–196. [Google Scholar] [CrossRef]
  8. Gretzel, U.; Sigala, M.; Xiang, Z.; Koo, C. Smart tourism: Foundations and developments. Electron. Mark. 2015, 25, 179–188. [Google Scholar] [CrossRef] [Green Version]
  9. Ardito, L.; Cerchione, R.; Vecchio, P.; Raguseo, E. Big data in smart tourism: Challenges, issues and opportunities. Curr. Issues Tour. 2019, 22, 1805–1809. [Google Scholar] [CrossRef] [Green Version]
  10. Sorooshian, S. Implementation of an Expanded Decision-Making Technique to Comment on Sweden Readiness for Digital Tourism. Systems 2021, 9, 50. [Google Scholar] [CrossRef]
  11. Alrawadieh, Z.; Alrawadieh, Z.; Cetin, G. Digital transformation and revenue management: Evidence from the hotel industry. Tour. Econ. 2021, 27, 328–345. [Google Scholar] [CrossRef]
  12. Shehade, M.; Stylianou-Lambert, T. Revisiting Authenticity in the Age of the Digital Transformation of Cultural Tourism. In Cultural and Tourism Innovation in the Digital Era. Springer Proceedings in Business and Economics; Katsoni, V., Spyriadis, T., Eds.; Springer: Cham, Switzerland, 2020; pp. 3–16. [Google Scholar] [CrossRef]
  13. Vinerean, A. Consumer behavior in tourism and the influencing factors of the decision making process. Rev. Econ. 2013, 65, 186–198. [Google Scholar]
  14. Nikolić, T.M.; Pantić, S.P.; Paunović, I.; Filipović, S. Sustainable Travel Decision-Making of Europeans: Insights from a Household Survey. Sustainability 2021, 13, 1960. [Google Scholar] [CrossRef]
  15. Beerli, A.; Martín, J.D. Tourists’ characteristics and the perceived image of tourist destinations: A quantitative analysis—A case study of Lanzarote, Spain. Tour. Manag. 2004, 25, 623–636. [Google Scholar] [CrossRef]
  16. Valjarević, A.; Vukoičić, D.; Valjarević, D. Evaluation of the tourist potential and natural attractivity of the Lukovska Spa. Tour. Manag. Perspect. 2017, 22, 7–16. [Google Scholar] [CrossRef]
  17. Katsikari, C.; Hatzithomas, L.; Fotiadis, T.; Folinas, D. Push and Pull Travel Motivation: Segmentation of the Greek Market for Social Media Marketing in Tourism. Sustainability 2020, 12, 4770. [Google Scholar] [CrossRef]
  18. Tu, H.-M. Sustainable Heritage Management: Exploring Dimensions of Pull and Push Factors. Sustainability 2020, 12, 8219. [Google Scholar] [CrossRef]
  19. Bratić, M.; Marjanović, M.; Radivojević, A.R.; Pavlović, M. M-GAM method in function of tourism potential assessment: Case study of the Sokobanja basin in eastern Serbia. Open Geosci. 2020, 12, 1468–1485. [Google Scholar] [CrossRef]
  20. Tri Rahayuningsih, T.E.K.S.; Muntasib, E.H.; Prasetyo, L.B. Nature Based Tourism Resources Assessment Using Geographic Information System (GIS): Case Study in Bogor. Procedia Environ. Sci. 2016, 33, 365–375. [Google Scholar] [CrossRef] [Green Version]
  21. Zong, C.; Cheng, K.; Lee, C.-H.; Hsu, N.-L. Capturing Tourists’ Preferences for the Management of Community-Based Ecotourism in a Forest Park. Sustainability 2017, 9, 1673. [Google Scholar] [CrossRef] [Green Version]
  22. Lu, Z.; Li, H.; Lau, C.K.M.; Isah, A.B. Preferences and Tourism Development under Uncertainty: An Empirical Study. Sustainability 2021, 13, 2534. [Google Scholar] [CrossRef]
  23. Zavadskas, E.K.; Antucheviciene, J.; Chatterjee, P. Multiple-Criteria Decision-Making (MCDM) Techniques for Business Processes Information Management. Information 2019, 10, 4. [Google Scholar] [CrossRef] [Green Version]
  24. Tian, C.; Peng, J. An integrated picture fuzzy ANP-TODIM multi-criteria decision-making approach for tourism attraction recommendation. Technol. Econ. Dev. Econ. 2020, 26, 331–354. [Google Scholar] [CrossRef] [Green Version]
  25. Yang, J.-J.; Lo, H.-W.; Chao, C.-S.; Shen, C.-C.; Yang, C.-C. Establishing a Sustainable Sports Tourism Evaluation Framework with a Hybrid Multi-Criteria Decision-Making Model to Explore Potential Sports Tourism Attractions in Taiwan. Sustainability 2020, 12, 1673. [Google Scholar] [CrossRef] [Green Version]
  26. Warren, C.; McGraw, A.P.; Boven, L.V. Values and preferences: Defining preference construction. Wiley Interdiscip. Rev. Cogn. Sci. 2011, 2, 193–205. [Google Scholar] [CrossRef]
  27. Slovic, P. The construction of preference. Am. Psychol. 1995, 50, 364–371. [Google Scholar] [CrossRef]
  28. Dane, E.; Pratt, M.G. Exploring intuition and its role in managerial decision making. Acad. Manag. Rev. 2007, 32, 33–54. [Google Scholar] [CrossRef] [Green Version]
  29. Joshi, A.W.; Sharma, S. Customer knowledge development: Antecedents and impact on new product performance. J. Mark. 2004, 68, 47–59. [Google Scholar] [CrossRef]
  30. Balaguer, J.; Cantavella-Jorda, M. Tourism as a long-run economic growth factor: The Spanish case. Appl. Econ. 2002, 34, 877–884. [Google Scholar] [CrossRef] [Green Version]
  31. Brida, J.G.; Cortes-Jimenez, I.; Pulina, M. Has the tourism-led growth hypothesis been validated? A literature review. Curr. Issues Tour. 2016, 19, 394–430. [Google Scholar] [CrossRef]
  32. Tang, C.F.; Tan, E.C. Tourism-led growth hypothesis: A new global evidence. Cornell Hosp. Q. 2018, 59, 304–311. [Google Scholar] [CrossRef]
  33. Khadaroo, J.; Seetanah, B. The role of transport infrastructure in international tourism development: A gravity model approach. Tour. Manag. 2008, 29, 831–840. [Google Scholar] [CrossRef]
  34. Rasvanis, E.; Tselios, V. Geography as a locational determinant of foreign direct investments in tourism and transport in Greece: A comparison with domestic investments. GeoJournal 2020, 1–25. [Google Scholar] [CrossRef]
  35. Briedenhann, J.; Wickens, E. Tourism routes as a tool for the economic development of rural areas—vibrant hope or impossible dream? Tour. Manag. 2004, 25, 71–79. [Google Scholar] [CrossRef]
  36. Saarinen, J. Contradictions of rural tourism initiatives in rural development contexts: Finnish rural tourism strategy case study. Curr. Issues Tour. 2007, 10, 96–105. [Google Scholar] [CrossRef]
  37. Torres, R.; Momsen, J.H. Challenges and potential for linking tourism and agriculture to achieve pro-poor tourism objectives. Prog. Dev. Stud. 2004, 4, 294–318. [Google Scholar] [CrossRef]
  38. Goodwin, H. Reflections on 10 years of pro-poor tourism. J. Policy Res. Tour. Leis. Events. 2009, 1, 90–94. [Google Scholar] [CrossRef]
  39. OECD. OECD Tourism Trends and Policies 2020; Organisation for Economic Co-operation and Development (OECD) Publishing: Paris, France, 2020. [CrossRef]
  40. Haller, A.-P.; Butnaru, G.I.; Hârșan, G.-D.T.; Ştefănică, M. The relationship between tourism and economic growth in the EU-28. Is there a tendency towards convergence? Econ. Res-Ekon. Istraz. 2020, 1–25. [Google Scholar] [CrossRef]
  41. Fredman, P.; Wall-Reinius, S.; Grundén, A. The nature of nature in nature-based tourism. Scand. J. Hosp. Tour 2012, 12, 289–309. [Google Scholar] [CrossRef]
  42. Alegre, J.; Garau, J. Tourist satisfaction and dissatisfaction. Ann. Tour. Res. 2010, 37, 52–73. [Google Scholar] [CrossRef]
  43. Frias, A.; Cabral, J.; Costa, Á. Modeling Movement of Tourists: Tools and Application in São Miguel Island, Portugal. Asian J. Bus. Manag. 2015, 3, 440–448. Available online: http://repositorio.uac.pt/handle/10400.3/3599 (accessed on 1 May 2021).
  44. Bichler, B.F.; Peters, M. Soft adventure motivation: An exploratory study of hiking tourism. Tour. Manag. 2020, 76, 473–488. [Google Scholar] [CrossRef]
  45. Saaty, T.L. Decision making with the analytic hierarchy process. Int. J. Serv. Sci. 2008, 1, 83–98. [Google Scholar] [CrossRef] [Green Version]
  46. Berezkin, V.E.; Lotov, A.V. Comparison of Two Pareto Frontier Approximations. Comput. Math. Math. Phys. 2014, 54, 1402–1410. [Google Scholar] [CrossRef]
  47. Mattson, C.A.; Messac, A. Concept Selection using s-Pareto Frontiers. AIAA J. 2003, 41, 1190–1198. [Google Scholar] [CrossRef]
  48. Zadeh, L. The concept of a linguistic variable and its application to approximate reasoning—I. J. Inf. Sci. 1975, 8, 199–249. [Google Scholar] [CrossRef]
  49. Zadeh, L. The concept of a linguistic variable and its application to approximate reasoning—II. J. Inf. Sci. 1975, 8, 301–357. [Google Scholar] [CrossRef]
  50. Wang, W.-P. A fuzzy linguistic computing approach to supplier evaluation. Appl. Math. Model. 2010, 34, 3130–3141. [Google Scholar] [CrossRef]
  51. Wang, H.; Olhofer, M.; Jin, Y. A mini-review on preference modeling and articulation in multi-objective optimization: Current status and challenges. Complex Intell. Syst. 2017, 3, 233–245. [Google Scholar] [CrossRef]
  52. Zadeh, L.A. Is there a need for fuzzy logic? Inf. Sci. 2008, 178, 2751–2779. [Google Scholar] [CrossRef]
  53. Frias, A. A Otimização da Gestão de Recursos em Turismo, Modelando Preferências. Ph.D. Thesis, Universidade de Lisboa, Lisboa, Portugal, 2018. Available online: http://hdl.handle.net/10400.5/17037 (accessed on 1 May 2021).
Figure 1. Reduction of the viable solution zone.
Sustainability 13 10276 g001
Figure 2. Fireland tourist resource map.
Sustainability 13 10276 g002
Figure 3. Available resources network.
Sustainability 13 10276 g003
Table 1. Factors that affect tourist consumption decisions.
A. Tourist characteristics:
 1. Time budgets;
 2. Motivations, interests and group composition;
 3. Destination knowledge and emotional value.
B. Destination characteristics:
 1. Trip origins or accommodation locations;
 2. Trip destinations or attraction locations;
 3. Transportation accessibility.
Source: adapted from [43].
Table 2. Resource and tourist data.
ResourceClassificationRelevance
( X k ,   X p )
Accessibility
( Θ k , p )
Use Time
(t)
Preference
( Π k , p × A k , p )
AlphaBeta AlphaBeta
N1Nature/View4 × 440.47150.10500.0750
N2Nature/Volcanic7 × 770.62250.15750.1200
N3Nature/View3 × 330.71150.10500.0750
N4Nature/View3 × 330.79150.10500.0750
N5Nature/Beach or pool6 × 661.20450.10500.0600
N6Nature/Garden7 × 772.58600.07000.1200
N7Nature/Volcanic9 × 990.85350.15750.1200
T1Walking trail/C34 × 440.471600.09000.0200
T2Walking trail/C25 × 553.16900.22500.0350
S1Social/Museum55 × 52.00500.04000.3300
S2Social/Ethnography44 × 40.91450.10000.0900
S3Social/Monument55 × 51.29200.06000.1800
S4Social/Museum66 × 60.82300.04000.3300
R1Restaurant/Familiar661.29600.10000.0700
R2Restaurant/Familiar551.15600.10000.0700
R3Restaurant/Gourmet330.95900.04000.0900
R4Restaurant/Fast food440.95400.06000.0400
Table 3. The Ψ value as a satisfaction measure.
Viable OptionsSatisfaction (Ψ)
Ψ Alpha Ψ Beta
Individual resource selection (localization at starting node)
T217.79--0.55--
N68.86--2.17--
S10.40--10.56--
S20.37--0.74--
Itinerary selection (set of resources)
A = {T2, N2, N3, N4, N5, R1, N6}38.1472%4.5516%
B = {S1, S3, S2, R1, N7, N6, N5, N4}26.8351%19.2568%
C = {S1, S3, S2, R1, N7, S4, N6}21.7641%25.3890%
Publisher’s Note: MDPI stays neutral with regard to jurisdictional claims in published maps and institutional affiliations.

