
Empirical Analysis of the Influence of Digital Marketing Elements on Service Quality Variables in the Small- and Medium-Sized Enterprises Sector in the Republic of Serbia


Abstract
:1. Introduction
2. Literature Review
3. Methodological Approach
4. Research Results and Discussion
5. Conclusions
Author Contributions
Funding
Institutional Review Board Statement
Informed Consent Statement
Conflicts of Interest
References
- Kotler, P.; Kartajaya, H.; Setiawan, I. Marketing 3.0: From Products to Customers to the Human Spirit; John Wiley & Sons, Inc.: Hoboken, NJ, USA, 2010; pp. 139–156. [Google Scholar]
- Brzaković, A.; Brzaković, T.; Brzaković, P. The Determinants of Brand Positioning in Higher Education—What Dominantly Influences Students’ Satisfaction? Croat. J. Educ. 2019, 21, 407–436. [Google Scholar] [CrossRef]
- Kotler, P.; Armstrong, G. Principles of Marketing; Pearson Education: Boston, MA, USA, 2014. [Google Scholar]
- Azhagan, C.T.; Gangadharan, S.; Madhanrajan, U. Computational Analysis for Service Quality Determinants in Retail Sectors Using SERVQUAL Model. Mater. Today Proc. 2021. [Google Scholar] [CrossRef]
- Park, S.-J.; Yi, Y.; Lee, Y.-R. Heterogeneous dimensions of SERVQUAL. Total. Qual. Manag. Bus. Excel. 2021, 32, 92–118. [Google Scholar] [CrossRef]
- Soares, M.C.; Novaski, O.; Anholon, R. SERVQUAL model applied to higher education public administrative services. Braz. J. Oper. Prod. Manag. 2017, 14, 338–349. [Google Scholar] [CrossRef] [Green Version]
- Danjum, I.; Rasli, A. Imperatives of service innovation and service quality for customer satisfaction: Perspective on higher education. Procedia Soc. Behav. Sci. 2012, 40, 347–352. [Google Scholar] [CrossRef] [Green Version]
- Ministry of Economy Home Page. Available online: http://www.privreda.gov.rs (accessed on 13 March 2021).
- Chaffey, D. Applying organisational capability models to assess the maturity of digital-marketing governance. J. Mark. Manag. 2010, 26, 187–196. [Google Scholar] [CrossRef]
- Smith, P.R.; Chaffey, D. eMarketing eXcellence, 2nd ed.; Butterworth Heinemann: Oxford, UK, 2013. [Google Scholar]
- Kilgour, M.; Sasser, S.L.; Larke, R. The social media transformation process: Curating content into strategy. Corp. Commun. Int. J. 2015, 20, 326–343. [Google Scholar] [CrossRef]
- Sheridan, M. They Ask, You Answer: A Revolutionary Approach to Inbound Sales, Content Marketing, and Today’s Digital Consumer; John Wiley & Sons: Hoboken, NJ, USA, 2019. [Google Scholar]
- Cornelissen, J.P. Integrated marketing communications and the language of marketing development. Int. J. Advert. 2001, 20, 483–498. [Google Scholar] [CrossRef]
- Grove, S.J.; Carlson, L.; Dorsch, M.J. Addressing services’ intangibility through integrated marketing communication: An exploratory study. J. Serv. Mark. 2002, 16, 393–411. [Google Scholar] [CrossRef]
- Jin, H.S. Compounding Consumer Interest: Effects of Advertising Campaign Publicity on the Ability to Recall Subsequent Advertisements. J. Advert. 2003, 32, 29–41. [Google Scholar] [CrossRef]
- Weinberg, B.D.; Pehlivan, E. Social spending: Managing the social media mix. Bus. Horiz. 2011, 54, 275–282. [Google Scholar] [CrossRef]
- Kotler, P.; Keller, K.; Martinović, M. Upravljanje Marketingom, 14th ed.; Mate d.o.o.: Zagreb, Croatia, 2014. [Google Scholar]
- Maslowska, E.; Malthouse, E.; Collinger, T. The customer engagement ecosystem. J. Mark. Manag. 2016, 32, 469–501. [Google Scholar] [CrossRef]
- Dolan, R.; Conduit, J.; Fahy, J.; Goodman, S. Social media engagement behavior: A uses and gratifications perspective. J. Strateg. Mark. 2016, 24, 261–277. [Google Scholar] [CrossRef] [Green Version]
- Lin, H.; Zhou, X.; Chen, Z. Impact of the Content Characteristic of Short Message Service Advertising on Consumer Attitudes. Soc. Behav. Pers. Int. J. 2014, 42, 1409–1419. [Google Scholar] [CrossRef]
- Černikovaitė, M.; Jucaitytė, I. Prekės ženklų valdymas virtualioje erdvėje Lietuvoje. Econ. Manag. 2012, 17, 636–642. [Google Scholar] [CrossRef]
- Opreana, A. Examining Online Shopping Services in Relation to Experience and Frequency of Using Internet Retailing. Expert J. Mark. 2013, 1, 17–27. [Google Scholar]
- Holliman, G.; Rowley, J. Business to business digital content marketing: Marketers’ perceptions of best practice. J. Res. Interact. Mark. 2014, 8, 269–293. [Google Scholar] [CrossRef] [Green Version]
- Rowley, J. Understanding digital content marketing. J. Mark. Manag. 2008, 24, 517–540. [Google Scholar] [CrossRef]
- Mathew, V.; Soliman, M. Does digital content marketing affect tourism consumer behavior? An extension of technology acceptance model. J. Consum. Behav. 2021, 20, 61–75. [Google Scholar] [CrossRef]
- Berger, J.; Milkman, K.L. What Makes Online Content Viral? J. Mark. Res. 2012, 49, 192–205. [Google Scholar] [CrossRef] [Green Version]
- Woodside, A.G. Brand-consumer storytelling theory and research: Introduction to a Psychology & Marketing special issue. Psychol. Mark. 2010, 27, 531–540. [Google Scholar] [CrossRef]
- Alexander, B.; Levine, A. Web 2.0 storytelling: Emergence of a new genre. EDUCAUSE Rev. 2008, 43, 40–56. [Google Scholar]
- Barry, D.; Elmes, M. Strategy retold: Toward a narrative view of strategic discourse. Acad. Manag. Rev. 1997, 22, 429–452. [Google Scholar] [CrossRef] [Green Version]
- Boje, D.M. The Storytelling Organization: A Study of Story Performance in an Office-Supply Firm. Adm. Sci. Q. 1991, 36, 106. [Google Scholar] [CrossRef] [Green Version]
- Gurzki, H.; Schlatter, N.; Woisetschläger, D.M. Crafting extraordinary stories: Decoding luxury brand communications. J. Advert. 2019, 48, 401–414. [Google Scholar] [CrossRef]
- Twitchell, J.B. An English Teacher Looks at Branding. J. Consum. Res. 2004, 31, 484–489. [Google Scholar] [CrossRef] [Green Version]
- Dessart, L.; Pitardi, V. How stories generate consumer engagement: An exploratory study. J. Bus. Res. 2019, 104, 183–195. [Google Scholar] [CrossRef]
- Kemp, E.; Porter, M., III; Anaza, N.A.; Min, D.J. The impact of storytelling in creating firm and customer connections in online environments. J. Res. Interact. Mark. 2021, 15, 104–124. [Google Scholar] [CrossRef]
- Silverstein, M.J.; Fiske, N. Luxury for the masses. Harv. Bus. Rev. 2003, 81, 48–57. [Google Scholar] [PubMed]
- Mossberg, L. Extraordinary Experiences through Storytelling. Scand. J. Hosp. Tour. 2008, 8, 195–210. [Google Scholar] [CrossRef]
- Lundqvist, A.; Liljander, V.; Gummerus, J.; van Riel, A. The impact of storytelling on the consumer brand experience: The case of a firm-originated story. J. Brand Manag. 2012, 20, 283–297. [Google Scholar] [CrossRef]
- Brown, J.; Broderick, A.J.; Lee, N. Word of mouth communication within online communities: Conceptualizing the online social network. J. Interact. Mark. 2007, 21, 2–20. [Google Scholar] [CrossRef]
- Ismagilova, E.; Slade, E.; Rana, N.P.; Dwivedi, Y.K. The effect of characteristics of source credibility on consumer behaviour: A meta-analysis. J. Retail. Consum. Serv. 2020, 53, 101736. [Google Scholar] [CrossRef] [Green Version]
- Filieri, R. What makes online reviews helpful? A diagnosticity-adoption framework to explain informational and normative influences in e-WOM. J. Bus. Res. 2015, 68, 1261–1270. [Google Scholar] [CrossRef]
- Baber, A.; Thurasamy, R.; Malik, M.I.; Sadiq, B.; Islam, S.; Sajjad, M. Online word-of-mouth antecedents, attitude and intentionto-purchase electronic products in Pakistan. Telemat. Inform. 2016, 33, 388–400. [Google Scholar] [CrossRef]
- Chan, Y.Y.Y.; Ngai, E.W.T. Conceptualising electronic word of mouth activity: An input-process-output perspective. Mark. Intell. Plan. 2011, 29, 488–516. [Google Scholar] [CrossRef]
- Litvin, S.W.; Goldsmith, R.E.; Pan, B. Electronic word-of-mouth in hospitality and tourism management. Tour. Manag. 2008, 29, 458–468. [Google Scholar] [CrossRef]
- Hussain, S.; Ahmed, W.; Jafar, R.M.S.; Rabnawaz, A.; Jianzhou, Y. eWOM source credibility, perceived risk and food product customer’s information adoption. Comput. Hum. Behav. 2017, 66, 96–102. [Google Scholar] [CrossRef]
- Hennig-Thurau, T.; Gwinner, K.P.; Walsh, G.; Gremler, D.D. Electronic word-of-mouth via consumer-opinion platforms: What motivates consumers to articulate themselves on the Internet? J. Interact. Mark. 2004, 18, 38–52. [Google Scholar] [CrossRef]
- Wisniewski, M. Using SERVQUAL to assess customer satisfaction with public sector services. Manag. Serv. Qual. Int. J. 2001, 11, 380–388. [Google Scholar] [CrossRef]
- Dotchin, J.A.; Oakland, J.S. Total Quality Management in Services: Part 2: Service Quality. Int. J. Qual. Reliab. Manag. 1994, 11, 27–42. [Google Scholar] [CrossRef]
- Asubonteng, P.; McCleary, K.J.; Swan, J.E. SERVQUAL revisited: A critical review of service quality. J. Serv. Mark. 1996, 10, 62–81. [Google Scholar] [CrossRef]
- Lewis, B.R.; Mitchell, V.W. Defining and Measuring the Quality of Customer Service. Mark. Intell. Plan. 1990, 8, 11–17. [Google Scholar] [CrossRef]
- Parasuraman, A.; Zeithaml, V.A.; Berry, L.L. A conceptual model of service quality and its implications for future research. J. Mark. 1985, 49, 41–50. [Google Scholar] [CrossRef]
- Parasuraman, A.; Zeithaml, V.A.; Berry, L. SERVQUAL: A multiple-item scale for measuring consumer perceptions of service quality. J. Retail. 1988, 64, 12–40. [Google Scholar]
- Lehtinen, U.; Lehtinen, J.R. Two Approaches to Service Quality Dimensions. Serv. Ind. J. 1991, 11, 287–303. [Google Scholar] [CrossRef]
- Furrer, O.; Liu, B.S.C.; Sudharshan, D. The relationships between culture and service quality perceptions: Basis for cross-cultural market segmentation and resource allocation. J. Serv. Res. 2000, 2, 355–371. [Google Scholar] [CrossRef] [Green Version]
- Grönroos, C. The perceived service quality concept—A mistake? Manag. Serv. Qual. Int. J. 2001, 11, 150–152. [Google Scholar] [CrossRef]
- Arts, J.W.; Frambach, R.T.; Bijmolt, T.H. Generalizations on consumer innovation adoption: A meta-analysis on drivers of intention and behavior. Int. J. Res. Mark. 2011, 28, 134–144. [Google Scholar] [CrossRef]
- Chou, P.-F.; Lu, C.-S.; Chang, Y.-H. Effects of service quality and customer satisfaction on customer loyalty in high-speed rail services in Taiwan. Transp. A Transp. Sci. 2014, 10, 917–945. [Google Scholar] [CrossRef]
- Boon-Itt, S. Managing self-service technology service quality to enhance e-satisfaction. Int. J. Qual. Serv. Sci. 2015, 7, 373–391. [Google Scholar] [CrossRef]
- Fernandes, T.; Pedroso, R. The effect of self-checkout quality on customer satisfaction and repatronage in a retail context. Serv. Bus. 2017, 11, 69–92. [Google Scholar] [CrossRef] [Green Version]
- Berry, L. Big Ideas in Services Marketing. J. Consum. Mark. 1986, 3, 47–51. [Google Scholar] [CrossRef]
- Jiang, J.J.; Klein, G.; Crampton, S.M. A Note on SERVQUAL Reliability and Validity in Information System Service Quality Measurement. Decis. Sci. 2000, 31, 725–744. [Google Scholar] [CrossRef]
- Omar, F.I.; Zan, U.M.S.M.; Azlili, N.; Hassan, I.I. Digital Marketing: An Influence towards Business Performance among Entrepreneurs of Small and Medium Enterprises. Int. J. Acad. Res. Bus. Soc. Sci. 2020, 10, 126–141. [Google Scholar]
- Ritz, W.; Wolf, M.; McQuitty, S. Digital marketing adoption and success for small businesses: The application of the do-it-yourself and technology acceptance models. J. Res. Interact. Mark. 2019, 13, 179–203. [Google Scholar] [CrossRef]
- Yamin, A.B. Impact of Digital Marketing as a Tool of Marketing Communication: A Behavioral Perspective on Consumers of Bangladesh. Am. J. Trade Policy 2017, 4, 117–122. [Google Scholar] [CrossRef]
- Njau, J.N.; Karugu, W. Influence of e-marketing on the performance of small and medium enterprises in Kenya: Survey of small and medium enterprises in the manufacturing industry in Kenya. Int. J. Bus. Law Res. 2014, 2, 62–70. [Google Scholar]
- Papa, A.; Santoro, G.; Tirabeni, L.; Monge, F. Social media as tool for facilitating knowledge creation and innovation in small and medium enterprises. Balt. J. Manag. 2018, 13, 329–344. [Google Scholar] [CrossRef]
- Durkin, M.; McGowan, P.; McKeown, N. Exploring social media adoption in small to medium-sized enterprises in Ireland. J. Small Bus. Enterp. Dev. 2013, 20, 716–734. [Google Scholar] [CrossRef]
- Mutua, J.; Oteyo, I.N.; Njeru, A.W. The extent of e-commerce adoption among small and medium enterprises in Nairobi, Kenya. Int. J. Bus. Soc. Sci. 2013, 4, 116–122. [Google Scholar]
- Dlodlo, N.; Dhurup, M. Barriers to e-marketing adoption among small and medium enterprises (SMEs) in the Vaal Triangle. Acta Commer. 2010, 10, 164–180. [Google Scholar] [CrossRef]
- Karabašević, D.; Stanujkić, D.; Zavadskas, E.K.; Stanimirović, P.; Popović, G.; Predić, B.; Ulutaş, A. A Novel Extension of the TOPSIS Method Adapted for the Use of Single-Valued Neutrosophic Sets and Hamming Distance for E-Commerce Development Strategies Selection. Symmetry 2020, 12, 1263. [Google Scholar] [CrossRef]
- Nunnally, J.C. Psychometric Theory, 2nd ed.; McGraw-Hill: New York, NY, USA, 1978. [Google Scholar]
- Du Plessis, C. The role of content marketing in social media content communities. S. Afr. J. Inf. Manag. 2017, 19, a866. [Google Scholar] [CrossRef] [Green Version]
- Du Plessis, C. An exploratory analysis of essential elements of content marketing. In Proceedings of the Second European Conference on Social Media, Porto, Portugal, 9–10 July 2015; pp. 122–129. [Google Scholar]
- Mei, X.Y.; Bagaas, I.K.; Relling, E.K.L. Storytelling as an Approach to Voice Complaints and eWOM on Social Media/Facebook. In Research Anthology on Strategies for Using Social Media as a Service and Tool in Business; IGI Global: Hershey, PA, USA, 2021; pp. 1373–1392. [Google Scholar]
- Liu, H.; Jayawardhena, C.; Osburg, V.-S.; Yoganathan, V.; Cartwright, S. Social sharing of consumption emotion in electronic word of mouth (eWOM): A cross-media perspective. J. Bus. Res. 2021, 132, 208–220. [Google Scholar] [CrossRef]


| Level | Sub-Level | Count | Prob | Total |
|---|---|---|---|---|
| The basic activity of the enterprise | Manufacturing | 124 | 0.34444 | 360 |
| Services | 236 | 0.65556 | ||
| The legal form of the enterprise | Private independent enterprise/shop | 251 | 0.69722 | 360 |
| Part of a larger system | 109 | 0.30278 | ||
| The respondent’s position in the enterprise | An owner | 130 | 0.36111 | 360 |
| A director | 153 | 0.42500 | ||
| A manager | 41 | 0.11389 | ||
| An advisor | 36 | 0.11111 |
| Variable | Cronbach Coefficient | Reliability of the Variable |
|---|---|---|
| Reliability | α = 0.9561 | (α ≥ 0.9) the sample is excellently reliable |
| Responsiveness | α = 0.9268 | (α ≥ 0.9) the sample is excellently reliable |
| Assurance | α = 0.9313 | (α ≥ 0.9) the sample is excellently reliable |
| Empathy | α = 0.9386 | (α ≥ 0.9) the sample is excellently reliable |
| Tangibles | α = 0.9197 | (α ≥ 0.9) the sample is excellently reliable |
| Content marketing | α = 0.9338 | (α ≥ 0.9) the sample is excellently reliable |
| Storytelling | α = 0.9249 | (α ≥ 0.9) the sample is excellently reliable |
| eWOM | α = 0.9264 | (α ≥ 0.9) the sample is excellently reliable |
| Entire set | α = 0.9409 | (α ≥ 0.9) the sample is excellently reliable |
| Mean | Std. Dev. | |
|---|---|---|
| Reliability | 4.3579861111 | 0.3543115453 |
| Responsiveness | 4.3875 | 0.408340676 |
| Assurance | 4.4986111111 | 0.4130506978 |
| Empathy | 4.440625 | 0.2798800199 |
| Tangibles | 4.375 | 0.4145256039 |
| Content marketing | 4.4135416667 | 0.3182291679 |
| Storytelling | 4.4130952381 | 0.4711429998 |
| eWOM | 4.430952381 | 0.5219256117 |
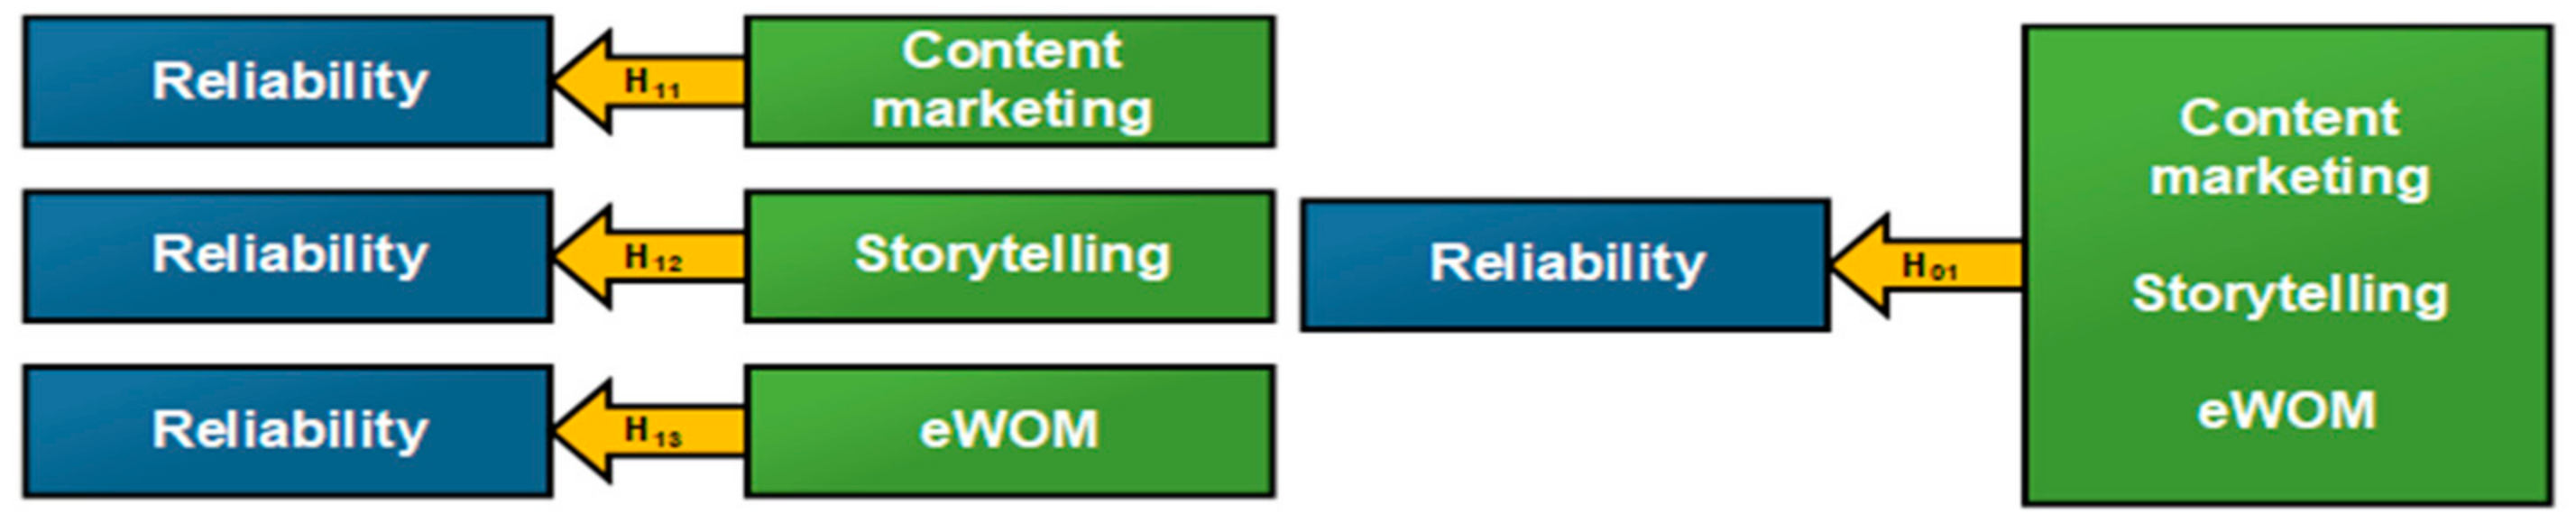
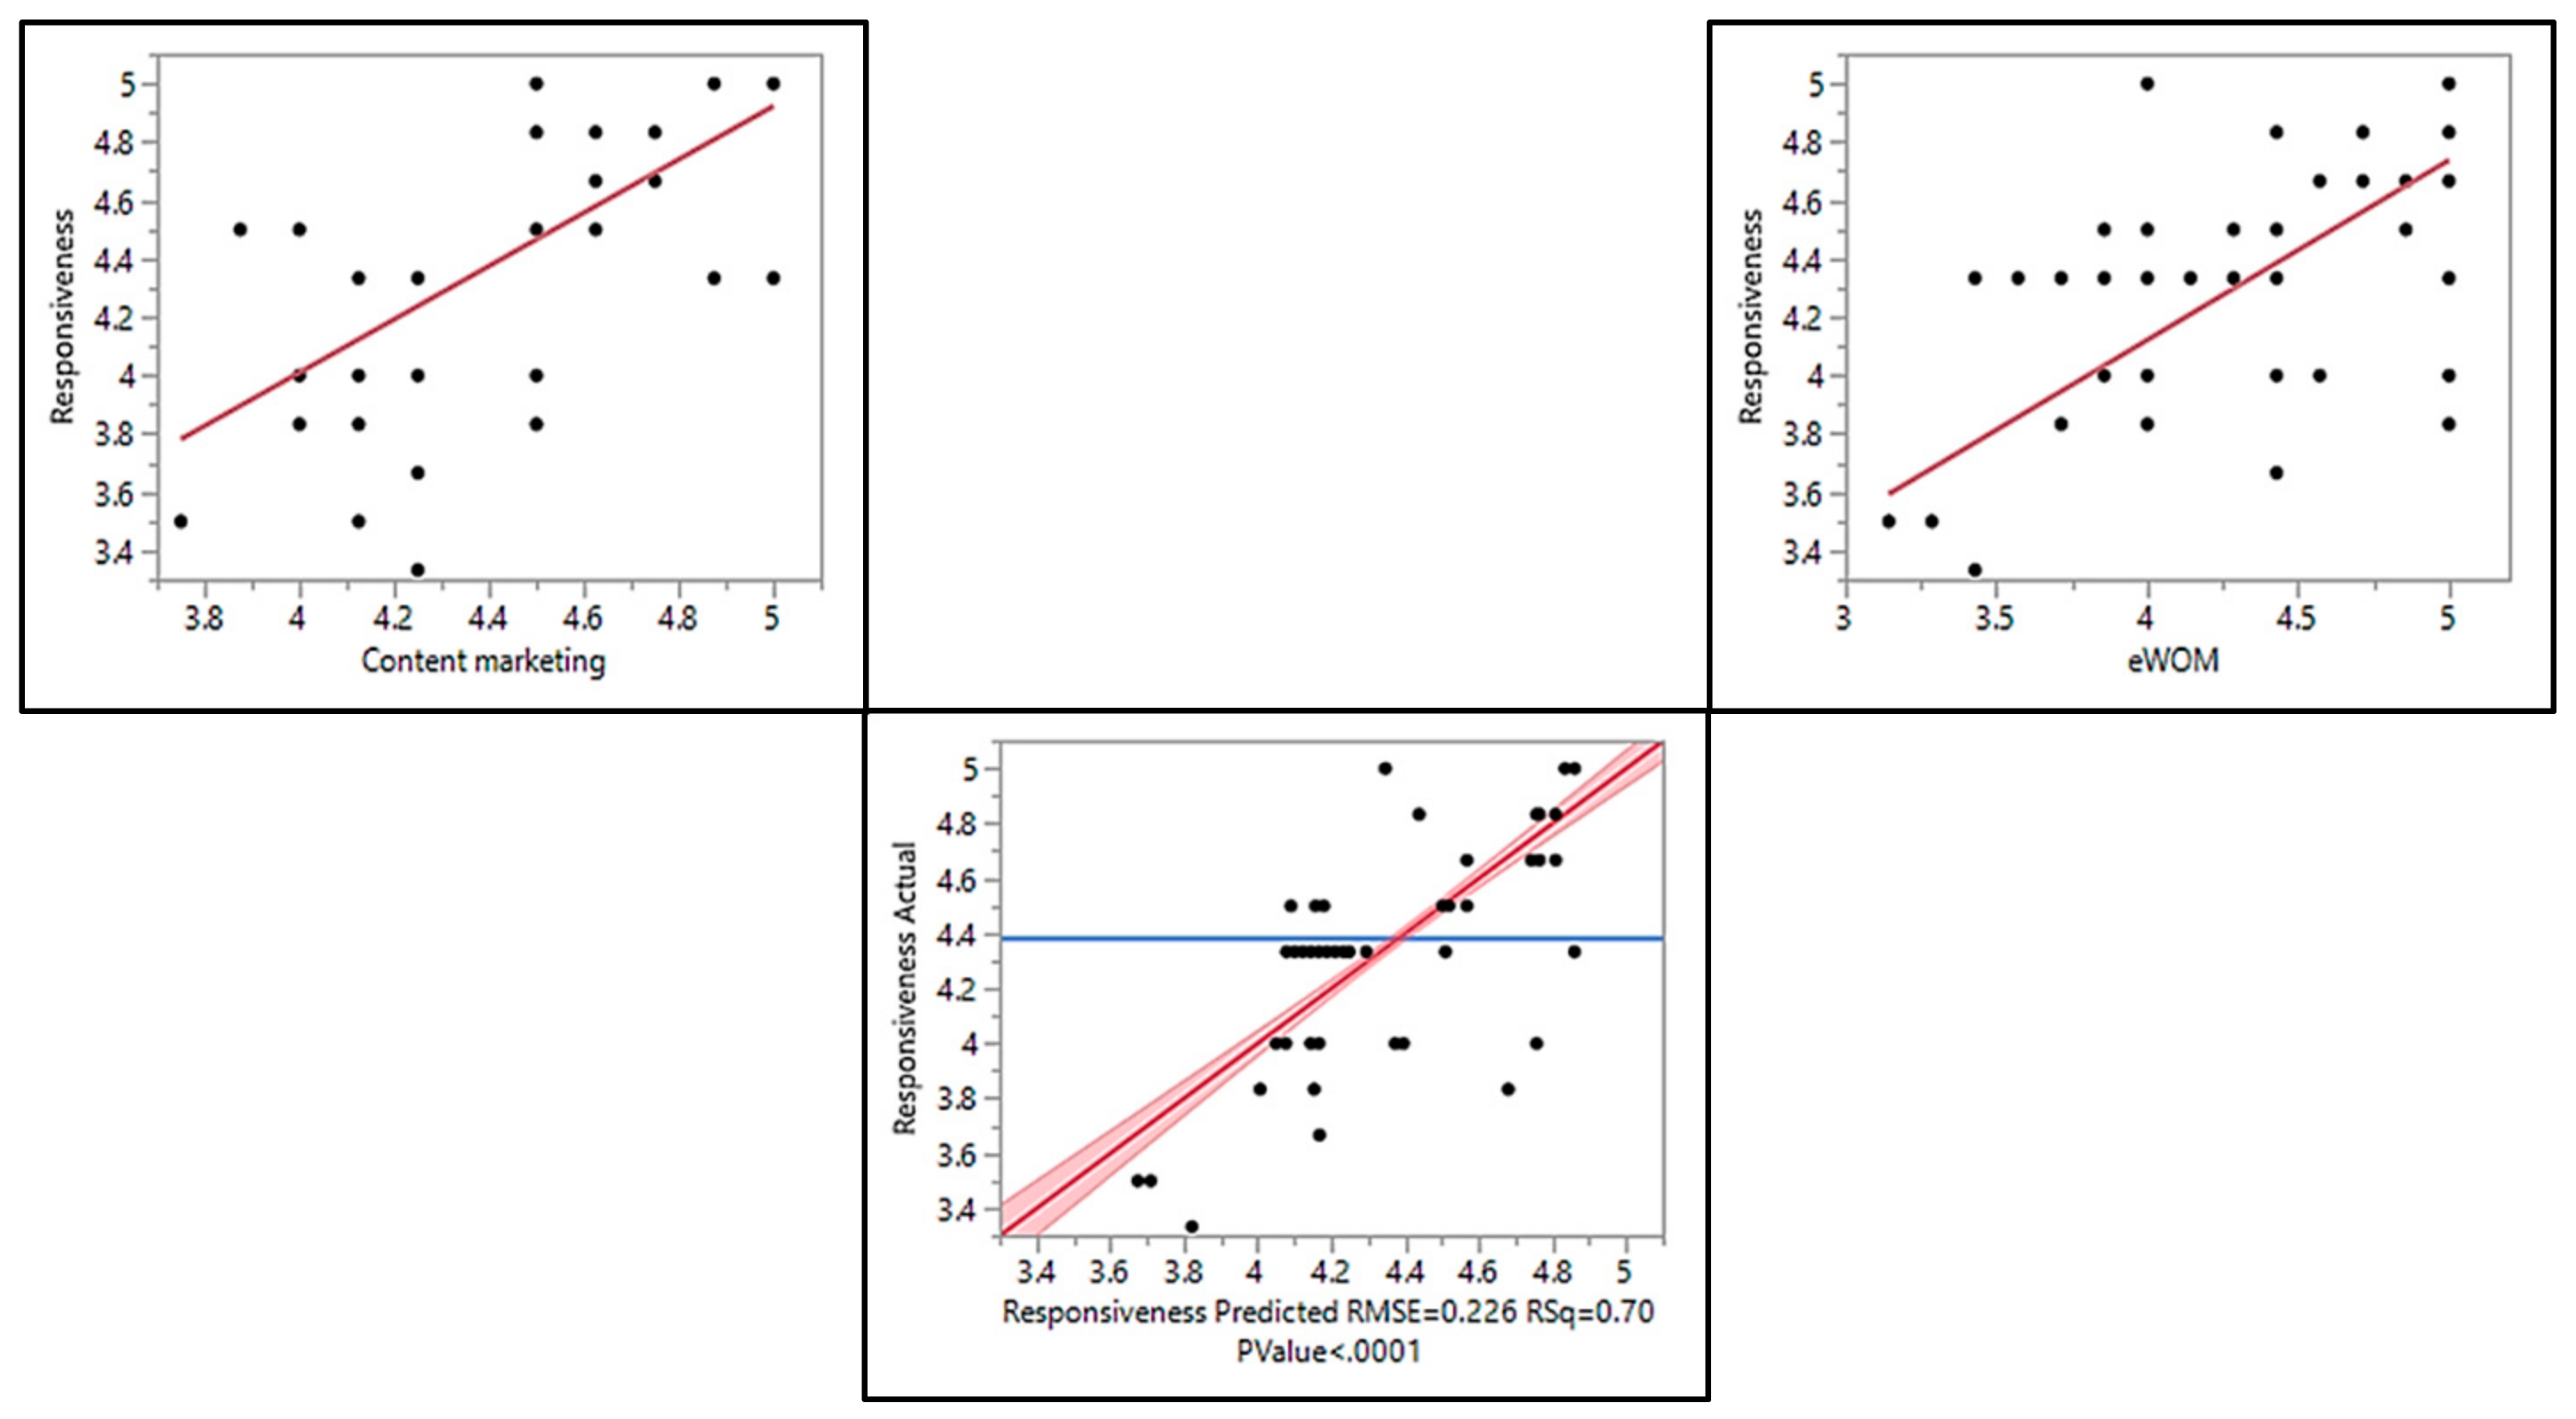
| Independent Variable | ANOVA | Std Beta | RSquare (%) | Connectedness | Hypothesis | Regression Equation |
|---|---|---|---|---|---|---|
| Content marketing | [F(1358) = 85.8075, p < 0.0001] | 0.439709 | 19.33 | Relatively weak | H11—rejected | |
| Storytelling | [F(1358) = 27.3251, p < 0.0001] | 0.266298 | 7.09 | Relatively weak | H12—rejected | |
| eWOM | [F(1358) = 77.3201, p < 0.0001] | 0.421446 | 17.76 | Relatively weak | H13—rejected | |
| Content marketing, Storytelling, eWOM | [F(3356) = 69.1794, p < 0.0001] | 0.606893 | 36.82 | Medium–strong | H01—accepted |
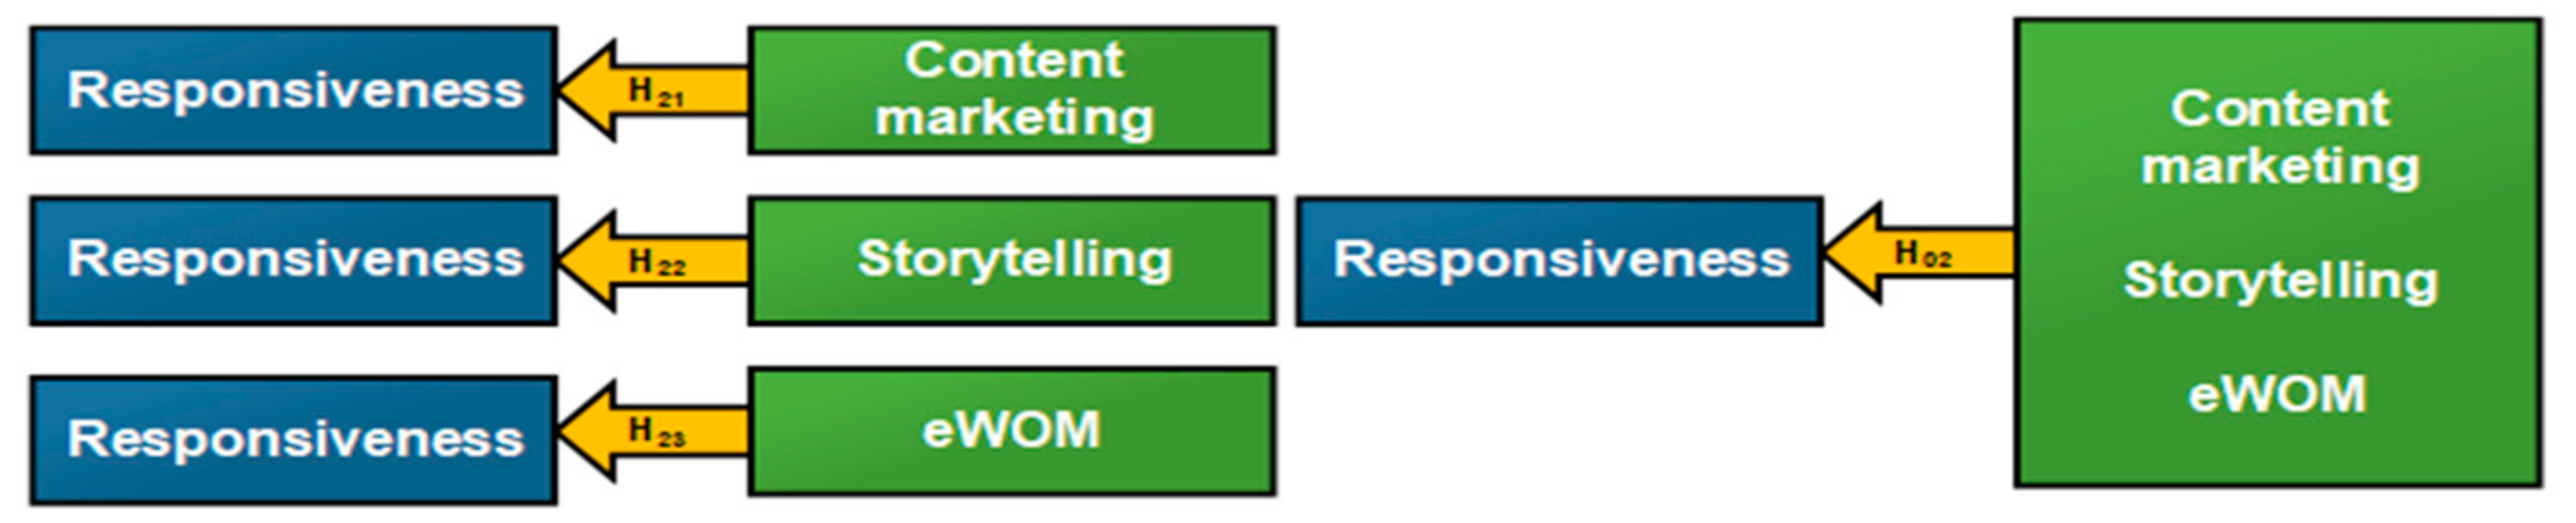
| Independent Variable | ANOVA | Std. Beta | RSquare (%) | Connectedness | Hypothesis | Regression Analysis |
|---|---|---|---|---|---|---|
| Content marketing | [F(1358) = 366.7707, p < 0.0001] | 0.711372 | 50.60 | Medium–strong | H21—accepted | |
| Storytelling | [F(1358) = 754.0503, p < 0.0001]. | 0.823451 | 67.80 | Strong | H22—accepted | |
| eWOM | [F(1358) = 585.0259, p < 0.0001]. | 0.787636 | 62.03 | Strong | H23—accepted | |
| Content marketing, Storytelling, eWOM | [F(3356) = 271.8681, p < 0.0001]. | 0.834351 | 69.61 | Strong | H02—accepted |
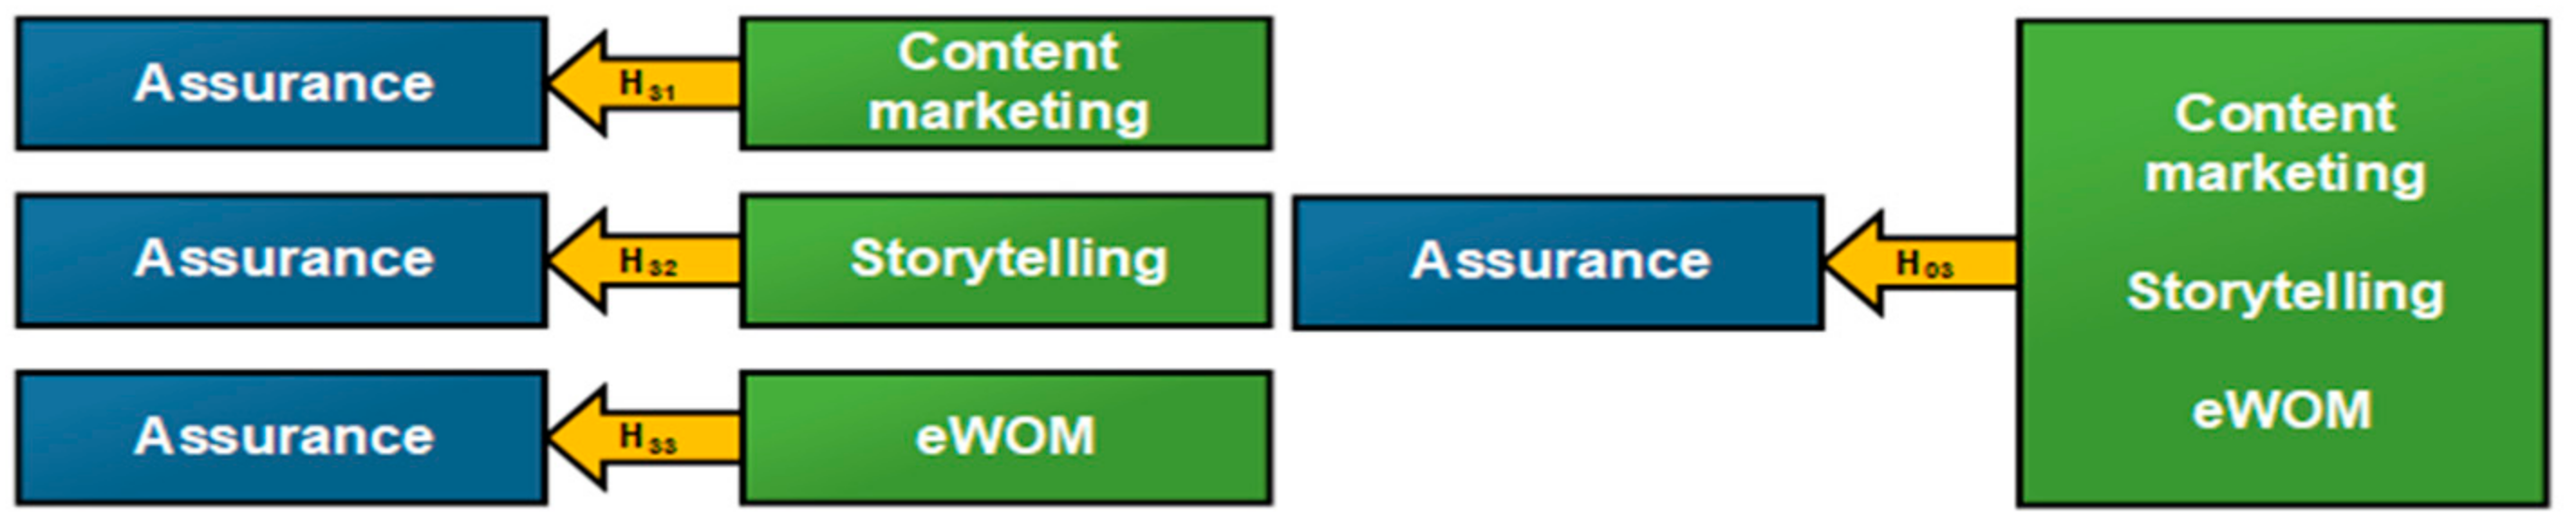
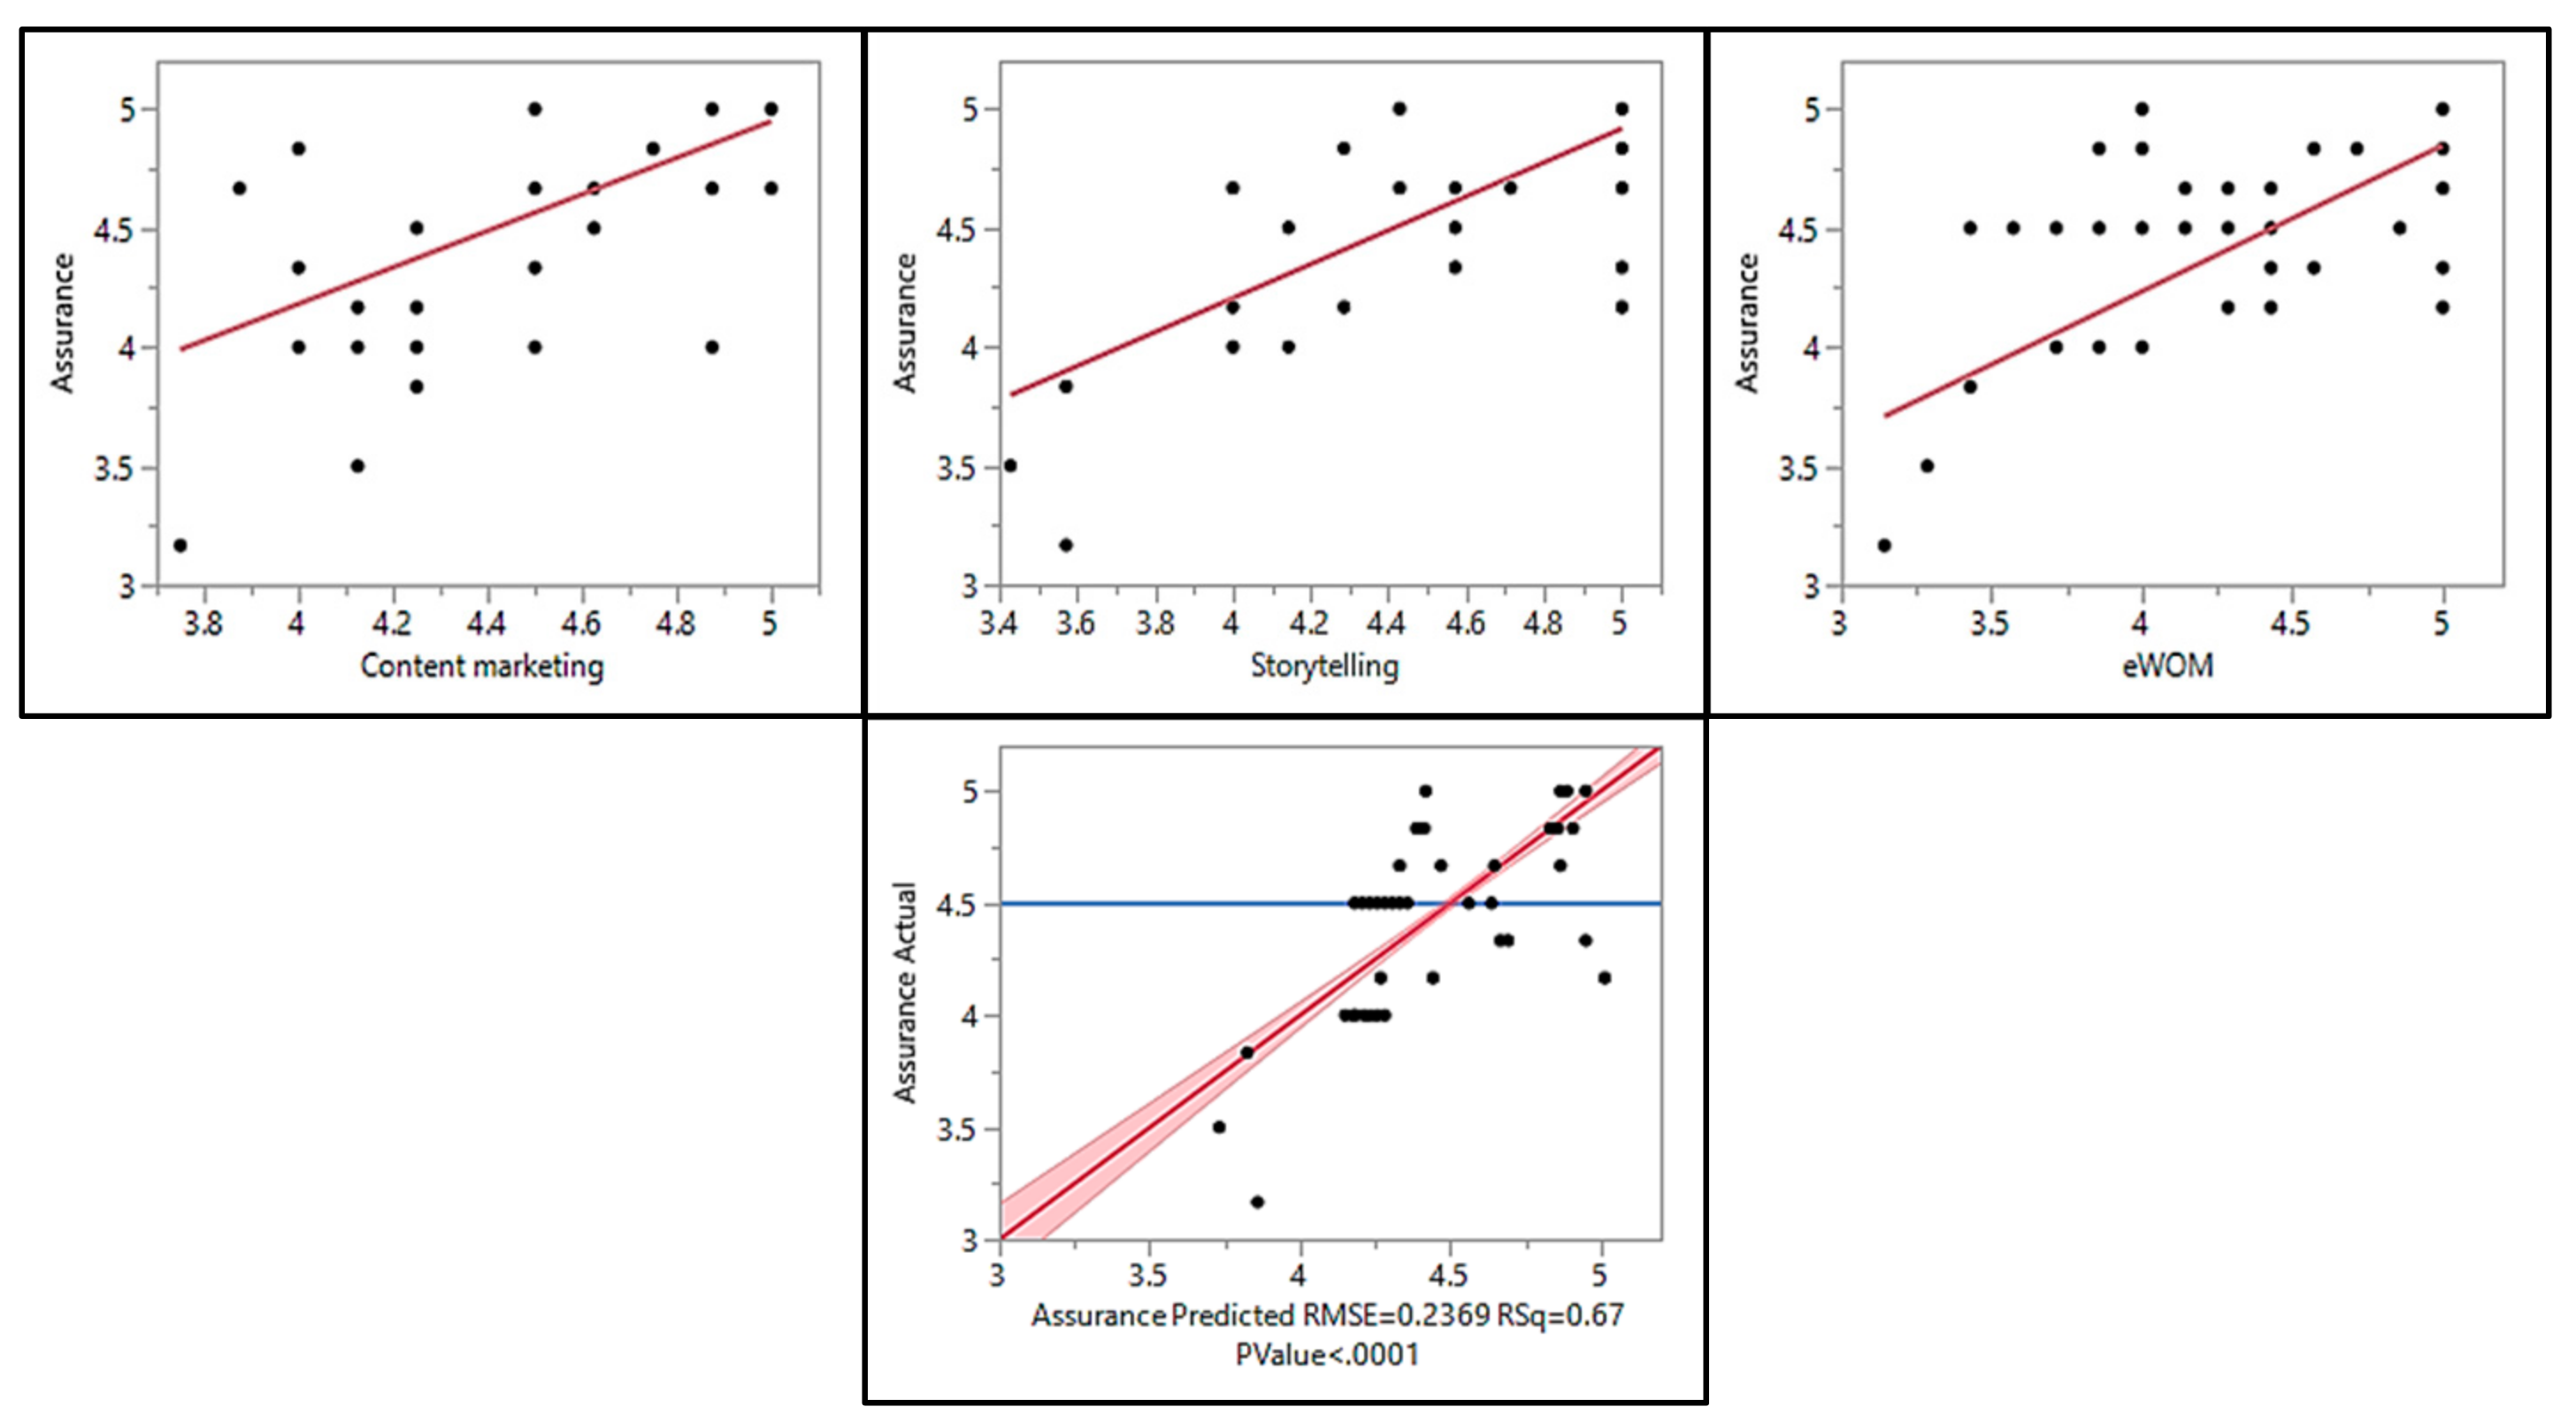
| Independent Variable | ANOVA | Std. Beta | RSquare (%) | Connectedness | Hypothesis | Regression Equation |
|---|---|---|---|---|---|---|
| Content marketing | [F(1358) = 192.2828, p < 0.0001]. | 0.591122 | 34.94 | Medium–strong | H31—accept | |
| Storytelling | [F(1358) = 696.4253, p < 0.0001]. | 0.812698 | 66.04 | Strong | H32—accept | |
| eWOM | [F(1358) = 538.2726, p < 0.0001]. | 0.774963 | 60.05 | Strong | H33—accept | |
| Content marketing, Storytelling, eWOM | [F(3356) = 245.2458, p < 0.0001] | 0.820922 | 67.39 | Strong | H03—accept |
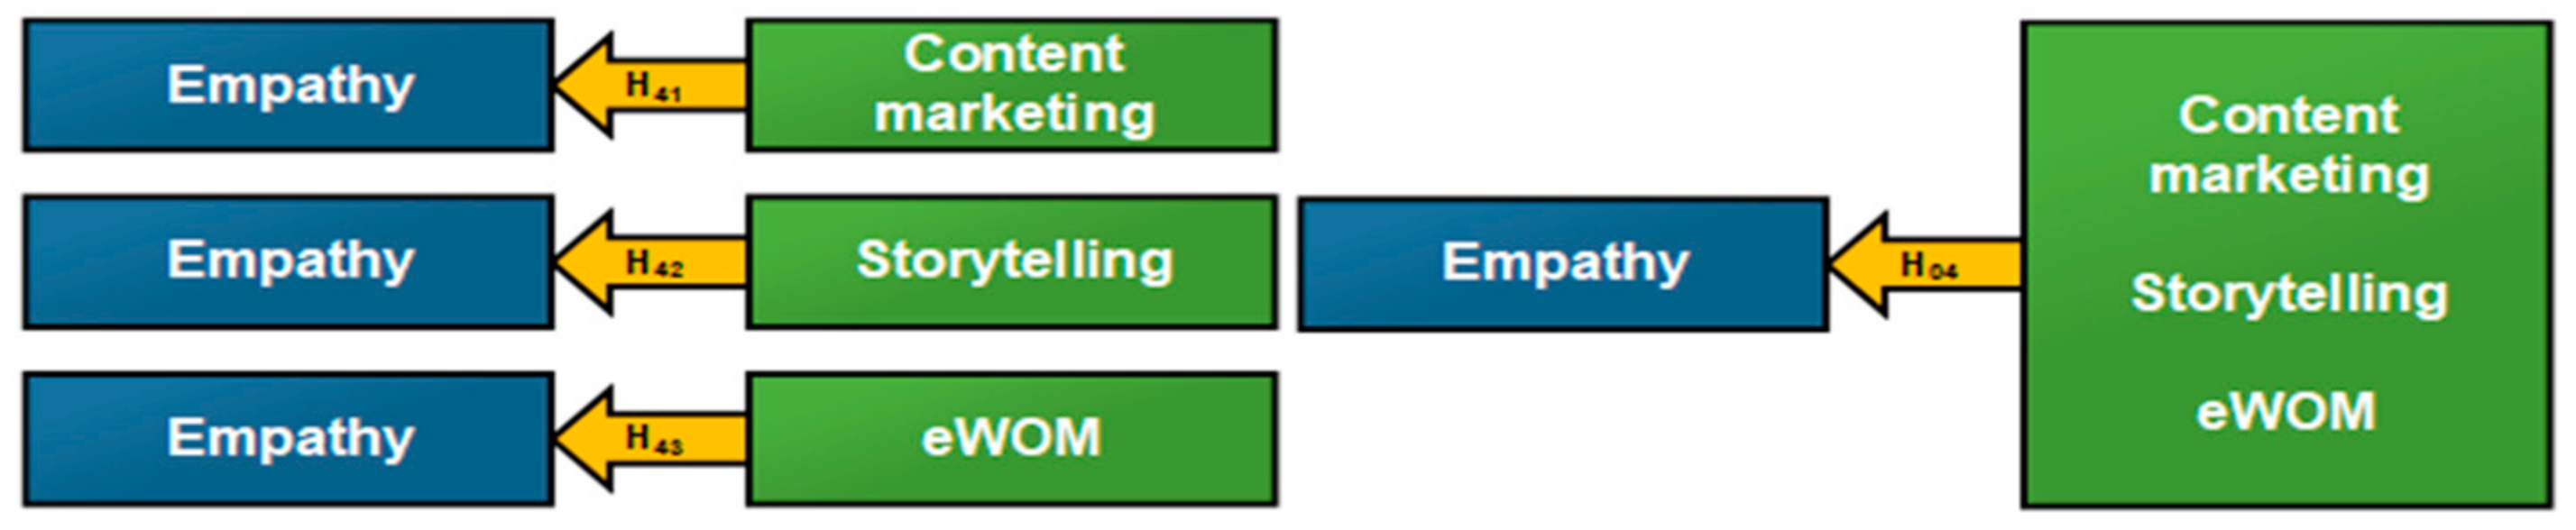
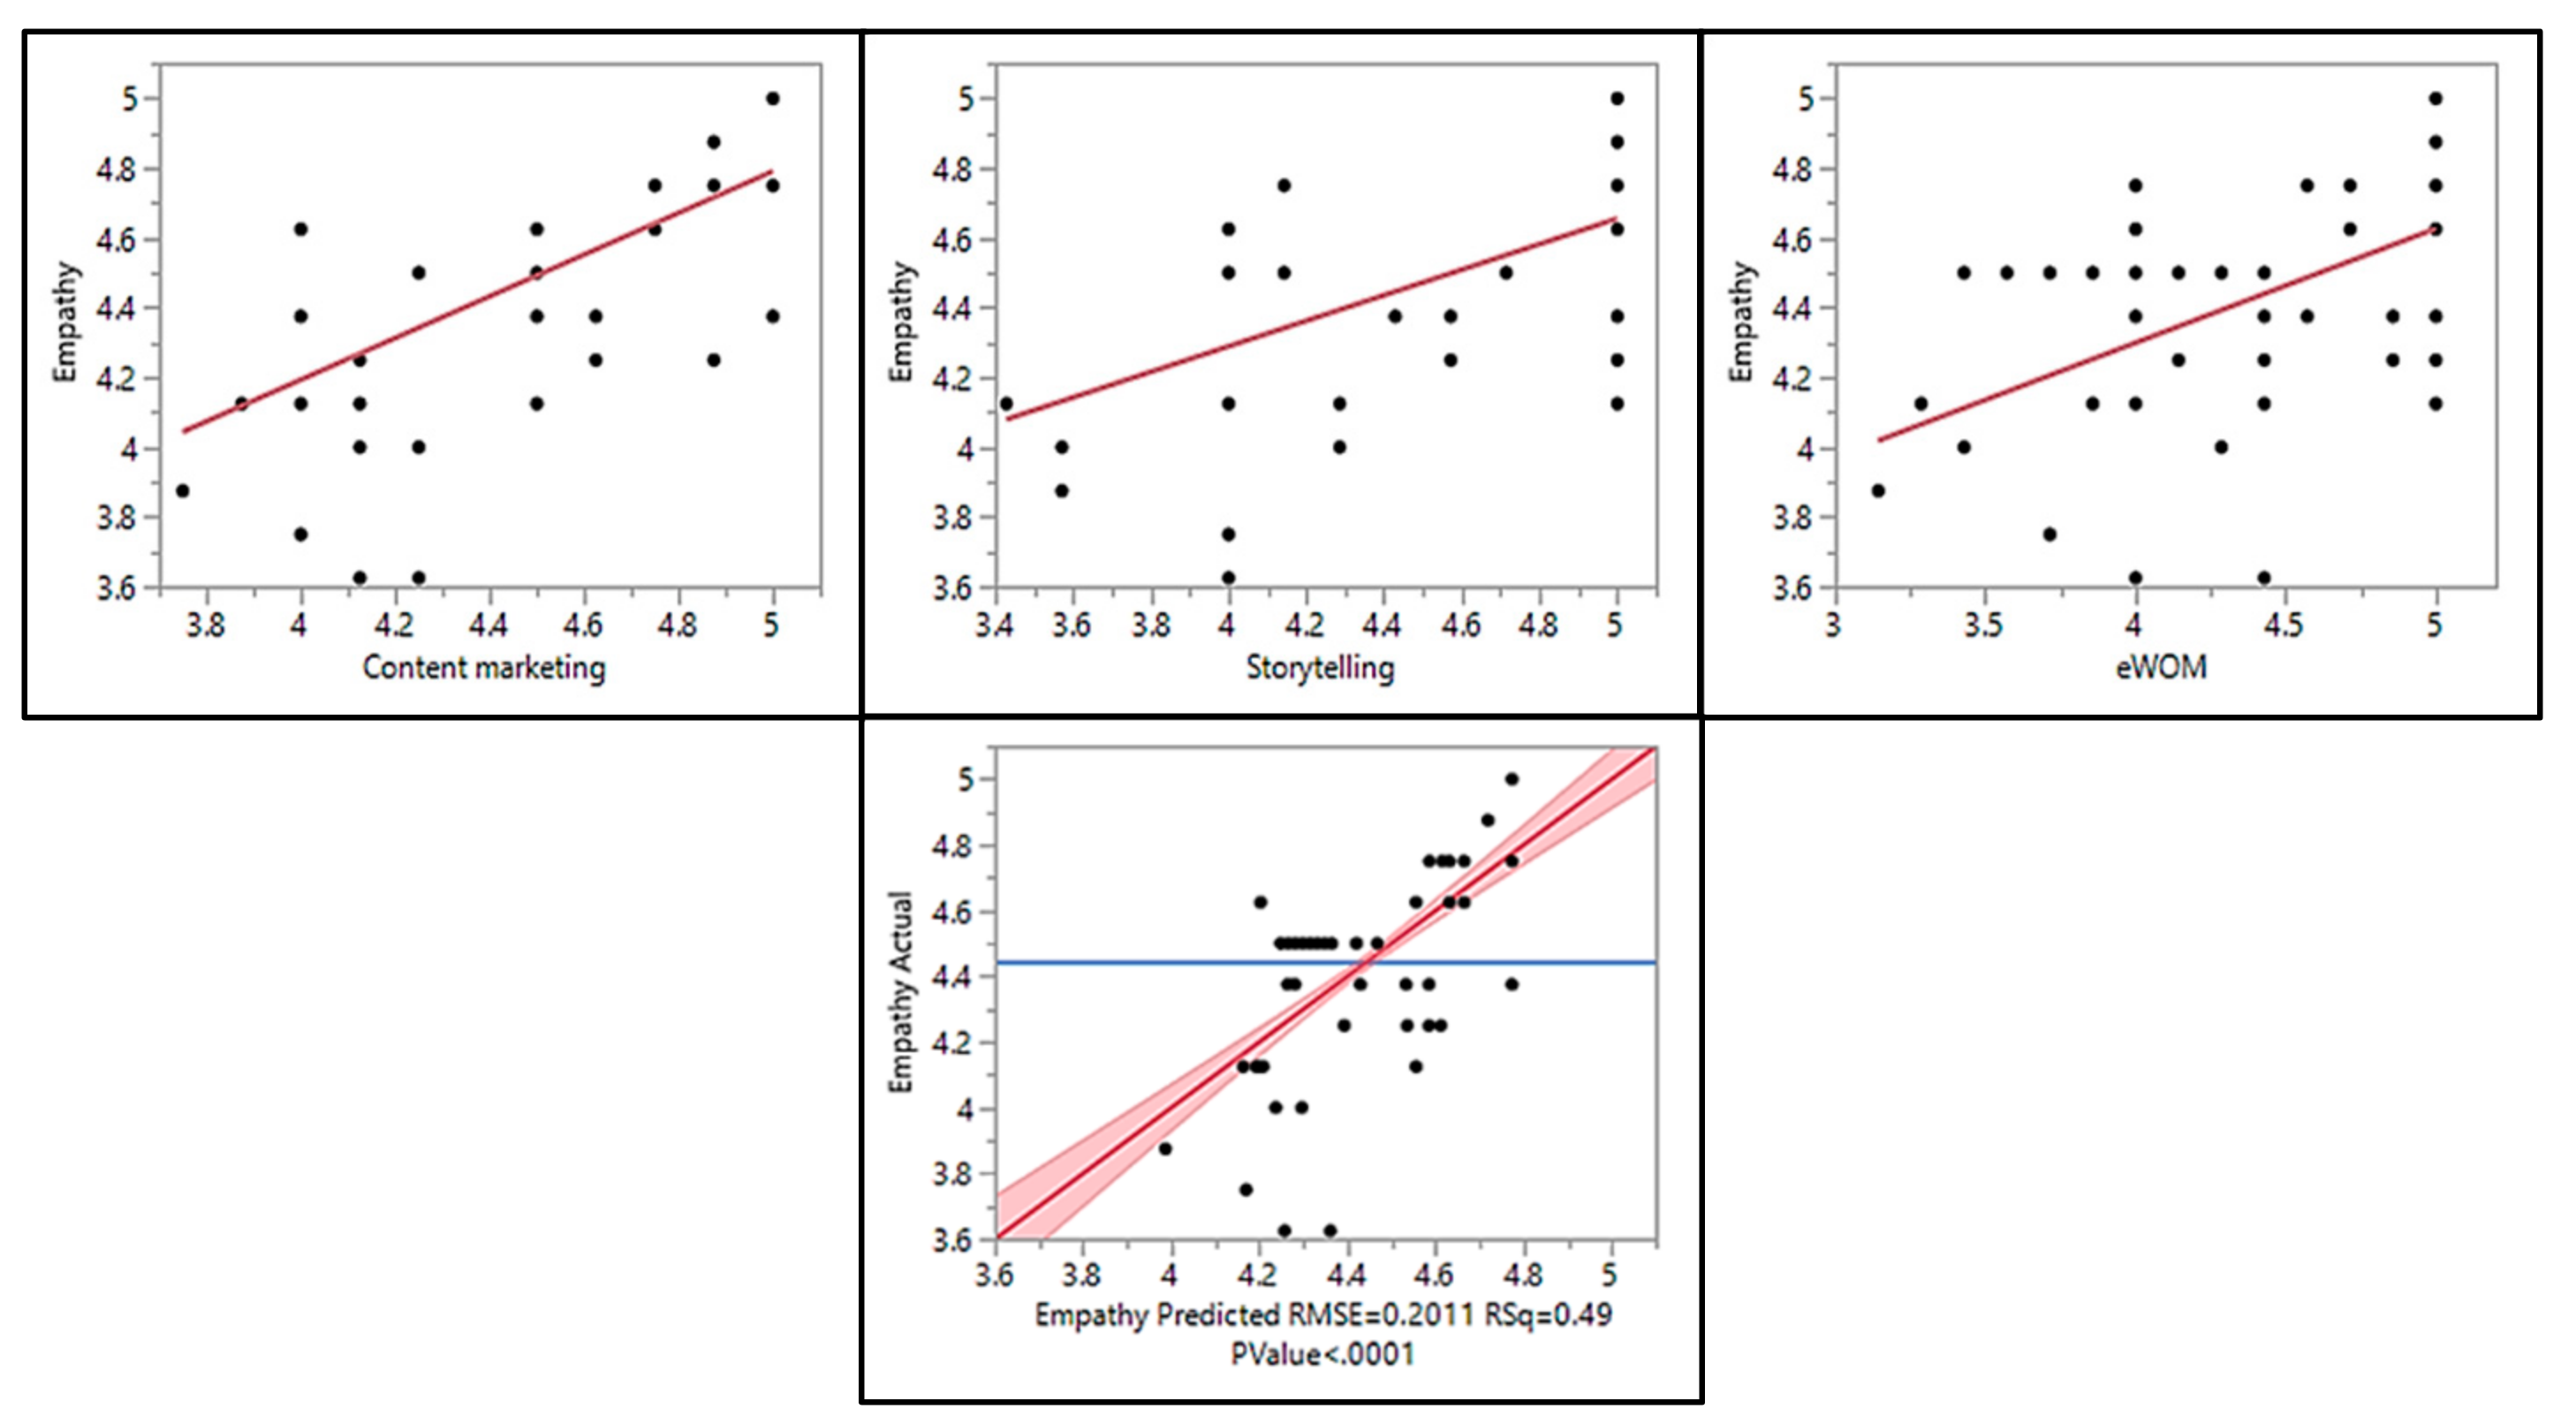
| Independent Variable | ANOVA | Std Beta | RSquare (%) | Connectedness | Hypothesis | Regression Equation |
|---|---|---|---|---|---|---|
| Content marketing | [F(1358) = 307.2538, p < 0.0001] | 0.679602 | 46.18 | Medium–strong | H41—accepted | |
| Storytelling | [F(1358) = 219.5488, p < 0.0001] | 0.616554 | 38.01 | Medium–strong | H42—accepted | |
| eWOM | [F(1358) = 213.0804, p < 0.0001]. | 0.610834 | 37.31 | Medium–strong | H43—accepted | |
| Content marketing, Storytelling, eWOM | [F(3356) = 271.8681, p < 0.0001] | 0.698706 | 48.81 | Medium–strong | H04—accepted |
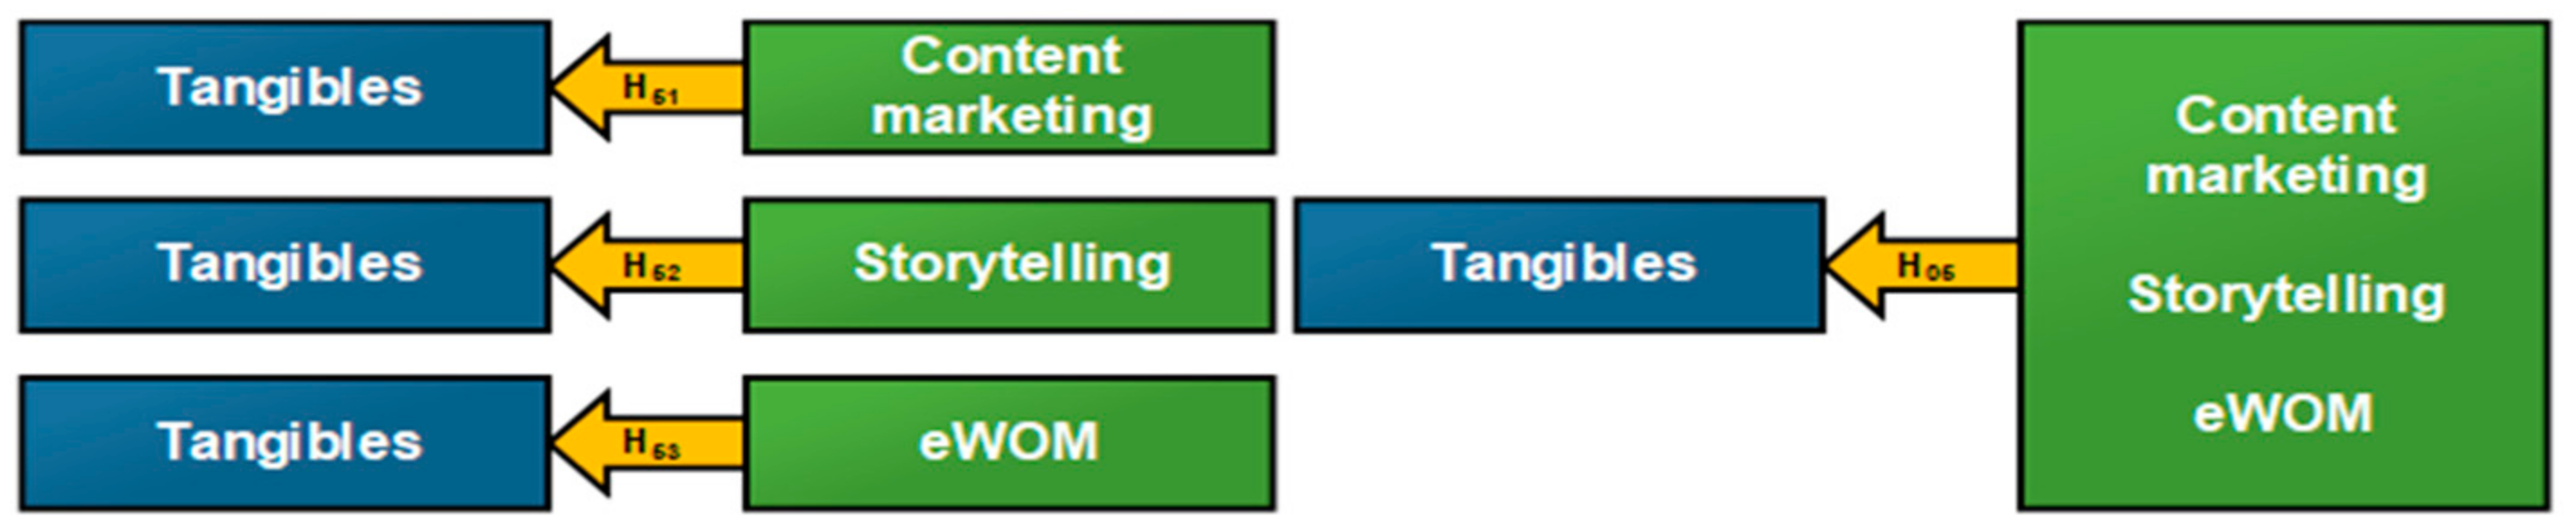
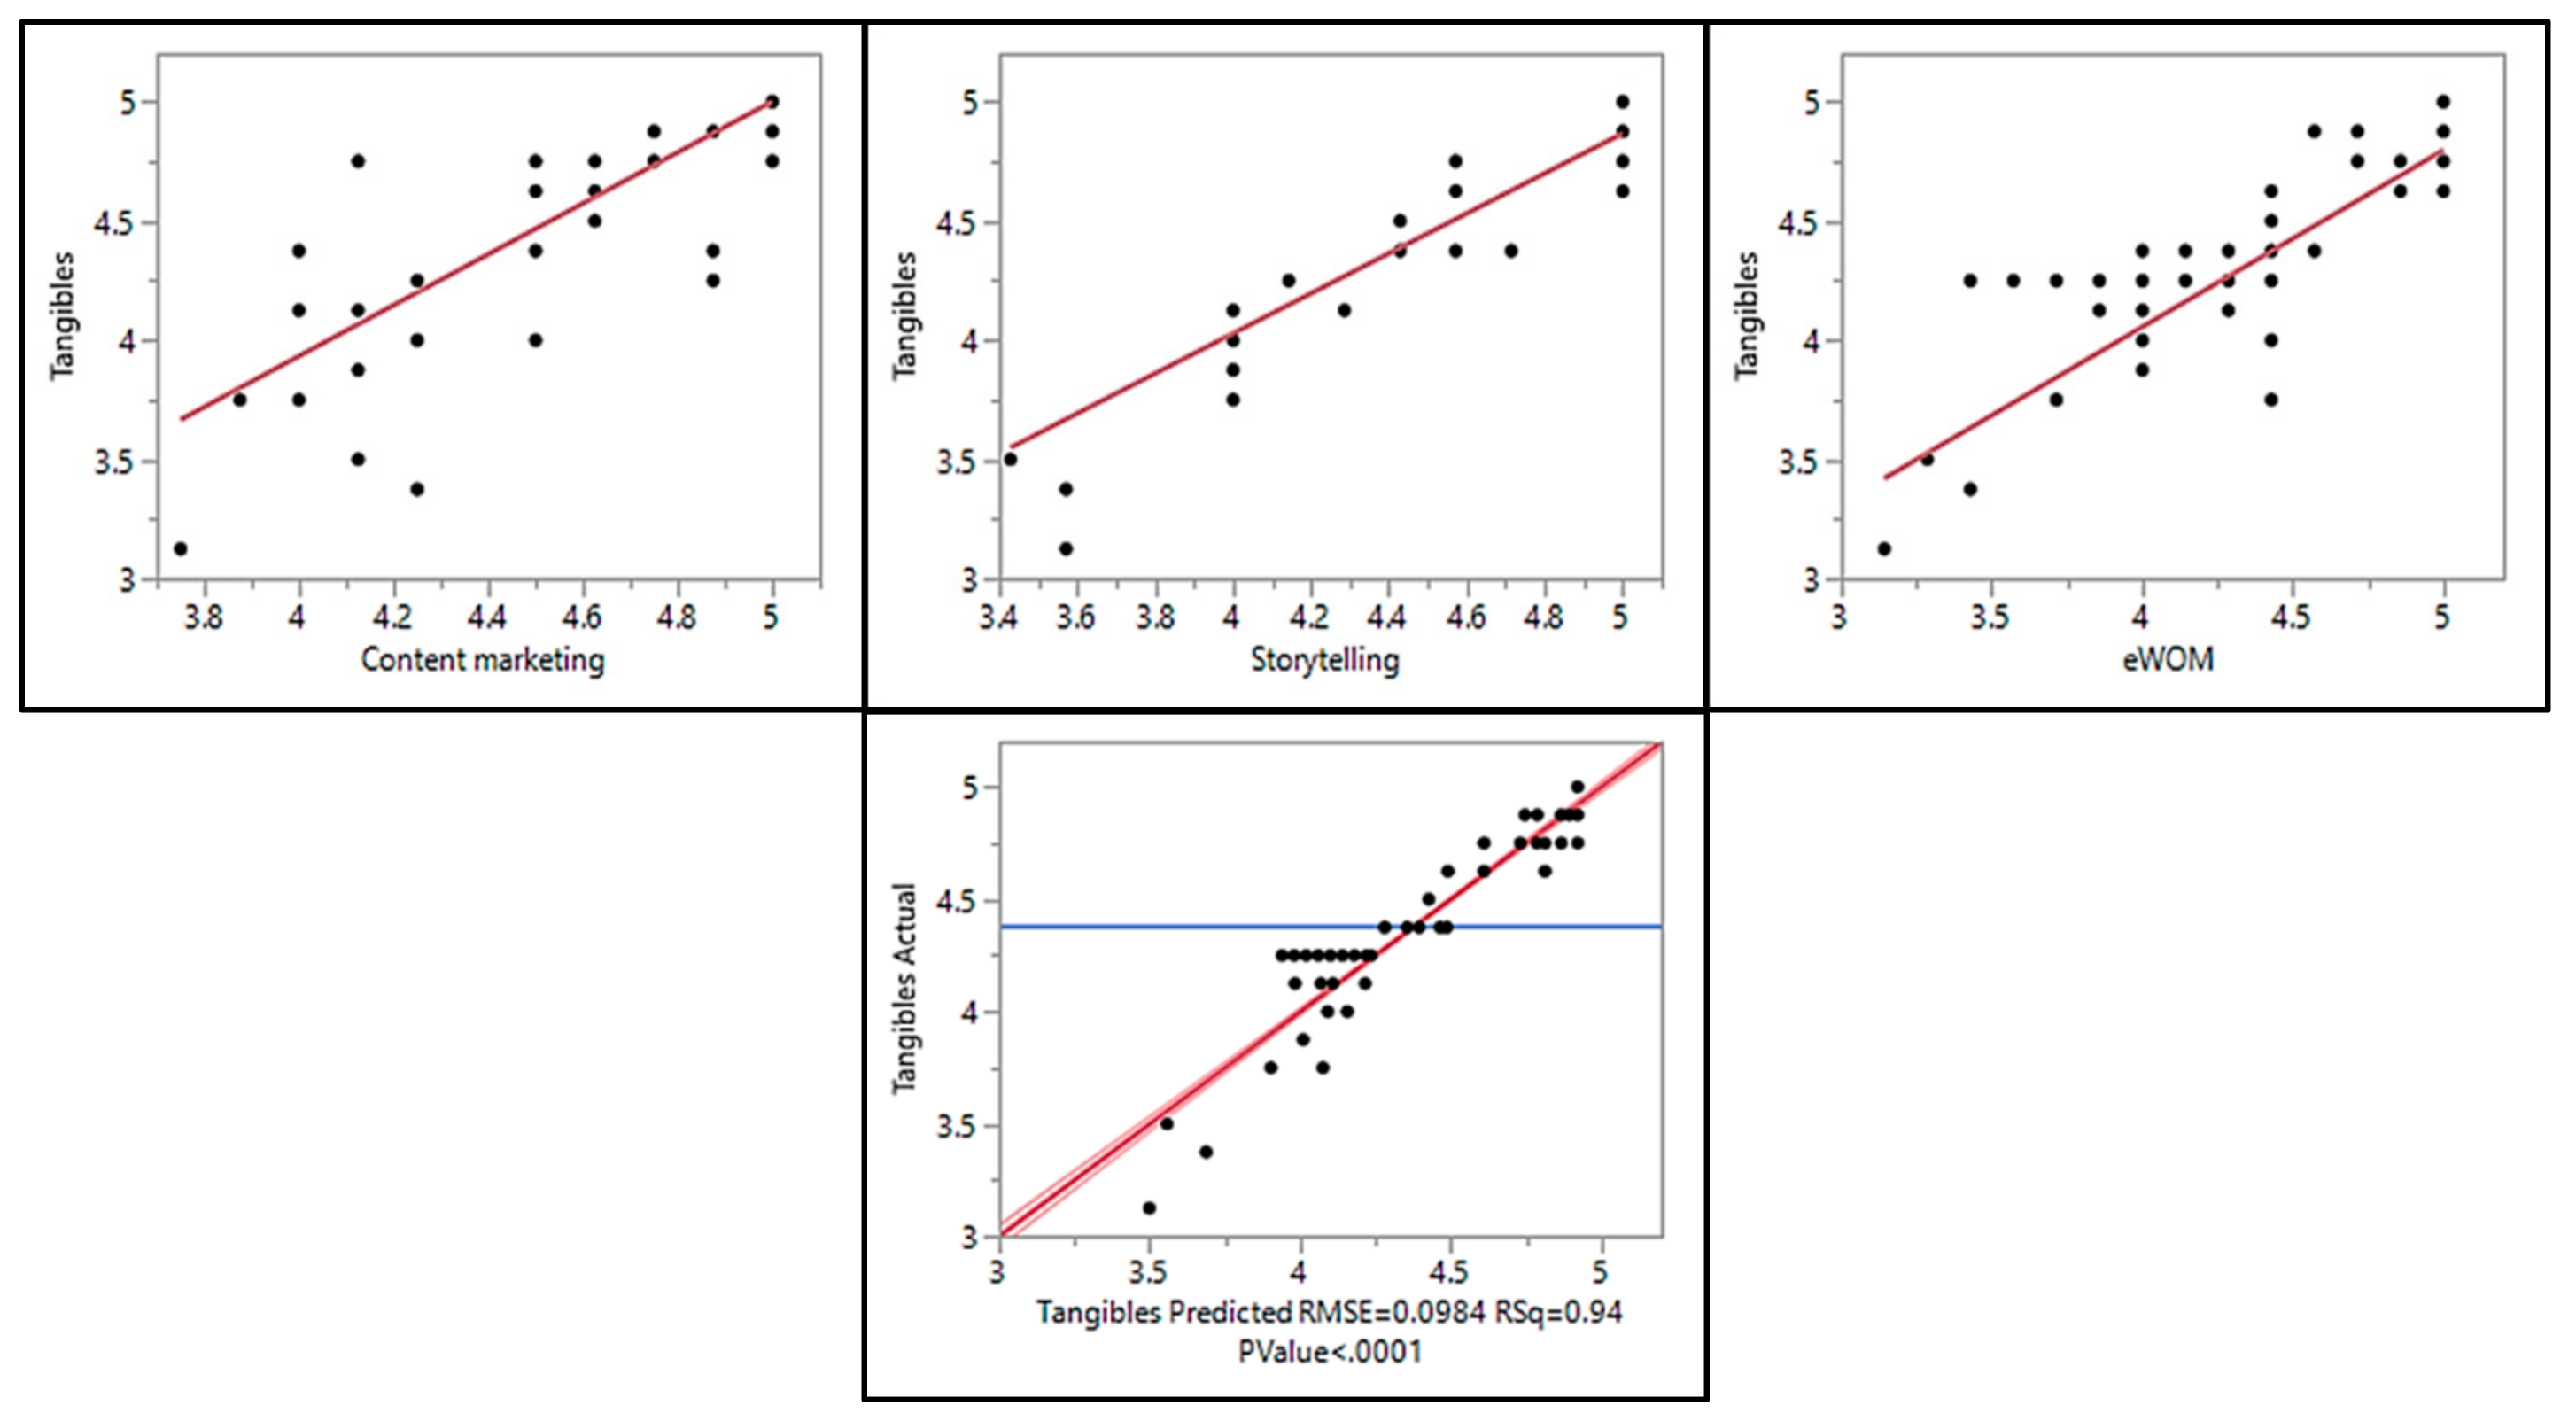
| Independent Variable | ANOVA | Std. Beta | RSquare (%) | Connectedness | Hypothesis | Regression Analysis |
|---|---|---|---|---|---|---|
| Content marketing | [F(1358) = 732.4470, p < 0.0001] | 0.819570 | 67.16 | Strong | H51—accepted | |
| Storytelling | [F(1358) = 3588.289, p < 0.0001]. | 0.953563 | 90.92 | Strong | H52—accepted | |
| eWOM | [F(1358) = 2405.214, p < 0.0001] | 0.932974 | 87.04 | Strong | H53—accepted | |
| Content marketing, Storytelling, eWOM | [F(3356) = 2005.408, p < 0.0001] | 0.971665 | 94.41 | Strong | H05—accepted |
Publisher’s Note: MDPI stays neutral with regard to jurisdictional claims in published maps and institutional affiliations. |
© 2021 by the authors. Licensee MDPI, Basel, Switzerland. This article is an open access article distributed under the terms and conditions of the Creative Commons Attribution (CC BY) license (https://creativecommons.org/licenses/by/4.0/).
Share and Cite
Brzakovic, A.; Brzakovic, T.; Karabasevic, D.; Popovic, G. Empirical Analysis of the Influence of Digital Marketing Elements on Service Quality Variables in the Small- and Medium-Sized Enterprises Sector in the Republic of Serbia. Sustainability 2021, 13, 10264. https://doi.org/10.3390/su131810264
Brzakovic A, Brzakovic T, Karabasevic D, Popovic G. Empirical Analysis of the Influence of Digital Marketing Elements on Service Quality Variables in the Small- and Medium-Sized Enterprises Sector in the Republic of Serbia. Sustainability. 2021; 13(18):10264. https://doi.org/10.3390/su131810264
Chicago/Turabian StyleBrzakovic, Aleksandar, Tomislav Brzakovic, Darjan Karabasevic, and Gabrijela Popovic. 2021. "Empirical Analysis of the Influence of Digital Marketing Elements on Service Quality Variables in the Small- and Medium-Sized Enterprises Sector in the Republic of Serbia" Sustainability 13, no. 18: 10264. https://doi.org/10.3390/su131810264
APA StyleBrzakovic, A., Brzakovic, T., Karabasevic, D., & Popovic, G. (2021). Empirical Analysis of the Influence of Digital Marketing Elements on Service Quality Variables in the Small- and Medium-Sized Enterprises Sector in the Republic of Serbia. Sustainability, 13(18), 10264. https://doi.org/10.3390/su131810264