1. Introduction
The topic of behavioral operations management came together with the study of complex system dynamics; in fact, the impact of human behavior in operations management became clear when Forrester (1952) proposed the Beer Game to perform a human experiment: simulating a four-level supply chain with customer demand and supply lead times uncertainties, he showed how human managers achieve higher operations costs than those which are obtained following the normative behavior, forwarding, step by step, the customer demand to the upstream supplier. Along the research path established by Forrester, the use of psychology applied to decisions introduced important insights aiming at modeling the human cognitive process, while controlled human experiments became the principal method to prove its efficacy.
After Forrester, Tversky and Kahneman [
1], Sterman [
2] analyzed what anchor and adjustment metrics individuals assume in the context of the Beer Game; Sterman’s analysis considerably deepens the study of cognitive bias and introduced the modal response spectra of human behaviors, allowing us to evaluate how much a single individual, and not just the average one, weighs.
Supply chain management [
3] and its impact on sustainability cannot be properly analyzed without considering how the system dynamics affect individuals and vice versa, particularly when systematic biased management behaviors make supply chains unbalanced and lead to an increase in waste generation and resource consumption [
4]. With regard to this issue, the Beer Game—due to its nature of complex systems—makes it difficult to isolate the influences on individual results that arise from cognitive biases or from other supply actors. In order to better focus on human cognitive biases, another business game was proposed, trying to lower the relevant operations variables of the system: The Newsvendor Problem. It still belongs to the topic of inventory management under uncertainty conditions, but, compared to the Beer Game, it is characterized by a lower number of variables (only the external demand), and therefore, enables us to isolate and manipulate the influence of independent variables on the results of the entire system.
In [
5], Schweitzer and Cachon discovered the pull-to-center effect. This bias affects decision makers who order too much or too little when facing low and high profit game settings, respectively, with multiple replications (at least 15 sales periods) and too close to the expected demand. The bias occurs even when the decision makers have a complete statistical knowledge of the external demand in order to forecast the customer. Since the pivotal study of Schweitzer and Cachon [
5], many other authors have followed the same research path [
6,
7,
8]. They designed controlled human experiments which are a valuable option for academics as they are cheap and quickly executable with the involvement of students. More than one hundred cognitive biases have been proposed to explain the pull-to-center effect. A definitive explanation and agreed opinion on the causes of the pull-to-center effect has not yet been found [
9] because the cognitive process that decision makers follow looks unintended.
To complete the picture about the human contribution in the field of operations management, in the context of the research on decision support systems, Dietvorst et al. [
10] discovered how human decision makers can even define themselves as adverse to algorithms and, therefore, to the scientific method.
After more than half a century of research, an issue is clear: humans do not play business games following normative behaviors. Human decision makers do not consider information, theory and management knowledge as important as they should, and tend to use heuristic techniques instead of the normative formula. Therefore, this study aims at deepening the analysis of the human contribution in the context of the newsvendor’s decisions and, more specifically, at studying the pull-to-center effect with regard to the following questions that are yet without a definitive answer. (i) Why do individuals choose the heuristic rather than the analytical method when facing a Newsvendor Game? In fact, as it has been registered from all controlled human experiments, individuals change their decision step by step, ordering always different quantities along time. (ii) Are controlled human experiments of Newsvendor Game a faithful sample of real operating conditions? (iii) Due to the incentive proposed to the decision maker, to what extent the controlled human experiments are themselves the cause of the distortions that occur? Finally, (iv) how do decision makers evaluate the available information or the aid of a decision support system?
In this paper, a novel newsvendor setting is proposed to tackle the previous questions: decision makers are equipped with a decision support system while they make decisions. Moreover, we try also to verify how controlled human experiments can be considered a real representation of reality, asking individuals their version about how they played the game.
2. Literature Review
The Newsvendor Problem is arguably the simplest stochastic inventory problem devoted to the essential principles of rational inventory decisions. Many authors have found that managers broadly exhibit the same kind of pull-to-center bias as students do. The pull-to-center effect is a tendency of a subject to order between the mean demand and the optimal order quantity. For instance, Schweitzer and Cachon [
5] identified this effect in a controlled human experiment with undergraduate and MBA students. In [
11], it has been argued that this bias is not linked to the risk attitude of the newsvendors. Benzion et al. [
12] highlighted that this effect arises irrespectively of the type of demand distributions and even when newsvendors are provided with a complete description of their performance during the game [
7]. In the papers of Lurie and Swaminathan [
13] and Katok et al. [
14], it has been pointed out that the knowledge about the economics can bias to degrade the players’ performance.
Several studies try to explain why the pull-to-center bias arises. The original explanation proposed in [
5] combines the choice of a newsvendor to anchor to the mean demand and to minimize the ex post inventory error on the basis of the previous period. More generally, Epley and Gilovich [
15] explained that individuals adjust the decision toward the optimal, starting from an initial available anchor [
1]. As pointed in [
9], the most famous anchors are the mean demand or the demand at the previous period. The latter pushes the newsvendor to order close to the last quantity and then adjust for the prior demand realization. Therefore, the newsvendor is likely to increase the order quantities after a high demand realization, and to decrease after a low demand realization, following a behavior that can be defined as demand chasing. In fact, ordering as a perfect demand chaser entails always ordering the customer demand, with a lag of one time step. This strategy leads to a mean ordered quantity which is equal to the mean customer order and exhibits the pull-to-center effect. A significative correlation between demand chasing and the pull-to-center effect has not been found, while individual heterogeneity has been a candidate as another antecedent effect [
5]. On the other hand, anchoring on the mean demand seems to have the same solid mathematical and psychological motivation of the demand chasing [
9], but it is unable to explain the variability of the orders that has been actually observed in the experiments performed.
All the findings so far discussed are the results of several experimental campaigns; every author tries to modify slightly some of the game setting in order to prove a theory or identify some expected behavior. Nevertheless, it must be pointed out that the implementation of an experimental campaign is not trivial as it requires the tuning of several parameters of the game setting. Among these, the choice of the participants could be a critical issue. As already mentioned, several papers compare the results obtained with different pools of subjects constituted by students or professional buyers [
16,
17,
18], analyzing how the cultural background [
17,
19,
20,
21] and the individual attributes affect the decision biases and the quantity to order. In [
16,
20], authors concluded that the pull-to-center effect emerges for both students and managers: they perform similarly also when they are informed about the game setting, the demand distribution and the nominal order quantity to buy. In [
7], an interesting setting characterized by three phases of increasing learning, supported by task training, has been proposed. In the first phase, no information is given. In the second phase, the probability density function of the demand is provided and in the third, newsvendors are equipped with information for computing the optimal order quantity. What has been concluded is that task training improves the performance for all the players. Moreover, it must be pointed out that the state-of-the-art research discusses the pull-to-center effect at an aggregated level [
9], namely as a mean order quantity which is averaged for all the players; this does not imply that each subject places, at each round, quantities that are pulled to the center [
16,
18,
22].
Several studies try to propose methodologies to debias people and help them to determine the optimal quantity to order. Learning by doing, training and decision support systems are the most used. Any of these methods offer a different level of interaction with the newsvendor [
5,
6,
7,
12]. In general, the idea is to provide information during the evolution of the game, such as the probability density function of the demand, the information about the forgone profits and even the optimal quantity to order.
Two studies provide rather extreme cases of decision support. In [
7], the expected profit and the range of profit associated with each of the order options is provided, and in a further study [
16], the expected profit curve was provided as a function of the order quantity, as well as the nominal solution. Conclusions report that the pull-to-center bias still arises even under these setting.
In [
21], the main claim is that the pull-to-center effect can emerge because subjects underestimate the variance of the demand because they are overconfident. Moreover, they demonstrated that overconfidence increases the pull-to-center effect and, applying a technique to reduce the overconfidence, observed a significant decrease in it.
In general, the individual background, experience, cognition, motivation and emotion can play an important role in the decision-making [
23]. In [
6], the authors rely on adaptive learning, whereas in [
24], the authors rely on computational errors; in other works, [
8,
20,
25] authors focus the investigation on the relationship between cognitive reflection or framing and on newsvendors’ decisions.
Individual heterogeneity is one of the most important key elements for the understanding of the pull-to-center bias because it affects how each individual is able to catch and digest the information given and the information produced by the game during its evolution (i.e., intuitive thinking). To measure this dimension, researchers have conducted experiments that include questionnaires and tests which can be distributed prior the beginning or at the end of the actual game. For instance, the Cognitive Reflection Test (CRT) by Frederick [
26] consists of three questions characterized by an incorrect (intuitive) answer and by a correct answer that can be derived via cognitive thinking; thus, subjects are categorized into intuitive thinkers and cognitive thinkers. A similar study is proposed in [
20] for evaluating if cognitive reflection can influence newsvendor decisions. They concluded that in the high-margin setting, higher CRT scores correspond with individuals who are less affected by the pull-to-center bias than subjects with a low CRT score; nevertheless, this evidence does not emerge in the low-margin setting. In [
27], the researchers discuss the aspect of the psychological costs associated with stockouts and leftovers.
Recently, in order to perform the experiments, several researchers adopted online platforms such as Amazon’s Mechanical Turk [
17,
18]. Such experiments provide larger pools of individuals and data but suffer from the loss of control over the players and, for their nature, cannot be constituted by a high number of rounds. In [
28], the authors compared the performance of the MTurk campaign with university labs and found that decisions are similar for university students and MTurk players involved in newsvendor experiments.
A large amount of research has been conducted for more than 20 years to better understand the ordering behavior of newsvendors. (i) The pull-to-center effect has been replicated in all studies and is a robust observation, and (ii) although its existence is undisputed, it is unclear what is the actual underlying explanation for this effect is [
9]. (iii) All researchers try to find the underlying explanation by analyzing the results without asking the decision makers how they played, and (iv) relatively little has been written about the contribution of decision support systems.
Therefore, this study places the newsvendor at the center of the analysis, equipped (unknowingly) with a (human) decision support system. Thus, newsvendors are interviewed in order to reveal the strategy they followed; this allows us to better analyze the game results.
3. Methodology
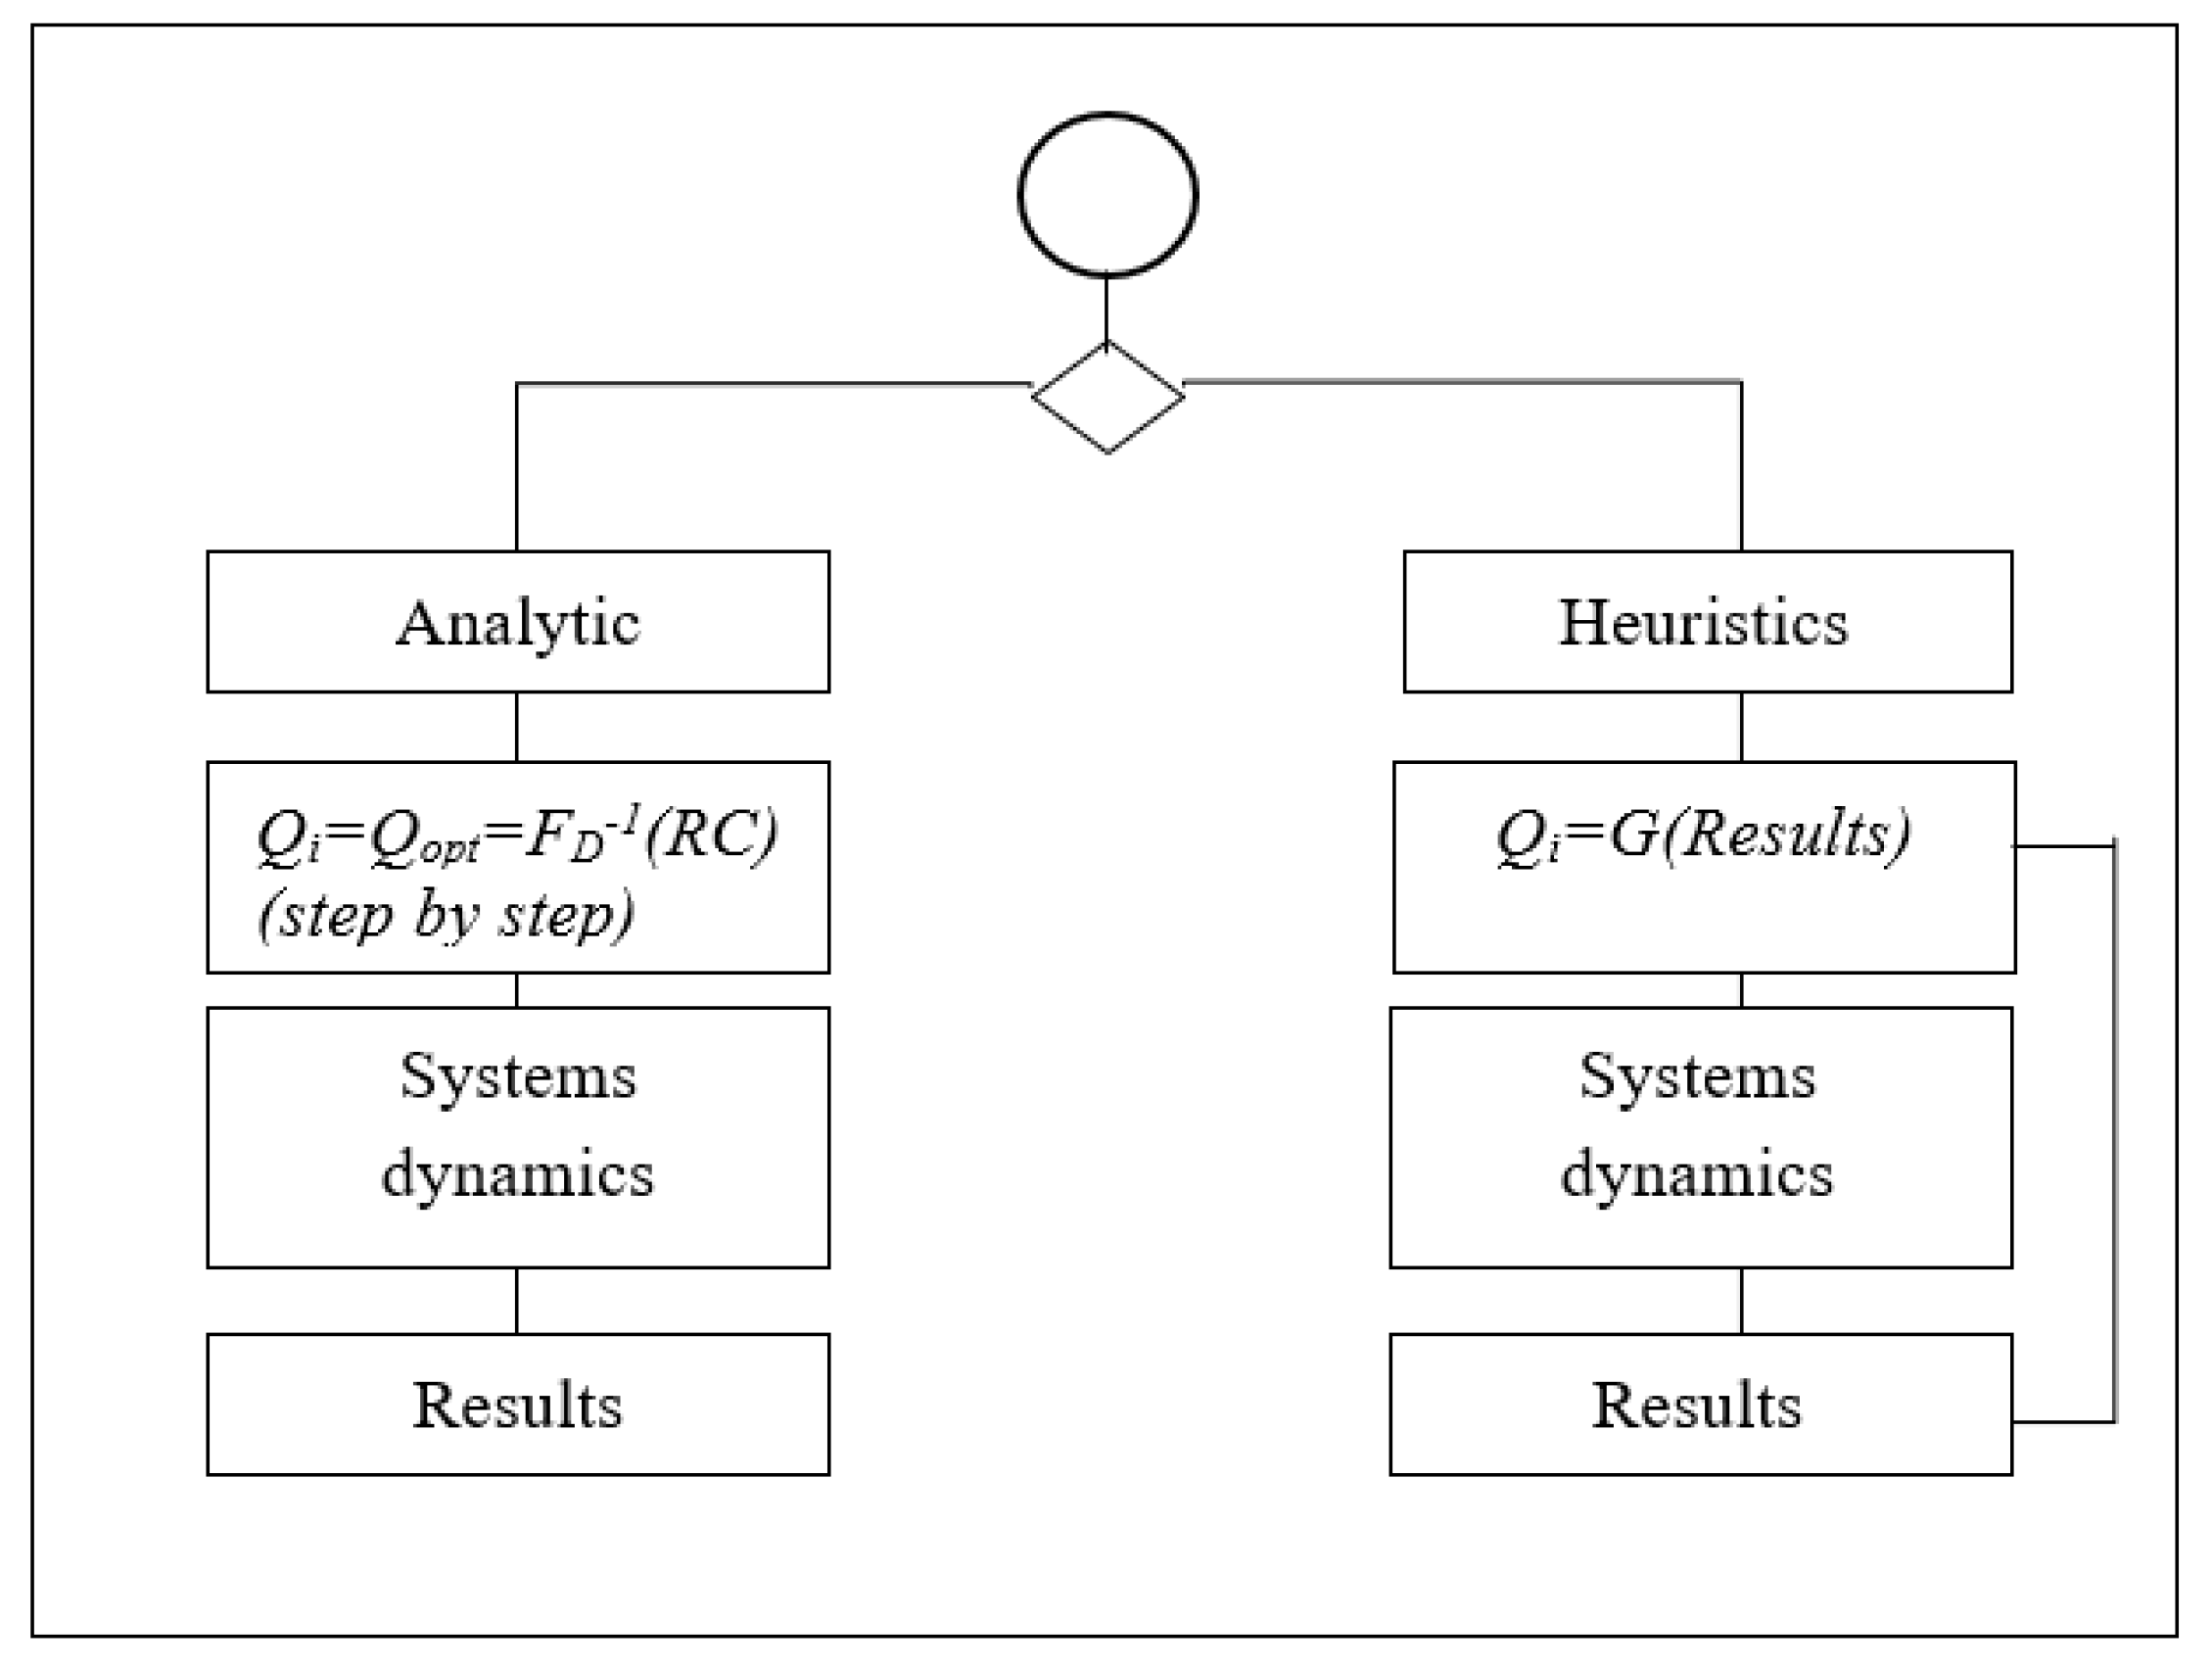
The Newsvendor Problem is defined as the dilemma of who must decide how much to order, in a single sales period, before knowing the market demand and without being able to hold any inventory of what is unsold. The problem, as well as all those inherent to operations research, can be addressed in an analytical or heuristic way (
Figure 1). Knowing the parameters of the economic scenario and assuming that the economic horizon is constituted by an infinite number of sales events, the application of the analytical method allows us to prove that the maximum expected profit is obtained by purchasing, for each period, the quantity obtained by applying well-known equations [
5,
8,
20]:
where
FD−1(·) is the inverse function of the Cumulative Density Function (CDF) of the market demand
D, calculated at the RC value defined as the critical ratio,
p is the sale price,
c is the purchase cost and
s is the residual value.
The critical ratio reflects the characteristics of the economic scenario: when it is greater than 0.5, it results in a high profit, otherwise, the low profit scenario emerges. Given Equation (1), the optimal profit can be achieved from the purchase of a greater quantity than the expected demand, Dm, and vice versa in the case of low profit. The heuristic method, on the other hand, requires the use of some strategy; it can involve a continuous variation of the ordered quantity as it occurs in the attempt of the decision maker to predict the demand at each sale period, for example.
The heuristic method is less elegant and less effective than the analytical one, but due to the uncertainty of the customer demand, the analytical optimum profit is not necessarily greater than the one that can be achieved by the heuristic; in fact, the exact forecast of the commercial demand would entail the achievement of a higher profit, although it is very unlikely that the heuristic method can achieve such an objective.
The flow diagram of
Figure 1 tries to highlight how individuals must first decide the method for solving the problem to order the quantity
Qi for each
ith round of the game, facing different dynamics of the system. A conscious adherence to the analytic method implies the adoption of a single quantity
Qi =
Qopt to be ordered in each period and, in the case of a sufficiently long operating horizon, the achievement of the expected profit; on the other hand, the choice of the heuristic method implies the assumption of a logic in which the quantity
Qi is chosen according to the evolution of the system dynamic and the evaluation of the results that occur. In this decision-making framework, the following features play a decisive role for the individual: the economic framework of high or low profit, the information on the demand, and more generally, the confidence that the individual has on them, the perception of the duration of the game horizon and the motivation. Therefore, it appears that the analytic method must be chosen when the hypotheses for which Equation (1) is applicable are fully satisfied: fully known information on demand, fully known and fixed economic characteristics of the game, known and infinite game horizon. In all other cases, when the game horizon is or is considered to be short by the decision maker, when there is no information on the demand or when the incentive inspires the decision maker to be particularly risk-prone, the heuristic method should be chosen. Finally, it must be recognized that the heuristic method can be chosen when the existence of the algorithmic
Qopt is not known.
The above-mentioned features allow us to design a different type of controlled human experiment.
4. Design of Experiments
In the attempt to design the controlled human experiments, the issues that are considered crucial in most of the famous experiments conducted for the Newsvendor Problem have been targeted. In [
5], it was supposed that the behavior of the decision makers could be explained with the attempt to repair ex post the mistakes made; in turn, this appears compatible with the nature of the incentive placed by the same authors to motivate individuals: they declared to pay the participants by drawing lots for a period of play and paying according to the profit reached there. This pushes individuals to try to maximize the number of periods with positive profit and, on the other hand, to immediately move away from the decision that led to a negative profit (which is probable even when the optimal ordered quantity is adopted). In [
7], it was verified that by blocking the quantity to be ordered (standing orders) for a certain period, the newsvendors approached the optimal profit considerably (the ratio between realized profit and optimal profit is found equal to 95% in the case of low profit scenario and 90% in the case of high profit economic scenario). This type of test leads us to believe that when the decision maker is forced to choose an order quantity for a fixed period, he returns to play in analytic way, not being able to bet period after period.
In another work [
8], the authors found that playing the Newsvendor Game in groups (pairs) does not lead to significant performance improvements. However, this has been verified as occurring when they play simultaneously and with the same role, on the same team, side by side. It appears that the type of role played and the amount of available information (including the contribution of decision support systems) may also affect the method chosen to solve the problem.
The Duogame Setting
To cope with the previous observation, in this paper, a novel setting for the Newsvendor Game has been defined. The decision maker (newsvendor) is equipped with a decision support system (DSS). The DSS is another individual who assists the newsvendor remotely as a consultant. Period after period, the consultant communicates the suggested quantity to order as an advice to the newsvendor before this latter has placed the order. In the experimental campaign of this paper, the consultant and the newsvendor start playing together from the sixth period, because for the first five rounds, no DSS is given to the newsvendor. Moreover, each newsvendor is not aware about the nature of the DSS, whether it is human or computerized. On the other hand, the consultant is aware of his role towards the newsvendor, and he knows to receive the same incentive of his partner.
Individuals participating in the experiment are students belonging to the master’s degree courses in management and mechanical engineering. The incentive consists of an academic credit granted to the first three teams (of newsvendors and their consultants) for the total profit; in this setting, teams are competing against each other. Participants start the game after observing the outcome of the first game period with a demand equal to the initial condition assumed in [
5], (
D1 = 295).
The experiment process was conducted remotely through the MS Teams electronic platform. One day before the game, all the participants received basic information about the Newsvendor Problem and the didactic documentation edited in MS Power Point environment (the briefing takes about 45 min). The day after, the participants were divided into two different teams: one dedicated to newsvendors, the other dedicated to consultants. Only at that moment, students were informed that they would deal with a business game concerning the Newsvendor Problem and the role played; each group was also informed about the functioning of the electronic platform used to run the game and the incentive.
During the game, each decision maker has one minute to place his quantity (consultants suggest the quantity, newsvendors place the order). Demand is randomly sampled and, as the game is played remotely, it is tailored for everyone independently from the others.
The duogame test takes up the setting shown in [
5] and attempts to investigate the impact that the information available has on the decision maker and how the incentive can influence their behavior. In addition, in order to better clarify the behavior of each individual, after the experiment, each participant was asked to answer to a questionnaire during a short interview (lasting 15 min) in order to identify the strategy used during the game. The interview is based on the questionnaire reported in the appendix. It was conducted by a Ph.D. student engaged in the drafting of his thesis with the aim of making the interview without filters and being able to capture the most genuine statements.
Controlled human experiments are conducted on two groups of students; the first group (duogame-G1) was made up of 46 students (average age 23 years) selected within the cohort of the academic year 2019–2020 of the degree course in Management or Mechanical Engineering. Before facing the experiment, scheduled within a monographic course dedicated to behavioral operations management lasting six hours, delivered during the second semester, they followed the course of integrated management of production logistics systems and a lesson lasting two hours dedicated to the subject during the first semester, which supported a partial written test concerning the Newsvendor Problem. A second group (duogame-G2) was made up of 56 students (average age 22 years) selected from other universities of southern Italy, all belonging to degree courses in Management or Mechanical Engineering. They received information on the Newsvendor Problem only during the experiment according to the procedure mentioned above. The duration of the game horizon is shown only to the participants of the duogame-G2, whereas the players of duogame-G1 think that the game duration is 50 periods (but it ends—and for them, is not expected—at the thirtieth period).
The design of the experiments is aimed at verifying whether the pull-to-center effect, seen as the result of a heuristic approach to the problem, can be correlated with (i) the perception that the decision maker has on the length of the game horizon, (ii) the type of incentive system, (iii) the quality of information or decision support system, (iv) the role played by a team that participates in the game and (v) the knowledge of the problem that the individual has. Therefore, the hypotheses of the experimental research are as follows:
Hypothesis 1 (H1). The application of analytic method depends on the role that is played as part of a team that tackles the Newsvendor Problem (buyer or consultant); it is argued that the subject would embrace a more analytic-like behavior once appointed as consultant and playing a role with a higher point of view.
Hypothesis 2 (H2). The application of the analytic method grows according to the competence of the decision makers; it is argued that better knowledge leads to playing according to the analytic method.
Hypothesis 3 (H3). The application of the analytic method depends on the incentive system; it is argued that the incentive pushes individuals to play more seriously and according to the analytic method in order to reach the goal with high probability.
Hypothesis 4 (H4). The application of the analytic method depends on the perception on the length of the game horizon; it is argued that a subject prefers the analytic method if the time horizon is sufficiently long to believe to the law of large numbers.
Hypothesis 5 (H5). The application of the analytic method depends on the quality of information; it is argued that newsvendors and consultants, working together, more likely dopt the analytic method and, as a consequence, increase the overall performance.
The design of controlled human experiments settings must consider the following issues: economic parameters, demand statistical features, information available to the decision maker during the test and incentive provided. With regard to the economic parameters and the statistical characteristics of the demand, the experiments are based on the case study of [
5] with a demand uniformly distributed in the interval [1, 300] and critical ratio RC = 0.75 (
p = 12,
c = 3,
s = 0). The decision maker is fully aware of the characteristics of the demand, and during the experiment is informed about the progressive average values of the average demand and the relative standard deviation, the profit of the
ith sales event and the cumulative profit.
5. Results
5.1. Metrics
Results of the experiments are presented with reference to the following functions: (i) starting value of the orders; (ii) progressive mean order along the game horizon; (iii) progressive mean profit realized by each couple of players.
Table 1 shows the frequency distribution of the starting orders by type of role and by type of experiment. In the duogame-G1 experiment, newsvendors always choose an anchor: the expected demand in 15.8% of cases and the optimal quantity in the remaining (84.2%). Consultants choose an anchor equal to the expected demand only in 4.8% of cases and the optimum quantity in 71.4% of cases. With regard to the experiment duogame-G2, starting orders of consultants are the optimal quantity in 20% of cases and no further significant concentrations occur.
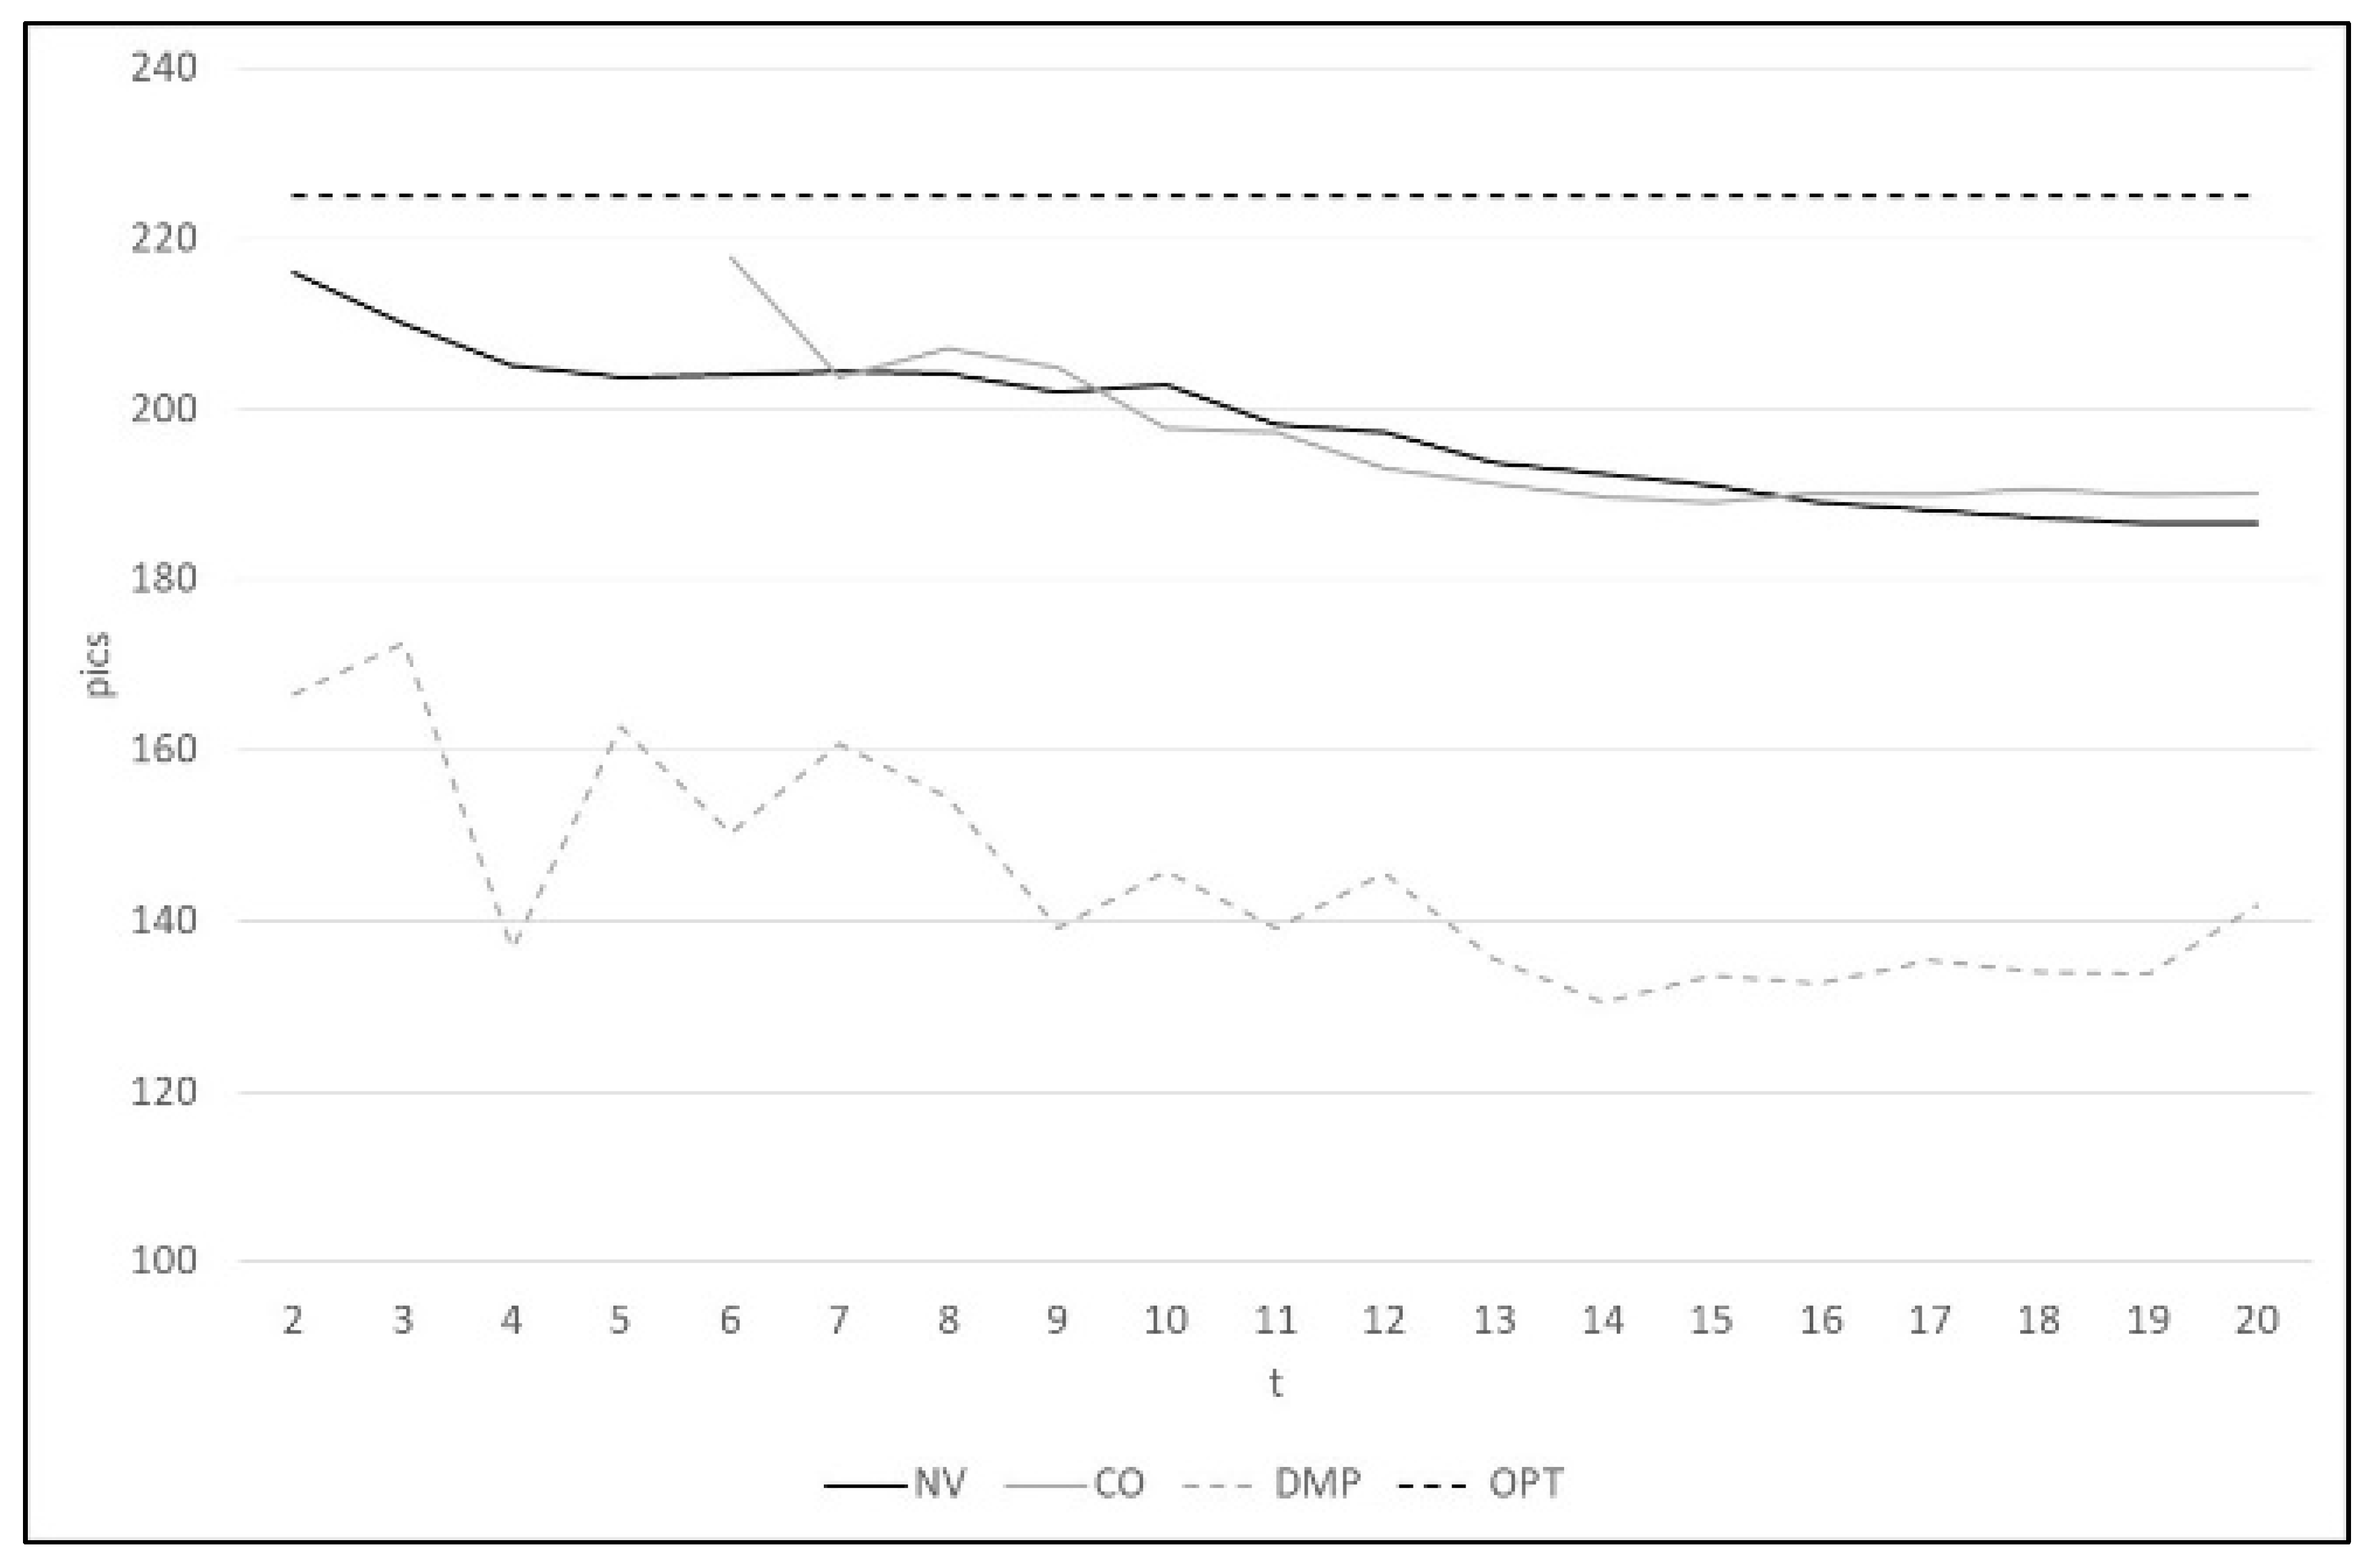
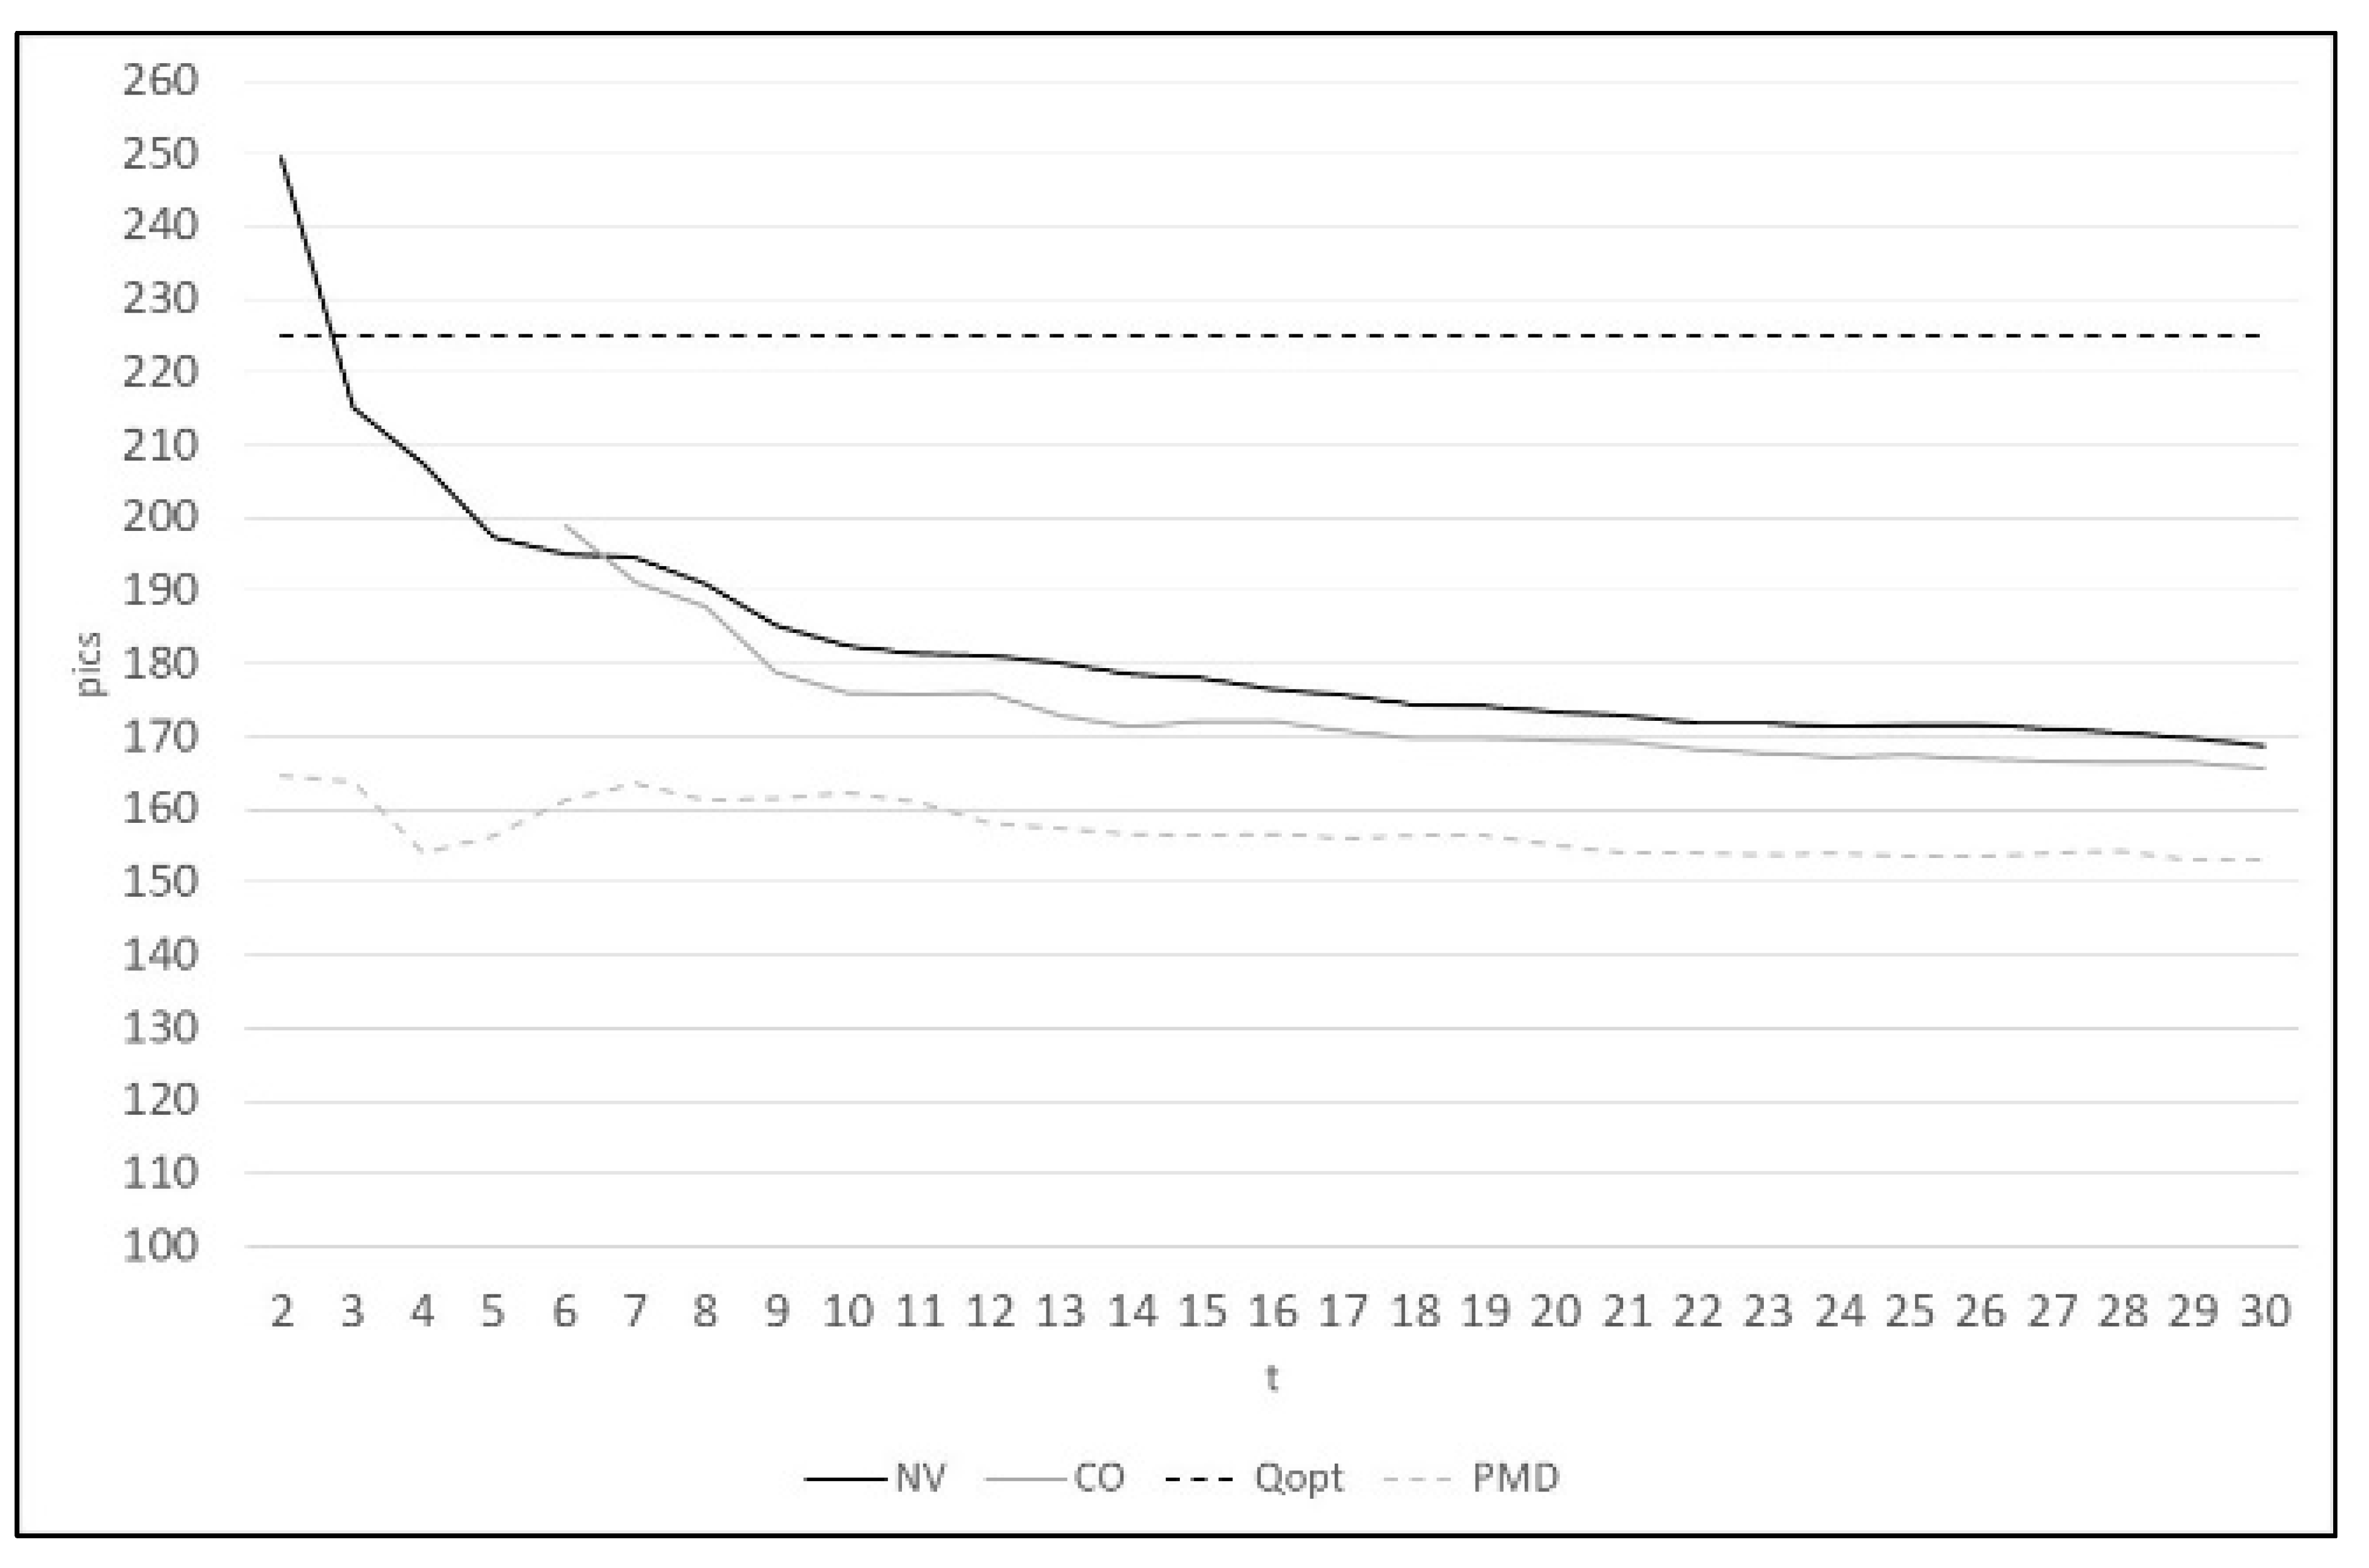
Figure 2 and
Figure 3 show for participants of duogame-G1 and duogame-G2, respectively, the progressive mean demand (DMP), the progressive mean orders which were placed by newsvendors (NV) and consultants (CO) and the optimal quantity to be ordered (OPT).
Results confirm the occurrence of the pull-to-center effect even if starting from distinct initial values. On average, newsvendors’ and consultants’ starting orders are equal to 202.1 pcs (t(22) = −1.73, p > 0.01) and 216.2 pcs (t(22) = −1.20, p > 0.01), respectively, in the case of duogame-G1. In duogame-G2, the starting orders of newsvendors and consultants are equal to 249.6 pcs/t (t(27) = −2.47, p > 0.01) and 198.9 pcs/t (t(27) = −2.47, p > 0.01), respectively. In all cases, having p > 0.01, the hypothesis by which the mean subjects’ starting order is significantly different from the optimal cannot be accepted.
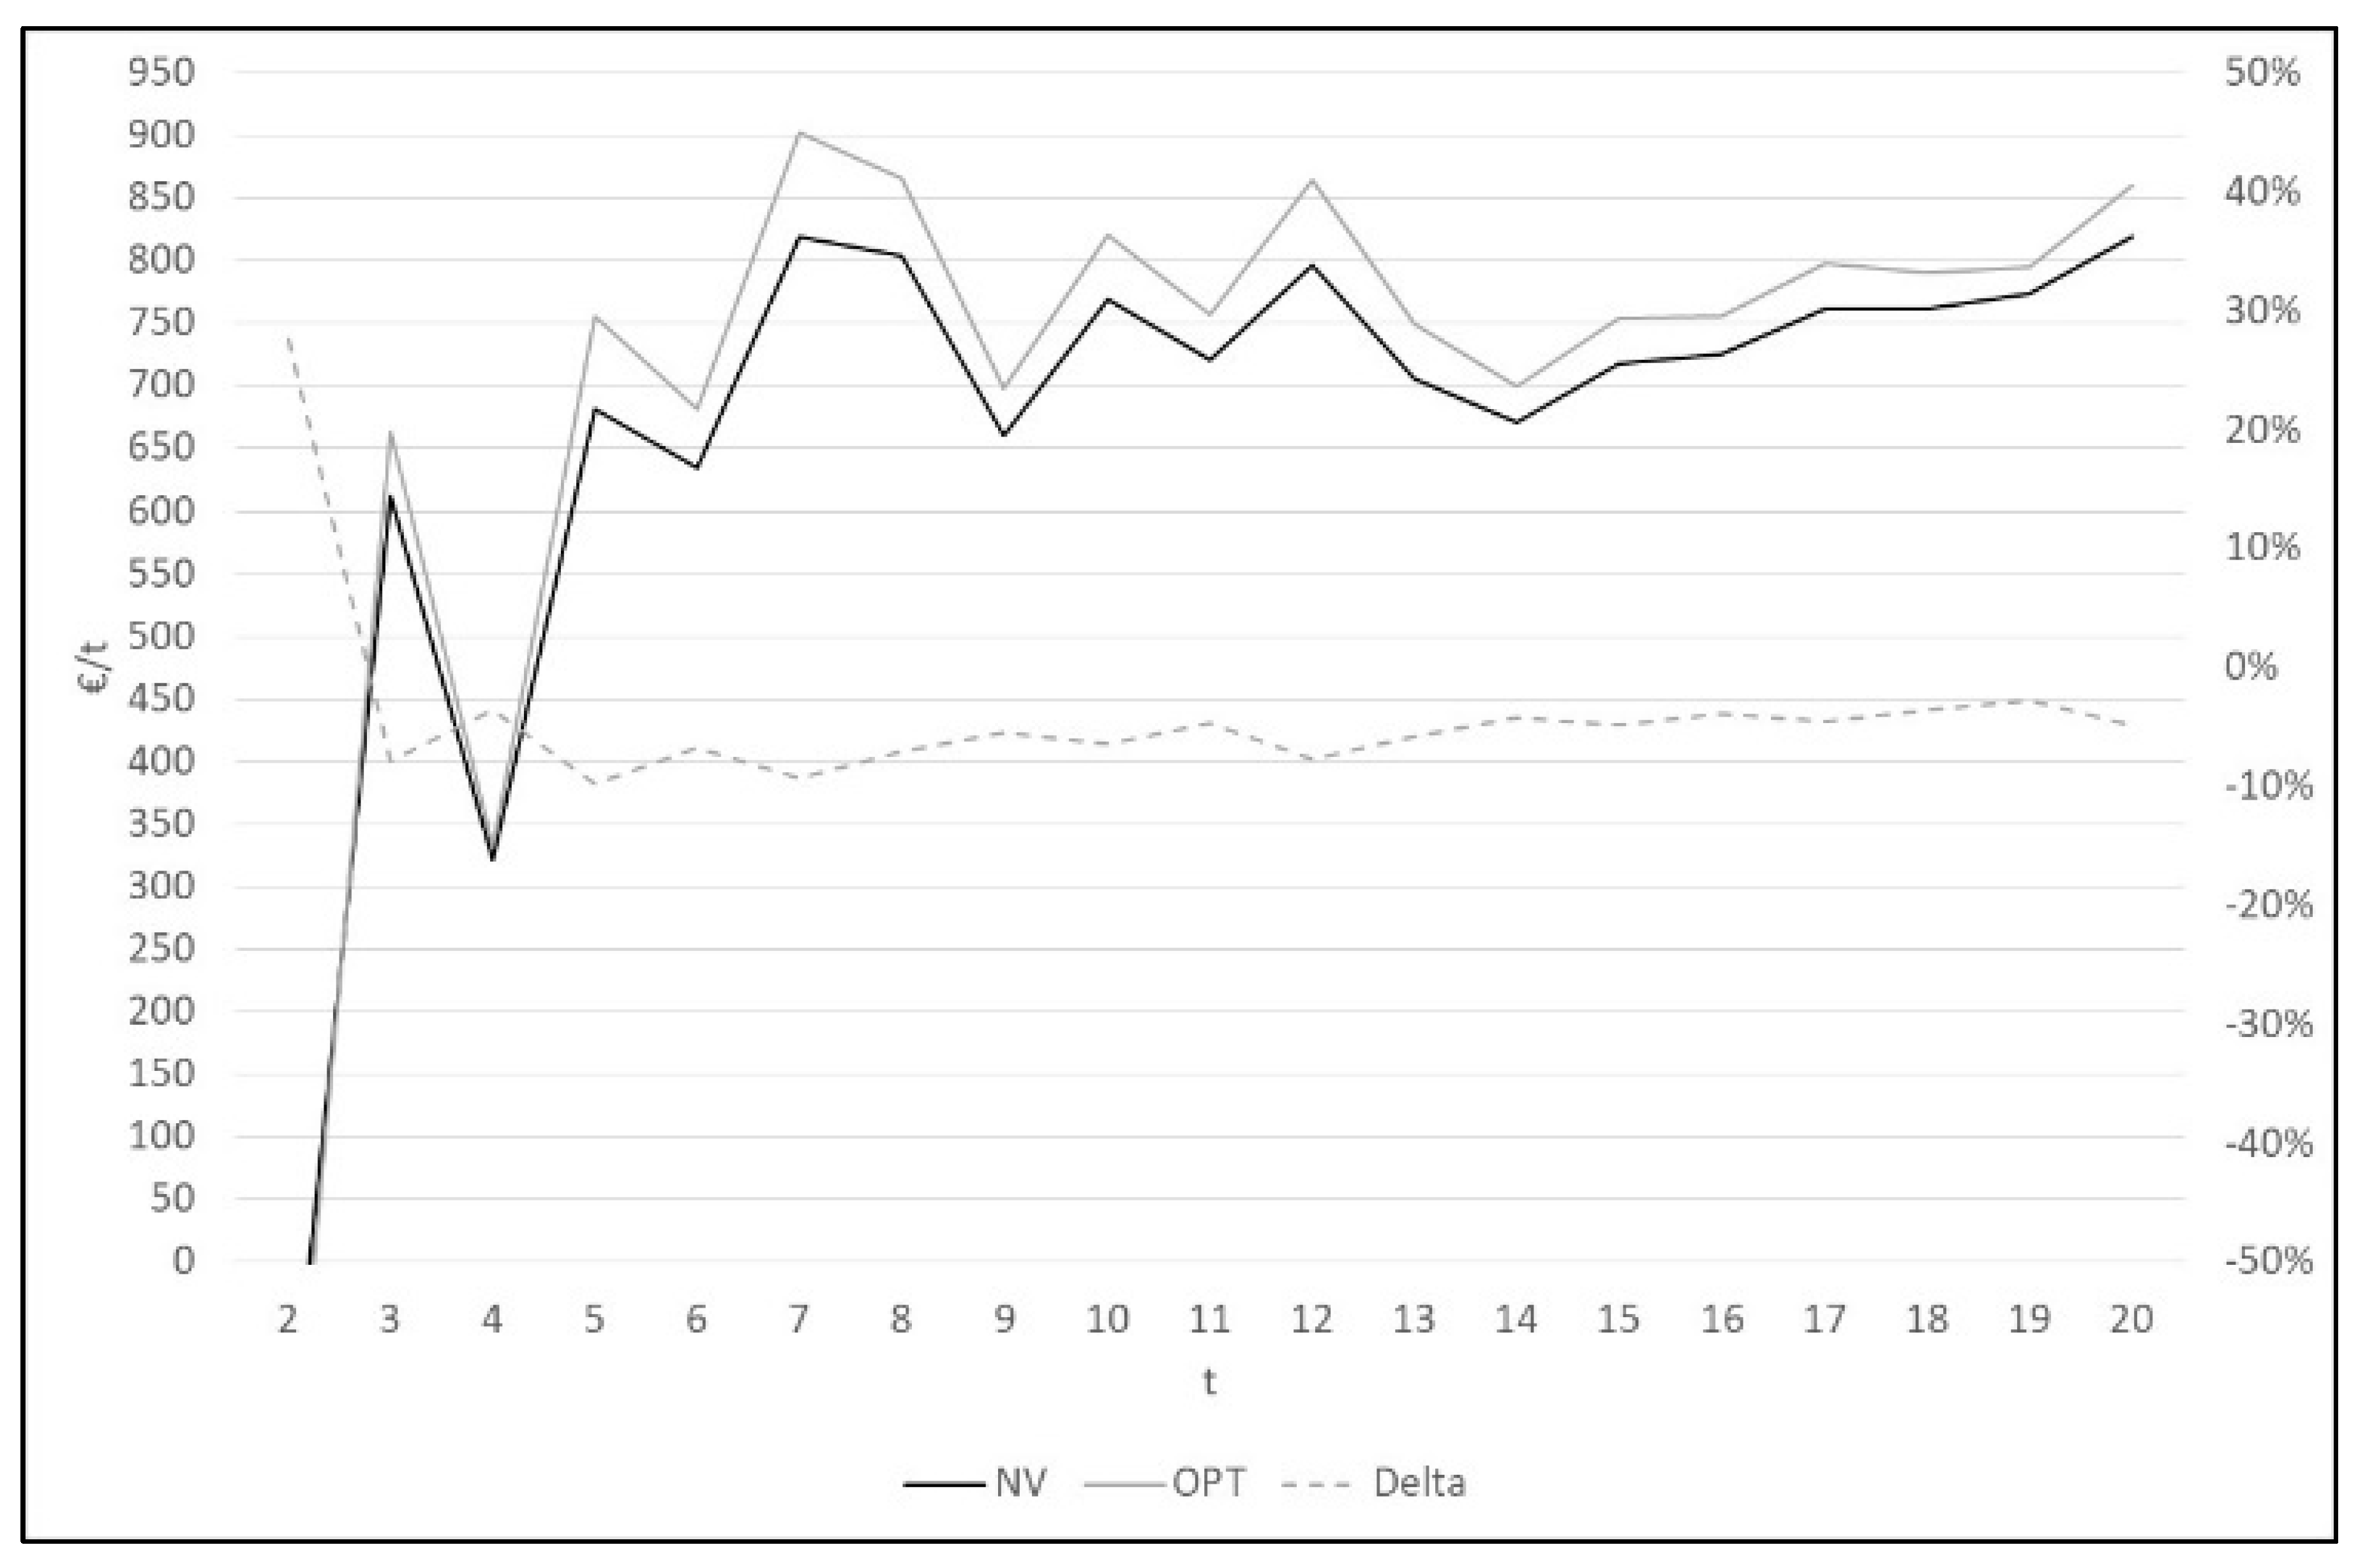
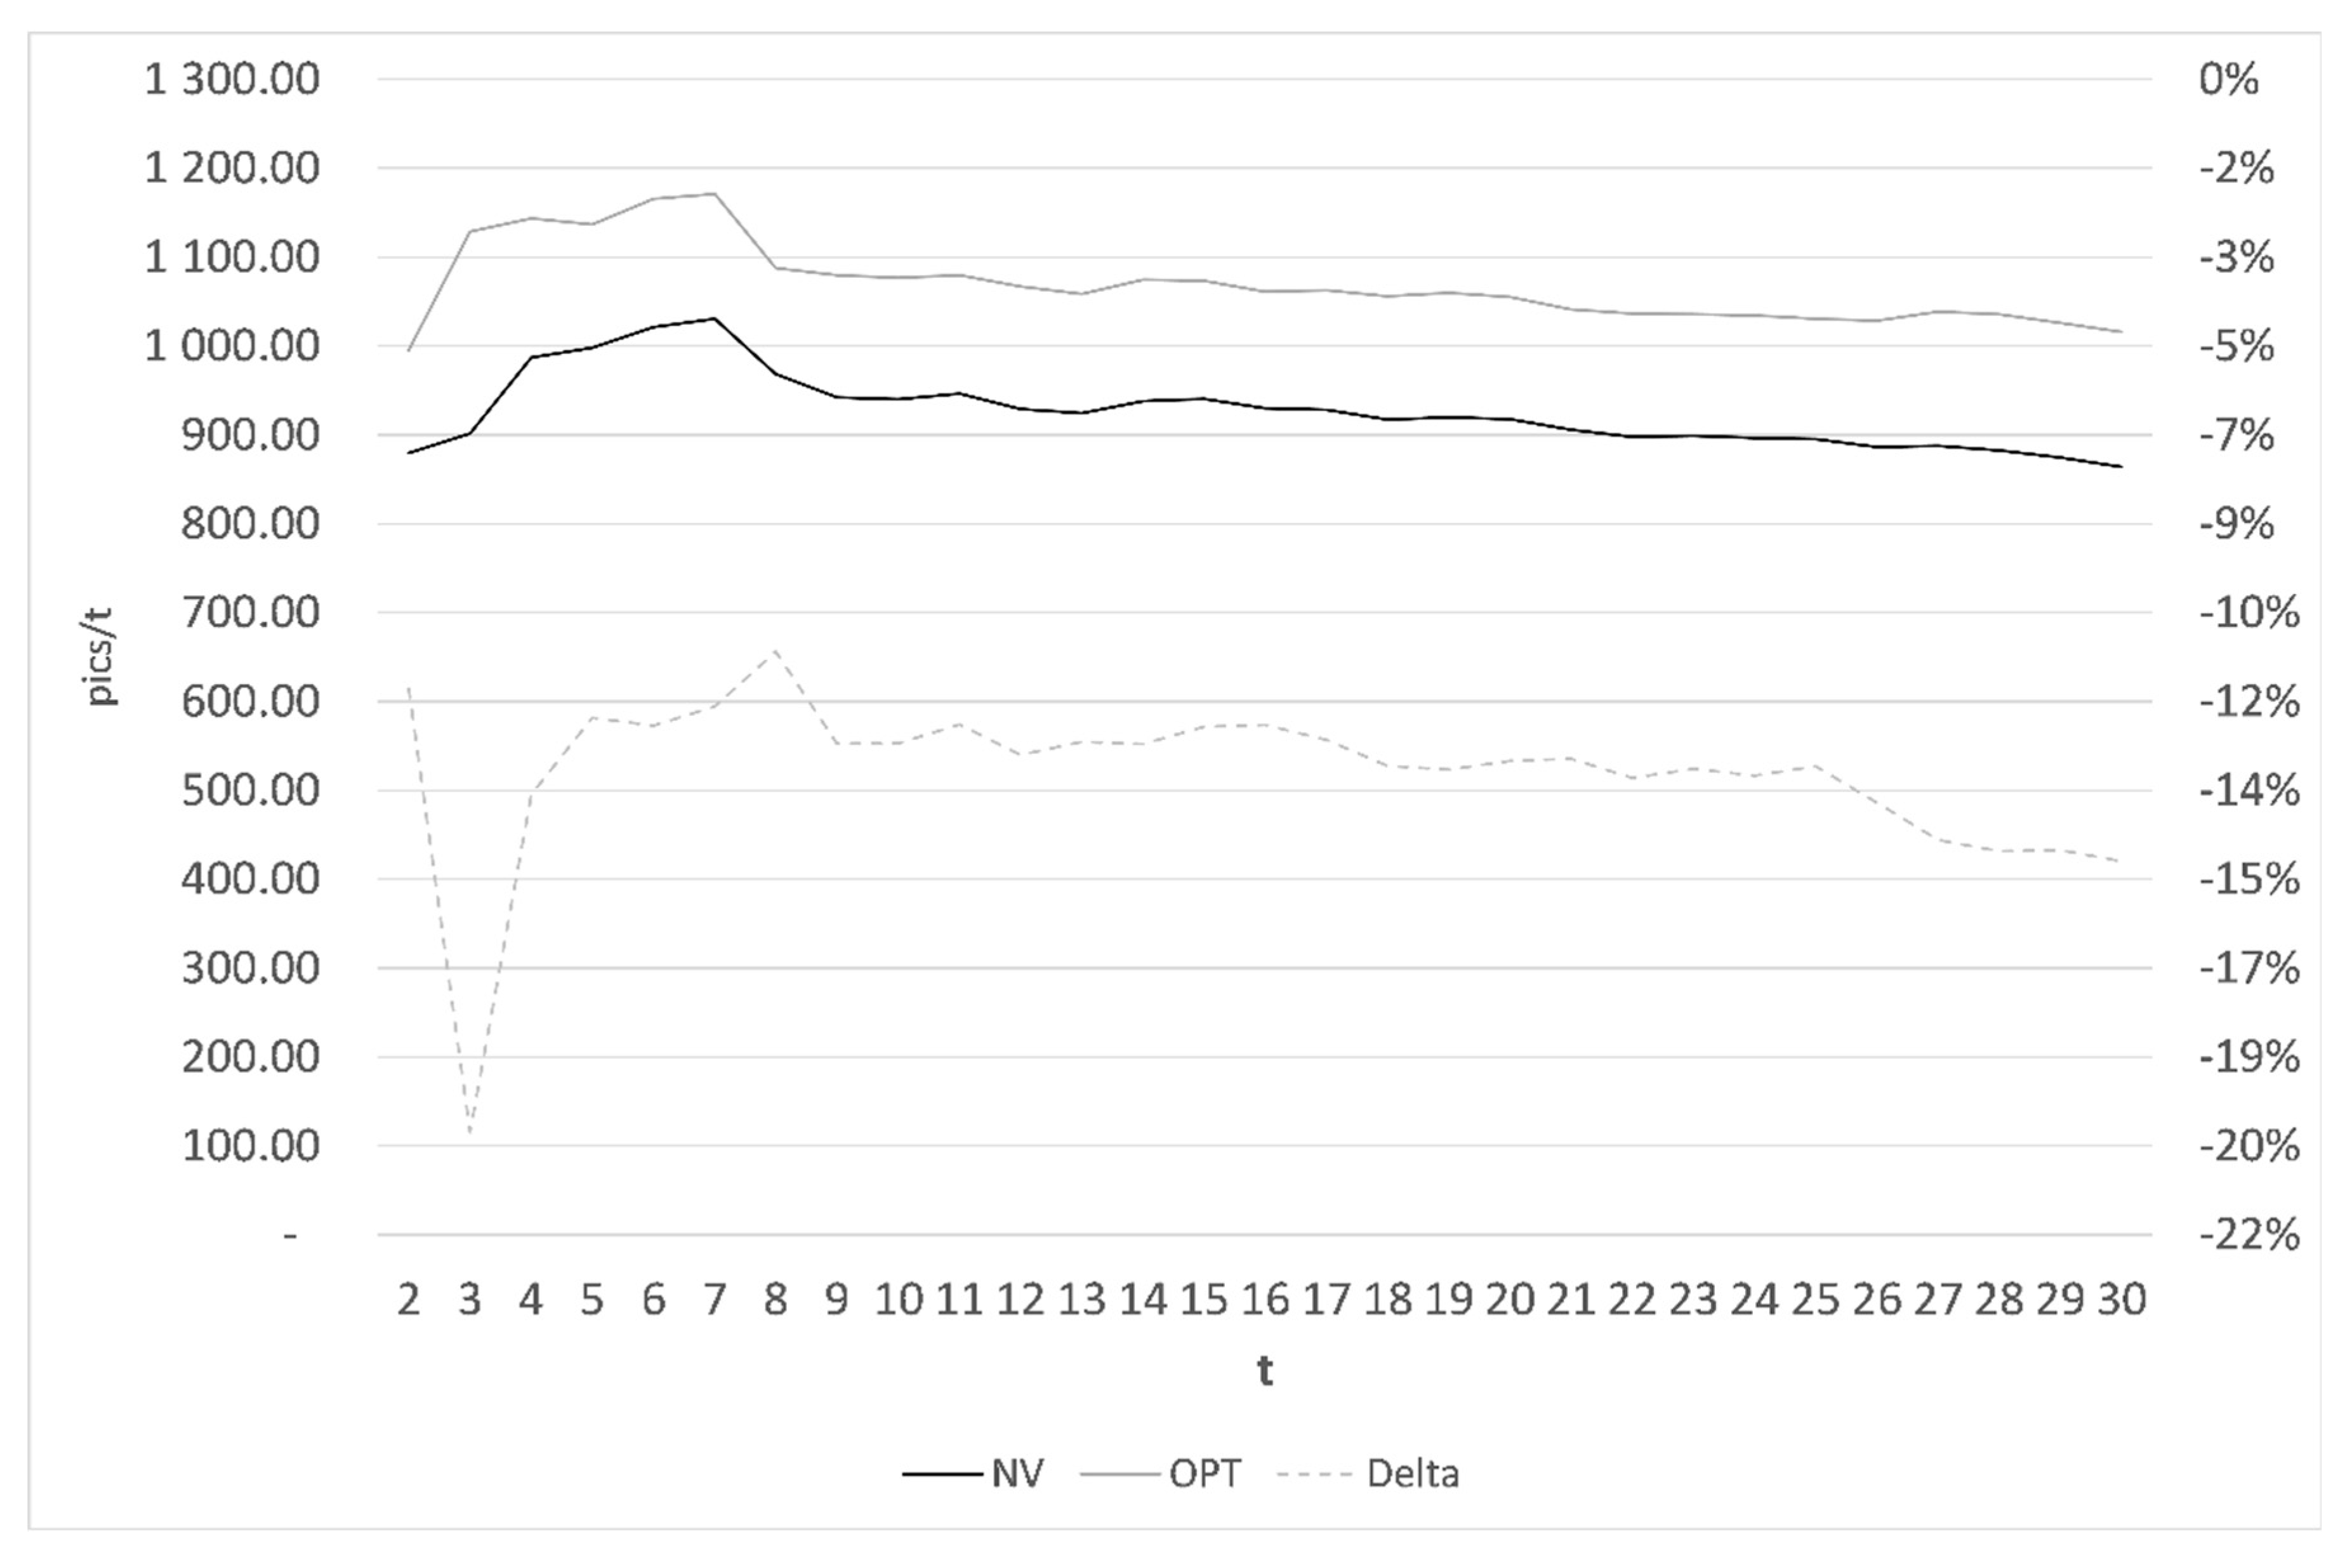
Figure 4 and
Figure 5 show the progressive mean profit obtained by decision makers of both tests. The decision makers of the duogame-G1 obtain an average profit lower than the optimal profit of about 4.5%; the others obtain a profit lower than the optimal one of about 15% for participants of duogame-G1 and duogame-G2.
5.2. Ex Post Individuals’ Interviews
Table 2 shows the outcome of the structured interviews provided to each participant of the game. The interview was conducted trying to find an answer to the following family of questions, which were asked in the same order: (a) Why did I not use the optimal amount of reorder? (b) Why did I change the quantity ordered during the game? (c) What strategy did I use?
The interviews revealed that decision makers do not order the optimal quantity because they have not understood its meaning or because it appears too high compared to the sampled demand values; on the other hand, and less frequently, the decision makers do not choose to order the optimal quantity because, given the incentive system that puts them in competition, they want to overcome the behavior of the optimal player. The continuous change in the ordered quantity is mostly explained by the high fluctuations in demand. Moreover, individuals declare very frequently (75.6% in the case G1 and 95.3% in the case G2) that they have not conceived the game horizon as infinite. The style of play is closely connected with the desire to predict the customer demand or to follow it or to bet on its change; they also declare to have played following their own intuition.
6. Discussion
The above-defined experiment points at verifying if the performance of newsvendors can improve if they are equipped with a decision support system and, accordingly, if the pull-to-center effect can consequently be reduced. Moreover, the idea is to verify whether the performance of newsvendors varies with the training of decision makers even in the presence of a more pressing incentive system that recognizes a reward only to the individuals who reach the highest profit at the end of the game.
Starting from the case study of Schweitzer and Cachon [
5], the experiment aims at verifying the existence of the pull-to-center effect despite the concomitant contribution of a more pressing incentive and more information such as those that newsvendors and consultants can tacitly exchange.
In particular, the duogame-G1 involves students whose training path is controlled over a period of one semester. In this setting, the incentive system places decision makers in competition with each other and provides the newsvendor with an anonymous human-type decision support system. Results show that a considerable share of decision makers (84.2%) began to order the optimal quantity or choose an obvious anchor (the expected demand); subsequently, they abandoned the algorithmic method and followed the heuristic one, reaching an average ordered quantity equal to about 185 pcs/period (which is even closer to the expected demand than the optimal reordering quantity) and an average period profit lower than the optimal one of about 5%.
The starting decision of the decision makers of the duogame-G1 and the subsequent change of strategy show that the pull-to-center effect cannot be explained by the contribution of some cognitive bias. In other words, the decision makers show to have a clear idea already at the beginning of the game. Evidently, the change of method from analytic to heuristic is caused by the assumption of some other judgement which arises during the game because the profit can meet dramatic changes (from big revenues to big loss). Moreover, we must also consider the pressure that the incentive system can induce to the players. This pushes decision makers to be risk-prone, aiming at overcoming the rational competitor (i.e., the one who assumes the nominal and known optimal behavior), and order while trying to predict the demand.
The ex post interviews, on the other hand, reveal that a not negligible share of decision makers considers the game scenario unrealistic (7.8% of the interviewees) and that the use of the optimal quantity is trivial; this demonstrates that the decision maker does not play as if he was in a real work scenario. Furthermore, the length of the test is always perceived as short-term (95% of the interviewees). In this case, this perception is created by the controlled human experiments, and this can influence the decision maker to avoid the idea to use always the same order quantity, as the analytic method requires. On the other hand, in the pilot work of [
5], it was assumed, among the possible explanations of the pull-to-center effect, the attempt to minimize past errors ex post.
The results of the experiments confirm the existence of the pull-to-center effect but outline a new and controversial framework in which decision makers operate: (i) individuals with greater competence start the game using the analytical methodology and only after do they change their management style; (ii) through a semi-structured interview, conducted by a student, it was verified that individuals with a surprising frequency declare that they do not consider the game scenario to be likely, that they perceive the game horizon as short, that the optimal amount of reordering is too high or do not understand its meaning. The overwhelming majority say that they ordered based on a demand forecast and some heuristic. The analysis of the starting order quantity and of the progressive mean order quantity demonstrates what notions the individuals have learned during the evolution of the game; the style change that has been observed requires other investigations on the dynamics of the system and how the players’ behavior is affected by the interpretation of the experiment, along with their cognitive limits.
The consistency with which the pull-to-center effect is verified, over the span of twenty years of research, also derives from the fact that multiple reasons still lead to its occurrence; in fact, it is caused both by the subjective assessment of the decision maker about the economic scenario (no matter if the player is skilled or not) and by the incentive system. In the first case, the decision maker leaves the optimal quantity and decides to change the order quantity, trying, in the short term, to obtain a better result than the rationale one, which can be achieved with the application of the optimal quantity (11.8% of the decision makers). In the second case, the lack of sufficient competence pushes the individual to choose the well-known anchor, namely the average quantity (16.9% of decision makers). In any case, the majority of individuals (76.5% of decision makers) do not play as though the game horizon is unlimited and prefer to order the forecasted demand value. In the latter case, the order quantity converges again towards the pull-to-center effect (e.g., the mean demand).
To summarize, whether (i) the decision maker chooses an anchor-based metric (demand chasing, gambler fallacy), (ii) relies on the demand forecast (also as a result of a refined reasoning and in an attempt to overcome the expected behavior of other competitors) or (iii) is incompetent and orders the mean demand, the result is that pull-to-center behavior is manifested.
Although the duogame-G1 involved students with a controlled educational path, it should also be noted that more than the 35% of the decision makers declared that they did not understand the concept of optimal quantity of reordering, or do not consider long-term effects. Over 78% of decision makers said that they used a heuristic based on forecasting demand. The decision makers involved in the duogame-G2 demonstrate less competence: they have a more pronounced pull-to-center effect and obtained an average profit lower than the optimum of about 15%. Their interviews reveal that more than the 40% did not understand the concept of an optimal quantity of reordering, over 38% still considered it too high compared to the sampled values of the demand and 95% of respondents said that they perceive the game application horizon as short-term if they are informed about the time horizon length.
Among our hypotheses, only the second is confirmed by the experimental evidence. On the other hand, controlled human experiments applied to the Newsvendor Problem appear to be a critical issue for three reasons: (i) decision makers’ competence is not enough with regard to the optimization process and the statistical data analysis, which pushes individuals to navigate on sight without taking into account their management tools; (ii) the incentive system pushes individuals to make short-term decisions; and (iii) the game is not seen as a real problem.
7. Conclusions
A new format of the Newsvendor Problem has been proposed: the duogame setting, where two groups of individuals face the game as either newsvendor or consultant, under a new kind of incentive that puts decision makers in a competitive scenario. The results of the controlled human experiment which involved 72 subjects were analyzed in order to measure the players’ performance according to common indicators, such as the mean order quantity and the mean overall profit.
The pull-to-center effect is confirmed by the experimental data, although it was possible to highlight that the individuals who are more skilled tend to be less prone to this behavior. Moreover, the starting order quantity and its frequency distribution were measured. This information suggests that individuals believe in an anchor, either the optimal order quantity or the mean demand, and do not move according to the pull-to-center bias from the start until after they played several steps of the game. Moreover, their decisions are not biased—they “pull to center” seeking a better game strategy.
Five hypotheses were defined so as to discuss how competence, incentive, information, role and perception of the game horizon length can influence the method that an individual follows: all these cannot be considered significant except for competence, which improves the subjects’ performance.
Finally, an ex post interview was administered to each participant, asking individuals to describe how they played. Results of the survey suggest that subjects are not sufficiently competent, do not perceive the difference between short and long-term horizon and, most of all, do not consider the game scenario as a real problem. These findings cast doubt on the methodology that is usually employed for the setting of the Newsvendor Problem. A critical review process of controlled human experiments should be conducted in order to verify if the learning by doing process is the root cause of the pull-to-center effect.


