1. Introduction
As a result of the rapid and wide spread of the pandemic caused by the SARS-CoV-2 (COVID-19) virus, economic activities around the world have been severely restricted. Capturing and predicting the stock price volatility is an important topic of research from both academic and practical viewpoints. The global economy experienced its first negative growth in 11 years and stock prices in many countries have recorded significant fluctuations. Restrictions on economic activity around the world have caused significant damage to the global GDP growth rate, which shrunk by −4.4% in 2020 [
1,
2]. The Dow Jones Industrial Average (DJIA) hit its then-record high on February 12, 2020, and the rate of decline in the DJIA continued as the infection spread, dropping to −7.79% on February 9, 2020 (Black Monday I), −9.99% on February 12, 2020 (Black Thursday), and −4.4% on February 16, 2020 (Black Thursday II). On February 12, 2020 (Black Thursday), and February 16, 2020 (Black Monday II), the stock market fell to −12.93%.
Since then, stock markets around the world have continued to experience high volatility. The background to this change is also related to the significant changes in lifestyles and restrictions on dining and travel due to COVID-19 [
3]. In particular, the state of emergency declarations and accompanying lockdowns issued by governments include the closure of schools and educational institutions, restaurants, and commercial facilities, the banning of or request to refrain from assembly activities in concert halls and enclosed spaces, and the request for telecommuting. Stock price fluctuations may have been significantly impacted by these discontinuous changes.
These economic restrictions are expected to have a significant impact on inter-firm relationships, which refers to the trading network among firms, as stock price fluctuations by industry vary greatly. It is known that the business relationship is not only based on economic activities between a supplier and a customer, but is also mutually influenced by changes in the business environment, which are to be reflected in stock prices [
4,
5,
6,
7,
8]. In particular, Cohen et al. [
4] report a method that focuses on inter-firm relationships for the U.S. market.
This methodology predicts the stock price fluctuations of trading firms based on those of either the supplier or the customer in the inter-firm trading network. Specifically, stock price prediction based on business relationships between suppliers and customers exploits the time lag between stock price changes in one company and the other. This time lag is caused by the limitation of the information processing capacity of investors. This methodology has been applied and reported not only in a case of the US but also the Japanese market [
9,
10,
11,
12].
Using a cross-momentum strategy based on Cohen et al.’s [
4] methodology, Isogai et al. [
5] proved the usefulness of predicting suppliers’ stock prices based on customers’ stock price fluctuations in the Japanese market. Okada et al. [
6] reported the predictability of stock prices in the U.S. market on a daily basis and predicted the returns of daily long and short trades of a group of companies with trading relationships with the predicted companies. We report significant stock price predictability for both supplier-to-customer and customer-to-supplier inter-firm relationships.
Among the G7 countries, Japan is an exception in terms of dealing with COVID-19 infections. Compared to other countries, human migration is taking place in Japan, the number of deaths from COVID-19 is at the lowest level in advanced regions, and the stock market is expected to remain uncertain as the 2021 Olympic Games are scheduled, while the prospects for the end of the pandemic are unknown. In a situation such as the pandemic, the volatility of the market is high, and large fluctuations in stock prices can occur in a short period of time. In the face of major changes in the social and economic environment, it is extremely important for corporate management and investment activities to understand the scope and extent of the impact and to respond appropriately and promptly. However, it is not clear whether the previously reported stock price fluctuations are effective even in such a special environment, especially for forecasting methods that are affected by the social environment, such as those based on inter-firm relationships. This study clarifies the difference in predictable returns of stock prices based on corporate relationships during normal and the COVID-19 pandemic periods.
To address these issues, the objective of the present study is to analyze the impact of supplier–customer relationships on stock prices in the case of the Japanese stock market. We hypothesized that the extreme environmental changes caused by the COVID-19 pandemic might produce different results to those reported under normal conditions. To address this, we tested the applicability and reproducibility of the present method in the case of our interest, then examined differences in the predictability of stock price returns between normal and the COVID-19 pandemic periods.
The present paper consists as follows. Materials and Methods describes details of the dataset used and analytical methodology; Results provides the analytics of stock price predictability under a normal and the COVID-19 periods; finally, Discussions identifies factors that have had a particular influence on stock price changes and examines the mechanisms involved.
2. Materials and Methods
2.1. Research Approach
We adopted a retrospective and observational approach in which inter-firm relationships were obtained from annual securities reports. Such relationships were defined as supplier firms whose transactions accounted for 10% or more of the sales of the corresponding firm. Supplier firms were defined as those that issued the securities reports and customer firms as those that were listed in the reports. Company information is described in the item “Sales performance by major customer and the ratio to total sales performance” in the annual securities report. Companies with a sales ratio of 10% or more are required to be listed in accordance with the listing requirements.
To analyze the mutual impact of stock price fluctuations on the relationship between supplier and customer firms, we implemented the following steps: (1) collection of annual securities reports, (2) collection of stock price data, (3) detection of stock price fluctuation events, and finally, (4) statistical analysis. Python was used for data processing, including acquisition of annual securities reports and closing price data and detection of stock price fluctuation events. In addition, R software was used for statistical analysis.
2.2. Collection of Annual Securities Reports
The relationship between the supplier and customer group was automatically extracted by scraping for all stocks (3663 companies) issued as annual securities reports in 2019. We implemented the scraping program for automatic extraction for the “Production, Order, and Sales Status” section of the reports. The data were extracted from the Electronic Disclosure for Investors’ NETwork (EDINET) provided by the Financial Services Agency (FSA), which is a language designed for electronic documentation of business reports such as financial statements. The data were obtained in eXtensible Business Reporting Language (XBRL).
2.3. Collection of Stock Price Data
The extracted group of companies was used as the data for stock price event detection, covering five years of stock price data (daily closing prices) from 1st June 2015 to 31st May 2020. The COVID-19 period was defined as the period from February 1, 2020, when stock prices in the Japanese market began to downturn, to May 31, 2020, when the Nikkei 225 was returning to near the level before the COVID-19 period. The exclusion criteria for the analysis events were events of companies listed outside the First and Second Sections of the Tokyo Stock Exchange (TSE). In addition, events for which the stock price could not be extracted due to the non-listing of the client company on the event extraction date in the training data were also set as criteria.
2.4. Detection of Stock Price Fluctuation Events
For the detection of stock price volatility events associated with stock price fluctuations, we defined a set of teacher stocks U
t in Formula (1). We referred to the event-driven validation of Okada et al. [
6], who reported the predictability of stock prices on a daily basis, because stock price volatility is high under an economic crisis such as the one caused by the COVID-19 pandemic. The teacher companies were defined as the correlation between the
d-day excess return series of the company and the
d-dimensional vector u = (0, 0, ..., 1 or −1), where only the
d-th component is set to 1 for stock price upturns and −1 for stock price downturns, while the others are set to 0. The fluctuation vector of the excess return series for the past
d days up to the closing price of a stock, day
t, is denoted by r
ta,d = (r
ta−d+1, r
ta−d+2, …, r
ta). The difference between the excess return of r
ta at day
t and the average excess return at day
t-
d + 1 is denoted by the difference between the average excess return at day
t of r
ta. The average excess return at day
t-d + 1 was taken as the sudden rise or fall of stock
a. We define
d = 9 (from the definition of excess returns, we use two weeks of data in business days),
p = 0.08, and the impact range as δ
L = 0.05 and δ
U = 0.1, where
Nt is the number of companies listed on the TSE. We set the excess return to less than 0.1 to exclude the stocks of companies on the verge of bankruptcy that have excessively large values.
When a stock price up/downturn is detected, we construct a portfolio that buys or sells short the shares of a set of companies with which the company has a business relationship. We analyze the returns of the time-series portfolio for each holding period (from 1 to 30 days) using the Fama–French (FF) three-factor model [
13].
2.5. Statistical Analysis
Based on the above assumptions, we calculate the significance and α of the FF three-factor model [
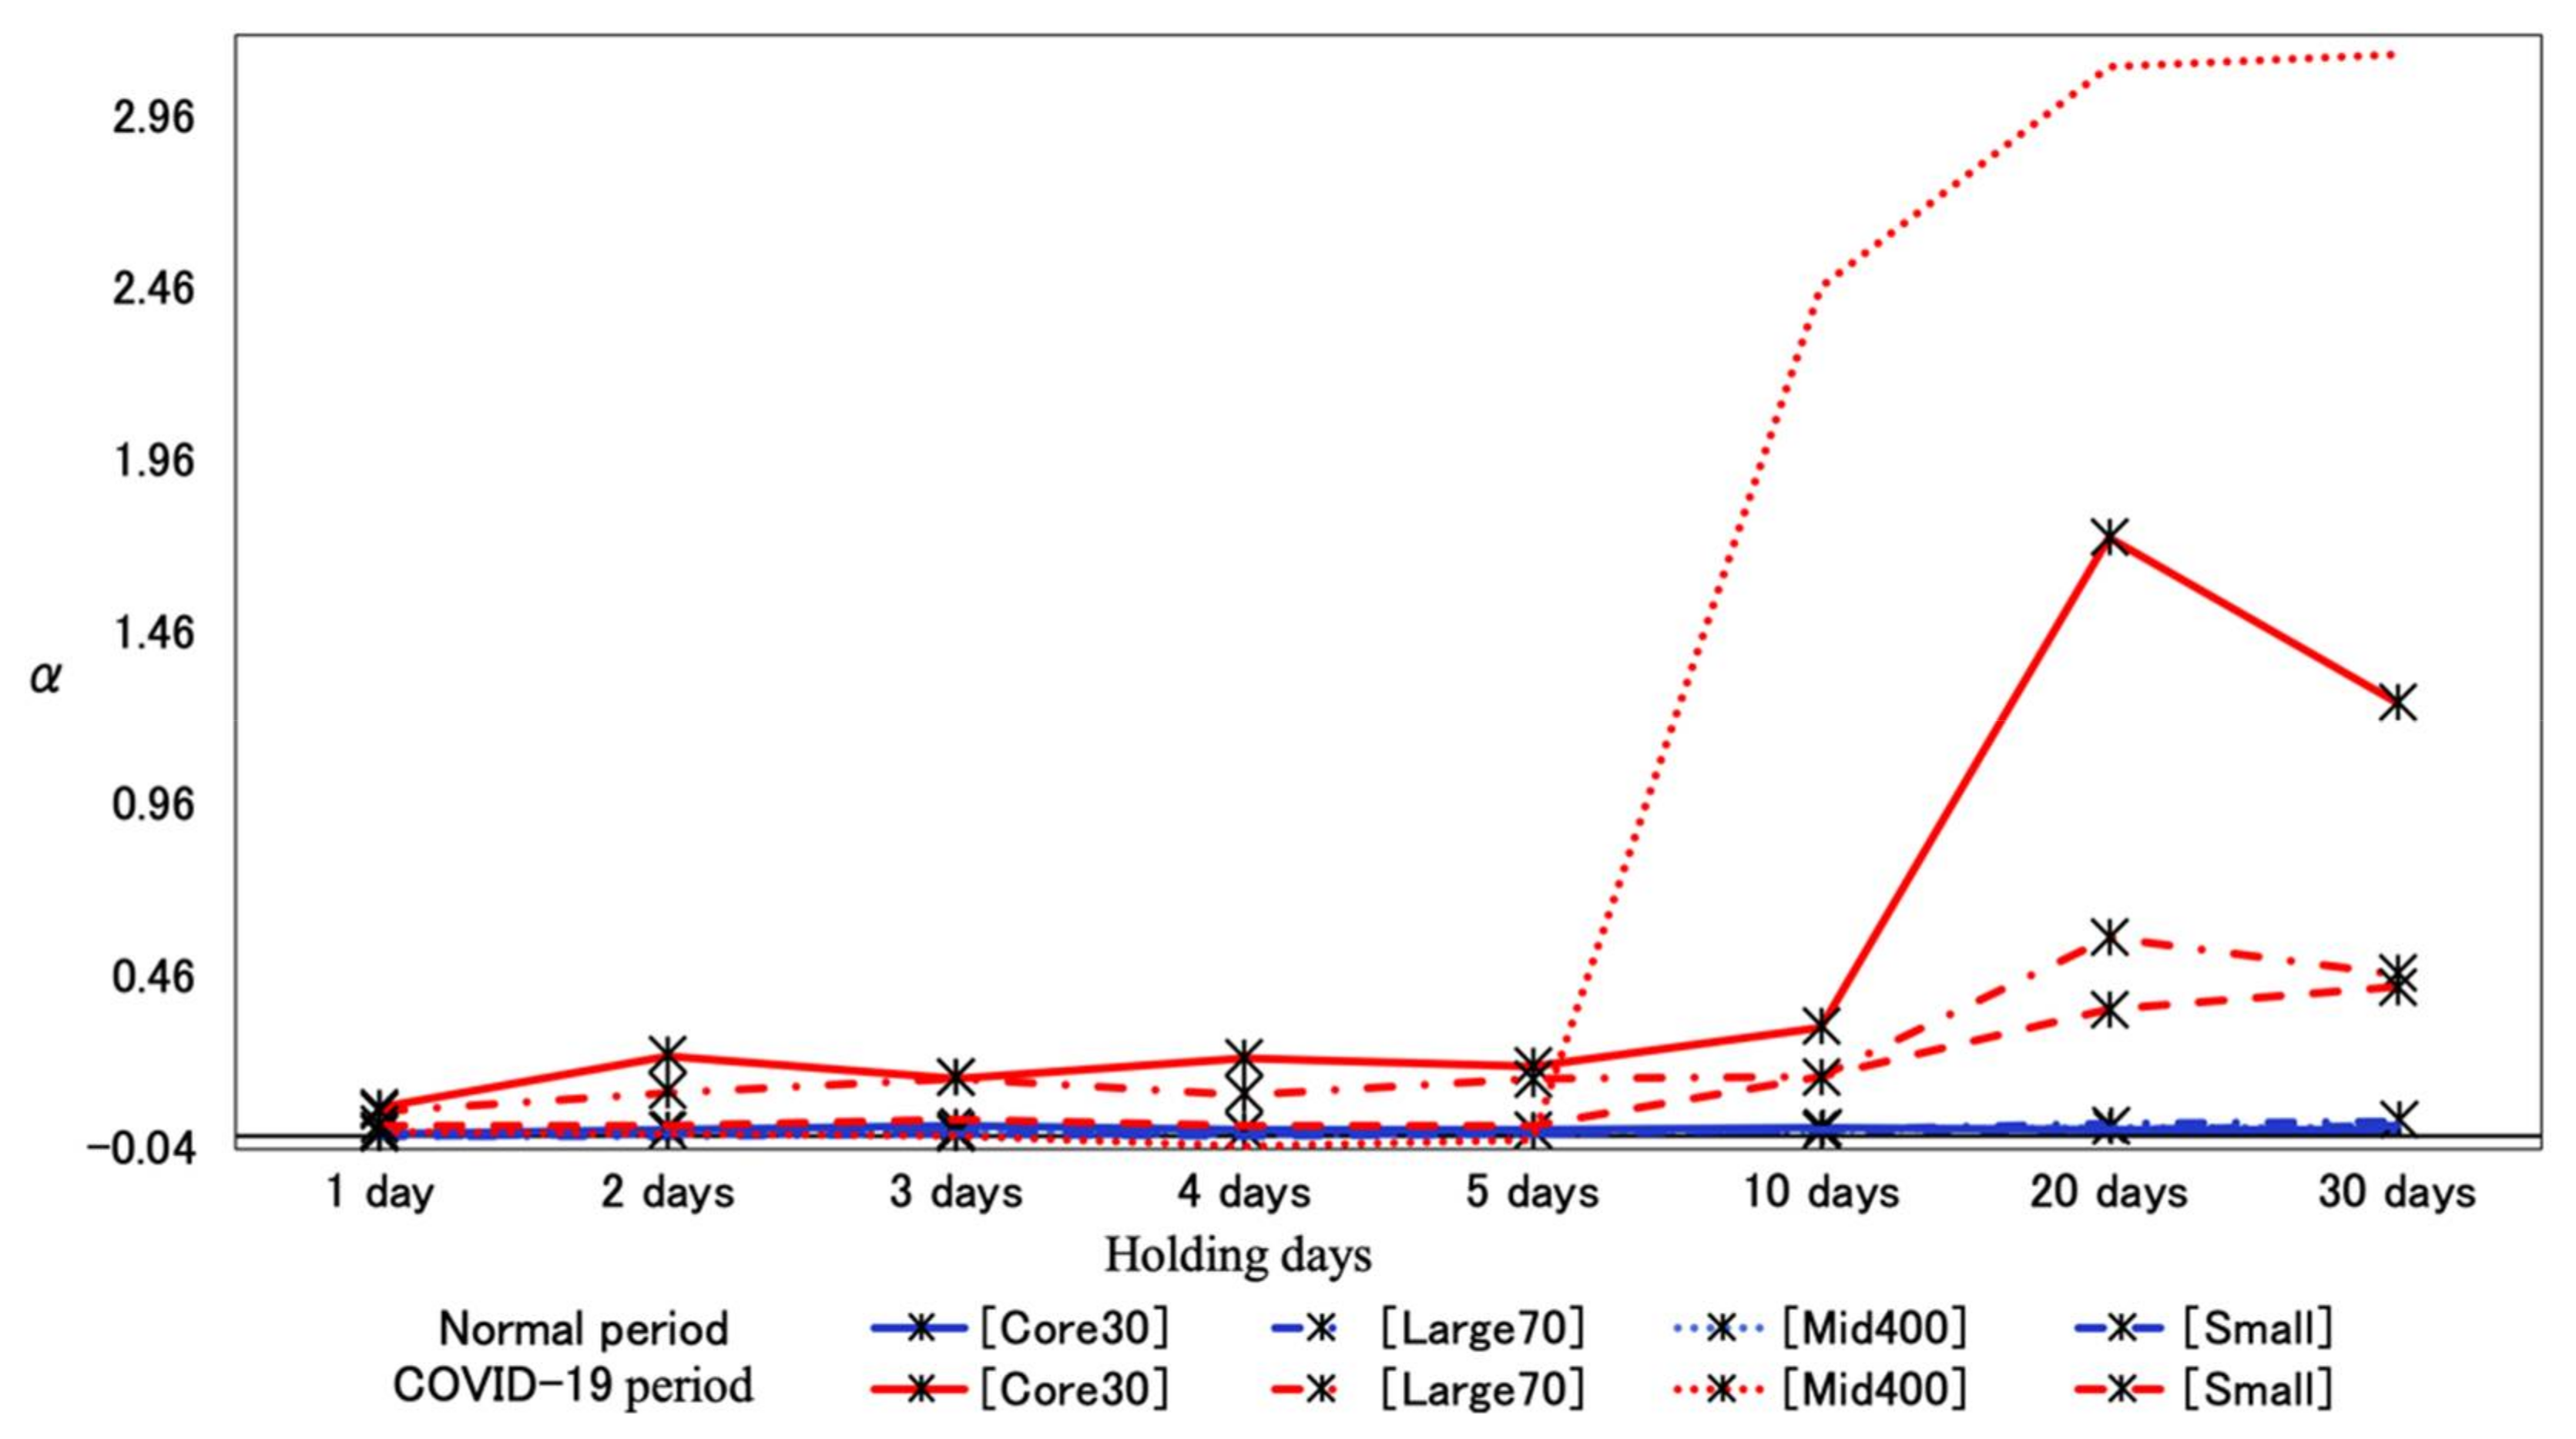
13] based on the collected data and examine the impact of stock price fluctuations among trading firms through its interpretation. Period-by-period analysis comparing α for each number of days of stock ownership was conducted for stock price up/downturns during the normal and the COVID-19 pandemic periods. In addition, we conducted a size-specific analysis using the TSE size-specific indices for the stock price downturns that showed higher α than the stock price upturns in the period-specific analysis. In addition, a comparison of the market capitalization of supplier and customer companies was analyzed using the Wilcoxon rank sum test. The level of statistical significance was set at
p < 0.05.
4. Discussion
Regarding the predictability of stock prices on a daily basis, the results revealed an identical tendency to those of a previous study in the U.S. context [
6]. In particular, the effectiveness of stock price prediction was proven for both supplier-customer and customer-supplier inter-firm relationships. On the other hand, there is a difference in the observed time period (5 days in [
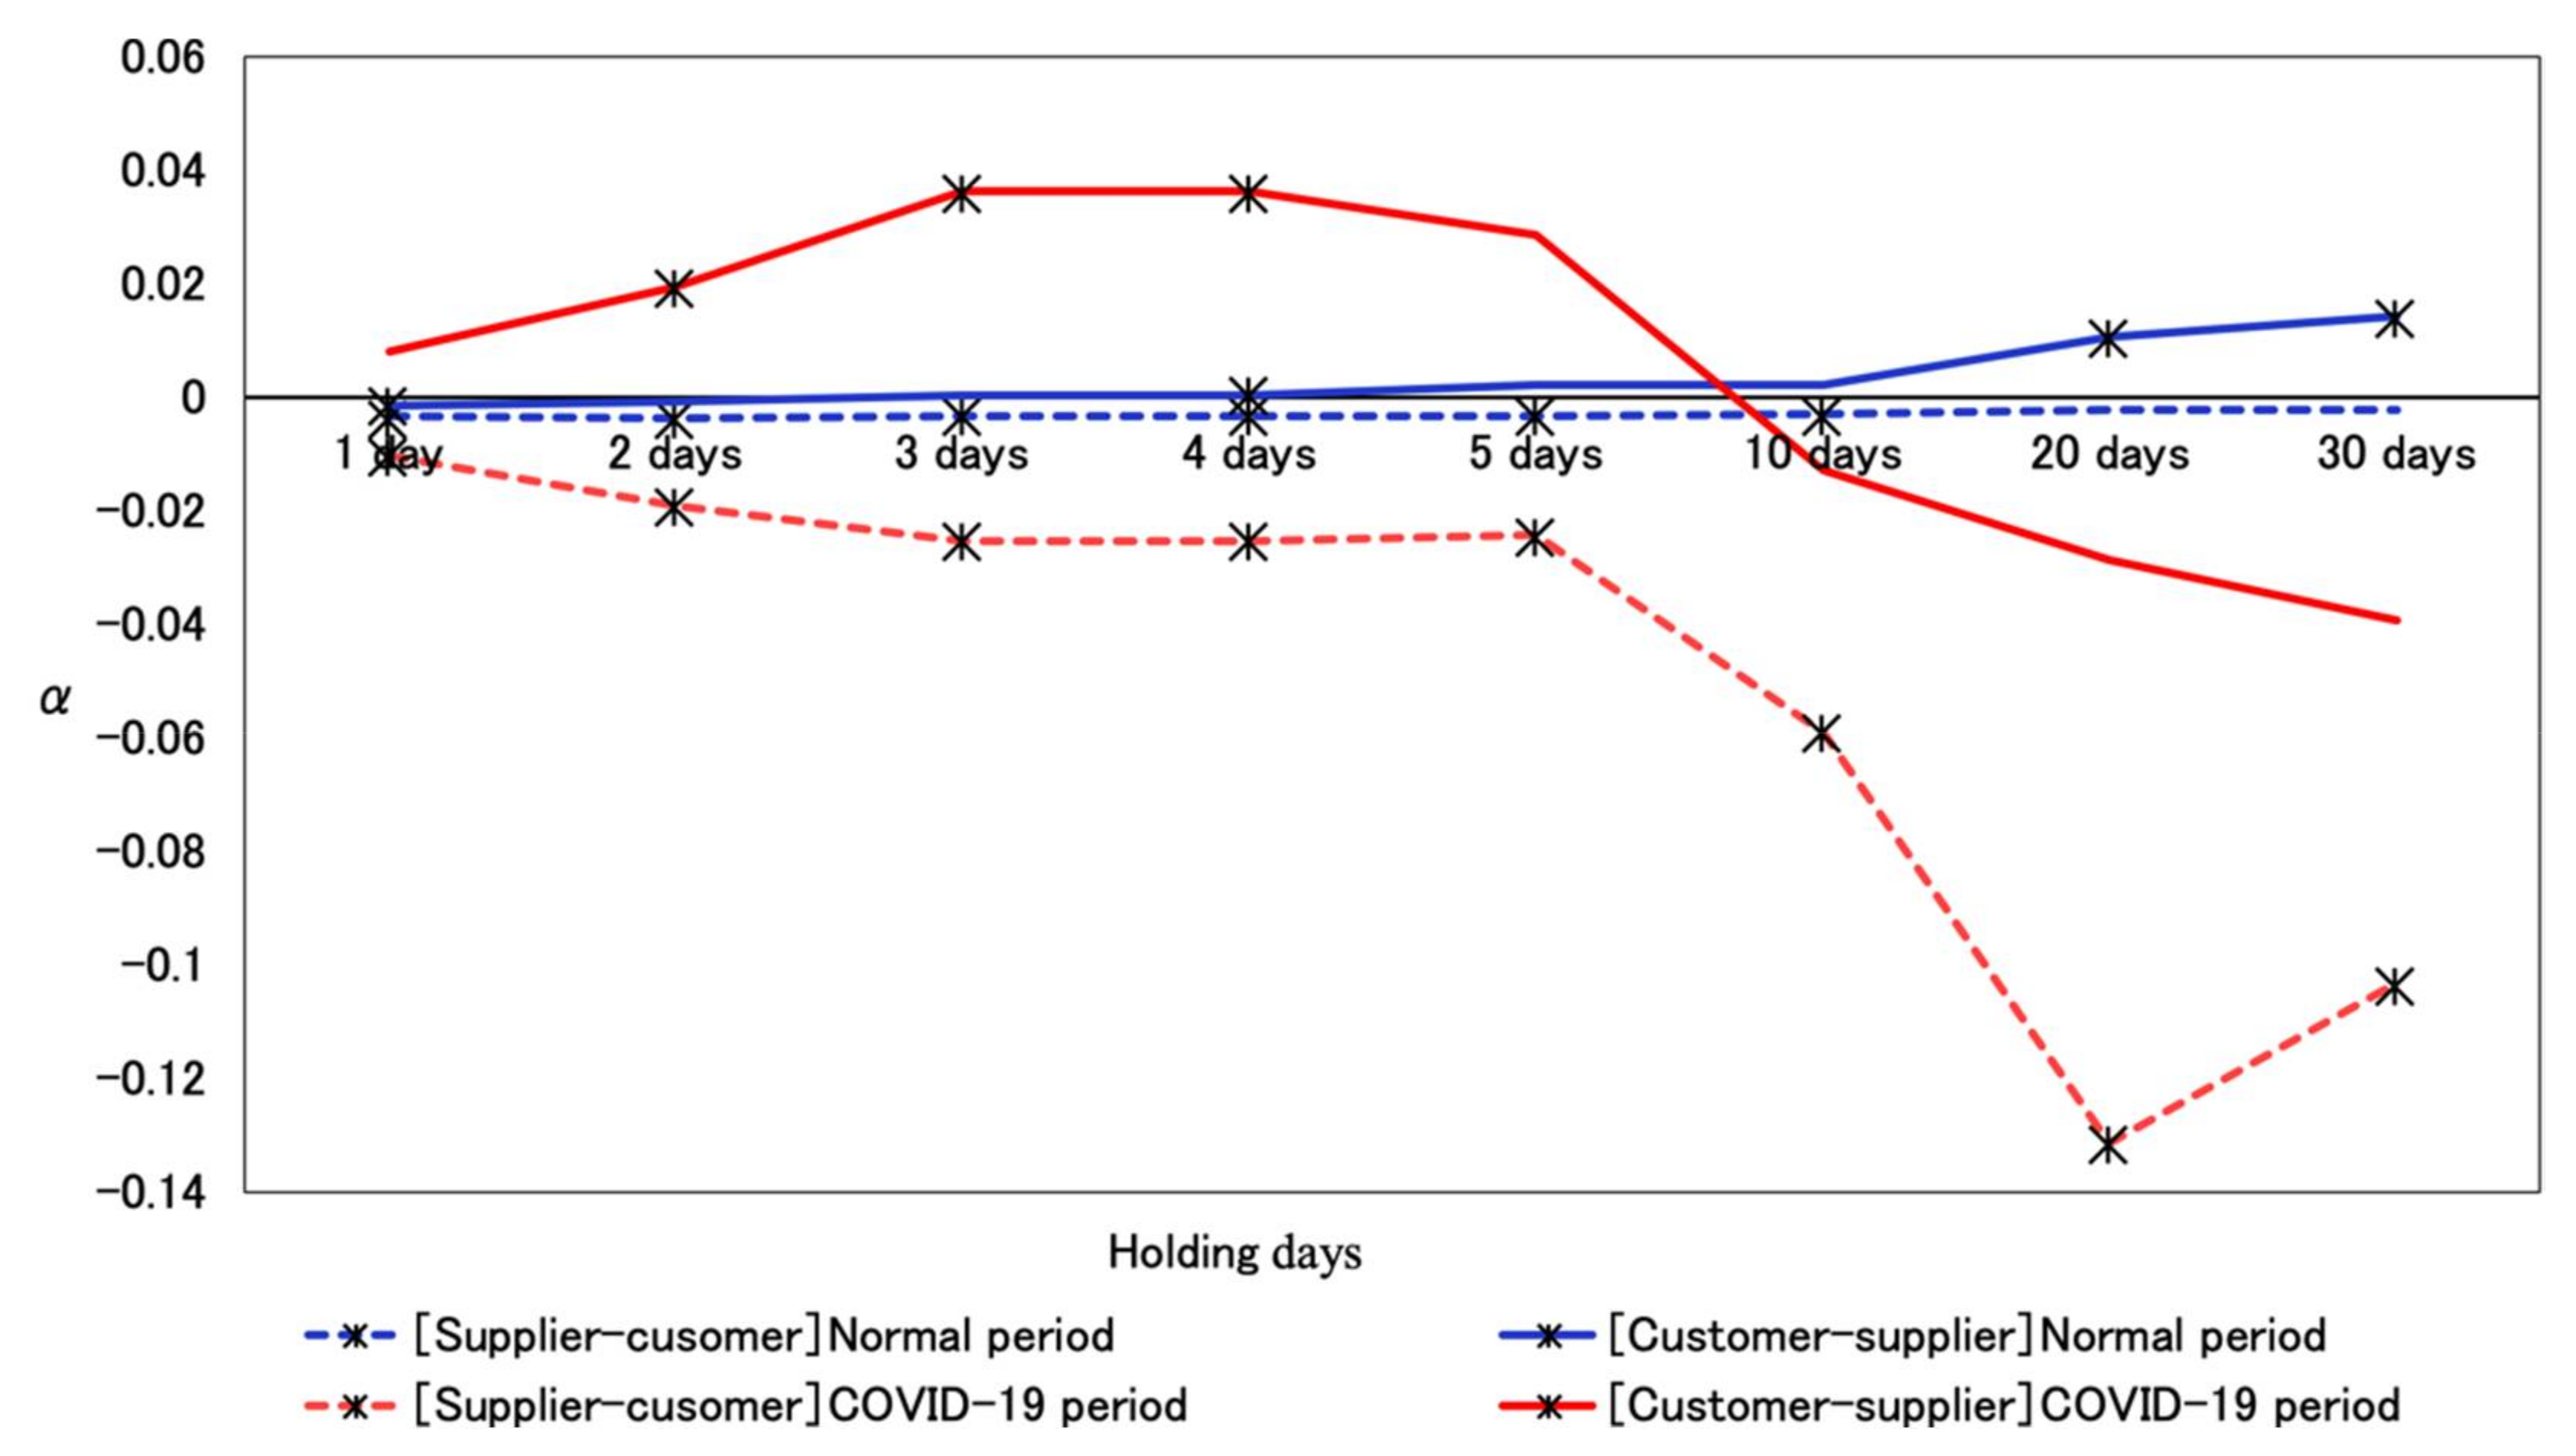
6] whereas up to 30 days herein). As the number of days increased, significantly positive the predictability of stock price returns were observed only in the case of customer-supplier relationship in the normal period (
Table 2 and
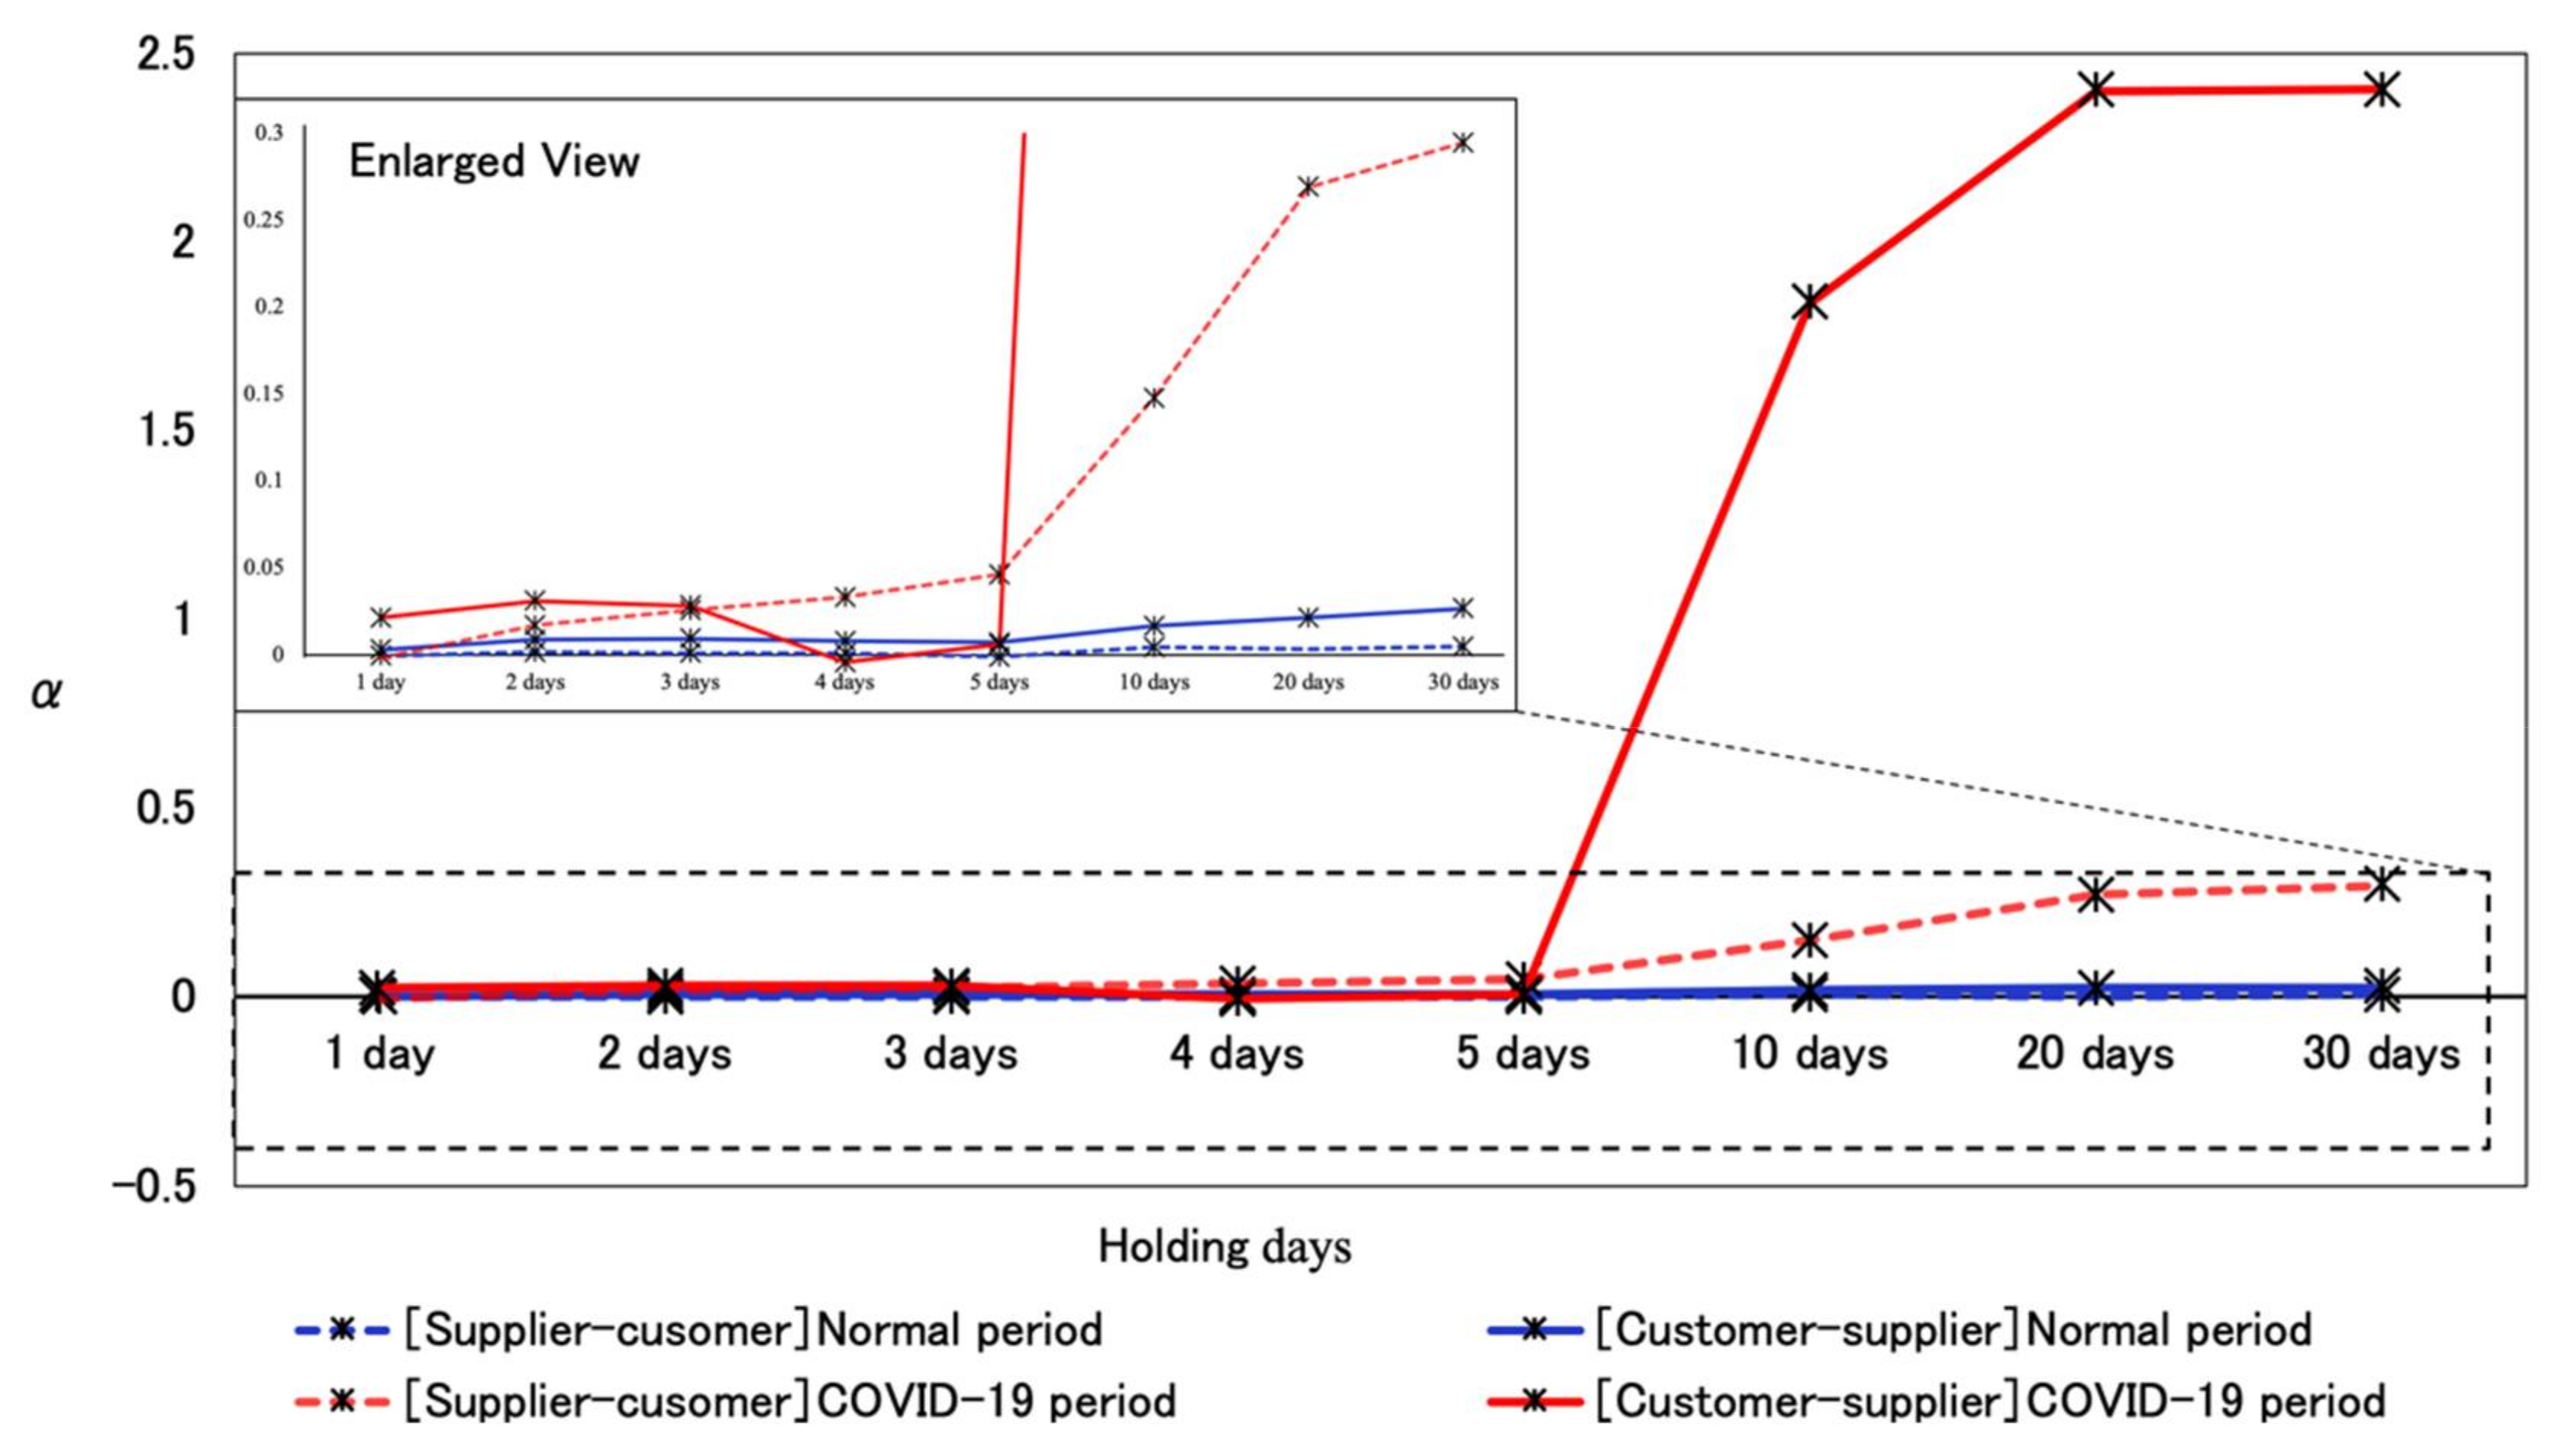
Figure 1). In contrast, in the cases of stock price downturn, all the analytical results demonstrated significant predictability (
Table 3 and
Figure 2). Previous studies [
4,
5,
6] explained that the time lag that induces stock price changes caused by the suppliers–customer relationship is caused by the investor’s bounded rationality. Our interpretation of the results of this study is identical: as the trend during the COVID-19 pandemic period has clearly shown, these results have pointed out that the psychological situation of investors is a significant factor with the stock price volatility, which advocates the importance of quantifying possible future risks according to the attributes and size of the company.
One explanation of the differences observed in between the two studies, namely on a daily or monthly basis, is the diffusion of information regarding these events, particularly in the supplier-customer relationships. If stocks are held for a longer period of time, the holder will be able to obtain more information about the factors causing changes in the stock price attributable to the company concerned. If such linkages in price movements are then considered not necessarily long-lasting, the linkage system observed in the short term will tend to dissolve. This interpretation is particularly attributed to supplier-customer relationships where the average size of the supplier companies are relatively smaller (p <0.001). that is, the influence on the counterpart’s stock price is likely to be smaller.
On the other hand, if the customer company is the source of the event, since it likely has a large impact on the supplier company due to its relatively large size, the predictability of stock prices remained even when held on a monthly basis [
4,
5]. This tendency is partly reproducible in the present study, where the changes in stock prices observed at supplier companies associated with their customer’s events (
Table 3 and
Figure 2) were longer than those at the customer companies associated with their suppliers’ events (
Table 2 and
Figure 1). These interpretations depend on the size and influence of the company from which the event originates. However, it is also necessary to consider the external environment of information dissemination.
Notably, the COVID-19 pandemic period case showed more potent and significant results in the stock price predictability, especially for downturn cases. One possible reason is a significant impact on market sentiment. The phenomenon of tandem fluctuation of stock prices is due to the transmission of relevant information through the stock market and investors under bounded rationality [
4,
5,
6]. The market sentiment associated with losses is more influential than profits, especially in downward events [
15].
The movement of stock prices in the Japanese stock market from the annual high in January 2020 to the annual low in March of the same year due to the spread of COVID-19 amounted to about JPY 3500 in 41 business days. However, it took more than three times as many business days to make up for this decline. In particular, pessimistic bias tends to spread during financial crises and severe recessions. Consequently, the long-term trend forecast of net income per share, which incorporates the decline in revenue during such recessions, is pushed down in the short term, indicating an extreme negative correlation between volatile markets and stock returns [
3]. This background may have led to the formation of a negative market with high volatility and a marked difference in the variation of α-values between up and downturn events.
Finally, this study has the following limitations and implications. First, while we dealt with a limited timeframe of the COVID-19 pandemic, the effects of different pandemic phases should be investigated as well as extension to other market cases. Second, stock price downturn during the COVID-19 pandemic and events for customer companies and those with a large corporate scale are effective for stock price predictability. This may lead to the discovery of new indicators that increase the effectiveness of stock price predictability in inter-firm relationships. To develop robust indicators for such predictability, verification through multiple regression analysis that examines multiple factors, including external ones [
16,
17], needs to be considered. In particular, as Harvery et al. reported that the number of the factors related with stock price predictability was around 240 [
17]. In an extreme condition such as the COVID-19 pandemic, there is a possibility that unknown factors may play a role in the background, and there is much room for exploration of these factors and refinement of the model.
5. Conclusions
This study investigated the predictability of stock price fluctuations in Japanese stock markets based on inter-firm relationships and compared tendencies between normal times and the COVID-19 pandemic period. The results revealed that stock price predictability is effective on a daily and monthly basis in the Japanese market, and that stock price prediction is effective in both normal and the COVID-19 pandemic periods. In addition, stock price downturn, events originated at the customer company side, and the size of companies, may have a greater impact on the market and contribute to improved stock price predictability. Furthermore, such predictability was improved in the COVID-19 pandemic period. This result, which is different from the stock price predictability under normal period, proves the hypothesis. These results highlight the effectiveness of stock price prediction based on inter-firm relationships, especially in an unordinary context such as the COVID-19 pandemic, in quantifying possible future risks based on firm attributes and size. This provides a theoretical background to systematizing processes for pricing and design of financial products and services.


