
Old Wine in New Bottles: Exploiting Data from the EU’s Farm Accountancy Data Network for Pan-EU Sustainability Assessments of Agricultural Production Systems

 , , , ,
  and
and 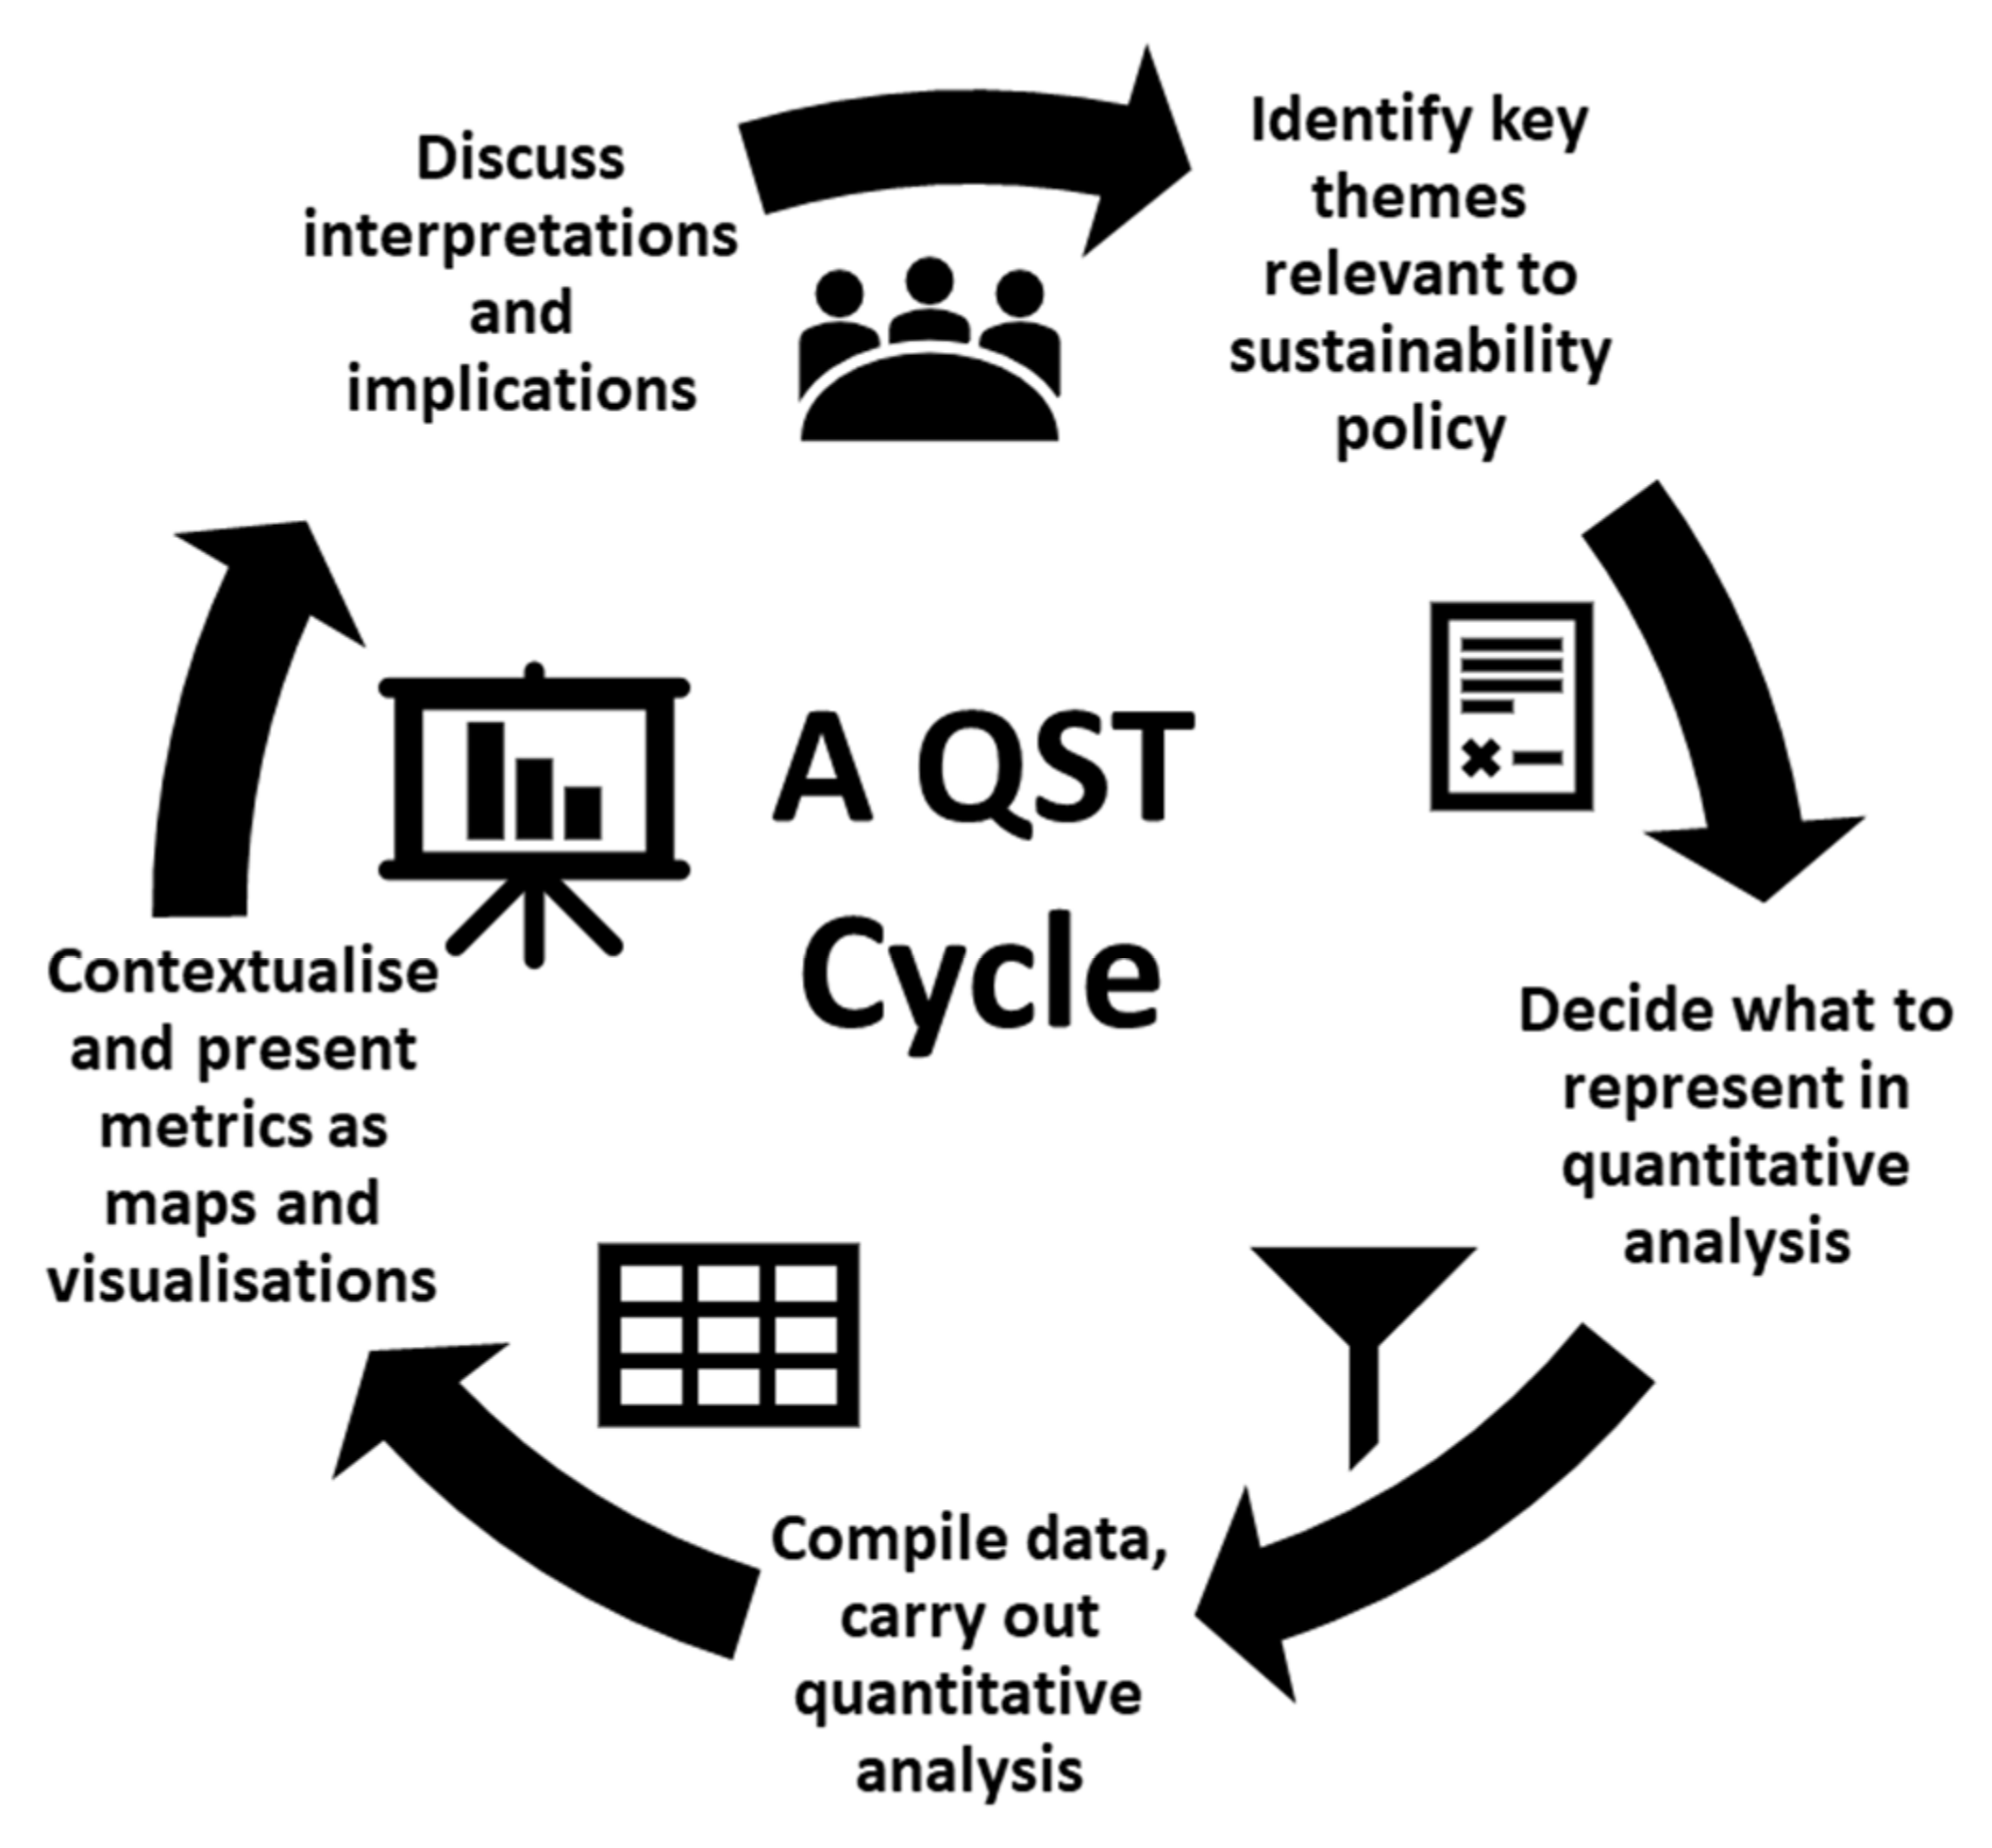
Abstract
:1. Introduction
1.1. Project Background
1.2. Policy Background
1.3. Science Background
1.4. Previous Studies of FADN as a Basis for Sustainability Assessment
2. Methods and Data
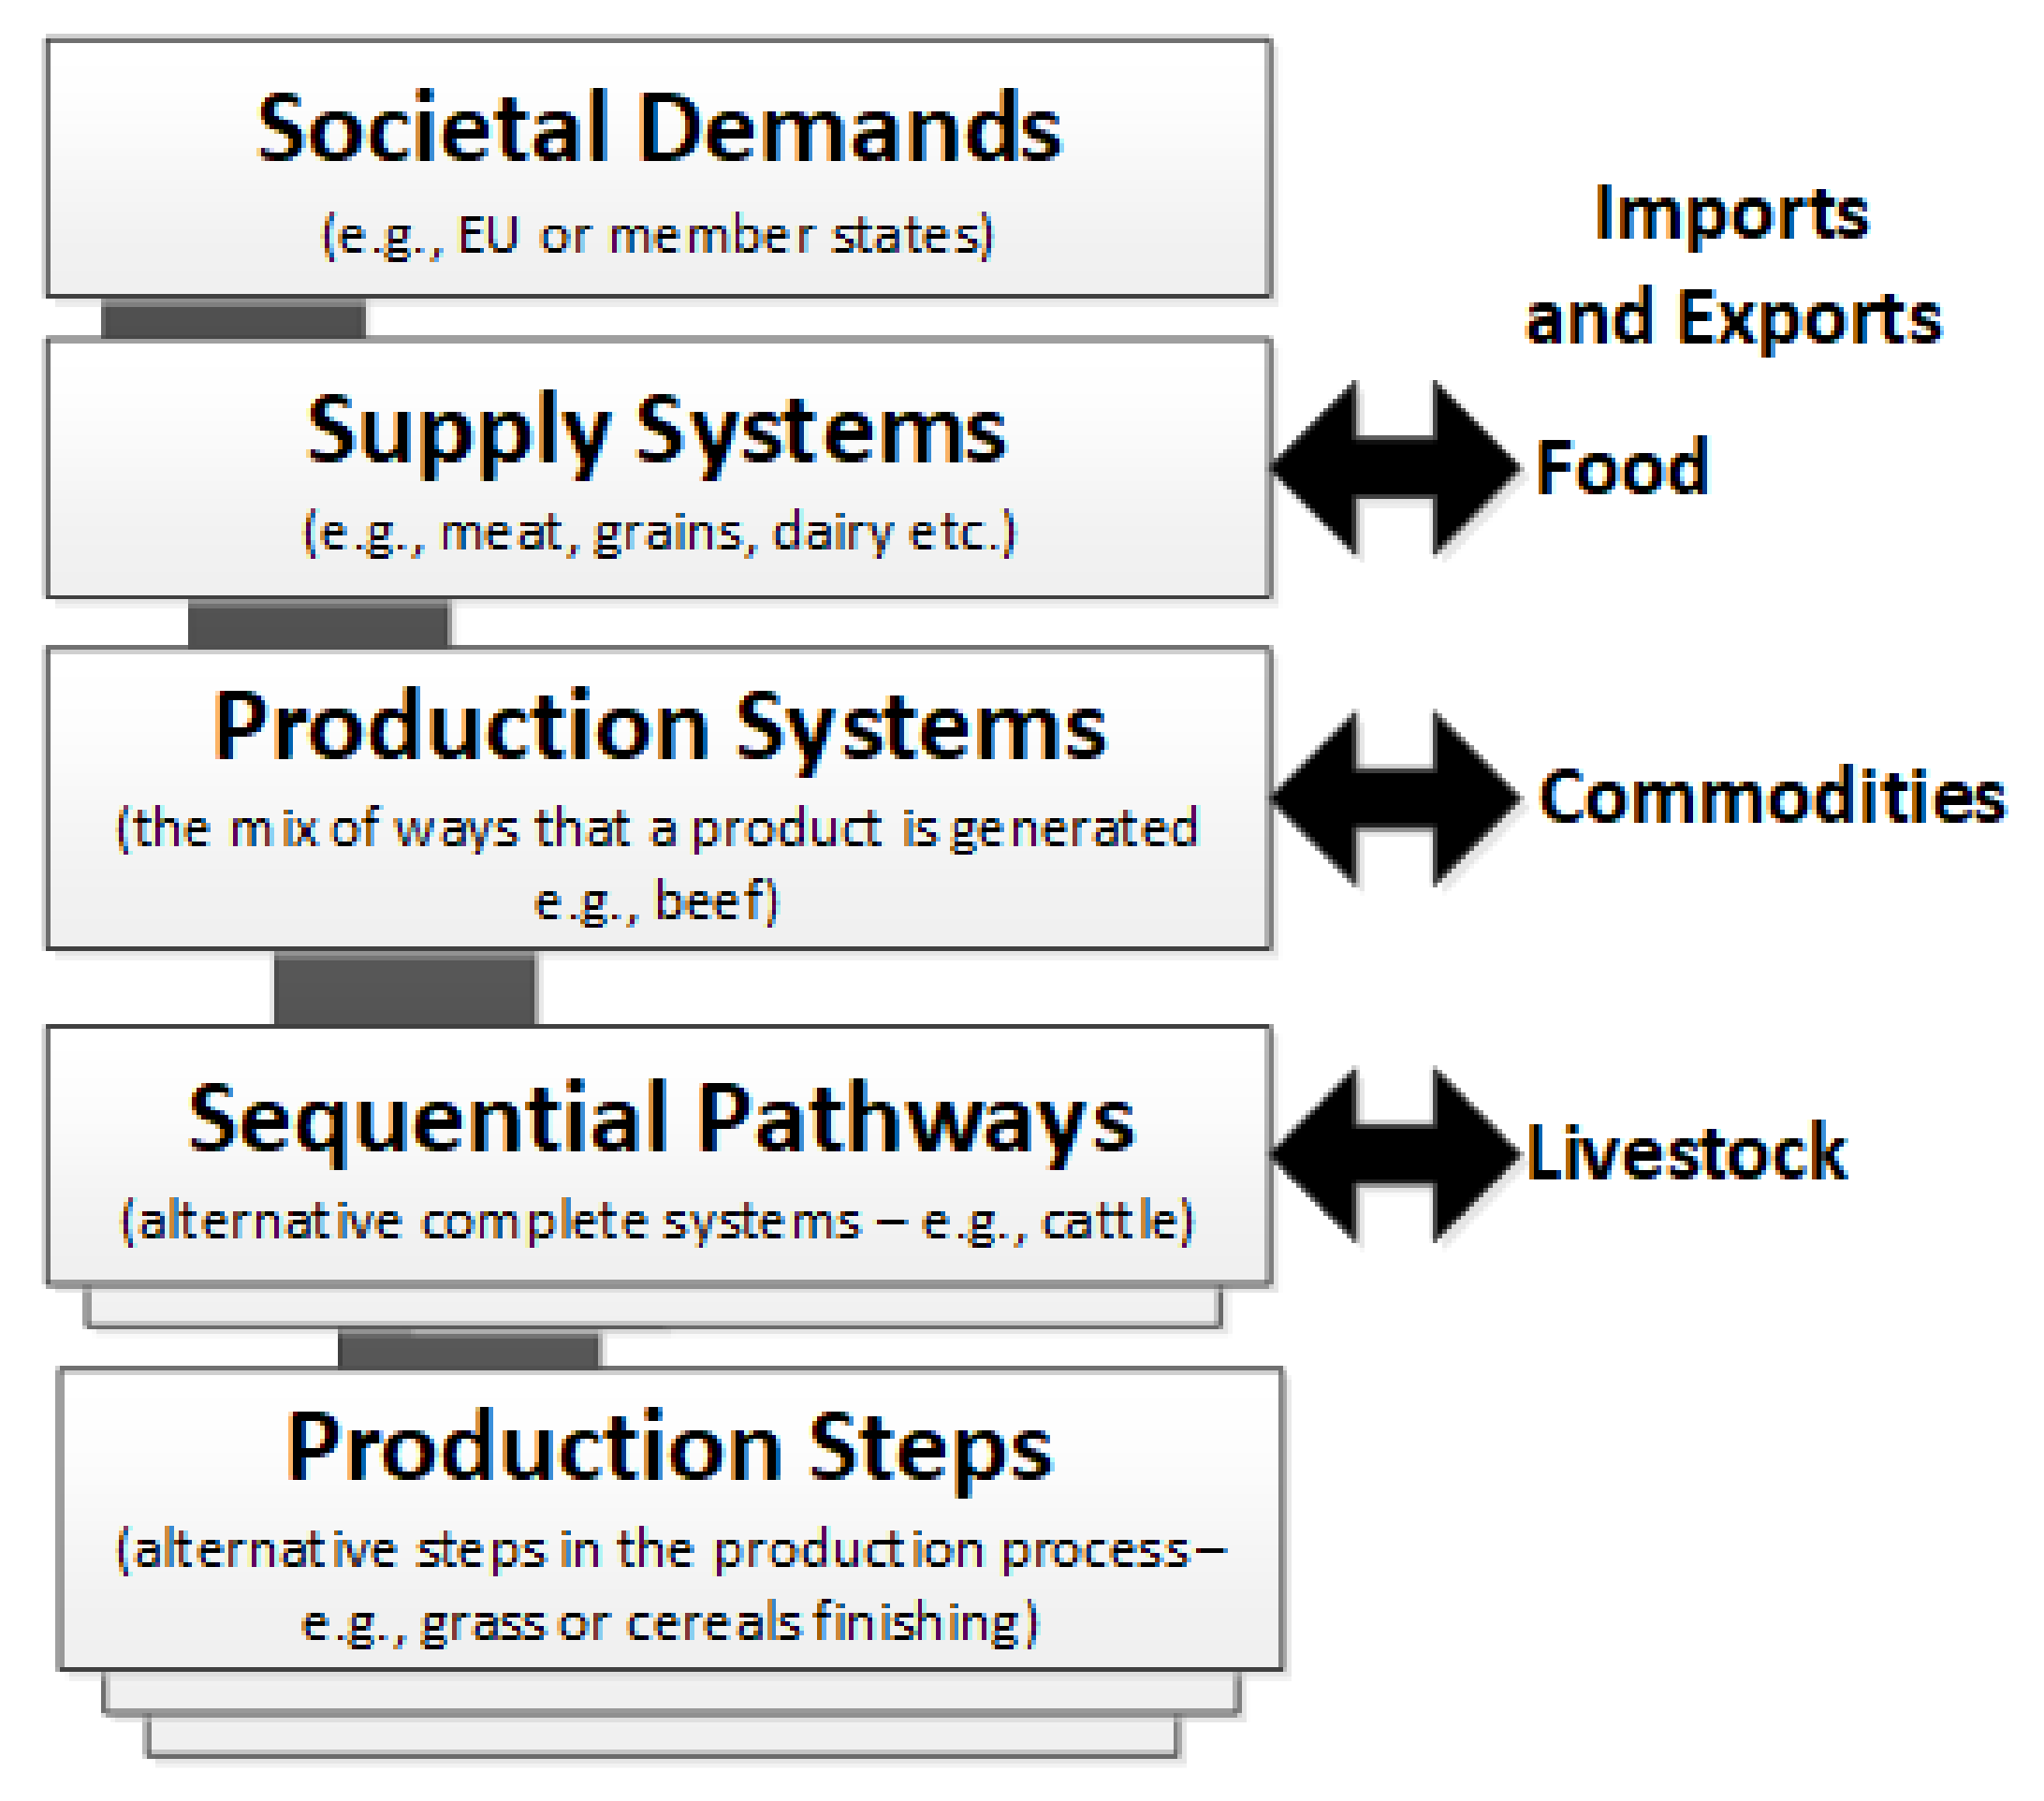
2.1. Formal Societal Metabolism Analysis
2.2. Semantic Analysis and Transdisciplinary Processes
3. Results
3.1. CAP Funding and Farm Incomes
3.2. Competitiveness
3.3. Resource Use and Pressures
3.3.1. Extents—Use of Funds
3.3.2. Intensity—Pressures—Crop Based Systems
3.3.3. Intensity—Pressures—Livestock Systems
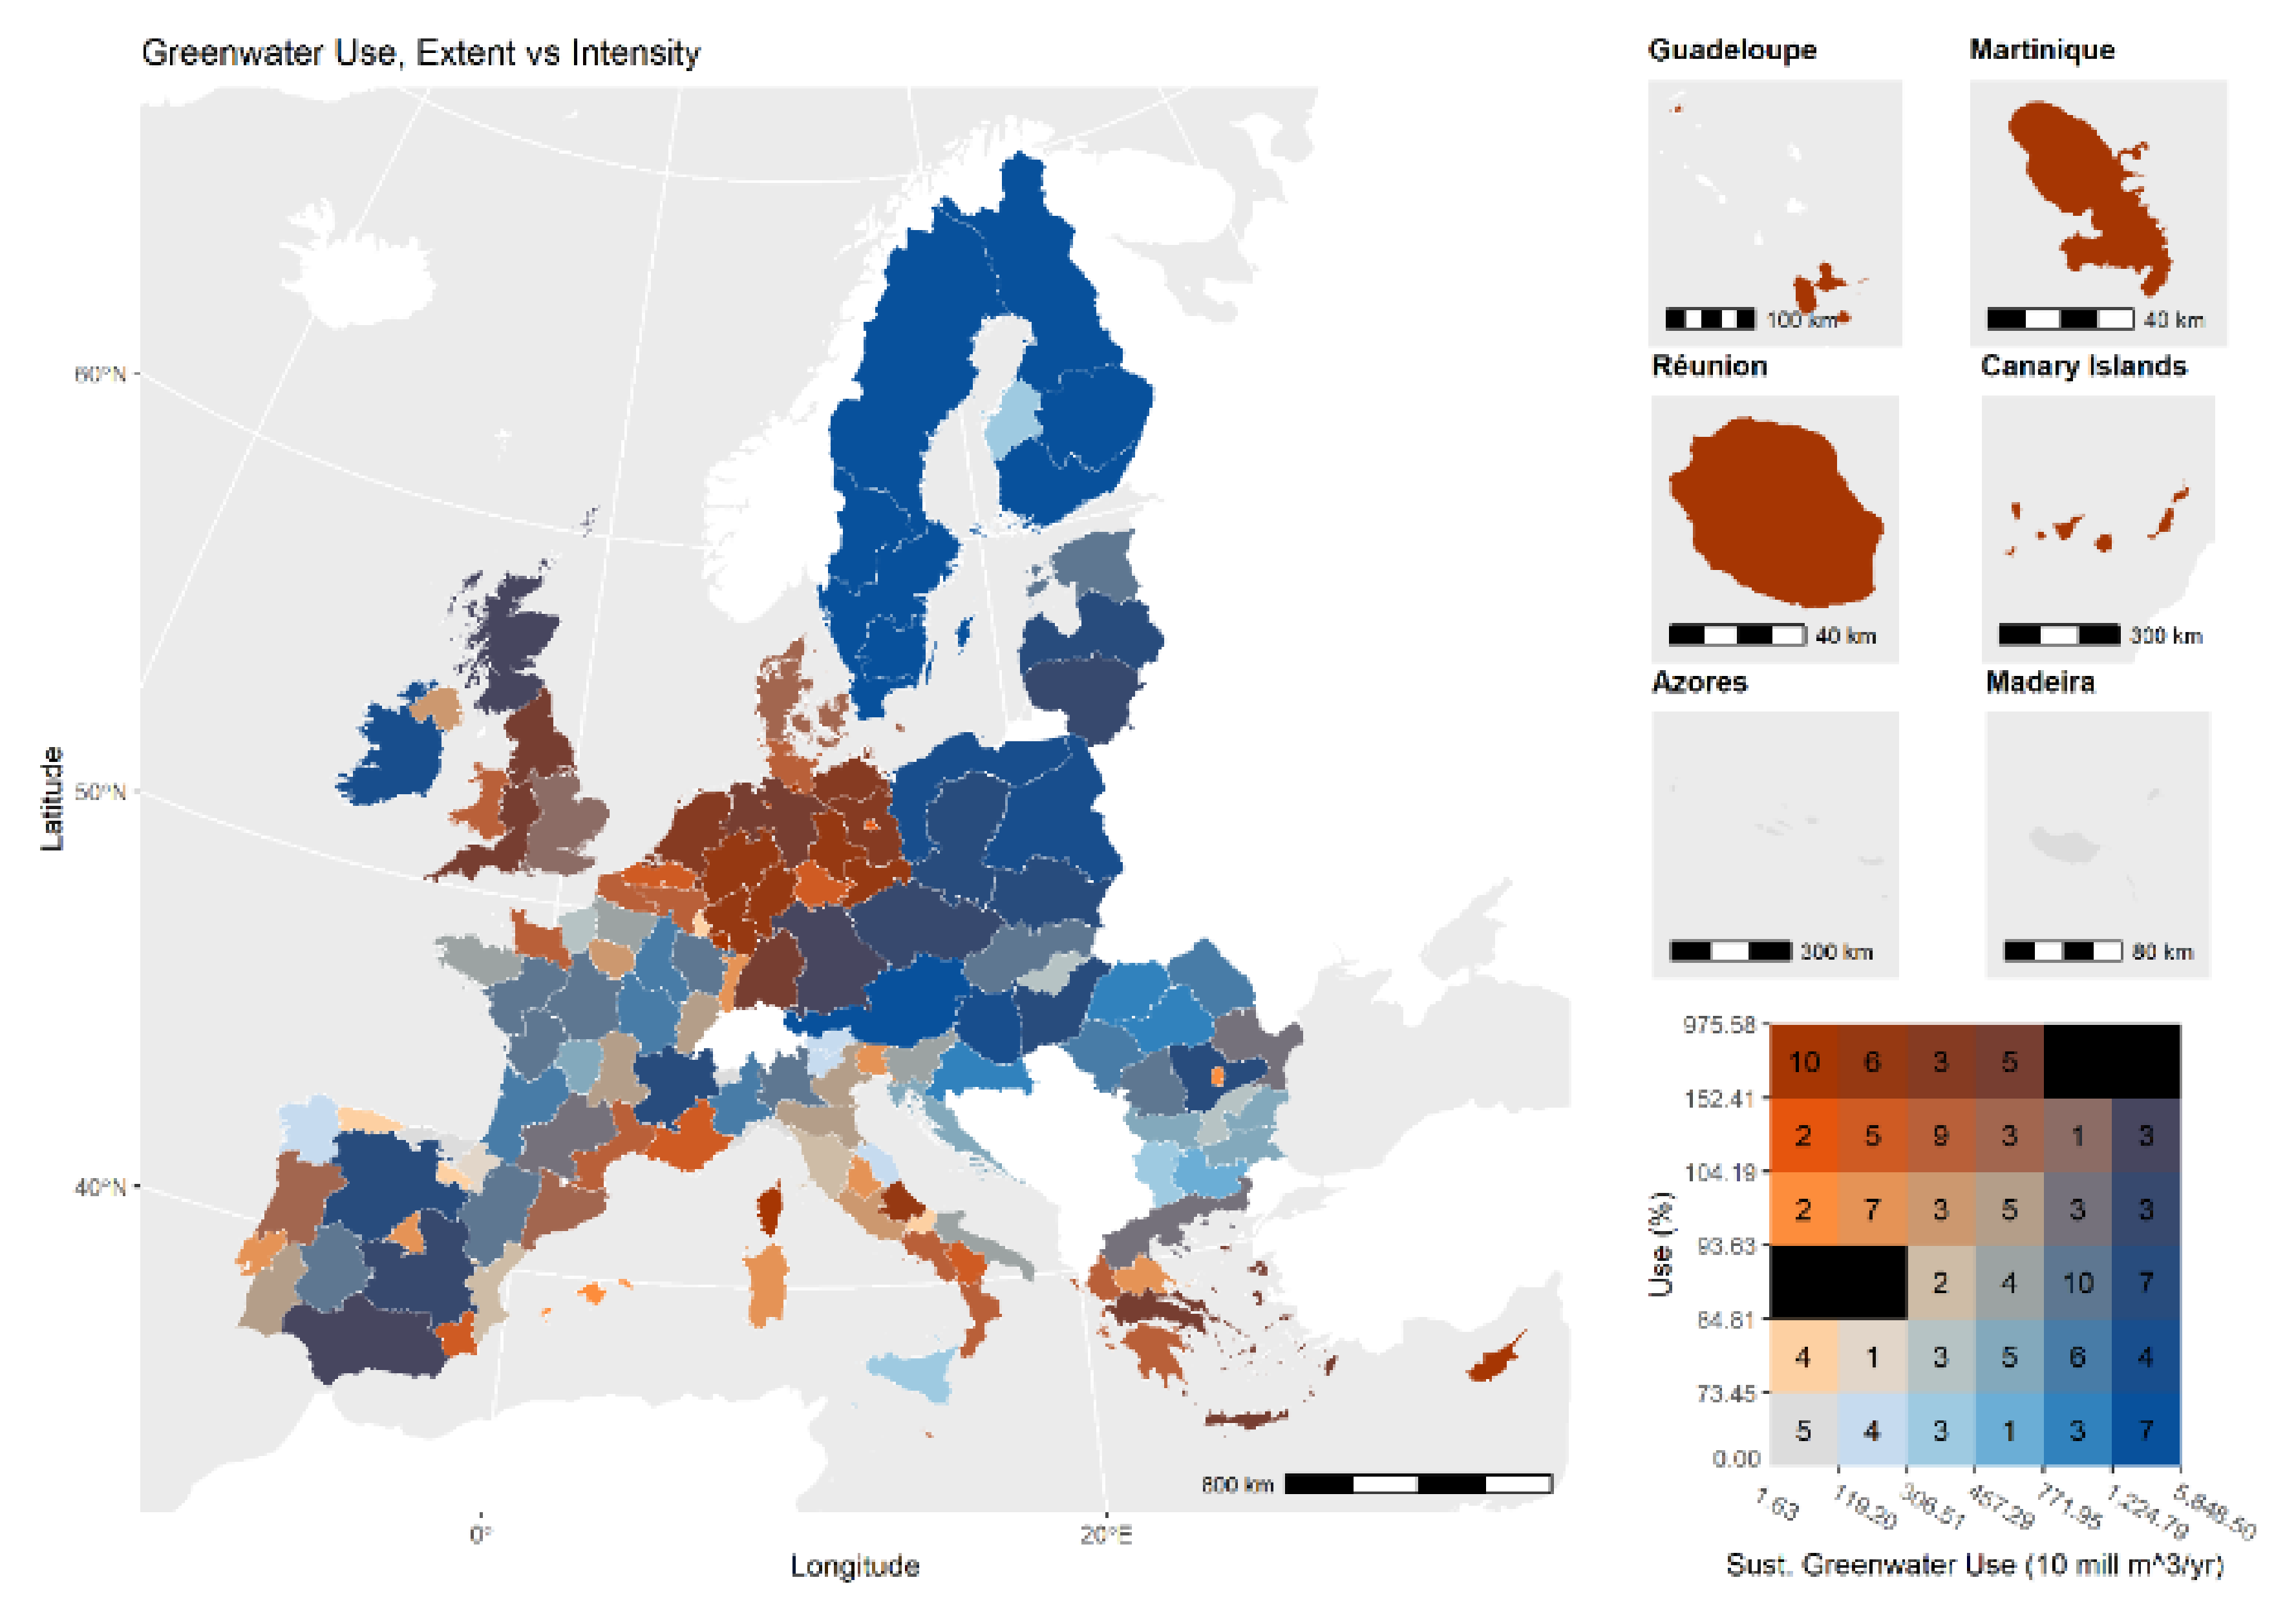
3.4. Draw on Natural Resources—Water
4. Discussion
4.1. Linking SMA and Impacts Using FADN
4.2. The Wider Context—Societal Demand
4.3. A Narrower Focus—The Role of Technology
4.4. Discussion in the Context of the Special Issue Call
[…] identify best practice examples of SALM ready for upscaling; present new frameworks, methods and principles to evaluate SALM; and highlight key knowledge gaps and future research agendas.
New research and experimentation continues to reveal the level of integration and interconnections between agricultural management and the surrounding environment including effects on other land uses such as forestry, energy and urban development.
A range of frameworks are being developed to include this new knowledge of interactions to assess agricultural sustainability more holistically. Yet it is clear that this is challenging due to the complexity of interconnections. […] robust and consistent approaches would allow comparisons between systems and open up opportunities to improve sustainability at a larger scale.
5. Conclusions
Supplementary Materials
Author Contributions
Funding
Institutional Review Board Statement
Informed Consent Statement
Data Availability Statement
Acknowledgments
Conflicts of Interest
References
- Cairns, R.; Krzywoszynska, A. Anatomy of a buzzword: The emergence of the water-energy-food nexus’ in UK natural resource debates. Environ. Sci. Policy 2016, 64, 164–170. [Google Scholar] [CrossRef]
- Giampietro, M.; Aspinall, R.J.; Ramos-Martin, J.; Bukkens, S. Resource Accounting for Sustainability Assessment: The Nexus between Energy, Food, Water and Land Use; Routledge: London, UK, 2014. [Google Scholar]
- Aragão, A.; Giampietro, M. An integrated multi-scale approach to assess the performance of energy systems illustrated with data from the Brazilian oil and natural gas sector. Energy 2016, 115, 1412–1423. [Google Scholar] [CrossRef]
- Chifari, R.; Lo Piano, S.; Bukkens, S.G.F.; Giampietro, M. A holistic framework for the integrated assessment of urban waste management systems. Ecol. Indic. 2018, 94, 24–36. [Google Scholar] [CrossRef]
- Giampietro, M. Anticipation in Agriculture. In Handbook of Anticipation: Theoretical and Applied Aspects of the Use of Future in Decision Making; Poli, R., Ed.; Springer International Publishing: Cham, Switzerland, 2018; pp. 1–35. [Google Scholar]
- Cadillo Benalcazar, J.; Giampietro, M.; Serrano-Tovar, T.; Bukkens, S.G.F. Food Grammar. In Resource Accounting for Sustainability Assessment: The Nexus between Energy, Food, Water and Land Use; Giampietro, M., Aspinall, R.J., Ramos-Martin, J., Bukkens, S., Eds.; Routledge: London, UK, 2014. [Google Scholar]
- United Nations. Transforming Our World: The 2030 Agenda for Sustainable Develpment. Resolution Adopted by the General Assembly on 25 September 2015. Available online: http://www.un.org/ga/search/view_doc.asp?symbol=A/RES/70/1&Lang=E (accessed on 1 June 2019).
- European Commission. Communication from the Commission to the European Parliament, the European Council, the Council, the European Economic and Social Committee and the Committee of the Regions. The European Green Deal. COM/2019/640 Final. Available online: https://eur-lex.europa.eu/legal-content/EN/TXT/?uri=COM%3A2019%3A640%3AFIN (accessed on 1 June 2020).
- Koff, H. Diaspora Philanthropy in the Context of Policy Coherence for Development: Implications for the post-2015 Sustainable Development Agenda. Int. Migr. 2017, 55, 5–19. [Google Scholar] [CrossRef] [Green Version]
- Le Blanc, D. Towards Integration at Last? The Sustainable Development Goals as a Network of Targets. Sustain. Dev. 2015, 23, 176–187. [Google Scholar] [CrossRef]
- Vasseur, L.; Horning, D.; Thornbush, M.; Cohen-Shacham, E.; Andrade, A.; Barrow, E.; Edwards, S.R.; Wit, P.; Jones, M. Complex problems and unchallenged solutions: Bringing ecosystem governance to the forefront of the UN sustainable development goals. Ambio 2017, 46, 731–742. [Google Scholar] [CrossRef]
- Kuhmonen, T. Systems view of future of wicked problems to be addressed by the Common Agricultural Policy. Land Use Policy 2018, 77, 683–695. [Google Scholar] [CrossRef]
- Pretty, J.; Benton, T.G.; Bharucha, Z.P.; Dicks, L.V.; Flora, C.B.; Godfray, H.C.J.; Goulson, D.; Hartley, S.; Lampkin, N.; Morris, C.; et al. Global assessment of agricultural system redesign for sustainable intensification. Nat. Sustain. 2018, 1, 441–446. [Google Scholar] [CrossRef]
- European Commission. The CAP: Have Your Say (Brussels, Belgium). 7 July 2017. Available online: https://ec.europa.eu/agriculture/events/cap-have-your-say_en (accessed on 7 November 2017).
- Janker, J.; Mann, S.; Rist, S. Social sustainability in agriculture—A system-based framework. J. Rural Stud. 2019, 65, 32–42. [Google Scholar] [CrossRef]
- European Commission. Commission Staff Working Document. Impact Assessment. Available online: https://eur-lex.europa.eu/legal-content/EN/TXT/?uri=SWD%3A2018%3A301%3AFIN (accessed on 1 June 2020).
- Gamero, A.; Brotons, L.; Brunner, A.; Foppen, R.; Fornasari, L.; Gregory, R.D.; Herrando, S.; Hořák, D.; Jiguet, F.; Kmecl, P.; et al. Tracking Progress Toward EU Biodiversity Strategy Targets: EU Policy Effects in Preserving its Common Farmland Birds. Conserv. Lett. 2017, 10, 394–401. [Google Scholar] [CrossRef]
- European Environment Agency. Greening Europe’ Agriculture. 2012, p. 5. Available online: https://www.eea.europa.eu/downloads/c9ed328a31e24445bc5203d656b98988/1395149974/greening-europe2019s-agriculture.pdf (accessed on 1 June 2020).
- European Environment Agency. Land and Soil in Europe, EEA Signals 2019. p. 60. Available online: https://www.eea.europa.eu/publications/eea-signals-2019-land (accessed on 1 June 2019).
- Hoff, H. Understanding the Nexus. Background Paper for the Bonn 2011 Conference: The Water, Energy and Food Security Nexus. Stockholm Environment Institute. 2011. Available online: https://www.sei.org/publications/understanding-the-nexus/ (accessed on 1 June 2019).
- Wiegleb, V.; Bruns, A. What is driving the Water-Energy-Food Nexus? Discourses, knowledge and politics of an emerging resource governance concept. Front. Environ. Sci. 2018, 6, 128. [Google Scholar] [CrossRef]
- Bidoglio, G.; Vanham, D.; Bouraoui, F.; Barchiesi, S. The Water-Energy-Food-Ecosystems (WEFE) Nexus. In Encyclopedia of Ecology, 2nd ed.; Fath, B., Ed.; Elsevier: Oxford, UK, 2019; pp. 459–466. [Google Scholar]
- Hoekstra, A.Y.; Wiedmann, T.O. Humanity’s unsustainable environmental footprint. Science 2014, 344, 1114–1117. [Google Scholar] [CrossRef]
- Rockstrom, J.; Steffen, W.; Noone, K.; Persson, A.; Chapin, F.S.; Lambin, E.F.; Lenton, T.M.; Scheffer, M.; Folke, C.; Schellnhuber, H.J.; et al. A safe operating space for humanity. Nature 2009, 461, 472–475. [Google Scholar] [CrossRef]
- Steffen, W.; Richardson, K.; Rockström, J.; Cornell, S.E.; Fetzer, I.; Bennett, E.M.; Biggs, R.; Carpenter, S.R.; de Vries, W.; de Wit, C.A.; et al. Planetary boundaries: Guiding human development on a changing planet. Science 2015, 347, 1259855. [Google Scholar] [CrossRef] [Green Version]
- Biggs, E.M.; Bruce, E.; Boruff, B.; Duncan, J.M.A.; Horsley, J.; Pauli, N.; McNeill, K.; Neef, A.; Van Ogtrop, F.; Curnow, J.; et al. Sustainable development and the water–energy–food nexus: A perspective on livelihoods. Environ. Sci. Policy 2015, 54, 389–397. [Google Scholar] [CrossRef] [Green Version]
- Rockström, J.; Williams, J.; Daily, G.; Noble, A.; Matthews, N.; Gordon, L.; Wetterstrand, H.; DeClerck, F.; Shah, M.; Steduto, P.; et al. Sustainable intensification of agriculture for human prosperity and global sustainability. Ambio 2017, 46, 4–17. [Google Scholar] [CrossRef] [PubMed] [Green Version]
- Mahon, N.; Crute, I.; Simmons, E.; Islam, M.M. Sustainable intensification—“Oxymoron” or “third-way”? A systematic review. Ecol. Indic. 2017, 74, 73–97. [Google Scholar] [CrossRef] [Green Version]
- Godfray, H.C.J. The debate over sustainable intensification. Food Secur. 2015, 7, 199–208. [Google Scholar] [CrossRef]
- Clay, N.; Garnett, T.; Lorimer, J. Dairy intensification: Drivers, impacts and alternatives. Ambio 2020, 49, 35–48. [Google Scholar] [CrossRef] [Green Version]
- Norström, A.V.; Dannenberg, A.; McCarney, G.; Milkoreit, M.; Diekert, F.; Engström, G.; Fishman, R.; Gars, J.; Kyriakopoolou, E.; Manoussi, V.; et al. Three necessary conditions for establishing effective Sustainable Development Goals in the Anthropocene. Ecol. Soc. 2014, 19, 8. [Google Scholar] [CrossRef] [Green Version]
- Scown, M.W.; Winkler, K.J.; Nicholas, K.A. Aligning research with policy and practice for sustainable agricultural land systems in Europe. Proc. Natl. Acad. Sci. USA 2019, 116, 4911–4916. [Google Scholar] [CrossRef] [PubMed] [Green Version]
- Kelly, E.; Latruffe, L.; Desjeux, Y.; Ryan, M.; Uthes, S.; Diazabakana, A.; Dillon, E.; Finn, J. Sustainability indicators for improved assessment of the effects of agricultural policy across the EU: Is FADN the answer? Ecol. Indic. 2018, 89, 903–911. [Google Scholar] [CrossRef] [Green Version]
- Green, S.; O’Donoghue, C. Assessing the geographic representativity of farm accountancy data. ISPRS Int. J. Geo-Inf. 2013, 2, 50–66. [Google Scholar] [CrossRef] [Green Version]
- Bradley, D.; Hill, B. Cost of and Good Practices for FADN Data Collection. 2015. Available online: http://publications.europa.eu/resource/cellar/a3feee1b-d47a-11e5-a4b5-01aa75ed71a1.0002.01/DOC_1 (accessed on 1 June 2019).
- Hennessy, T.; Kinsella, A. 40 Years of Irish Farming Since Joining the European Union: A Journey with the Teagasc National Farm Survey 1972 to 2012; Rural Economy and Development Programme, Teagasc. 2013. Available online: https://www.researchgate.net/publication/281093660_40_years_of_Irish_Farming_since_joining_the_European_UnionA_journey_with_the_Teagasc_National_Farm_Survey_1972_to_2012 (accessed on 1 June 2019).
- Uthes, S.; Heyer, I.; Kaiser, A.; Zander, P.; Bockstaller, C.; Desjeux, Y.; Keszthelyi, S.; Kis-Csatári, E.; Molnar, A.; Wrzaszcz, W.; et al. Costs, quantity and toxicity: Comparison of pesticide indicators collected from FADN farms in four EU-countries. Ecol. Indic. 2019, 104, 695–703. [Google Scholar] [CrossRef]
- Latruffe, L.; Mann, S. Is part-time farming less subsidised? The example of direct payments in France and Switzerland. Cah. Agric. 2015, 24, 20–27. [Google Scholar] [CrossRef]
- Latruffe, L.; Piet, L. Does land fragmentation affect farm performance? A case study from Brittany, France. Agric. Syst. 2014, 129, 68–80. [Google Scholar] [CrossRef]
- Uthes, S.; Kelly, E.; König, H.J. Farm-level indicators for crop and landscape diversity derived from agricultural beneficiaries data. Ecol. Indic. 2020, 108, 105725. [Google Scholar] [CrossRef]
- Giampietro, M.; Cadillo Benalcazar, J.J.; Di Felice, L.J.; Manfroni, M.; Pérez Sánchez, L.; Renner, A.; Ripa, M.; Velasco Fernández, R.; Bukkens, S.G.F. Report on the Experience of Applications of the Nexus Structuring Space in Quantitative Storytelling. MAGIC (H2020–GA 689669) Project Deliverable 4.4, Revision (Version 2.0). 2021, p. 93. Available online: https://magic-nexus.eu/documents/deliverable-44-report-nexus-structuring-space (accessed on 1 June 2019).
- Georgescu-Roegen, N. The Entropy Law and the Economic Process. Econ. J. 1973, 83, 551–553. [Google Scholar] [CrossRef]
- Cadillo-Benalcazar, J.J.; Renner, A.; Giampietro, M. A multiscale integrated analysis of the factors characterizing the sustainability of food systems in Europe. J. Environ. Manag. 2020, 271, 110944. [Google Scholar] [CrossRef]
- FAO. Global Livestock Environmental Assessment Model: Model Description, Version 2.0. 2017. Available online: http://www.fao.org/fileadmin/user_upload/gleam/docs/GLEAM_2.0_Model_description.pdf (accessed on 1 June 2019).
- FAO. FAO GLEAM Database. Global Livestock Environmental Assessment Model v2.0; Data Reference Year 2010, Revision 5, July 2018; FAO: Rome, Italy, 2018. [Google Scholar]
- Eurostat. Animal Populations by NUTS 2 Region. Available online: https://ec.europa.eu/eurostat/web/products-datasets/product?code=AGR_R_ANIMAL (accessed on 14 July 2020).
- FAO. FAOSTAT of the Food and Agriculture Organization of the United Nations. Available online: http://www.fao.org/faostat/en/#home (accessed on 19 December 2018).
- Chatterton, J.; Hess, T.; Williams, A. The Water Footprint of English Beef and Lamb Production: A Report for EBLEX. 2010. Available online: http://dspace.lib.cranfield.ac.uk/handle/1826/5425 (accessed on 1 June 2019).
- Mekonnen, M.M.; Hoekstra, A.Y. The green, blue and grey water footprint of crops and derived crop products. Hydrol. Earth Syst. Sci. 2011, 15, 1577–1600. [Google Scholar] [CrossRef] [Green Version]
- FAO. FAOSTAT Commodity List. Available online: http://www.fao.org/economic/ess/ess-standards/commodity/en/ (accessed on 14 December 2019).
- Renner, A. Quantitative Storytelling on an Agricultural Internalization; Chapter 5 in Supercritical Sustainability: A Relational Theory of Social-Ecological Systems with Lessons from a Disenfranchised European Primary Sector; Autonomous University of Barcelona: Barcelona, Spain, 2020. [Google Scholar]
- Renner, A.; Cadillo-Benalcazar, J.J.; Benini, L.; Giampietro, M. Environmental pressure of the European agricultural system: Anticipating the biophysical consequences of internalization. Ecosyst. Serv. 2020, 46, 101195. [Google Scholar] [CrossRef]
- Krzywinski, M.I.; Schein, J.E.; Birol, I.; Connors, J.; Gascoyne, R.; Horsman, D.; Jones, S.J.; Marra, M.A. Circos: An information aesthetic for comparative genomics. Genome Res. 2009, 19, 1639–1645. [Google Scholar] [CrossRef] [PubMed] [Green Version]
- Mayumi, K.; Giampietro, M. The epistemological challenge of self-modifying systems: Governance and sustainability in the post-normal science era. Ecol. Econ. 2006, 57, 382–399. [Google Scholar] [CrossRef]
- Saltelli, A.; Giampietro, M. What is wrong with evidence based policy, and how can it be improved? Futures 2017, 91, 62–71. [Google Scholar] [CrossRef]
- Cash, D.; Clark, W.; Alcock, F.; Dickson, N.; Eckley, N.; Jager, J. Salience, Credibility, Legitimacy and Boundaries: Linking Research, Assessment and Decision Making; KSG Working Paper Series; John F. Kennedy Schools of Government, Harvard Univesity: Cambridge, MA, USA, 2002. [Google Scholar]
- Matthews, K.B.; Rivington, M.; Blackstock, K.L.; McCrum, G.; Buchan, K.; Miller, D.G. Raising the bar?—The challenges of evaluating the outcomes of environmental modelling and software. Environ. Model. Softw. 2011, 26, 247–257. [Google Scholar] [CrossRef]
- Giampietro, M.; Funtowicz, S.O. From elite folk science to the policy legend of the circular economy. Environ. Sci. Policy 2020, 109, 64–72. [Google Scholar] [CrossRef]
- Saltelli, A.; Benini, L.; Funtowicz, S.; Giampietro, M.; Kaiser, M.; Reinert, E.; van der Sluijs, J.P. The technique is never neutral. How methodological choices condition the generation of narratives for sustainability. Environ. Sci. Policy 2020, 106, 87–98. [Google Scholar] [CrossRef]
- Renner, A.; Giampietro, M. Socio-technical discourses of European electricity decarbonization: Contesting narrative credibility and legitimacy with quantitative story-telling. Energy Res. Soc. Sci. 2020, 59, 101279. [Google Scholar] [CrossRef]
- Cabello, V.; Romero, D.; Musicki, A.; Pereira, Â.G.; Peñate, B. Co-creating narratives for WEF nexus governance: A Quantitative Story-Telling case study in the Canary Islands. Sustain. Sci. 2021, 16, 1363–1374. [Google Scholar] [CrossRef]
- Cadillo-Benalcazar, J.J.; Bukkens, S.G.F.; Ripa, M.; Giampietro, M. Why does the European Union produce biofuels? Examining consistency and plausibility in prevailing narratives with quantitative storytelling. Energy Res. Soc. Sci. 2021, 71, 101810. [Google Scholar] [CrossRef]
- Blackstock, K.L.; Waylen, K.A.; Matthews, K.B.; Juarez-Bourke, A.; Miller, D.G.; Wardell-Johnson, D.H.; Hague, A.; Giampietro, M. Implementing post-normal science with or for EU policy makers: Using Quantitative Story Telling to discuss the Common Agricultural Policy and Sustainable Development Goal 2. Sustain. Sci. 2021. in preparation. [Google Scholar]
- Waylen, K.A.; Blackstock, K.L.; Juarez-Bourke, A.; Hague, A.; Voelker, T.; Matthews, K.B.; Miller, D.G.; Wardell-Johnson, D.H. Questioning the roles of scientific experts in science-policy interfaces: Reflections from our work on the Water-Energy-Food ‘nexus’. Environ. Sci. Policy 2021. in preparation. [Google Scholar]
- Matthews, K.B.; Blackstock, K.L.; Rivington, M.; Waylen, K.A.; Miller, D.G.; Wardell-Johnson, D.; Kovacic, Z.; Renner, A.; Ripa, M.; Giampietro, M. Delivering more than the “Sum of the Parts”: Using Quantitative Storytelling to address the challenges of conducting science for policy in the EU land, water and energy nexus. In MODSIM2017, 22nd International Congress on Modelling and Simulation. Modelling and Simulation Society of Australia and New Zealand; Syme, G., Hatton MacDonald, D.F.B., Piantadosi, J., Eds.; 2017; p. 7. Available online: https://www.mssanz.org.au/modsim2017/Keynote/matthews.pdf (accessed on 1 June 2019).
- Vatn, A. Environmental Governance—From Public to Private? Ecol. Econ. 2018, 148, 170–177. [Google Scholar] [CrossRef]
- Polimeni, J.M.; Mayumi, K.; Giampietro, M. Jevons’ Paradox and the Myth of Resource Efficiency Improvements; Earthscan Publications Ltd.: London, UK, 2010. [Google Scholar]
- Viglia, S.; Matthews, K.B.; Miller, D.G.; Wardell-Johnson, D.; Rivington, M.; Ulgiati, S. The social metabolism of Scotland: An environmental perspective. Energy Policy 2017, 100, 304–313. [Google Scholar] [CrossRef]
- Hogeboom, R.J.; de Bruin, D.; Schyns, J.F.; Krol, M.S.; Hoekstra, A.Y. Capping Human Water Footprints in the World’s River Basins. Earth’s Future 2020, 8, e2019EF001363. [Google Scholar] [CrossRef] [PubMed]
- Schyns, J.F.; Hoekstra, A.Y.; Booij, M.J.; Hogeboom, R.J.; Mekonnen, M.M. Limits to the world’s green water resources for food, feed, fiber, timber, and bioenergy. Proc. Natl. Acad. Sci. USA 2019, 116, 4893–4898. [Google Scholar] [CrossRef] [PubMed] [Green Version]
- European Environment Agency. The European Environment—State and Outlook 2020: Knowledge for Transition to a Sustainable Europe. 2020, p. 499. Available online: https://www.eea.europa.eu/soer/publications/soer-2020 (accessed on 1 June 2019).
- European Environment Agency. WISE Water Framework Directive Database. Available online: https://www.eea.europa.eu/data-and-maps/data/wise-wfd-4 (accessed on 1 June 2020).
- Joint Research Centre. European Soil Data Centre (ESDAC) Soil Threats Data. Available online: https://esdac.jrc.ec.europa.eu/resource-type/soil-threats-data (accessed on 1 June 2019).
- Sauer, S. Soy expansion into the agricultural frontiers of the Brazilian Amazon: The agribusiness economy and its social and environmental conflicts. Land Use Policy 2018, 79, 326–338. [Google Scholar] [CrossRef]
- Heller, M.C.; Keoleian, G.A. Life Cycle-Based Sustainability Indicators for the Assessment of the US Food System; The Center for Sustainable Systems: Ann Arbor, MI, USA, 2000; p. 59. [Google Scholar]
- European Commission. Farm to Fork Strategy, For a Fair, Healthy and Environmentally-Friendly Food System. 2020, p. 23. Available online: https://ec.europa.eu/food/sites/food/files/safety/docs/f2f_action-plan_2020_strategy-info_en.pdf (accessed on 1 June 2020).
- Matthews, K.B.; Blackstock, K.L.; Waylen, K.A.; Juarez-Bourke, A.; Miller, D.G.; Wardell-Johnson, D.H.; Rivington, M.; Hague, A.; Fisher, D.; Renner, A.; et al. Report on EU Sustainability Goals: Insights from Quantitative Story Telling and the WEFE Nexus. MAGIC (H2020–GA 689669) Project Deliverable 5.1, 31st July 2020. 2020, p. 136. Available online: https://magic-nexus.eu/documents/deliverable-51-report-eu-sustainability-goals (accessed on 1 June 2019).
- Voinov, A.; Shugart, H.H. ‘Integronsters’, integral and integrated modeling. Environ. Model. Softw. 2013, 39, 149–158. [Google Scholar] [CrossRef]
- Blackstock, K.; Dinnie, L.; Dilley, R.; Marshall, K.; Dunglinson, J.; Trench, H.; Harper, K.; Finan, K.; MacPherson, J.; Johnston, E.; et al. Participatory research to influence participatory governance: Managing relationships with planners. Area 2015, 47, 254–260. [Google Scholar] [CrossRef]
- Young, J.C.; Waylen, K.A.; Sarkki, S.; Albon, S.; Bainbridge, I.; Balian, E.; Davidson, J.; Edwards, D.; Fairley, R.; Margerison, C.; et al. Improving the science-policy dialogue to meet the challenges of biodiversity conservation: Having conversations rather than talking at one-another. Biodivers. Conserv. 2014, 23, 387–404. [Google Scholar] [CrossRef] [Green Version]
- Rayner, S. Uncomfortable knowledge: The social construction of ignorance in science and environmental policy discourses. Econ. Soc. 2012, 41, 107–125. [Google Scholar] [CrossRef]


Publisher’s Note: MDPI stays neutral with regard to jurisdictional claims in published maps and institutional affiliations. |
© 2021 by the authors. Licensee MDPI, Basel, Switzerland. This article is an open access article distributed under the terms and conditions of the Creative Commons Attribution (CC BY) license (https://creativecommons.org/licenses/by/4.0/).
Share and Cite
Matthews, K.B.; Renner, A.; Blackstock, K.L.; Waylen, K.A.; Miller, D.G.; Wardell-Johnson, D.H.; Juarez-Bourke, A.; Cadillo-Benalcazar, J.; Schyns, J.F.; Giampietro, M. Old Wine in New Bottles: Exploiting Data from the EU’s Farm Accountancy Data Network for Pan-EU Sustainability Assessments of Agricultural Production Systems. Sustainability 2021, 13, 10080. https://doi.org/10.3390/su131810080
Matthews KB, Renner A, Blackstock KL, Waylen KA, Miller DG, Wardell-Johnson DH, Juarez-Bourke A, Cadillo-Benalcazar J, Schyns JF, Giampietro M. Old Wine in New Bottles: Exploiting Data from the EU’s Farm Accountancy Data Network for Pan-EU Sustainability Assessments of Agricultural Production Systems. Sustainability. 2021; 13(18):10080. https://doi.org/10.3390/su131810080
Chicago/Turabian StyleMatthews, Keith B., Ansel Renner, Kirsty L. Blackstock, Kerry A. Waylen, Dave G. Miller, Doug H. Wardell-Johnson, Alba Juarez-Bourke, Juan Cadillo-Benalcazar, Joep F. Schyns, and Mario Giampietro. 2021. "Old Wine in New Bottles: Exploiting Data from the EU’s Farm Accountancy Data Network for Pan-EU Sustainability Assessments of Agricultural Production Systems" Sustainability 13, no. 18: 10080. https://doi.org/10.3390/su131810080
APA StyleMatthews, K. B., Renner, A., Blackstock, K. L., Waylen, K. A., Miller, D. G., Wardell-Johnson, D. H., Juarez-Bourke, A., Cadillo-Benalcazar, J., Schyns, J. F., & Giampietro, M. (2021). Old Wine in New Bottles: Exploiting Data from the EU’s Farm Accountancy Data Network for Pan-EU Sustainability Assessments of Agricultural Production Systems. Sustainability, 13(18), 10080. https://doi.org/10.3390/su131810080