Abstract
The paper presents insights from carrying out a pan-EU sustainability assessment using Farm Accountancy Data Network (FADN) data (the old wine) with societal metabolism accounting (SMA) processes (the new bottles). The SMA was deployed as part of a transdisciplinary study with EU policy stakeholders of how EU policy may need to change to deliver sustainability commitments, particularly to the UN Sustainable Development Goals. The paper outlines the concepts underlying SMA and its specific implementation using the FADN data. A key focus was on the interactions between crop and livestock systems and how this determines imported feedstuffs requirements, with environmental and other footprints beyond the EU. Examples of agricultural production systems performance are presented in terms of financial/efficiency, resource use (particularly the water footprint) and quantifies potential pressures on the environment. Benefits and limitations of the FADN dataset and the SMA outputs are discussed, highlighting the challenges of linking quantified pressures with environmental impacts. The paper concludes that the complexity of agriculture’s interactions with economy and society means there is great need for conceptual frameworks, such as SMA, that can take multiple, non-equivalent, perspectives and that can be deployed with policy stakeholders despite generating uncomfortable knowledge.
1. Introduction
This paper contributes to the deliberations within the special issue by presenting the authors’ insights gained by using new sustainability assessment methods with existing European Union farm accountancy data as part of transdisciplinary research with EU policy stakeholders. The research sought to engage with complex, coupled social–ecological issues, particularly how progress towards EU sustainability goals may be an artefact of what is included within the analysis. The paper provides theoretical and practical knowledge to guide the conduct of sustainability assessments within the agri-food domain based both on the implementation of a pan-EU analysis and deliberation across the science–policy interface.
1.1. Project Background
This paper is an output of an EU Horizon 2020 project (MAGIC) conducted between 2016 and 2020 to better understand how EU water, food, energy, waste and biodiversity policies are linked together to deliver EU climate and sustainability goals, framed in terms of the water–energy–food (WEF) nexus concept [1]. The intention within MAGIC was to conduct transdisciplinary research with policy makers using an approach termed quantitative story telling (QST) as an interface between science and policy domains. QST combines qualitative and quantitative analysis methods to assess the plausibility, normative fairness and analytical coherence of narratives being used by stakeholders to justify either the status quo or alternative policy positions for the EU. The quantitative methods used within the project, and the main focus of this paper, are an example of societal metabolism accounting (SMA) developed by Giampietro et al. [2] and previously deployed in a range of applications [3,4,5,6].
1.2. Policy Background
Agenda 2030 and the EU Green Deal are framed, and respond to, the global aspirations of the UN 2030 agenda [7] and the associated Sustainable Development Goals (SDGs). Indeed the EU Green Deal is described as ‘putting the Sustainable Development Goals at the heart of the EU’s policymaking and action’ [8]. Agenda 2030 was adopted by world leaders in 2015 [7] to represent the new global sustainable development framework. This global commitment aims to eradicate poverty and achieve sustainable development by 2030, ensuring that no one is left behind. The SDGs were expected to be more transformative and global than the previous Millennium Development Goals with their developing world focus [9]. The SDGs balance the three dimensions of sustainable development (environment, economic and social) and the goals are explicitly acknowledged as being interconnected [10]. This raises interesting questions of how well existing policies and governance mechanisms can cope with delivering these ambitious objectives that require resolving trade-offs, addressing issues of distributional justice and the need to make polycentric governance effective [11]. This was the high-level policy context in which the overall MAGIC project was conducted.
The analysis within this paper focused on the how the EU Common Agriculture Policy (CAP) underpins (or undermines) delivery of the EU sustainability goals as represented by the SDGs, in particular SDG 2 (Zero Hunger). As Kuhmonen [12] notes, the CAP is a tightly wired and evolving, complex adaptive system, with a rich range of narratives competing to influence how the policy is implemented. It is also the single largest source of public funding that can influence the practice of land management across the EU and directly influences nearly all the most intensive managed land (of the 179 M ha of land defined as utilised agricultural area in 2016, 154 M ha or 86% claimed CAP direct payments). Agricultural management directly affects the natural capital underpinning human wellbeing [13]—farmers are described as custodians of these natural resources [14] and agriculture is often imbued with cultural meaning as a source of individual, collective and national identity [15]. These multiple perspectives can be seen in the revised objectives for the CAP post 2020.
The European Commission’s Impact Assessment of the future CAP highlighted economic challenges including pressures on farm incomes, weak competitiveness, imbalanced value chains and social challenges including under-employment and inequalities between territories and groups [16]. The main environmental challenges facing EU agriculture were climate change, ammonia emissions from agriculture, unsustainable soil management practices, excessive inputs of nutrients and pesticides, over-abstraction of water, and loss of landscapes and habitats [16]. Certainly, academic commentary suggests that the CAP’s mechanisms may slow down, but have not reversed such trends, or substantively reduced the pressures on the environment from intensive farming [17]. The European Environment Agency (EEA) have argued that the intensification of agriculture has enabled Europe to produce more and cheaper food but at the expense of the environment [18,19].
1.3. Science Background
In trying to address these complex societal issues, the concept of the water–energy–food (WEF) nexus has gained momentum since the 2011 Bonn Conference [20]. The WEF nexus is a new perspective on concern for the impact of human activity on the planet and the longer-term ability to sustain current patterns of resource use. The focus is particularly on the interactions of production and consumption within the three domains of water supply, energy supply and food supply [21]. Whilst the WEF nexus approach takes a systems perspective, it has been critiqued for treating these systems as pre-determined technical challenges to resolve, rather than as a more general problem of how socio-technical systems are managed [1]. Wiegleb and Bruns [21] also draw attention to the need to research the spatial distribution of environmental impacts and the power, equity and justice dimensions that arise with such issues. Bidoglio et al. [22] emphasise the dependence of the human water, energy and food systems on natural stocks and flows, and that those are shared with aquatic and terrestrial ecosystems. A WEF nexus perspective also illustrates how security of supply for human use is dependent on ensuring planetary limits are not exceeded [23,24,25]. Biggs et al. [26] thus suggest that the WEF nexus is a useful paradigm for thinking about sustainability with the focus on “security”.
Another influential paradigm for policy makers tasked with delivering SDG2 is the sustainable intensification of agriculture—improving the environmental sustainability of practices to ensure the viability of the agricultural sector [27]. This paradigm is often portrayed as having the potential to transform agricultural socio-ecological systems [13]. However it has been critiqued for being poorly defined [28], associated with high-input and high-tech farming practices [29] and often excluding wider social, cultural and welfare aspects of agricultural policy [30].
More broadly, Norström et al. [31] suggest three aspects to consider for policy relevant sustainability assessment: (1) taking account of cross-scale relationships, feedback, and uncertainty; (2) noting the trade-offs between ambition and feasibility, given biophysical, social and political constraints; (3) the need for the implementation of sustainability policies to consider what is known about social transformation processes at all levels, individual to global. Scown et al. [32] also note the crucial need to understand how sustainability issues are framed before proceeding with any technical or policy solutions. Against this background the MAGIC research followed Norström et al.’s principles and the other concepts to frame a cross-scale and holistic sustainability assessment of EU agricultural production systems and to implement it by combining SMA with data from FADN.
1.4. Previous Studies of FADN as a Basis for Sustainability Assessment
The use of Eurostat Farm Accountancy Data Network (FADN) as a basis for sustainability assessment was reviewed by Kelly et al. [33] in 2018. FADN is widely used as part of sustainability assessments, but these typically have a more economic orientation reflecting the agricultural–economic origins of FADN.
Key strengths of FADN are the harmonised data collection protocols, the yearly time frame and historic records (40+ years for some Member States). Further, FADN can provide data on a large sample of individual holdings that are argued to be key decision makers for land management and are thus key policy actors, as well as being the legal entities that are the recipients of CAP payments, and thus subjected to regulation [33]. Yet, the sample rather than census basis and the lack of spatial location data can limit their usefulness when considering social aspects of sustainability that rely on interactions in localised social networks, or for improving environmental sustainability via geographical coordination. The FADN sample may also under-represent smaller and higher nature value farms [34] which may hide some trends or issues.
Sustainability assessments can be facilitated when the core FADN dataset is augmented by additional data (as reviewed by Bradley and Hill [35]) for example to add new indicators (GHG emissions [36], or pesticide use [37]) or through data linkage (to taxation records for off-farm income [38]) or geographically (to land parcel [39] or other administrative data [40]). Yet, while demonstrating the potential of an augmented dataset the lack of pan-EU coverage means, when combined with institutional and data protection issues, that such studies often must be limited to single MS or regions. It is worth noting that FADN has seen considerable recent change, for example the post-2019 fertiliser usage is now quantified in physical terms, yet issues of quantifying pesticide, diet/feed, soil, water and biodiversity are still challenges [33].
2. Methods and Data
This section outlines the SMA carried out and the science–policy process within which the SMA was undertaken—QST. Over the course of the MAGIC project there was considerable evolution of the SMA approaches, summarised in Giampietro et al. [41] and the combination of SMA with FADN data to generate pan-EU sustainability assessments for agricultural production systems was ambitious. The methods and outputs reported here are thus a proof-of-concept for using FADN data within an SMA analysis. Whilst the approach used within the QST process has been seen by policy stakeholders as informative, the results obtained emphasise the economic and environmental aspects of sustainability and should not be seen as definitive and do need to be interpreted cautiously.
2.1. Formal Societal Metabolism Analysis
The accounting began with a societal metabolism analysis, being an approach that endeavours first and foremost to represent in a formal structure the set of expected relations of a social–ecological system in a set of representative metabolic processors [41]. Following the general schema of Georgescu-Roegen [42] and in the spirit of the previous European agricultural profiling work outlined by Cadillo-Benalcazar et al. [43], both flow (e.g., blue water, nitrogenous fertiliser) and fund (e.g., human labour, crop land) elements were gathered for key agricultural production systems, expressed in biophysical units across the board. SMA data structures were populated with public and privately provisioned FADN data, in raw, derived and manipulated forms, the latter categories arising primarily where FADN variables were represented in economic units and needed to be translated either directly or indirectly into physical units.
The calculation of livestock feed consumption represented the lion’s share of data manipulation efforts. Livestock populations provided by FADN in livestock units were first translated into capita measurements, annual average, and distributed among the GLEAM 2.0 [44,45] livestock categories using herd composition ratios reported by Eurostat [46] or, in the case of poultry, FAOSTAT [47]. Between three and six livestock categories, based on animal gender and farm role, and between two and three levels of farm industrialisation were considered for each of the different livestock species. Gross feed accounts were calculated, applying technical coefficients represented in physical terms as established by the GLEAM 2.0 model. Feed accounts differentiated between, variously, 10 and 31 crop categories, dependent on livestock category. Dry matter intakes were first estimated, then a series of coefficients from mass fraction to farm use efficiency and fresh matter conversion were applied.
After having calculated gross feed accounts, those accounts were classified into local production and import fractions at an aggregate feed-crop level, meaning between two FADN feed variables, one for forage crops and one for grasses. To do this, local feed supply was estimated and contrasted to the calculated gross feed account, using standard output (SO) price coefficients from the EU Farm Structure Survey, expressed in ECU/ha at approximately the NUTS1 or NUTS2 geographic resolution, to convert into physical units the two aforementioned feed variables. In summary, feed farm-use quantities were calculated, followed by the calculation of excess feed quantities and farm demand quantities (feed demanded by local livestock but not produced on the respective holding). These values were harmonised at the national scale, where feed judged to be imported from within the bounding member state was discounted. Foreign import, being feed judged to be imported from outside the member state corresponding to any given set of farms, was therefore conservatively considered to represent the actual feed imported at the farm level—added to the set of farm production factors as a “virtual account”.
Vegetal production factors for all crop categories, related to feed or otherwise, were then calculated. In this paper, blue and green water production factors are presented, with underlying water use technical coefficients deriving from water footprint data [48,49], detailed across 146 different FAOSTAT Food Commodity List (FCL) crops [50] geographically differentiated at the sub-national level. All data, related to the water footprint or otherwise, raw and manipulated, was run through a post-process sanity-check filter. Outliers, defined as values with a Z-score < 2.57, corresponding to 99.5% on a normal distribution, were eliminated and re-calculated using the semantic interpolation scheme outlined in [51,52]. For example, since reliable data for blue water use for carrot production was missing for a certain grouping of farms, a working value was estimated by taking the mean value of all farms of a similar type and economic size in the smallest agroeconomic region where at least three data points could be gathered. A missing production factor for carrots in Berlin might have been replaced by the mean value of that factor for carrots produced Germany-wide. If, through enlarging the geographic area considered, still no value could reasonably be estimated, data were instead interpolated along the FAOSTAT FCL classification digraph. A missing production factor for carrots in a region, for example, might be replaced by the mean value of that factor for all vegetables in the respective, nearest relevant, agro-economic region. The percentage of data interpolated differed by data table, generally being < 10%, but on occasion reaching up to 20%.
As is generally the case with large quantitative works bringing in various datasets, the devil was therefore in the details of the qualitative design of underlying database classifications schemes. For further information on the logic and specifics of the implementation, readers are referred to the parallel case study based on FAOSTAT data presented by Cadillo-Benalcazar et al. [43], and for anticipatory aspects associated with that, to Renner et al. [52].
Two uncommon visualisation methods were used in presenting the societal metabolism data and both are also used in this paper—the chord diagram and the extent and intensity map. These are presented in more detail in the Supplementary Materials but guidance on their interpretation is also briefly outlined here.
The chord diagrams (see examples in Section 3 Results) are generated by the CIRCOS software [53]. These visualisations were developed initially for genomic datasets but also have potential value for aiding interpretation of other large or information rich datasets. Chord diagrams demonstrate relationships between elements—across scales or between typologies—and so can for example be used to link Member States (MS) and farm types, to show the mix of activities, and resources used by a production system, or how CAP funds are used. Chord diagrams are good for seeing the “big picture”, for example, highlighting the relative importance of extent variables, but are not necessarily best for showing fine details. Chord diagrams show relationships e.g., between countries (reading clockwise from 12 o’clock) and farm types (clockwise from 6 o’clock). The strength of relationships is encoded in the size of the links and the colour showing the mix of types or countries. The outer rings give the mixes e.g., per farm type for a country or vice versa.
The relationship maps (see examples in Section 3 Results) show the spatial pattern of a relationship between two variables. This can be in the form of two extent metrics implicitly creating a rate map (e.g., tonnes per ha) whilst distinguishing between high/high locations and low/low locations, which on a standard rate choropleth would occur in the same class. An alternative form of these maps is an extent vs. intensity map. For extent vs. intensity maps the extent variable is on the x axis of the legend (the size of the supplied flow), and the intensity variable (the benchmark determining the chosen flow/fund ratio) is shown on the y axis. The legend for the relationship map contains up to 36 different colours, with each being a combination of the colours used for the two variables. The left and bottom edges show the class boundaries for the mapping, with the classes on each axis containing 1/6 of the values for that variable. The number within the square indicates the number of regions that are within that class. A black box indicates that no regions exist on that map with that combination of values. The yellow colour on the map is missing or unreliable data. The relationship maps are useful in highlighting trends across the continent, regional clusters, within MS variation and outlier cases.
2.2. Semantic Analysis and Transdisciplinary Processes
The utility of the formal societal metabolism accounting was enhanced by making it part of a wider sustainability assessment that crucially considered how issues are framed and how information is interpreted. This is the process of QST that draws philosophically on post-normal science for governance [54]. QST recognises that there is unavoidable scientific uncertainty and value plurality that can mean sustainability assessments are undermined when they fail to include important elements; are unconvincing or unclear in the way evidence is marshalled; or are used in decision making processes perceived as partisan [55]. These are all instances of the salience, credibility and legitimacy challenges for research identified by Cash et al. [56] and as being crucial for delivering impacts across the science–policy interface [57]. QST was a response to these challenges, undertaking a transdisciplinary research process including policy and other stakeholders in the analysis process. QST has a strong emphasis on being clear how policy and other stakeholder statements have framed/defined the issues (the semantic and qualitative elements) and secondly on engaging with stakeholders to interpret the significance or utility of outputs. The theory underpinning QST is presented in Giampietro and Funtowicz [58] and Saltelli et al. [59] and other applications in Renner and Giampietro [60], Cabello et al. [61] and Cadillo-Benalcazar et al. [62]. The QST process for this analysis is explored in more depth in sister papers by Blackstock et al. [63] and the role of experts in policy making in Waylen et al. [64]. To contextualise the analysis presented in this paper the elements of the QST process are set out briefly below and in Figure 1.
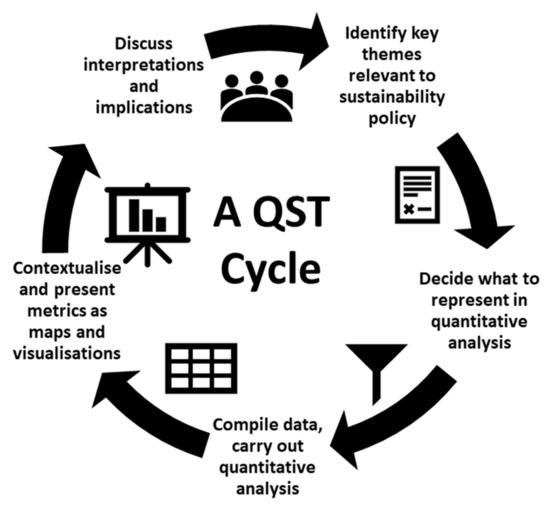
Figure 1.
An overview of the quantitative story telling (QST) cycle.
QST is envisioned as a cyclical iterative process. Each of its main QST stages are shown in Figure 1 and are discussed in more detail in Matthews et al. [65]. The semantic phases broadly correspond with the top of the cycle, and the formal phases with the bottom of the cycle (decide what to represent, carry out quantitative analysis, present metrics). The top of the cycle represents both the start and potential end point for QST, but successive iterations of QST cycles, or steps, are possible and indeed desirable. QST can be particularly effective in eliciting the social/political dimensions of sustainability (the desirability aspect in MAGIC terminology) where stakeholder preferences can be particularly influential. For this QST, EU policy makers were included via interview and public statements in the identification of key themes and via workshops in interpreting the SMA outputs and their implications.
3. Results
The results focus on the formal steps outlined in Section 2.1 above, illustrating the range of analyses possible when using SMA. The entry point for the analysis of the CAP and EU sustainability started with characterising the flows of EU support funding against farm-types, as representations of production systems.
3.1. CAP Funding and Farm Incomes
The first chord diagram (Figure 2) presents a Member State (MS) level summary of the relative farm net income (FNI) as a simple representation of the financial outcomes for agriculture. (Note that no single financial measure is ideal due to variations in how business accounting is undertaken between MS. FNI was chosen as it includes both the value of the outputs (flows) and the fixed costs of their production (funds of labour, machinery and infrastructures)) The figure also breaks down FNI the by farm type highlighting the mix and relative financial extents of production systems across MS. The figure highlights the financial importance of livestock systems in particular dairy (s.Milk) but also mixed crops and livestock (m.C&L), granivores (s.Gran), cattle (s.Cat) and sheep and goats (s.S&G) but also the importance of production systems such as wine (s.Win), olives (s.Olv), orchard and fruit (Or&F) and horticulture (s.Hort).
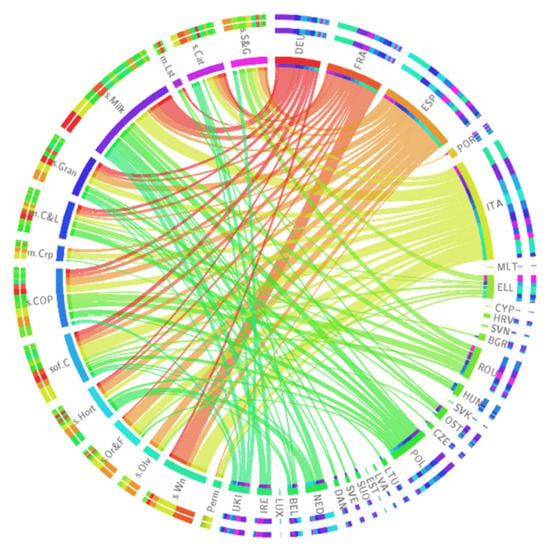
Figure 2.
FNI 2014–2017 by Member State and farm type.
The second chord diagram (Figure 3) makes use of the same basic data but in this case selects only combinations of MS and farm types for where FNI is negative once CAP subsidies are removed. This visualisation highlights where CAP is likely significant in maintaining these production systems in their current form (that is extent, numbers of businesses and/or management regimes). There is the need for care in interpreting the figure since the values of France are too low because of accounting conventions, yet the figure is still striking in highlighting that specialist cereals, oilseeds and protein crops (s.COP) is more marginal than would be expected in terms of its mechanisation and intensity of management. The negative FNI values are also prominent in many livestock production systems—though notably less so for granivores (a historically unsupported production system) and to a lesser degree for dairy (though it is worth considering how many smaller dairy farms have been eliminated or have changed to other production systems). The FADN datasets provide a wealth of financial data that can be used to derive a wide range of detailed accounting metrics, but the two chord figures provide enough of a financial context from which the physical aspects of the societal metabolism analysis can be interpreted with stakeholders.
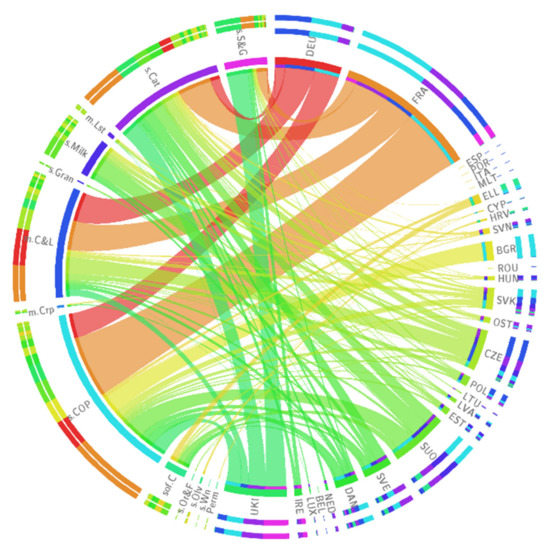
Figure 3.
FNI minus CAP 2014–2017 negatives only by Member State and farm types.
3.2. Competitiveness
Following on from the CAP funding analyses, the semantic analysis of CAP policy and other stakeholder narratives highlighted increasing farm business competitiveness as a key CAP objective but that this is likely to conflict with delivery of public (non-market) goods [66]. In the narratives there were a range of possible interpretations of what competitiveness means (profitability, growth, etc.). Yet, a frequently recurring idea links competitiveness with efficiency and this can be expressed in metabolic terms as the objective of achieving the same outputs with fewer inputs or reducing waste and thus pollution. Such analyses can be conducted using system experiments or case studies but how such best practice examples play out at large is difficult to judge, particularly if other changes such as increases in extent of production that mean efficiency gains are lost, i.e., Jevon’s paradox as discussed by Polimeni et al. [67].
Within the FADN dataset there is data to support some limited assessments of efficiency in physical terms. The strongest example was for specialist cereal holdings (Sp.COP) illustrated in Figure 4. Here, the yields per ha (for all MS) and the N fertiliser inputs per ha, for most MS) are linked with total subsidies (the half-moons indicate those MS where fertiliser data were missing). Note that the limitations of FADN mean it is not possible to know if the listed tonnage of fertiliser is used on any specific crop. For s.COP, though, there is greater likelihood the fertiliser is used on relevant crops as other crops make up smaller areas and/or have lower financial outputs. Ideally, crop specific management regimes would be specified but the aggregate outcomes still raise interesting questions on the role of CAP for efficiency.
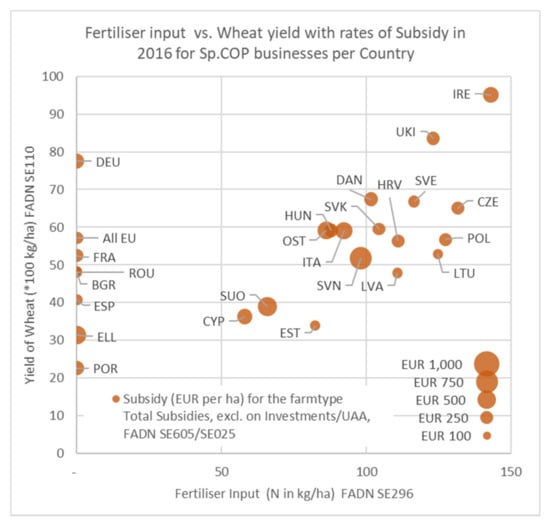
Figure 4.
The relationship between input and output intensity for wheat and the average support per ha provided by subsidy for Sp.COP businesses in 2016.
The figure highlights a key feature of EU agriculture that, in many cases (on aggregate), Sp.COP production systems are arranged on a pareto-optimal front that defines the “best possible” relationship between inputs and outputs. There is no apparent free lunch to be had from changes in efficiency for many MS, as outputs are limited by the rate of artificial inputs. The long-term sustainability of such yields and the shape of the pareto-optimal front may also be questioned if other funds (such as soil biota) or levels of impacts (e.g., via diffuse pollution) were to be included within the metabolism analysis. There is some room for “improvements” by some MS to move toward the “front”—achieving the same outputs with fewer inputs (reducing impacts), delivering more with the same inputs (being more efficient) or a combination of both. Given most of the MS off the front are Fifth Enlargement (2004 accession) States with lower rates per ha of subsidy, there may be a case that higher subsidies can lead, over time, to greater physical efficiency (either through investment by businesses or though MS having greater leverage via regulation). It is worth noting that the data is for 2016 a notably poor yield year for many nations (e.g., France) and recent additions of more complete N statistics has likely meant the analysis could now be more comprehensive.
3.3. Resource Use and Pressures
The data within FADN can also be used within the SMA to provide interpretations for production systems in terms of the extents of resource use (the shares of funds such as land, labour and capital used) and pressures placed on the natural environment (e.g., from the levels of inputs used). The former highlights the overall extent of “take” by the systems and/or the mix of production systems within regions and the latter begin to establish intensity of pressures and the degree to which outputs are driven by or depend on external inputs.
3.3.1. Extents—Use of Funds
For the CAP and EU sustainability linked to SDG2 the analysis looked at the use of land, labour, and capital per MS for the farm types. Three chord diagrams Figure 5, Figure 6 and Figure 7 are used to present the breakdowns, again highlighting the relative magnitude of production systems and the mix of MS physical funds being used. The key limitation on the analysis from a metabolic perspective is that capital (i.e., machinery, buildings, and other infrastructure) is only available as financial value (EUR) rather than physical values such as areas, embodied materials or power capacity (kW).
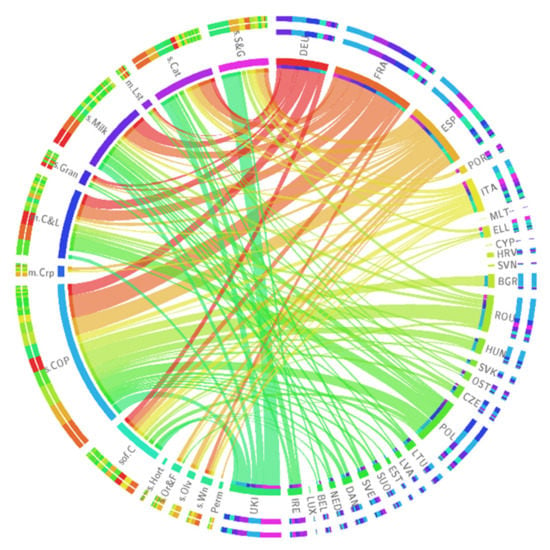
Figure 5.
UAA 2017—by Member State and farm type.
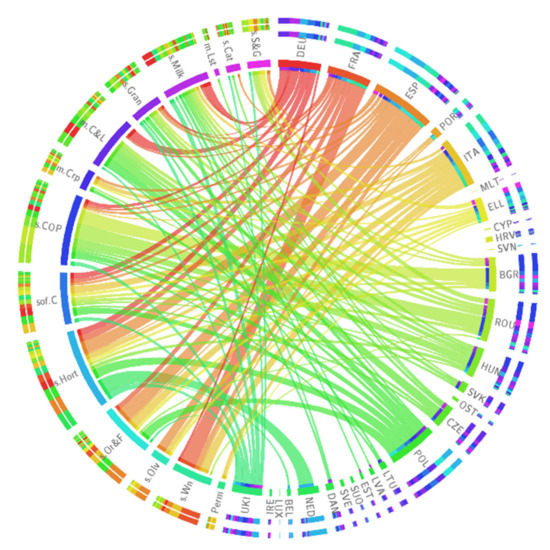
Figure 6.
Hours of labour 2014–2017 by Member State and farm type.
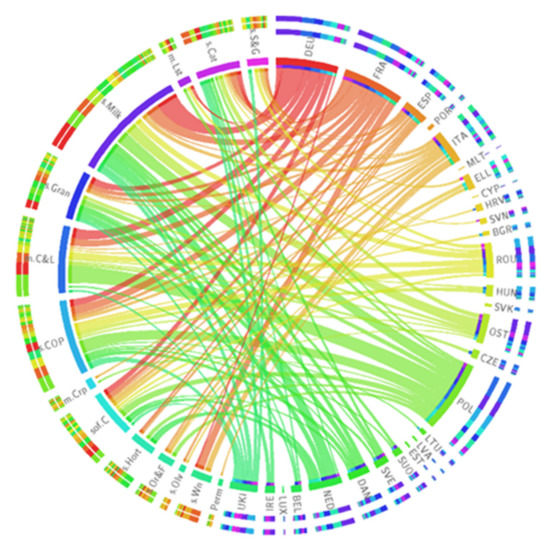
Figure 7.
Capital—machinery and buildings value in EUR, 2017.
Figure 5 highlights the relative extents of cropping and livestock-based systems in the EU, with s.COP holdings having the largest single entry, with relatively small extent of holdings associated with high value fruit and vegetable and related production systems. Individual MS are dealing with very different mixes of production systems and pressures (the right-hand outer rings per member state) with the inevitable challenges that this means for creating EU-level overarching policy frameworks that are effective, non-discriminatory and locally acceptable.
Labour analyses confirm the well-known statistics of agricultural employment. Even at even regional level agriculture is rarely (10 of 121 NUTS2 regions) more than 20% of the workforce and for the majority (61 of 121) is less than 5%. Yet, agriculture employment is distinctive with family labour still predominant and for some production systems dependent on seasonal and often migrant labour. Figure 6 provides a high-level view of how large the fund of human time is per MS and how it is deployed across the mix of production systems. Field fruit, vegetable, olive and wine production systems (specialist other field crops (sof.C), specialist horticulture (s.Hort), orchards and fruit (Or&F), specialist olives (s.Olv) and specialist wine (s.Wn)) account of ~50% of the labour used compared with 15% of land, with s.COP seeing much lower levels of labour needs where machinery can be more easily substituted (if not always profitably).
Figure 7 highlights those sectors where more intensive production systems have become the norm—e.g., s.Milk, and systems that overall have lower reliance on buildings and machinery e.g., s.Catt and s.S&G. Within cropping-based systems, in contrast with land where the s.COP farm type was the most extensive, there is more capital tied up in generating fruit (s.Or&F), vegetables (s.Hort), and other field crops (s.of.C). For MS, the contrast is between those like the Netherlands and Austria which feature more prominently in the capital than in the labour charts and those such as Spain that make less use of capital.
3.3.2. Intensity—Pressures—Crop Based Systems
FADN has several variables from which it is possible to assess the intensity of agricultural management and from this make a high-level interpretation of pressures. These characterisations are most relevant to crop-based production systems or the grazing/forage components of livestock systems. Livestock themselves need a more complex analysis (see Section 3.3.3, next). Again, using the chord diagram, Figure 8, it is possible to generate an overall view of the use of fertilisers per MS and the production systems in which the fertilisers are used, noting the extent of nitrogen fertilisers for s.COP systems. The extent and intensity map (Figure 9) breaks down fertiliser use at NUTS2 scale in terms of overall use of fertilisers and average rate per ha providing a more detailed view within MS than the chord diagram permits. This highlights that for N fertilisers the highest rates (>110 kg/ha) are heterogeneously distributed across the EU but with a degree concentration in NW Europe. More detailed versions of the mapping per farm type have also been created and can be accessed from an online web-mapping application (accessed 6 September 2021).
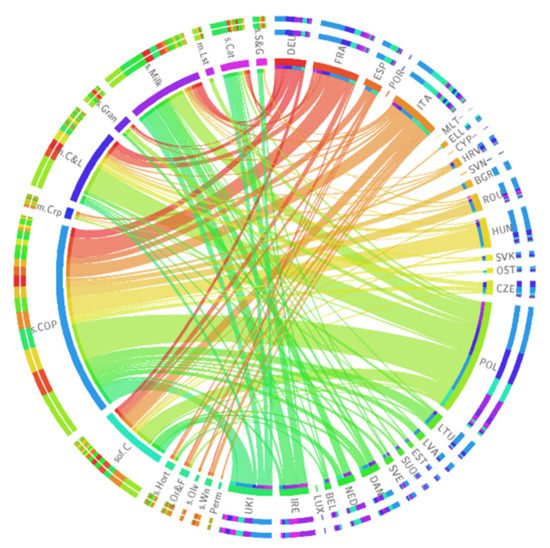
Figure 8.
N use tonnes 2014–2017 Member State and farm type.
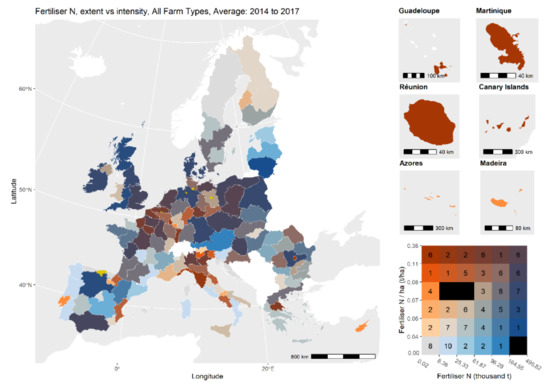
Figure 9.
Extent versus intensity map for nitrogen fertiliser use.
Pressures from other fertilisers such as phosphorous are also supported by the FADN data. Analysis of pressures from crop-protection use (e.g., herbicides and pesticides) is possible but is compromised since this is recorded in financial (EUR) not physical or ecotoxicity terms (see Viglia et al. [68] for options) and has the same issues of per crop attribution as for fertilisers Crop protection would also be challenging to record given the variety of products, their specificity for production systems and the range of active ingredients, but their rates of use and a measure of their ecotoxicity such as used in emergy analysis would provide a much better representation of pressures.
3.3.3. Intensity—Pressures—Livestock Systems
The benefits of SMA are more apparent when considering more complex production systems such as the rearing or finishing of livestock. The complexities include the need to consider the use of on-farm versus bought-in resources, this means the need to know for farm types what use is made of plant derived resources and whether they are sold or used as feed (e.g., for grains). Data to support this material flow accounting is available in FADN for a wide range of crops, most often in physical terms (tonnages) but disappointingly the weakest of the data are for grass production and usage, which in some cases is unreliable and in others missing. This limits the potential for understanding how much of livestock feed is derived on farm or even within some MS.
The on-farm usage needs to be squared with the overall dietary needs of livestock and from this can be estimated the bought-in feedstuffs (especially sources of protein) which are not explicitly accounted for in FADN in physical terms. The physical values can then inform judgments on the intensity or footprint of livestock systems (in terms of their embodied resources) and the degree of dependence on external resources (with security implications). The options for livestock diets are very diverse and, as noted in Section 2.1, the GLEAM model and a variety of other sources were used as a basis for the technical coefficients used in the metabolism accounting. Scaling from regional farm-type mixes to MS and then for the EU it is possible to estimate the footprints of the various livestock production systems.
There is also the need to account properly for maintaining the breeding herd (a fund) as an overhead on the cattle sent for slaughter (a flow) and the movement of livestock between holdings at various life stages. The latter can mean businesses that buy-in mature livestock for finishing (the final stage before slaughter) can appear very efficient as they bear none of the overheads. Analysis of the whole production system can be more informative but can be challenging especially where livestock move between MS). The FADN livestock numbers are adequate to make aggregate analyses but more detailed data, e.g., from cattle tracing schemes, would be needed to make more specific attributions within farm-types, e.g., between specialist cattle breeders and finishers.
The livestock metabolism analyses have advanced the depth and sophistication of the SMA of large scale (EU) systems significantly but the quality of forage data, the limitations of the livestock breed/size data and the need to make diet assumptions means the need for caution when drawing strong conclusions from the data. As proof of concept, it does though demonstrate the kinds of metabolic analyses that are possible using FADN, crucially linking crop and livestock-based systems.
Despite these limitations, the outputs raise serious concerns of how CAP and EU sustainability policies are enacted and evaluated. The concerns occur at a range of scales. Figure 10 illustrates that at EU level the volumes of imported agricultural commodities are dominated by livestock feeds (oilmeals, oilseeds and maize) from countries where there are serious land use sustainability concerns with both environmental and social dimensions (Brazil and Argentina) and security concerns (Ukraine). It is also perhaps worth considering the footprints of sugar from sub-Saharan Africa and Less Developed Countries and the vegetable (palm) oils from SE Asia but these are more likely driven by human diet choices.
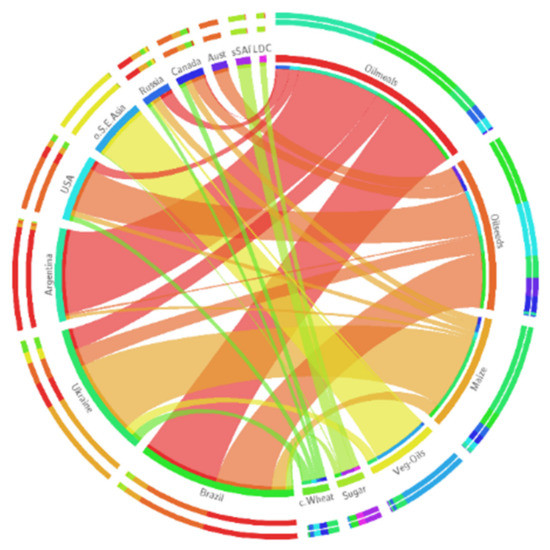
Figure 10.
Imports to the EU (tonnes).
Sectorally, within the EU, the use of imported foodstuffs is dominated by granivores since in aggregate they make little use of grazing lands, but dairy and specialist cattle systems (especially finishing) can be dependent on imports. The map in Figure 11 highlights the extents (quantities) and intensity of use (per ha) of imported livestock feeds, noting the regions with particularly high usages in both senses (e.g., UK, Netherlands and Denmark). In terms of sustainability, the intensity of use of feeds creates local issues of water management and water quality since stock rates can be so much higher. However, the overall extent of imported livestock feed also needs to be considered since this sets the magnitudes of impacts beyond the EU’s borders.
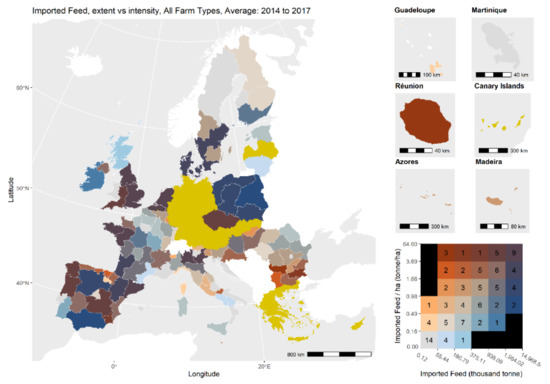
Figure 11.
Extent versus intensity map for feed—imported forage crops (non-domestic).
The specific footprints of the imported livestock feeds can to a degree be estimated, i.e., Brazil and USA oilmeals will have very different embodied mix of funds and flow materials. At a regional or production systems granularity within the EU it is not, though, possible to know the specific footprint for livestock feeds since the source(s) of materials within and beyond the EU cannot be known. It is possible to make counter-factual assessments of what the resources needed to replace the imports would be with local resources, see Cadillo-Benalcazar et al. [43] and Renner et al. [52].
3.4. Draw on Natural Resources—Water
Localisation of pressures as the draw on natural resources in the biosphere and the linking of such pressures with production systems are further components of SMA. The CAP and EU sustainability analyses complemented other studies in the wider MAGIC project of looking at water, energy and food and environment nexus [41]. For the CAP and EU sustainability objectives study, it was possible to use the FADN data to support analyses of green and blue water, both locally and embodied in imported commodities. Green water refers to precipitation that is temporarily stored in the soil and on top of vegetation and is used by crops and natural vegetation for growth. Blue water refers to surface and groundwater which can be diverted and channelled for use in irrigation, industries, or in households Figure 12 uses the example of blue water use for crops (mainly irrigation), and as expected MS with large areas in southern Europe and those MS undertaking vegetable cultivation (specialist other field crops—sof.C) have substantial requirements. The diversity of cropping and livestock production systems that make larger use of blue water is perhaps surprising (noting that the figure is only their use for the crop-based parts of the systems)—but perhaps reflects the desire to conduct activities or maintain higher levels of production per ha than would otherwise be possible.
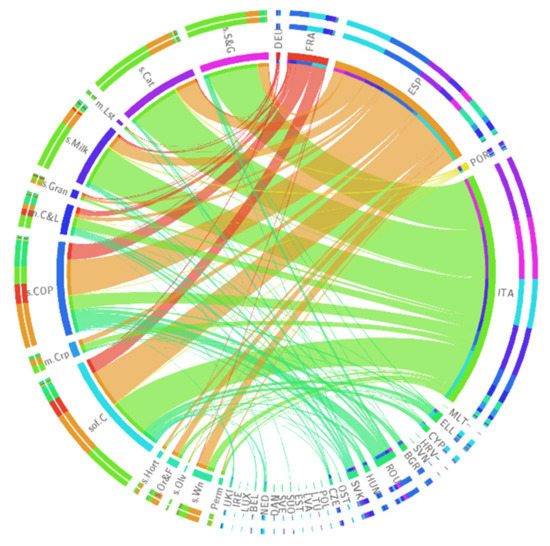
Figure 12.
Water—blue, local, crops.
Interpretation of these results does need to be undertaken carefully since the consequences of the draw on natural resources, while desirable to include within an SMA, depends on linking with other studies. For example, agricultural production systems that rely on irrigation can be highly productive and can be sustainable when water abstractions remain below maximum sustainable levels [23,69]. The level that can be sustained depends on natural recharge and flow rates and environmental water requirements that vary in time and are uncertain. When such systems exceed these maximum sustainable levels, they tap into water flows that are needed to preserve aquatic ecosystems and deplete or ultimately exhaust water stocks in the longer term. Stocks is used here to differentiate funds that are renewed regularly (e.g., by winter rains or snow melt) from stocks of “fossil” water that is either not being renewed or is replaced at rate that means it is in effect non-renewable in the timescales being considered).
Figure 13 used data from Schyns et al. [70] to summarise the use by crop based systems of green water in both extent and intensity for the NUT2 regions. The intensity measure is the percentage of available green water being used once allowance was made for necessary ecological green water flows. These represent the green water flows tied to priority areas to be set aside for biodiversity conservation. What is most stark in this mapping is the pressures being exerted by the NW regions of the EU on the available green water resources, with the use percentage being close to or even exceeding 100% (the maximum sustainable level) in some cases. This means that further increased use of green water (to produce more food) is hardly possible without adversely affecting terrestrial ecosystems. Taken together, the reliance of MS in the South on scarce blue water resources and of MS in the NW on scarce green water resources highlight the precarious security of water supply for agricultural production systems in the EU. This suggests that adjustments to the CAP and other policies are needed to curb the pressure of agricultural system on freshwater, while also making these systems more resilient to water-related shocks, especially with less reliable rainfall under climate change.
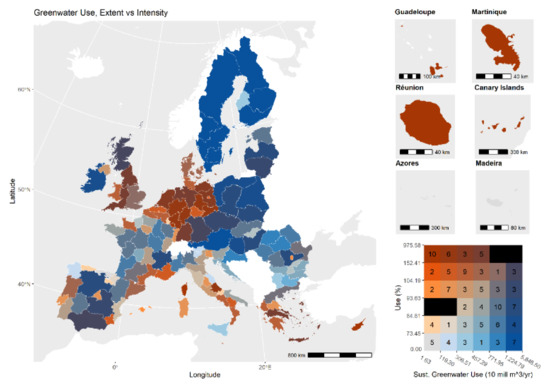
Figure 13.
Green water use vs. the percentage of green water available that is being used.
4. Discussion
The results have illustrated a range of financial and material metrics that arose from implementing an SMA with the FADN data set. These results illustrate several troubling examples whereby the objectives for SDG2 and the CAP seem out of reach. The discussion considers how these results could be further developed to support science–policy interactions.
4.1. Linking SMA and Impacts Using FADN
Impacts are the consequences of the use of funds, the mix of production systems, the flows of resources (natural and artificial) and the draw on the resources of the biosphere. These are conceptually part of societal metabolism accounting but within this part of the MAGIC project, progress linking pressures and impacts was limited to making correlational linkages e.g., with State of the Environment reporting [71], Water Framework Directive (WFD) monitoring data [72] or other biophysical modelling e.g., soil erosion [73] at regional scales. Such mapping was useful in highlighting regions where there are most serious issues, opening-up interpretation of the societal metabolism of the region using the FADN data. Conducting the SMA using the FADN data and doing so spatially provided insights that, when combined with knowledge from other SMA studies [41], helped illustrate the need for, and utility of, the shift from FADN to a Farm Sustainability Data Network under the Green Deal [8].
Quantifying impacts and attributing them to production systems requires making specific linkages between the extent and intensities of pressures and the environment in which this occurs. The same pressures can have very different impacts depending on the resilience of the biosphere. Higher levels of geographical granularity are not a panacea though, since aggregate outcomes can also depend on the mix of production systems present in, for example, a catchment, with smaller numbers of more intensive systems potentially buffered by the presence of other extensive production systems. Linking societal metabolism and impact is thus an inherently multi- or cross-scale endeavour.
The FADN dataset, being a survey rather than a census, has limitations in making the linkages from production systems to impacts. Working with individual holdings within FADN is possible and would have potential to generate per holding ranges of impacts, but the lack of mapped extents of holdings might still limit the spatial specificity that could be achieved. Even if all individual holdings were characterised, the challenge would remain of extrapolating from thousands of “microscopic” views to a population wide assessment. FADN does have data on the overall numbers of holdings present for each of the farm types in regions and therefore does have the potential to characterise the pressures from the mix of production (as seen here for NUTS2 regions). In this regard, making summaries of the FADN holdings data available in a more flexible way using a variety of geographies beyond administrative boundaries may be particularly beneficial—for example by river basins or ecoregions. The more specific the geographical region however, the smaller the number of sample holdings and the less reliable the characterisation of farm-types present. This may point to the need for overall larger numbers of FADN holdings to be recruited if FADN is to be effective in moving towards having a greater role in assessing progress towards EU sustainability goals.
Supplementing the FADN with EU-wide spatially explicit mapping of individual holdings (e.g., from Integrated Administrative and Control System and Land Parcel Identification System) with farm types assigned would also provide an extrapolation framework for better linking farm systems with environmental data. Indeed, compiling a spatially explicit pan-EU dataset, with basic holding level data on intensity of use, to act as an extrapolation and attribution framework has potential.
4.2. The Wider Context—Societal Demand
This paper focused on production systems and agricultural commodities (the middle level of the focal scales illustrated in Figure 14). The figure highlights the need for the sustainability of agri-food system to be considered from other non-equivalent perspectives and that the openness (use of imports and exports) at these levels also needs to be considered in any sustainability assessment. Societal demand via diet preferences and social practices sets the extent and product mix to which agricultural systems are responding to. Demand has been studied using SMA [43,52] highlighting regional differences in demand within the EU, reflecting food cultures and the degree of dependence on external sources. Assumptions of only moderate scarcity for human food stuffs in wealthier western nations have been valid for a considerable period, but it may not be wise to assume this will always be the case. Re-internalisation of production is nether feasible in terms of the land available (without drastic diet change) nor viable given it is unlikely that the required labour could be made available [43,52]. This global footprint of EU consumption has not yet been well accounted for in the assessment of EU agri-food sustainability, but is being recognised in initiatives to protect tropical rainforests and the Cerrado savannah [74].
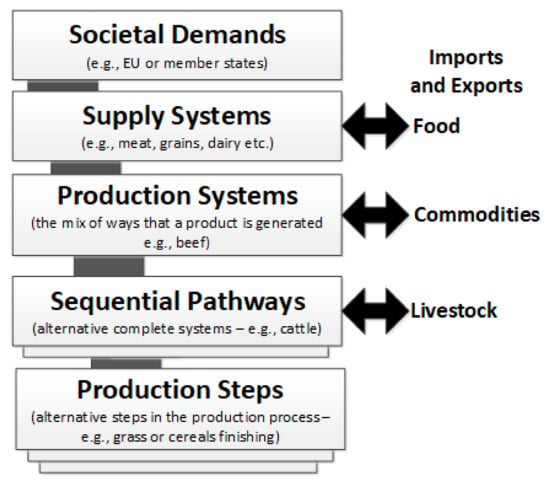
Figure 14.
Focal scales for agri-food systems sustainability analysis.
Furthermore, studies such as Heller [75], highlight that up to 80% of the materials and energy used in the agri-food systems occurs beyond the farm gate, i.e., in the processing, transport, retail and service provision sectors. Some of these interconnections are recognised in initiatives such as the EU Farm-to-Fork Strategy [76] but MS and the EU still have a strong policy focus on growth rather than the much less popular ideas of moving towards sustainable consumption, when this actually means less consumption. These issues raise questions of desirability of outcomes that mean any sustainability assessment must, of necessity, be embedded in socio-political processes of deliberation such as QST and their scope goes well beyond that which is incorporated in the FADN datasets.
4.3. A Narrower Focus—The Role of Technology
The other two focal scales below production systems in Figure 14 relevant to the SMA are the production steps and the sequential pathways. These levels are more specific representations of how individual enterprises within farm businesses are conducted, with production steps defining alternative ways of conducting an activity (e.g., grass rather than cereal finishing of cattle) and the sequential pathway being a series of production steps that define a complete enterprise such as raising beef cattle. Here, the diversity of management practices (with their varying consequences for productivity or environmental impacts) can be assessed. In the study being reported here the representation in FADN of the diversity of technology and management systems was limited but SMA studies can look in much more detail at alternative management. The more specific and localised the systems, the easier it is to be certain on the technical coefficients and the specific outcomes of new systems for both production and impacts. Yet, there is a trade-off. Studies at such scales cannot judge the range of applicability, the acceptability and therefore the significance of proposed changes at the EU scale, especially if change could have unforeseen rebound effects. In the discussion with policy stakeholders, changes in technology and management systems (e.g., sustainable intensification) were often seen as preferable means of increasing the sustainability of production systems, with an emphasis on either efficiency or win–win outcomes, for example citing benefits of organic production. Using SMA for production steps or sequential pathways may have been preferred given the greater level of certainty that can be presented for individual components of the complex agri-food system. Such results might also be more politically palatable, since they do not involve clear trade-offs, the need to increase policy coherence within the EU or the need for more effective coordination on implementation of policies within MS. The interpretation of FADN based SMA in the context of policy coherence is further elaborated in [63,77].
4.4. Discussion in the Context of the Special Issue Call
The call text of the special provides a detailed framing of, and key challenges for, sustainable agricultural land management (SALM).
[…] identify best practice examples of SALM ready for upscaling; present new frameworks, methods and principles to evaluate SALM; and highlight key knowledge gaps and future research agendas.
This paper illustrates the benefits, challenges, and remaining further steps involved in using SMA with FADN data to evaluate SALM across Europe. The pan-EU analysis using the FADN datasets and SMA highlights the challenges of identifying best-practice and readiness for upscaling. The ability to conduct detailed case-based analysis of technologies and managements regimes, even replicated at multiple locations, is not a guarantee of their widespread feasibility, long term viability or their socio-political desirability. There is a need to link the case-based studies with their context in a flexible and extensible way. However, many simulation models pre-define the possible answers through their ontologies (valuing only what we can model) or become so complicated that they become “integronsters” [78]. Furthermore, many detailed studies do not question totemic concepts like efficacy and growth as adequate responses to the sustainability challenges faced.
From the FADN study the knowledge (data) gaps lie in having adequate representations of intensity of management and farm-types at geographical and sectoral granularity so it is possible to make more direct linkages between management practices, pressures, and their impacts. Such datasets will need to have coverage that allows such studies to be conducted across spatial extents with meaningful implications for ecosystem functions (at a minimum landscapes and river basins). The desirability of adding more physical measures to the FADN datasets is clear. Priorities are a better representation of crop protection use (to allow assessment of ecotoxicity of the products being used); energy use (recording the specific types or mix of energy carriers, e.g., for heating) and capital (buildings, infrastructure and machinery that each imply a separate metabolic footprint). The social and cultural dimensions of production systems and the motivations of land managers are noted as FADN data gaps by Kelly et al. [33] and thus did not form part of the SMA reported here but issues of desirability from multiple perspectives were included qualitatively in the QST deliberations. Agriculture is a dominant land use in most countries, requiring and impacting on multiple natural resources (soil, biodiversity, water, etc.).
The examples presented here reinforce the conclusion that agriculture is a dominant influence in terms of extent (area) and in the pressures that it can impose on natural systems both within and beyond the EU’s borders. The form and degree of that dominance varies in space and the consequences of that dominance are heterogenous, the outcome of complex relationships between the mix of production systems and their local environment. The dominance of agriculture in rhetorical, and in some cases political, terms is also worth noting (compare the CAP spend with other EU funding). No other sector with such an insignificant economic value (considering the primary production only) and limited employment (both the extent and quality of jobs) exerts such influence. Yet the FADN study highlights that food security depends to a substantial degree on international trade beyond the EU. Therefore, agriculture’s special case in many regions may lie in its role in sustaining the sense of place within which the population live and undertake recreation.
New research and experimentation continues to reveal the level of integration and interconnections between agricultural management and the surrounding environment including effects on other land uses such as forestry, energy and urban development.
A range of frameworks are being developed to include this new knowledge of interactions to assess agricultural sustainability more holistically. Yet it is clear that this is challenging due to the complexity of interconnections. […] robust and consistent approaches would allow comparisons between systems and open up opportunities to improve sustainability at a larger scale.
The importance of issue framing recurred throughout FADN based sustainability analyses and in the wider range of studies of the MAGIC project, particularly when there were opportunities to deliberate on the research outcomes with stakeholders. Decisions on how sustainability issues are framed have arguably a more profound effect on any conclusions or policy decisions that can be reached than the specific nuances of how the analysis is conducted. After all, if a factor is left out of an evaluation, then it can have no influence. The special issue call authors also correctly highlight the need for analysis to be more holistic, but recognise the challenges this imposes in term of coping with complexity. This complexity takes many forms—the kinds of data that need to be marshalled, the contrasting epistemologies and ontologies of social, natural and computational researchers and the varying perspectives of stakeholders and decision makers. The need to present and reconcile together several non-equivalent perspectives on the same system in a way that generates insightful deliberation rather than panic is also a challenge.
In coping with these complexities, it is perhaps necessary to step back from expecting to eliminate uncertainty and being able to model, optimise, decide and implement. The complexity of these systems may mean that it is better to avoid errors of hypocognition by being vaguely right rather than precisely wrong. The multiple scales, sectors and actors present means the need for adaptive management and this in turn implies the need for new transdisciplinary processes of conducting research or more conceptually using the ideas of post-normal science [54]. The need for rigorous and conceptually consistent approaches is recognised by the authors and the SMA with FADN data, while demanding, has significant potential to operationalise the ambitions of the special issue to improve sustainability assessment at a larger scale.
5. Conclusions
The pan-EU sustainability assessments made in the context of assessing the role of EU agricultural policy in delivering SDG2 is an example of responding to the challenges highlighted by the special issue editors. The authors concur with their framing of the issues, in the dominance of agriculture as a land use, in the complex relationships that this has with the state of the environment and in the need for new frameworks and processes for sustainability science. The analysis presented here addressed some of these challenges and demonstrated a new way to approach sustainability assessments that has been received positively in interactions with science–policy stakeholders.
SMA provides a theoretical framework within which it is possible to construct systems of accounting that can be used for both diagnostic and simulation (counterfactual) analyses. SMA analysis can be effective in highlighting the main funds (land, labour or natural resources) on which the flows of resources maintaining social–ecological systems depend. Combining extents and intensities of resource use is also particularly useful in highlighting where rebound effects may occur. Related to this is the emphasis that SMA places on openness and externalisation and the need for care in ensuring that improvements in headline sustainability indicators are not simply the outcomes of having moved damaging activities beyond the EU borders. The use of multiple, non-equivalent perspectives (sectors and regions) or looking across scales within an SMA is also useful in highlighting where policy or governance challenges are likely to occur. As noted in the discussion, while SMA can include impacts within its methods, the challenge remains of how best to link pressures identifiable within SMA with local or regional environmental impacts. Spatially explicit mapping of management intensity at fine granularity remains a data gap.
The use of FADN data within the SMA was ground-breaking, being the first attempt to conduct detailed within-sector and spatially explicit analyses across the EU. Taking the old wine of FADN data and placing it in the new bottles of SMA enabled a wide variety of detailed analyses of both crop and livestock-based systems, and their interactions. The range of physical data included within the FADN database is substantial across both biosphere and technosphere. However, to better support sustainability assessments FADN needs to collect and retain more data with a physical basis, particularly for crop protection and energy use.
The QST process, while not the primary focus of this paper, is worth noting in the context of the special issue. The authors’ experience in other deliberative processes [79] and science–policy interface projects [80] translated well into conducting the transdisciplinary QST processes with the SMA outputs. While less frequent than ideal, the interactions with EU policy makers were effective in raising awareness of the potential for SMA combined with FADN, making enduring networks and building capacity (within the research teams). As with any new method there needed to be a process of credibility building and the framing and outputs of the SMA were challenged and deliberated on. When asked for how the analysis could be refined the focus was often on technical options (within production systems) despite the focus of the workshops being explicitly on policy coherence, highlighting externalisation and security implications. The authors’ experience emphasises that working with “uncomfortable knowledge” [81] is likely be to necessary if the potential of the frameworks, methods and principles contained in the special issue are to be realised at the science–policy interface.
Supplementary Materials
The following are available online at https://www.mdpi.com/article/10.3390/su131810080/s1, Figure S1: Chord (CIRCOS) diagram example. Figure S2. Ordering of countries in the chord diagrams. Figure S3. Relationship map example. Table S1. Farm type acronyms used in the chord figures.
Author Contributions
Conceptualization, K.B.M., K.L.B., K.A.W., A.R., J.C.-B., M.G. and J.F.S.; methodology, K.B.M., K.L.B., K.A.W., A.R. and J.C.-B.; software, D.G.M., D.H.W.-J., A.R. and J.C.-B.; formal analysis, K.B.M., A.R. and M.G.; investigation, K.B.M., K.L.B., K.A.W., D.G.M., D.H.W.-J., A.J.-B., A.R., J.C.-B., M.G. and J.F.S.; resources, K.B.M. and M.G.; data curation, D.G.M. and A.J.-B.; writing—original draft preparation, K.B.M., K.L.B., D.G.M., A.R. and J.F.S.; writing—review and editing, K.B.M., K.L.B., K.A.W., D.G.M., D.H.W.-J., A.J.-B., A.R., J.C.-B., M.G. and J.F.S.; visualization, K.B.M., D.G.M., D.H.W.-J., A.R., J.C.-B. and J.F.S.; project administration, K.B.M., D.G.M., A.J.-B. and M.G.; funding acquisition, K.B.M. and M.G. All authors have read and agreed to the published version of the manuscript.
Funding
This project was funded by the European Union’s Horizon 2020 Research and Innovation Pro-gramme under grant agreement No. 689669. The James Hutton Institute is supported by the Scottish Government’s Rural and Environment Science and Analytical Services Division (RESAS). Authors AR, JC-B and MG acknowledge financial support from the Spanish Ministry of Science and Innovation (MICINN), through the “María de Maeztu” program for Units of Excellence (CEX2019-000940-M).
Institutional Review Board Statement
Not applicable.
Informed Consent Statement
Not applicable.
Data Availability Statement
The data generated within the research is available from the MAGIC public repository at https://zenodo.org/record/4147095#.YTYKs51Kg2w (accessed on 16 November 2020) and https://zenodo.org/record/4143169#.YTYKy51Kg2w (accessed on 27 October 2020).
Acknowledgments
The present work reflects only the authors’ views, and the funding Agencies cannot be held responsible for any use that may be made of the information it contains.
Conflicts of Interest
The authors declare no conflict of interest.
References
- Cairns, R.; Krzywoszynska, A. Anatomy of a buzzword: The emergence of the water-energy-food nexus’ in UK natural resource debates. Environ. Sci. Policy 2016, 64, 164–170. [Google Scholar] [CrossRef]
- Giampietro, M.; Aspinall, R.J.; Ramos-Martin, J.; Bukkens, S. Resource Accounting for Sustainability Assessment: The Nexus between Energy, Food, Water and Land Use; Routledge: London, UK, 2014. [Google Scholar]
- Aragão, A.; Giampietro, M. An integrated multi-scale approach to assess the performance of energy systems illustrated with data from the Brazilian oil and natural gas sector. Energy 2016, 115, 1412–1423. [Google Scholar] [CrossRef]
- Chifari, R.; Lo Piano, S.; Bukkens, S.G.F.; Giampietro, M. A holistic framework for the integrated assessment of urban waste management systems. Ecol. Indic. 2018, 94, 24–36. [Google Scholar] [CrossRef]
- Giampietro, M. Anticipation in Agriculture. In Handbook of Anticipation: Theoretical and Applied Aspects of the Use of Future in Decision Making; Poli, R., Ed.; Springer International Publishing: Cham, Switzerland, 2018; pp. 1–35. [Google Scholar]
- Cadillo Benalcazar, J.; Giampietro, M.; Serrano-Tovar, T.; Bukkens, S.G.F. Food Grammar. In Resource Accounting for Sustainability Assessment: The Nexus between Energy, Food, Water and Land Use; Giampietro, M., Aspinall, R.J., Ramos-Martin, J., Bukkens, S., Eds.; Routledge: London, UK, 2014. [Google Scholar]
- United Nations. Transforming Our World: The 2030 Agenda for Sustainable Develpment. Resolution Adopted by the General Assembly on 25 September 2015. Available online: http://www.un.org/ga/search/view_doc.asp?symbol=A/RES/70/1&Lang=E (accessed on 1 June 2019).
- European Commission. Communication from the Commission to the European Parliament, the European Council, the Council, the European Economic and Social Committee and the Committee of the Regions. The European Green Deal. COM/2019/640 Final. Available online: https://eur-lex.europa.eu/legal-content/EN/TXT/?uri=COM%3A2019%3A640%3AFIN (accessed on 1 June 2020).
- Koff, H. Diaspora Philanthropy in the Context of Policy Coherence for Development: Implications for the post-2015 Sustainable Development Agenda. Int. Migr. 2017, 55, 5–19. [Google Scholar] [CrossRef] [Green Version]
- Le Blanc, D. Towards Integration at Last? The Sustainable Development Goals as a Network of Targets. Sustain. Dev. 2015, 23, 176–187. [Google Scholar] [CrossRef]
- Vasseur, L.; Horning, D.; Thornbush, M.; Cohen-Shacham, E.; Andrade, A.; Barrow, E.; Edwards, S.R.; Wit, P.; Jones, M. Complex problems and unchallenged solutions: Bringing ecosystem governance to the forefront of the UN sustainable development goals. Ambio 2017, 46, 731–742. [Google Scholar] [CrossRef]
- Kuhmonen, T. Systems view of future of wicked problems to be addressed by the Common Agricultural Policy. Land Use Policy 2018, 77, 683–695. [Google Scholar] [CrossRef]
- Pretty, J.; Benton, T.G.; Bharucha, Z.P.; Dicks, L.V.; Flora, C.B.; Godfray, H.C.J.; Goulson, D.; Hartley, S.; Lampkin, N.; Morris, C.; et al. Global assessment of agricultural system redesign for sustainable intensification. Nat. Sustain. 2018, 1, 441–446. [Google Scholar] [CrossRef]
- European Commission. The CAP: Have Your Say (Brussels, Belgium). 7 July 2017. Available online: https://ec.europa.eu/agriculture/events/cap-have-your-say_en (accessed on 7 November 2017).
- Janker, J.; Mann, S.; Rist, S. Social sustainability in agriculture—A system-based framework. J. Rural Stud. 2019, 65, 32–42. [Google Scholar] [CrossRef]
- European Commission. Commission Staff Working Document. Impact Assessment. Available online: https://eur-lex.europa.eu/legal-content/EN/TXT/?uri=SWD%3A2018%3A301%3AFIN (accessed on 1 June 2020).
- Gamero, A.; Brotons, L.; Brunner, A.; Foppen, R.; Fornasari, L.; Gregory, R.D.; Herrando, S.; Hořák, D.; Jiguet, F.; Kmecl, P.; et al. Tracking Progress Toward EU Biodiversity Strategy Targets: EU Policy Effects in Preserving its Common Farmland Birds. Conserv. Lett. 2017, 10, 394–401. [Google Scholar] [CrossRef]
- European Environment Agency. Greening Europe’ Agriculture. 2012, p. 5. Available online: https://www.eea.europa.eu/downloads/c9ed328a31e24445bc5203d656b98988/1395149974/greening-europe2019s-agriculture.pdf (accessed on 1 June 2020).
- European Environment Agency. Land and Soil in Europe, EEA Signals 2019. p. 60. Available online: https://www.eea.europa.eu/publications/eea-signals-2019-land (accessed on 1 June 2019).
- Hoff, H. Understanding the Nexus. Background Paper for the Bonn 2011 Conference: The Water, Energy and Food Security Nexus. Stockholm Environment Institute. 2011. Available online: https://www.sei.org/publications/understanding-the-nexus/ (accessed on 1 June 2019).
- Wiegleb, V.; Bruns, A. What is driving the Water-Energy-Food Nexus? Discourses, knowledge and politics of an emerging resource governance concept. Front. Environ. Sci. 2018, 6, 128. [Google Scholar] [CrossRef]
- Bidoglio, G.; Vanham, D.; Bouraoui, F.; Barchiesi, S. The Water-Energy-Food-Ecosystems (WEFE) Nexus. In Encyclopedia of Ecology, 2nd ed.; Fath, B., Ed.; Elsevier: Oxford, UK, 2019; pp. 459–466. [Google Scholar]
- Hoekstra, A.Y.; Wiedmann, T.O. Humanity’s unsustainable environmental footprint. Science 2014, 344, 1114–1117. [Google Scholar] [CrossRef]
- Rockstrom, J.; Steffen, W.; Noone, K.; Persson, A.; Chapin, F.S.; Lambin, E.F.; Lenton, T.M.; Scheffer, M.; Folke, C.; Schellnhuber, H.J.; et al. A safe operating space for humanity. Nature 2009, 461, 472–475. [Google Scholar] [CrossRef]
- Steffen, W.; Richardson, K.; Rockström, J.; Cornell, S.E.; Fetzer, I.; Bennett, E.M.; Biggs, R.; Carpenter, S.R.; de Vries, W.; de Wit, C.A.; et al. Planetary boundaries: Guiding human development on a changing planet. Science 2015, 347, 1259855. [Google Scholar] [CrossRef] [Green Version]
- Biggs, E.M.; Bruce, E.; Boruff, B.; Duncan, J.M.A.; Horsley, J.; Pauli, N.; McNeill, K.; Neef, A.; Van Ogtrop, F.; Curnow, J.; et al. Sustainable development and the water–energy–food nexus: A perspective on livelihoods. Environ. Sci. Policy 2015, 54, 389–397. [Google Scholar] [CrossRef] [Green Version]
- Rockström, J.; Williams, J.; Daily, G.; Noble, A.; Matthews, N.; Gordon, L.; Wetterstrand, H.; DeClerck, F.; Shah, M.; Steduto, P.; et al. Sustainable intensification of agriculture for human prosperity and global sustainability. Ambio 2017, 46, 4–17. [Google Scholar] [CrossRef] [PubMed] [Green Version]
- Mahon, N.; Crute, I.; Simmons, E.; Islam, M.M. Sustainable intensification—“Oxymoron” or “third-way”? A systematic review. Ecol. Indic. 2017, 74, 73–97. [Google Scholar] [CrossRef] [Green Version]
- Godfray, H.C.J. The debate over sustainable intensification. Food Secur. 2015, 7, 199–208. [Google Scholar] [CrossRef]
- Clay, N.; Garnett, T.; Lorimer, J. Dairy intensification: Drivers, impacts and alternatives. Ambio 2020, 49, 35–48. [Google Scholar] [CrossRef] [Green Version]
- Norström, A.V.; Dannenberg, A.; McCarney, G.; Milkoreit, M.; Diekert, F.; Engström, G.; Fishman, R.; Gars, J.; Kyriakopoolou, E.; Manoussi, V.; et al. Three necessary conditions for establishing effective Sustainable Development Goals in the Anthropocene. Ecol. Soc. 2014, 19, 8. [Google Scholar] [CrossRef] [Green Version]
- Scown, M.W.; Winkler, K.J.; Nicholas, K.A. Aligning research with policy and practice for sustainable agricultural land systems in Europe. Proc. Natl. Acad. Sci. USA 2019, 116, 4911–4916. [Google Scholar] [CrossRef] [PubMed] [Green Version]
- Kelly, E.; Latruffe, L.; Desjeux, Y.; Ryan, M.; Uthes, S.; Diazabakana, A.; Dillon, E.; Finn, J. Sustainability indicators for improved assessment of the effects of agricultural policy across the EU: Is FADN the answer? Ecol. Indic. 2018, 89, 903–911. [Google Scholar] [CrossRef] [Green Version]
- Green, S.; O’Donoghue, C. Assessing the geographic representativity of farm accountancy data. ISPRS Int. J. Geo-Inf. 2013, 2, 50–66. [Google Scholar] [CrossRef] [Green Version]
- Bradley, D.; Hill, B. Cost of and Good Practices for FADN Data Collection. 2015. Available online: http://publications.europa.eu/resource/cellar/a3feee1b-d47a-11e5-a4b5-01aa75ed71a1.0002.01/DOC_1 (accessed on 1 June 2019).
- Hennessy, T.; Kinsella, A. 40 Years of Irish Farming Since Joining the European Union: A Journey with the Teagasc National Farm Survey 1972 to 2012; Rural Economy and Development Programme, Teagasc. 2013. Available online: https://www.researchgate.net/publication/281093660_40_years_of_Irish_Farming_since_joining_the_European_UnionA_journey_with_the_Teagasc_National_Farm_Survey_1972_to_2012 (accessed on 1 June 2019).
- Uthes, S.; Heyer, I.; Kaiser, A.; Zander, P.; Bockstaller, C.; Desjeux, Y.; Keszthelyi, S.; Kis-Csatári, E.; Molnar, A.; Wrzaszcz, W.; et al. Costs, quantity and toxicity: Comparison of pesticide indicators collected from FADN farms in four EU-countries. Ecol. Indic. 2019, 104, 695–703. [Google Scholar] [CrossRef]
- Latruffe, L.; Mann, S. Is part-time farming less subsidised? The example of direct payments in France and Switzerland. Cah. Agric. 2015, 24, 20–27. [Google Scholar] [CrossRef]
- Latruffe, L.; Piet, L. Does land fragmentation affect farm performance? A case study from Brittany, France. Agric. Syst. 2014, 129, 68–80. [Google Scholar] [CrossRef]
- Uthes, S.; Kelly, E.; König, H.J. Farm-level indicators for crop and landscape diversity derived from agricultural beneficiaries data. Ecol. Indic. 2020, 108, 105725. [Google Scholar] [CrossRef]
- Giampietro, M.; Cadillo Benalcazar, J.J.; Di Felice, L.J.; Manfroni, M.; Pérez Sánchez, L.; Renner, A.; Ripa, M.; Velasco Fernández, R.; Bukkens, S.G.F. Report on the Experience of Applications of the Nexus Structuring Space in Quantitative Storytelling. MAGIC (H2020–GA 689669) Project Deliverable 4.4, Revision (Version 2.0). 2021, p. 93. Available online: https://magic-nexus.eu/documents/deliverable-44-report-nexus-structuring-space (accessed on 1 June 2019).
- Georgescu-Roegen, N. The Entropy Law and the Economic Process. Econ. J. 1973, 83, 551–553. [Google Scholar] [CrossRef]
- Cadillo-Benalcazar, J.J.; Renner, A.; Giampietro, M. A multiscale integrated analysis of the factors characterizing the sustainability of food systems in Europe. J. Environ. Manag. 2020, 271, 110944. [Google Scholar] [CrossRef]
- FAO. Global Livestock Environmental Assessment Model: Model Description, Version 2.0. 2017. Available online: http://www.fao.org/fileadmin/user_upload/gleam/docs/GLEAM_2.0_Model_description.pdf (accessed on 1 June 2019).
- FAO. FAO GLEAM Database. Global Livestock Environmental Assessment Model v2.0; Data Reference Year 2010, Revision 5, July 2018; FAO: Rome, Italy, 2018. [Google Scholar]
- Eurostat. Animal Populations by NUTS 2 Region. Available online: https://ec.europa.eu/eurostat/web/products-datasets/product?code=AGR_R_ANIMAL (accessed on 14 July 2020).
- FAO. FAOSTAT of the Food and Agriculture Organization of the United Nations. Available online: http://www.fao.org/faostat/en/#home (accessed on 19 December 2018).
- Chatterton, J.; Hess, T.; Williams, A. The Water Footprint of English Beef and Lamb Production: A Report for EBLEX. 2010. Available online: http://dspace.lib.cranfield.ac.uk/handle/1826/5425 (accessed on 1 June 2019).
- Mekonnen, M.M.; Hoekstra, A.Y. The green, blue and grey water footprint of crops and derived crop products. Hydrol. Earth Syst. Sci. 2011, 15, 1577–1600. [Google Scholar] [CrossRef] [Green Version]
- FAO. FAOSTAT Commodity List. Available online: http://www.fao.org/economic/ess/ess-standards/commodity/en/ (accessed on 14 December 2019).
- Renner, A. Quantitative Storytelling on an Agricultural Internalization; Chapter 5 in Supercritical Sustainability: A Relational Theory of Social-Ecological Systems with Lessons from a Disenfranchised European Primary Sector; Autonomous University of Barcelona: Barcelona, Spain, 2020. [Google Scholar]
- Renner, A.; Cadillo-Benalcazar, J.J.; Benini, L.; Giampietro, M. Environmental pressure of the European agricultural system: Anticipating the biophysical consequences of internalization. Ecosyst. Serv. 2020, 46, 101195. [Google Scholar] [CrossRef]
- Krzywinski, M.I.; Schein, J.E.; Birol, I.; Connors, J.; Gascoyne, R.; Horsman, D.; Jones, S.J.; Marra, M.A. Circos: An information aesthetic for comparative genomics. Genome Res. 2009, 19, 1639–1645. [Google Scholar] [CrossRef] [PubMed] [Green Version]
- Mayumi, K.; Giampietro, M. The epistemological challenge of self-modifying systems: Governance and sustainability in the post-normal science era. Ecol. Econ. 2006, 57, 382–399. [Google Scholar] [CrossRef]
- Saltelli, A.; Giampietro, M. What is wrong with evidence based policy, and how can it be improved? Futures 2017, 91, 62–71. [Google Scholar] [CrossRef]
- Cash, D.; Clark, W.; Alcock, F.; Dickson, N.; Eckley, N.; Jager, J. Salience, Credibility, Legitimacy and Boundaries: Linking Research, Assessment and Decision Making; KSG Working Paper Series; John F. Kennedy Schools of Government, Harvard Univesity: Cambridge, MA, USA, 2002. [Google Scholar]
- Matthews, K.B.; Rivington, M.; Blackstock, K.L.; McCrum, G.; Buchan, K.; Miller, D.G. Raising the bar?—The challenges of evaluating the outcomes of environmental modelling and software. Environ. Model. Softw. 2011, 26, 247–257. [Google Scholar] [CrossRef]
- Giampietro, M.; Funtowicz, S.O. From elite folk science to the policy legend of the circular economy. Environ. Sci. Policy 2020, 109, 64–72. [Google Scholar] [CrossRef]
- Saltelli, A.; Benini, L.; Funtowicz, S.; Giampietro, M.; Kaiser, M.; Reinert, E.; van der Sluijs, J.P. The technique is never neutral. How methodological choices condition the generation of narratives for sustainability. Environ. Sci. Policy 2020, 106, 87–98. [Google Scholar] [CrossRef]
- Renner, A.; Giampietro, M. Socio-technical discourses of European electricity decarbonization: Contesting narrative credibility and legitimacy with quantitative story-telling. Energy Res. Soc. Sci. 2020, 59, 101279. [Google Scholar] [CrossRef]
- Cabello, V.; Romero, D.; Musicki, A.; Pereira, Â.G.; Peñate, B. Co-creating narratives for WEF nexus governance: A Quantitative Story-Telling case study in the Canary Islands. Sustain. Sci. 2021, 16, 1363–1374. [Google Scholar] [CrossRef]
- Cadillo-Benalcazar, J.J.; Bukkens, S.G.F.; Ripa, M.; Giampietro, M. Why does the European Union produce biofuels? Examining consistency and plausibility in prevailing narratives with quantitative storytelling. Energy Res. Soc. Sci. 2021, 71, 101810. [Google Scholar] [CrossRef]
- Blackstock, K.L.; Waylen, K.A.; Matthews, K.B.; Juarez-Bourke, A.; Miller, D.G.; Wardell-Johnson, D.H.; Hague, A.; Giampietro, M. Implementing post-normal science with or for EU policy makers: Using Quantitative Story Telling to discuss the Common Agricultural Policy and Sustainable Development Goal 2. Sustain. Sci. 2021. in preparation. [Google Scholar]
- Waylen, K.A.; Blackstock, K.L.; Juarez-Bourke, A.; Hague, A.; Voelker, T.; Matthews, K.B.; Miller, D.G.; Wardell-Johnson, D.H. Questioning the roles of scientific experts in science-policy interfaces: Reflections from our work on the Water-Energy-Food ‘nexus’. Environ. Sci. Policy 2021. in preparation. [Google Scholar]
- Matthews, K.B.; Blackstock, K.L.; Rivington, M.; Waylen, K.A.; Miller, D.G.; Wardell-Johnson, D.; Kovacic, Z.; Renner, A.; Ripa, M.; Giampietro, M. Delivering more than the “Sum of the Parts”: Using Quantitative Storytelling to address the challenges of conducting science for policy in the EU land, water and energy nexus. In MODSIM2017, 22nd International Congress on Modelling and Simulation. Modelling and Simulation Society of Australia and New Zealand; Syme, G., Hatton MacDonald, D.F.B., Piantadosi, J., Eds.; 2017; p. 7. Available online: https://www.mssanz.org.au/modsim2017/Keynote/matthews.pdf (accessed on 1 June 2019).
- Vatn, A. Environmental Governance—From Public to Private? Ecol. Econ. 2018, 148, 170–177. [Google Scholar] [CrossRef]
- Polimeni, J.M.; Mayumi, K.; Giampietro, M. Jevons’ Paradox and the Myth of Resource Efficiency Improvements; Earthscan Publications Ltd.: London, UK, 2010. [Google Scholar]
- Viglia, S.; Matthews, K.B.; Miller, D.G.; Wardell-Johnson, D.; Rivington, M.; Ulgiati, S. The social metabolism of Scotland: An environmental perspective. Energy Policy 2017, 100, 304–313. [Google Scholar] [CrossRef]
- Hogeboom, R.J.; de Bruin, D.; Schyns, J.F.; Krol, M.S.; Hoekstra, A.Y. Capping Human Water Footprints in the World’s River Basins. Earth’s Future 2020, 8, e2019EF001363. [Google Scholar] [CrossRef] [PubMed]
- Schyns, J.F.; Hoekstra, A.Y.; Booij, M.J.; Hogeboom, R.J.; Mekonnen, M.M. Limits to the world’s green water resources for food, feed, fiber, timber, and bioenergy. Proc. Natl. Acad. Sci. USA 2019, 116, 4893–4898. [Google Scholar] [CrossRef] [PubMed] [Green Version]
- European Environment Agency. The European Environment—State and Outlook 2020: Knowledge for Transition to a Sustainable Europe. 2020, p. 499. Available online: https://www.eea.europa.eu/soer/publications/soer-2020 (accessed on 1 June 2019).
- European Environment Agency. WISE Water Framework Directive Database. Available online: https://www.eea.europa.eu/data-and-maps/data/wise-wfd-4 (accessed on 1 June 2020).
- Joint Research Centre. European Soil Data Centre (ESDAC) Soil Threats Data. Available online: https://esdac.jrc.ec.europa.eu/resource-type/soil-threats-data (accessed on 1 June 2019).
- Sauer, S. Soy expansion into the agricultural frontiers of the Brazilian Amazon: The agribusiness economy and its social and environmental conflicts. Land Use Policy 2018, 79, 326–338. [Google Scholar] [CrossRef]
- Heller, M.C.; Keoleian, G.A. Life Cycle-Based Sustainability Indicators for the Assessment of the US Food System; The Center for Sustainable Systems: Ann Arbor, MI, USA, 2000; p. 59. [Google Scholar]
- European Commission. Farm to Fork Strategy, For a Fair, Healthy and Environmentally-Friendly Food System. 2020, p. 23. Available online: https://ec.europa.eu/food/sites/food/files/safety/docs/f2f_action-plan_2020_strategy-info_en.pdf (accessed on 1 June 2020).
- Matthews, K.B.; Blackstock, K.L.; Waylen, K.A.; Juarez-Bourke, A.; Miller, D.G.; Wardell-Johnson, D.H.; Rivington, M.; Hague, A.; Fisher, D.; Renner, A.; et al. Report on EU Sustainability Goals: Insights from Quantitative Story Telling and the WEFE Nexus. MAGIC (H2020–GA 689669) Project Deliverable 5.1, 31st July 2020. 2020, p. 136. Available online: https://magic-nexus.eu/documents/deliverable-51-report-eu-sustainability-goals (accessed on 1 June 2019).
- Voinov, A.; Shugart, H.H. ‘Integronsters’, integral and integrated modeling. Environ. Model. Softw. 2013, 39, 149–158. [Google Scholar] [CrossRef]
- Blackstock, K.; Dinnie, L.; Dilley, R.; Marshall, K.; Dunglinson, J.; Trench, H.; Harper, K.; Finan, K.; MacPherson, J.; Johnston, E.; et al. Participatory research to influence participatory governance: Managing relationships with planners. Area 2015, 47, 254–260. [Google Scholar] [CrossRef]
- Young, J.C.; Waylen, K.A.; Sarkki, S.; Albon, S.; Bainbridge, I.; Balian, E.; Davidson, J.; Edwards, D.; Fairley, R.; Margerison, C.; et al. Improving the science-policy dialogue to meet the challenges of biodiversity conservation: Having conversations rather than talking at one-another. Biodivers. Conserv. 2014, 23, 387–404. [Google Scholar] [CrossRef] [Green Version]
- Rayner, S. Uncomfortable knowledge: The social construction of ignorance in science and environmental policy discourses. Econ. Soc. 2012, 41, 107–125. [Google Scholar] [CrossRef]
Publisher’s Note: MDPI stays neutral with regard to jurisdictional claims in published maps and institutional affiliations. |
© 2021 by the authors. Licensee MDPI, Basel, Switzerland. This article is an open access article distributed under the terms and conditions of the Creative Commons Attribution (CC BY) license (https://creativecommons.org/licenses/by/4.0/).