Article

Autonomous Vessels in the Yangtze River: A Study on the Maritime Accidents Using Data-Driven Bayesian Networks

1
School of Electrical and Information Engineering, Wuhan Institute of Technology, Wuhan 430205, China
2
National Engineering Research Center for Water Transport Safety, Wuhan University of Technology, Wuhan 430063, China
3
School of Navigation, Wuhan University of Technology, Wuhan 430063, China
*
Author to whom correspondence should be addressed.
Sustainability 2021, 13(17), 9985; https://doi.org/10.3390/su13179985
Submission received: 5 August 2021 / Revised: 28 August 2021 / Accepted: 31 August 2021 / Published: 6 September 2021

Abstract

:
The prototypes of autonomous vessels are expected to come into service within the coming years, but safety concerns remain due to complex traffic and natural conditions (e.g., Yangtze River). However, the response of autonomous vessels to potential accidents is still uncertain. The accident prevention for autonomous vessels is unconvincing due to the lack of objective studies on the causation analysis for maritime accidents. This paper constitutes an attempt to cover the aforementioned gap by studying the potential causations for maritime accidents in the Yangtze River by using a Bayesian-based network training approach. More than two hundred accidents reported between 2013 and 2019 in the Yangtze River are collected. As a result, a Bayesian network (BN) is successfully established to describe the causations among different risk influencing factors. By analysing the BN, this study reveals that the occurrence of maritime accidents (e.g., collision, grounding) can be expected to reduce with the development of autonomous vessels as the crews are removed. However, the extent of the consequences from some accidents (e.g., fire, critical weathers) could be more serious than conventional ones. Therefore, more attention and thoughts are needed to ensure the safe navigation of autonomous vessels in the Yangtze River.

1. Introduction

The idea of embracing autonomous vessels to create sustainable development and shape new opportunities for water transportations in the industry is becoming feasible. As the technological barriers are being resolved in numerous studies, maritime autonomy will enter the operational stage in the next few years [1]. Considering that the response of autonomous vessels to potential maritime accidents is still uncertain, the impact magnitude of using autonomous vessels on the water transportation system has been studied extensively [2,3]. Automation can improve vessel safety from some perspectives by removing the crews while creating other unpredictable risk [4].
New risks that emerge for autonomous vessels have been highlighted in previous studies to determine whether the systems can accept autonomous vessels. Current studies attempt analytical methods to study the risk of automation, compare current states of the art and note that using accident data in risk analysis is an important tool. However, these accident analysis methods seriously rely on the quality of the data [5]. Traditional accident analysis can be grouped into three typical categories [6,7,8,9]. The first category is accident investigation, which is generally carried out by maritime administrators for accident descriptions and judgements. The second category employs accident simulation to infer the accident’s causes. The accident simulation approach calculates the movement of various vessels along specified routes across a nautical map according to applicable traffic rules to generate accident scenarios. Each generated accident scenario is recorded in a database describing the accident and its consequences, the accident type and the incident type preceding the accident. The likelihood of an accident in the scenario is next evaluated using a comprehensive historical incident, and the accident analysis is supplemented with expert judgment elicitations [10]. For instance, Bye et al. [11] modelled maritime accidents in the Norwegian waters, applying a statistical analysis approach to prioritise key factors, and discussed the contributions of different factors to shipping accidents. Some approaches have been also presented with regard to the study of maritime accidents. For instance, the information provided by the investigative records is relatively primitive, while the accident simulation modelling weakens the objectivity, as some subjective information is involved. The last category is accident feature modelling. For example, Fan et al. [12] presented a causation model by using Tree Augmented Network (TAN) approaches. The model was used to investigate the importance of Risk Influence Factors (RIFs) on different accident types and to extract the key factors. The studies using the data-driven modelling approaches pioneer the use of accident data-based risk analysis. Such an analysis can identify the interrelationships among risk factors to improve accuracy, thereby providing potential availability of using accident records to aid accident prevention for autonomous vessels.
The main objective of this paper is to contribute to the discussion on autonomous vessel safety by analysing maritime accidents. This is achieved by using a novel Bayesian learning approach to model the historical accident dataset for vessels travelling via congested routes. More than 225 accident reports from between 2013 and 2019 are collected and used for training the Bayesian Network (BN). The structure and probabilities of the BN are optimized through such training. Then, the availability of the acquired BN is validated by several validity approaches. The results for each RIF are discussed in terms of safety constraints and the potential risks for autonomous vessels are identified. The analysis by such a BN in this paper provides insights into potential accidents for autonomous vessels, which may contribute to increasing the knowledge and confidence with regard to accident prevention and management on autonomous vessels.
The rest of this paper is structured as follows. Section 2 provides a detailed literature review, while Section 3 introduces the methods to develop BNs. In Section 4, a case study based on these methods is provided, in which the data acquisition, pre-processing, modelling, and validation are included. Section 5 discusses the results and the conclusion is drawn in Section 6.

2. Literature Review

2.1. Autonomous Vessel Operation Risks

Autonomous vessel operations have been controversial during the last decade, as their safety and security have not yet been fully validated [13]. Therefore, it is difficult to answer the question of whether the uses of autonomous vessels will increase overall maritime safety. Porathe et al. [4] discussed the pros and cons of involving automation. Considering human shortcomings, automation is safer due to inevitable factors such as fatigue, attention span, information overload and normality bias. However, it is impossible to face all unknown conditions by automation instead of human involvement, as many real-world problems are complex. In order to answer the question definitely, some studies have attempted to develop an in-depth analysis [2,3,4,5,13,14]. An interesting common point is considered—the contribution to the risk caused by different levels of autonomy. For example, some studies compared each level of autonomy according to the safety constraints and the required hazard mitigation measures for maintaining an adequate level of safety. It can provide the appropriate level of autonomy at different conditions to reduce the risk of accidents [2,15]. Huang et al. [16] proposed an improved time-varying collision risk (TCR) measure, which reflects not only the danger level of the approaching ships but also the difficulty of avoiding collisions.
Although some feasible approaches were proposed, unmanned operations are rarely achieved at present due to insufficient understanding about risk causation and technology. To promote the further development of maritime autonomous technology, a potential risk study of autonomous vessels based on different factors should be developed, considering the influence of complex environments. Utne et al. [17] proposed a framework for online risk modelling for autonomous vessels that includes systems theoretic process analysis (STPA) and Bayesian Belief Networks. The online risk model can provide decision support to the control systems of autonomous vessels. Based on the research, a Failure Modes and Effects Analysis (FMEA) method are used in conjunction with Evidential Reasoning (ER) and Rule-based Bayesian Network (RBN) to quantify the risk levels of the identified hazards [18]. Fan et al. [19] considered four categories (human, ship, environment and technology) to populate a framework, analysing the navigating risk factors of autonomous vessels. Moreover, a data-driven machine learning approach for the automated risk estimation of the navigation of a vessel is applied in [20]. While the developed method has demonstrated encouraging performance, the limited number of related factors are taken into consideration in this work. As the previous studies on the potential navigation risk of autonomous vessels are insufficient and incomplete, more data and a detailed classification of different factors are needed to analyse the causation of accidents and potential risks of autonomous vessels.

2.2. Maritime Accident Research

As a complex system, maritime safety faces several menaces that include collision, grounding, sinking, fire and explosions, and others [21]. Previous studies investigated the accident risks from various aspects (e.g., natural impacts, traffic conditions, ship states and human error). These studies identified the key RIFs in the maritime accident analysis to support the accident preventions. The accident related RIFs can be divided into four categories, i.e., human, ship, environment, and management [22]. The RIFs subject to human factors discuss training, organization, and seafaring conditions (i.e., fatigue, task load, mental state, etc.) [23]. For example, Nardo et al. [24] proved that investing in safety is crucial, and humans play an important role by Human Reliability Analysis. Fan et al. [12] extracted the primary factors from maritime accident records, and constructed a BN model by TAN to distinguish the key factors. Hu et al. [21] considered human factors and proposed a hypothetical model to study human failure with theoretical structural equation modelling approaches. Based on this study, Soner et al. [25] united the fuzzy cognitive mapping approaches to calculate fire risk on-board ships and revealed that the human factors were significant for leading to the irreversible loss. The studies subject to ship states discuss the accident severity under different ship conditions (e.g., age, type, flag, and tonnage). For instance, the ship accident characteristics and key RIFs for waterway accident severity were identified [8]. Knapp et al. [26] calculated the wind strength and wave height’s effects on the casualty by an econometric model. Li et al. [27] used a gridded Geography Information System to utilize a relation analysis. The management related RIFs discuss management performance in the waters. Relative studies can be found in [12]. The used RIFs in previous studies are summarized in Table 1.
The data used in the maritime risk research field are collected from different sources, such as expert judgement, ship data, and historical accident data. Expert judgement is generally used for the qualitative evaluation of maritime safety in a complex water environment. Zhang et al. [6] proposed a formal safety assessment (FSA) method using expert evaluation. On this basis, Celik et al. [33] considered fault tree and event tree to enhance the reliability of risk quantification. However, there are two problems in the proposed approach: the subjective data contains uncertainty and the useful information may be lost in the process of risk quantification modelling. Risk assessment based on historical accidents generally uses statistical and inference approaches. For example, Bye et al. [11] collected maritime ship collision and grounding accidents. A corresponding risk assessment model was designed to sort different factors according to the impact on the accident. Li et al. [27] calculated the relative consequences of the regional risk by using 10-year AIS data and accident records in the Western Port of China.

2.3. Risk Analysis Based on BN

Many approaches have been used in the maritime risk analysis, including the Fault Tree Analysis (FTA) [34], Event Tree Analysis (ETA), Analytical Hierarchy Process (AHP), BN. For instance, Uğurlu et al. [35] applied an FTA to model the causations for ship–ship collisions and identified the importance of RIFs. Zhang et al. [7] used the AHP approaches to compare the importance of the factor under different risk conditions.
However, BN is becoming popular in recent studies in this field of its ability to deal with complex systems [36,37]. In earlier studies, the BN is developed by using statistical analysis to model the dependence between factors and to optimize the network structure. The BN was also combined with the FSA to study the potential maritime risk in waterways as the FSA provides a clear risk assessment framework [22,26,38,39]. For instance, Zhang et al. [6] proposed an FSA based BN to estimate the maritime risk of the Yangtze River. Despite such applications, there is a common defect in that BN requires too much data in the form of prior probabilities. Meanwhile, the size of the Conditional Probability Table (CPT) grows along with quickly factors are added, leading to complexity and difficulty in the calculation. Therefore, gaining a large number of accidents data as prior probabilities is necessary.
A machine learning algorithm is suggested to develop a rational and best-fit BN structure in a satisfactory manner. A BN can be modelled to simplify the structure building process without sacrificing accuracy. The core idea of learning a BN is to overcome the growing CPT in the network with a number of factors. Based on the above superiority, Fan et al. [11] employed two Bayesian learning approaches to prioritise the RIFs under different accident types. Besides, Wang and Yang [8] compared the key risk factors influencing waterway accident severity. They proved that the learned BN shows better performance on model fitness. However, due to the deficiency of historical data in a certain field (offshore wind farm), typical quantitative risk analysis methods are difficult to achieve. Previous studies suffered from the limitations of the ambiguous interrelationships when using the approaches of Augmented naive Bayesian Networks (ABN), Naïve Bayesian Networks (NBN), and Tree Augmented Network (TAN) [12,40]. The causal relationships among the factors are difficult to understand and explain. Therefore, Yu et al. [41] developed a semi-qualitative risk model to assess the vessel–turbine collision risks by incorporating BN with evidential reasoning approaches and put forward a target free Bayesian learning approach, which can rapidly develop a reliable risk model based on multiple data sources.

3. Methodology

In this study, BN is utilized to study the potential risk of the autonomous vessel by analysing the accident records. It usually involves the following steps: dataset establishment, network training, network analysis, and validation [6]. The related methodologies used in the modelling process are introduced as follows.

3.1. Bayesian Network

The BN is a graphical inference method based on the Bayesian theorem. It is able to synthetically model the subjective and the objective information while considering their uncertainties. Dependencies between factors and their causal relationships are not affected by the addition of new nodes (risk factors). BN is widely used in practical applications such as intelligent decision making, safety assessment, medical diagnosis, pattern recognition, and computer network diagnosis [6,12].
The BN contains two elements: nodes and links. The nodes refer to the factors that are considered in the model and the links are defined to describe the influences between two nodes [22,40]. The BN infers the influence based on the Bayes theorem, which calculates the conditional (or marginal) probabilities of random events A and B based on the following functions.
P ( A | B ) = P ( B | A ) × P ( A ) P ( B )
where P ( A ) and P ( B ) are the prior probabilities of event A and B , i.e., the occurrence probability of event A . P ( A | B ) represents the occurrence probability of A given that B occurs. Similarly, P ( B | A ) refers to the occurrence probability of B given that A occurs.

3.2. Network Training

The Bayesian searching approach (BSA) is employed to construct the BN. The BSA evaluates all possible belief network structures from the provided data and chooses the most likely structure as the training result by using the K2 algorithm at first. Then, a Bayes estimator is used to quantitatively calculate the conditional probability among nodes [22,41]. The details of the processes are as follows.
Assume that D be a dataset derived from the accident records, which contains n factors x i ( i n ) , and each factor x i has h possible value assignments: ( v i 1 , , v i h ) . There are m possible BN structures ( B 1 , B 2 , , B m ) , and each one describes a unique interrelationship between the factors.
In a specific B s ( s m ) , x i has a set of parent nodes, which can be represented with a list of factors as q . Let q j ( j r ) denote the j-th unique instantiation of q relative to D and there is r such unique instantiations of q . Define N i j k ( k h ) to be the number of records in D in which variable x i takes the value of v i k and q is instantiated as q j . The sum of N i j k can be defined as:
N i j = k = 1 h N i j k
In order to select the network structure that obtains the highest score, two equations are employed as follows:
P ( B s | D ) = P ( B s , D ) s = 1 m P ( B s , D )
P ( B s , D ) = P ( B s ) i = 1 n j = 1 r ( h 1 ) ! ( N i j + h 1 ) ! k = 1 h N i j k !
where P ( B s ) is a constant prior probability for each B s   and a structure that obtaining highest score is defined as the most likely B s .
Assuming that the conditional probabilities θ i j k ( k = 1 , 2 , , h ) for v i k in x i are consistent with the Dirichlet distribution, the CPTs for in the BN can be calculated by using the following equation when giving the dataset D and the belief-network structure B s .
E ( θ i j k | D , B s ) = N i j k + 1 N i j + h
A sample of using BSA to score the potential BN structures from accident records are given to demonstrate the training process. Assuming there are a dataset contains ten causation records (see Table 2).
The dataset identifies seven human errors and six of them lead to the accident happened. On such a basis, we define human error and accident as two nodes ( x 1 = human error and x 2 = accidents), each of which contains two states: “yes” and “no”. Whether if human error is a causation factor for an accident can be confirmed by scoring the relationship with BAS.
Let possible structure B 1 = ( x 1 x 2 ) , mean that human error leads to the accident happening, where P ( x 1 = y e s ) = 7 , P ( x 1 = n o ) = 3 , P ( x 2 = y e s | x 1 = y e s ) = 6 , P ( x 2 = n o | x 1 = y e s ) = 1 , P ( x 2 = y e s | x 1 = n o ) = 2 , P ( x 2 = n o | x 1 = n o ) = 1 . Using Equations (2)–(4), the likelihood of B 1 can be calculated as follows:
P ( B 1 , D ) = P ( B 1 ) × ( 2 1 ) ! × 7 ! × 3 ! ( 10 + 2 1 ) ! × ( 2 1 ) ! × 6 ! × 1 ! ( 7 + 2 1 ) ! × ( 2 1 ) ! × 2 ! × 1 ! ( 2 + 2 1 ) ! = 4.51 × 10 6 P ( B 1 )
When B 2 = ( x 1 , x 2 ) , this means that human error does not lead to an accident happening. Similarly, the likelihood for the structure P ( B 2 , D ) is calculated as:
P ( B 2 , D ) = P ( B 2 ) × ( 2 1 ) ! × 7 ! × 3 ! ( 10 + 2 1 ) ! × ( 2 1 ) ! × 8 ! × 2 ! ( 10 + 2 1 ) ! = 1.53 × 10 6 P ( B 2 )
If there is no background knowledge on the relationships between human error and accident (i.e., P ( B 1 ) = P ( B 2 ) ), P ( B 1 , D ) P ( B 2 , D ) = 4.51 × 10 6 P ( B 1 ) 1.53 × 10 6 P ( B 2 ) = 2.95 . It means that the likelihood of B 1 is 2.95 times higher than B 2 , which proves that human error lead to the accident happening and thus selects the structure of B 1 = ( x 1 x 2 ) as the training result.
Then, the conditional probability table between x 1 and x 2 is established by using Equation (5), in which P ( x 2 = y e s | x 1 = y e s ) = 0.778 , P ( x 2 = n o | x 1 = y e s ) = 0.222 , P ( x 2 = y e s | x 1 = n o ) = 0.600 , P ( x 2 = n o | x 1 = n o ) = 0.400 . Therefore, the relationships between human error and accident happening are defined with a BN that trained from the dataset by using the BSA.

3.3. Mutual Information

In this paper, mutual information (MI) is used to describe the mutual dependence between two factors [8,22]. The importance between any two factors can be represented by information entropy. High entropy means strong correlations while low entropy means weak correlations. The information entropy between the target factor and others can be calculated by:
I ( T , O i ) = o i O i P ( o i ) t T P ( t | o i ) log 2 P ( t | o i ) P ( t )
where I ( T , O i ) represents the entropy between the target factor and the i-th factor, o i represents the state of the i-th factor, and t represents the state of the target factor.

4. Implementations

This section develops a data-driven BN to study the potential accidents risk that may face by autonomous vessels. For this aim, a five years accident dataset in the Yangtze River was acquired from China maritime safety administration (MSA). The dataset involved related factors that lead to an accident, which are used to identify the RIFs. A data-driven BN is then developed by using the above introduced Bayesian learning approach (i.e., BSA). At last, a two-step validation discusses the reliability and accuracy of the acquired BN [39].

4.1. Data Collection

Comprehensive accident information could be obtained from a limited accident dataset in previous studies. For example, 161 accident reports are collected to conduct a data-driven BN to generate the structure of RIFs [12]. Wang et al. [8] collected 229 accident investigation reports for risk analysis using the grounded theory method and BNs. The accident records used in this study were collected from the China Maritime Safety Administration [42], which composes of a total of 160 accident reports in the Yangtze River, referring to 225 records from 2013 to 2019. In total, 16 allision accidents, 91 collision accidents, 6 fire and explosion accidents, 13 sinking accident and 34 grounding accidents were recorded. Each accident report describes the accident details of the circumstance, ship damage, direct or indirect causations, accident prevention measures and recommendations.

4.2. Dataset Establishment

The dataset establishment involves two steps: factors identification and data integration. Factors are extracted from accident investigation records to identify the RIFs and each RIF is stated accordingly. The principles of RIFs selection are as follows:
  • The factor appearance frequency in accident records should be considered to eliminate the trivial factors.
  • Some factors with the same or similar properties should be merged (e.g., Typhoon, a huge wave, and sea ice are merged as extreme weather conditions).
  • All factors can be categorized to discuss the impact magnitudes from human, ship, environment, and management factors.
Table 3 reports the selected RIFs based on the principles, which contains 20 accident-related factors (19 of causation factors and an accident severity factor). ‘Ship type’, ‘Accident type’, ‘Hull type’, ‘Navigation state’, ‘Season’, ‘Day/night’, ‘Encounter state’, ‘Density’ and ‘Weather’ are divided into the states according to the classification of MAIB (maritime-accident-investigation-branch) that is widely applied in the industry [12]. ‘Length’, ‘Width’, ‘Tonnage’, ‘Draught’, ‘Power’ and ‘Age’ are discretised based on the states used in the previous studies [6,41]. Besides, the severity of the accidents is divided into catastrophic, critical, major, and minor accidents according to their severity given in Table 4 [8].
The dataset is integrated by the selected factors and the factor states according to Table 3.
The distributions for the acquired dataset are shown in Figure 1 and Figure 2. Most of the ships involved in the accidents are general cargo ships, followed by fishing ships, oil and gas tankers. More than 80 accidents led to minor consequences, making up approximately 37% of all cases. Critical and catastrophic accidents make up 31% and 27%, respectively, which account for more than half in the dataset.

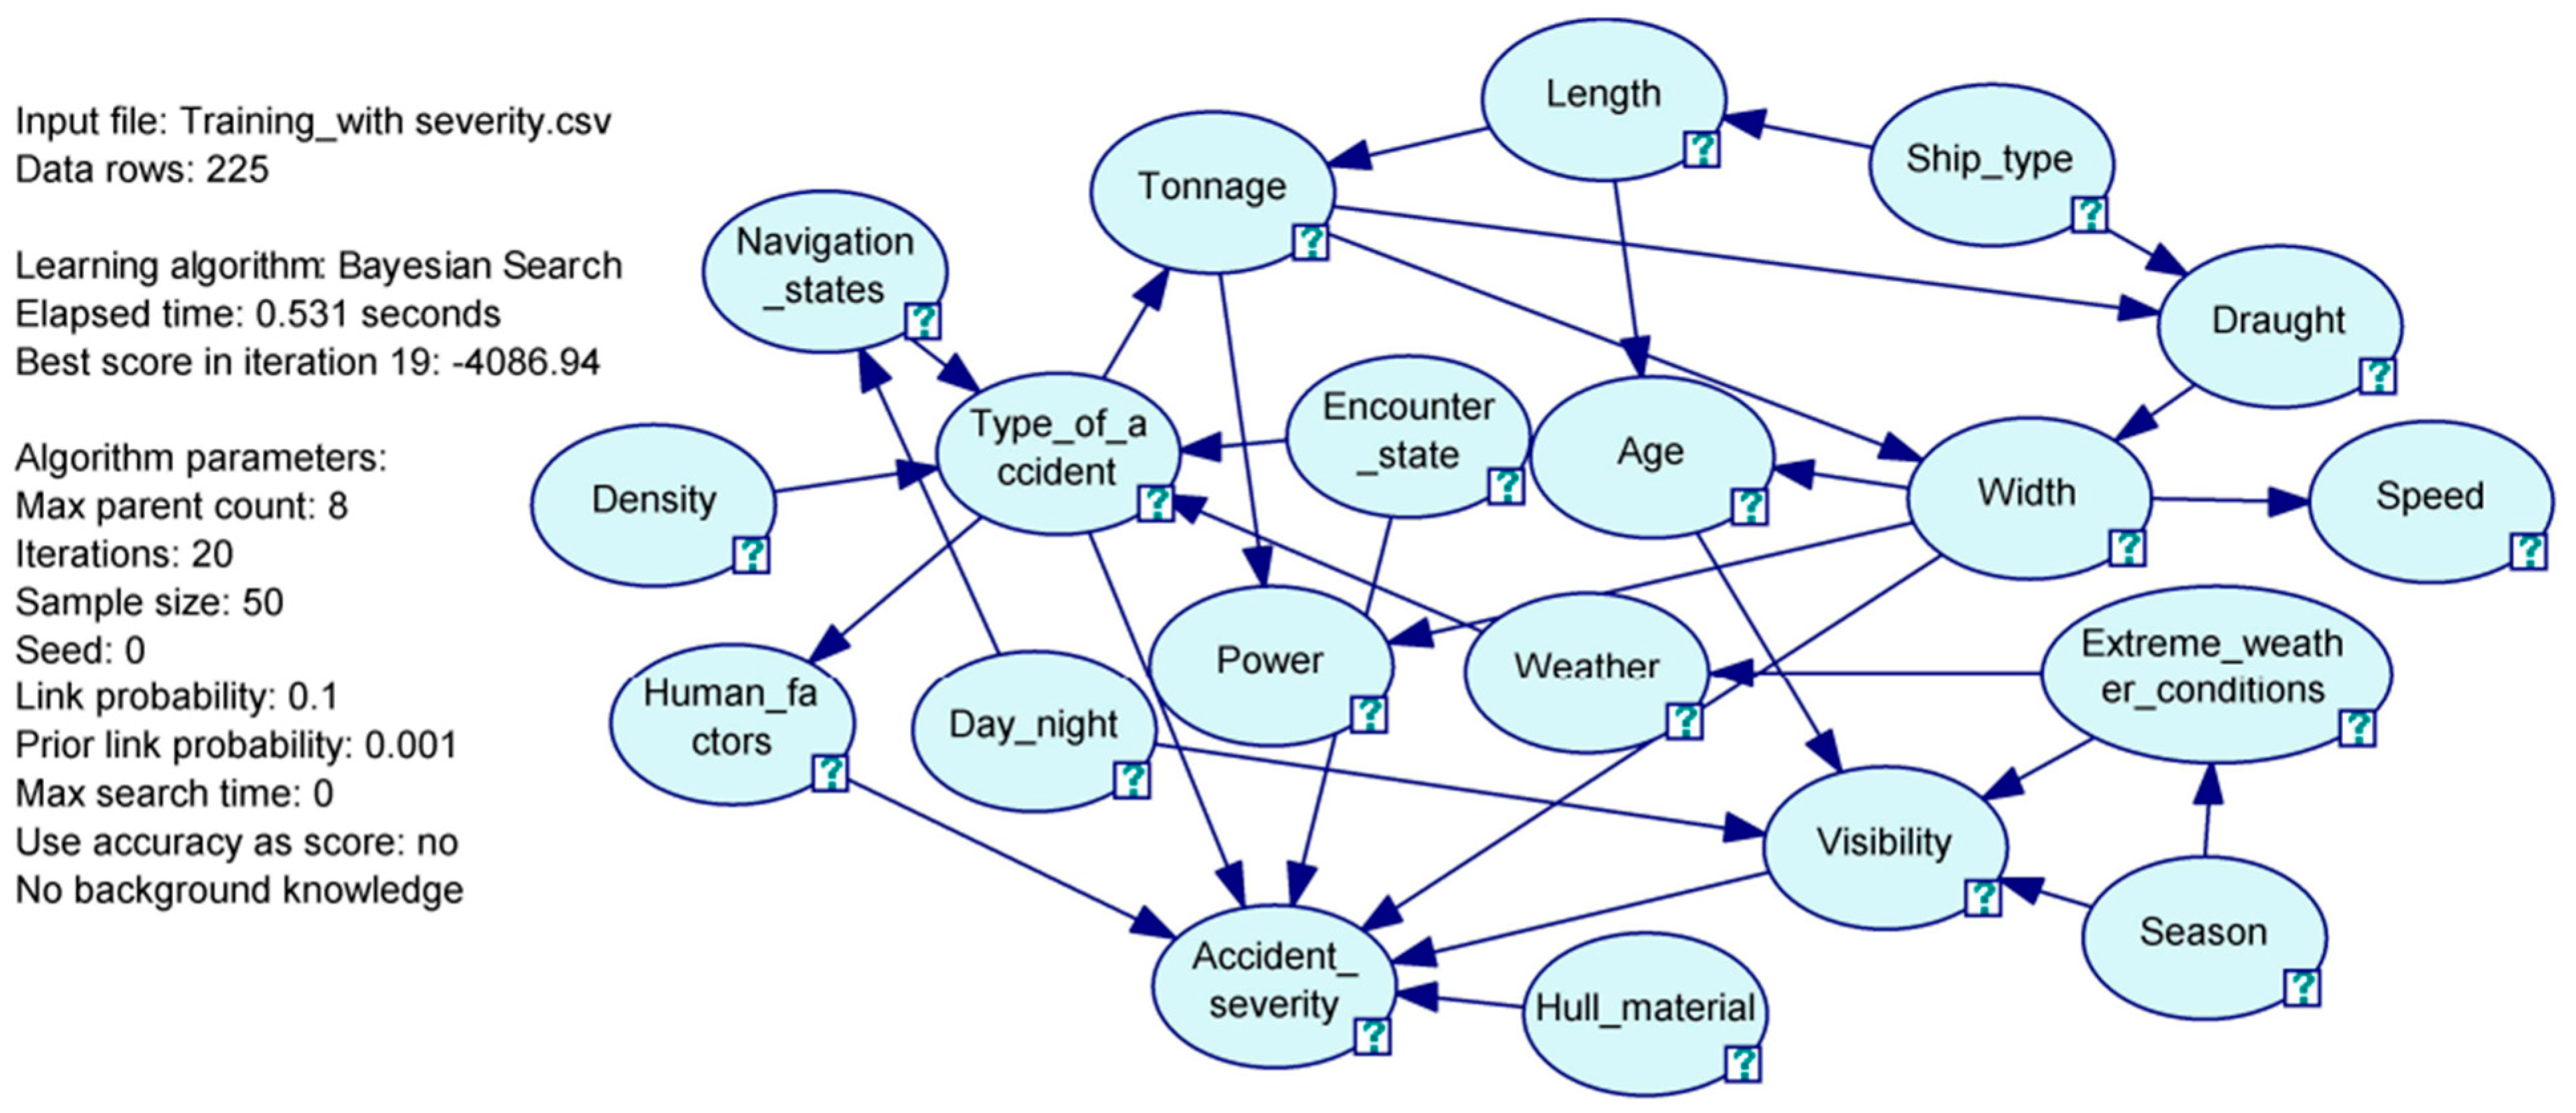
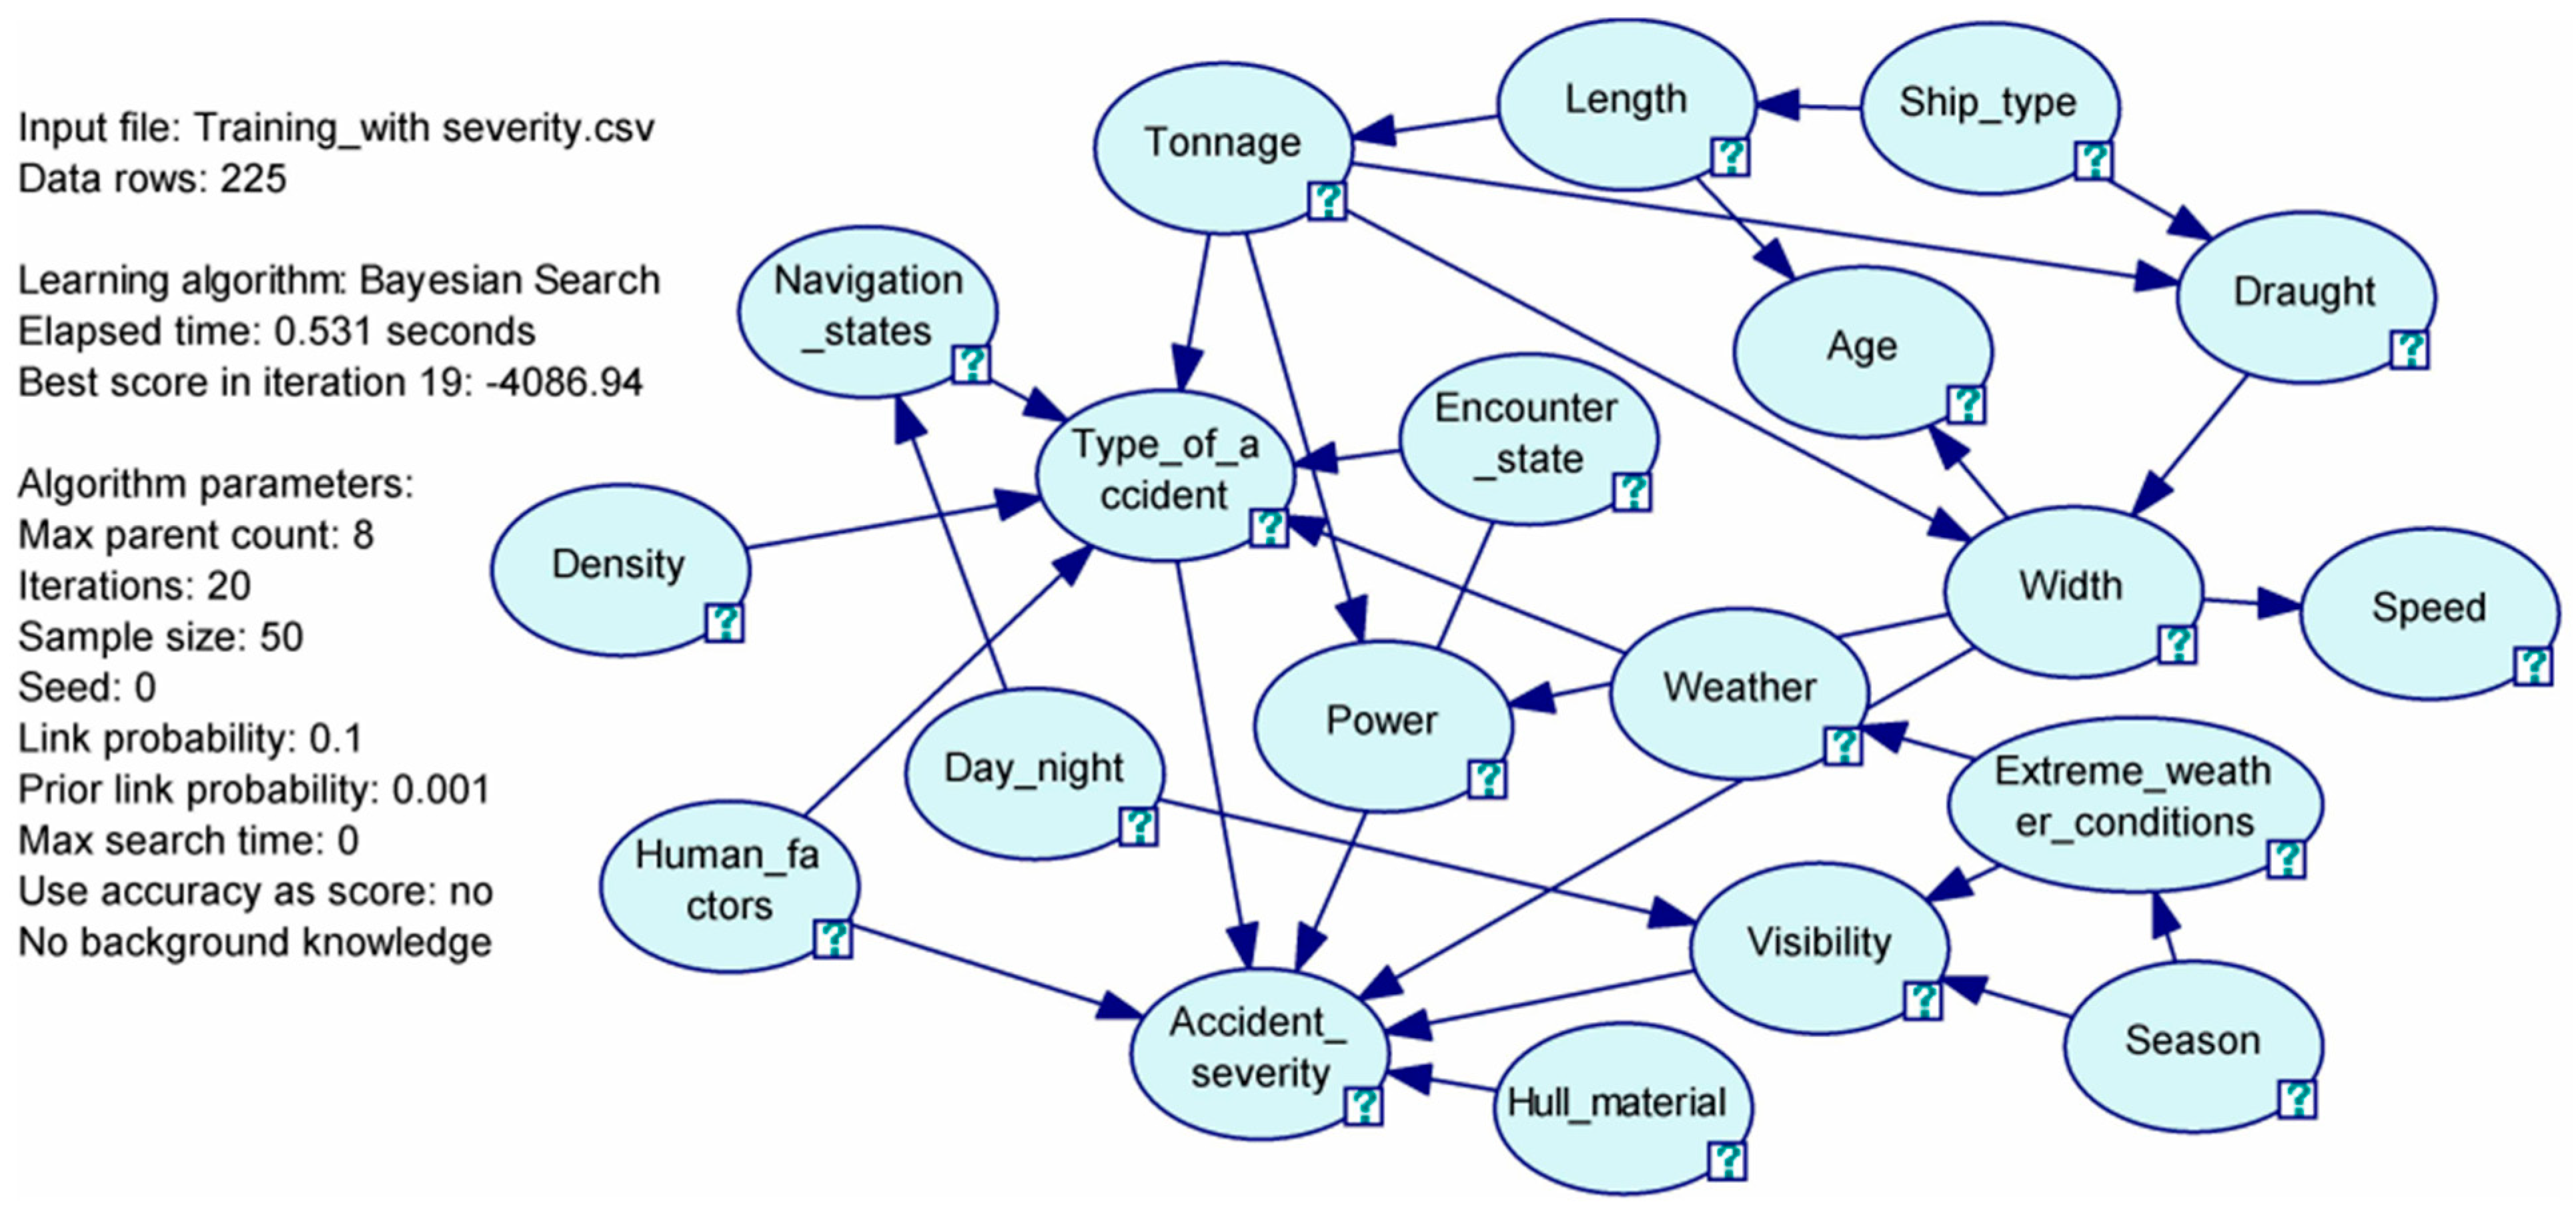
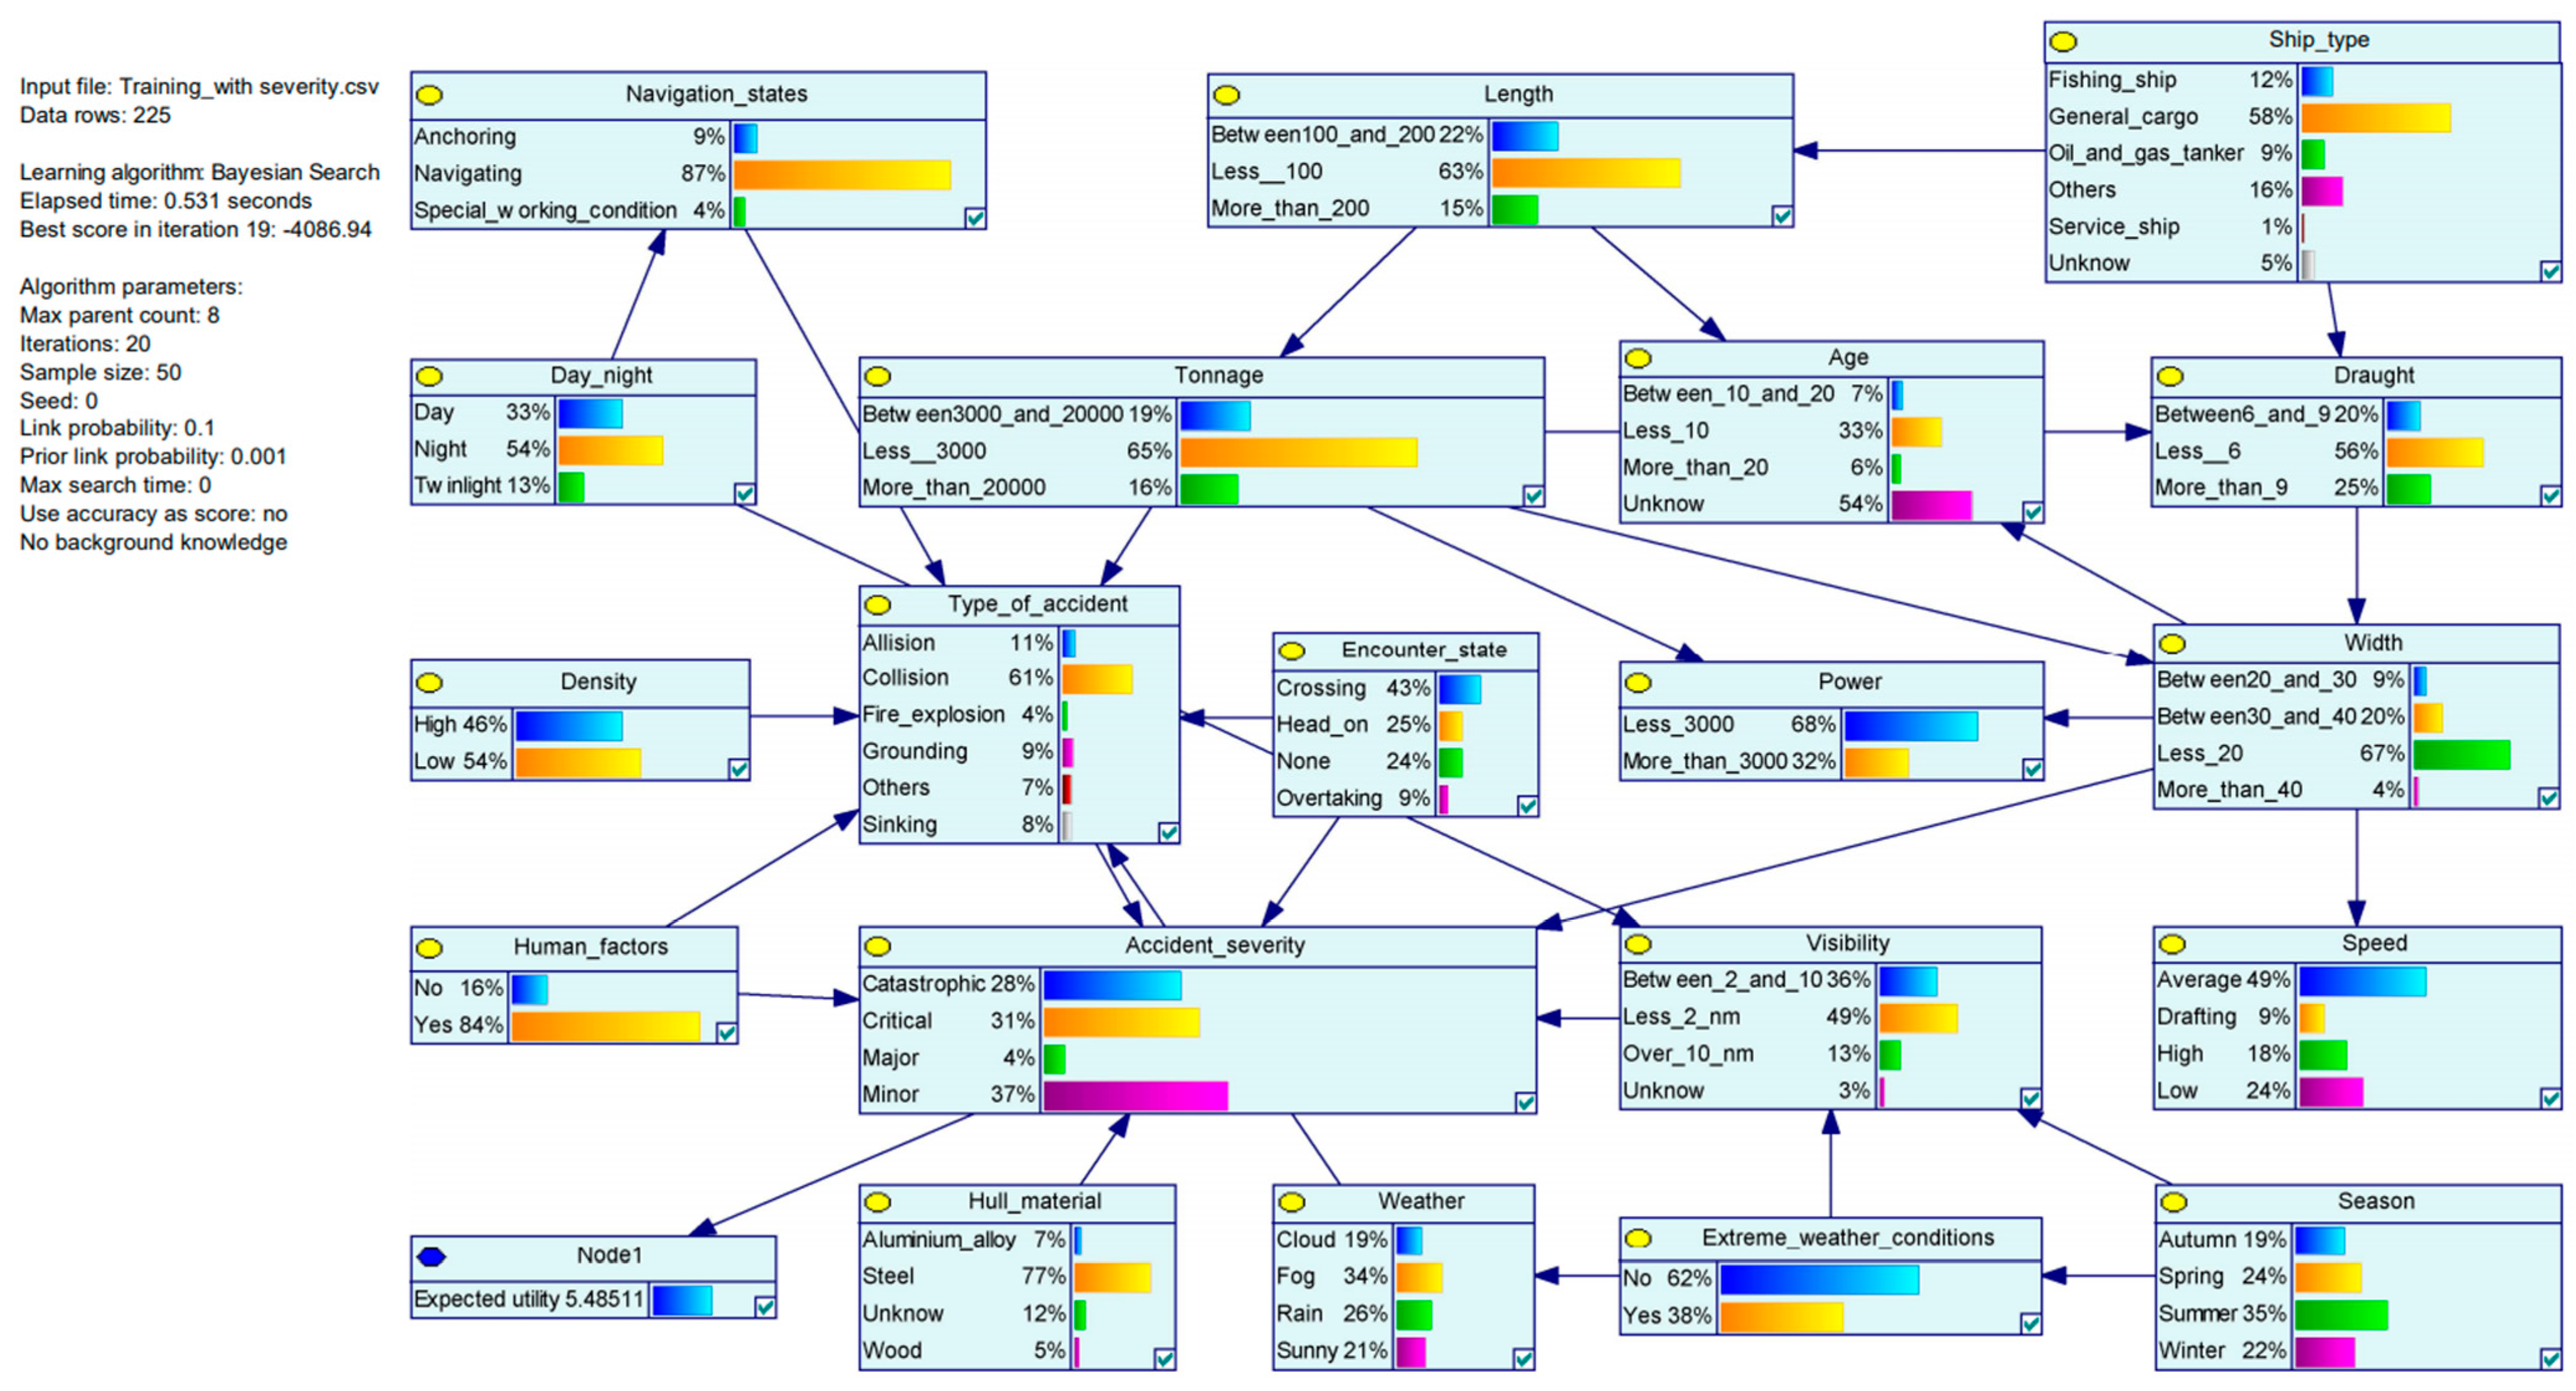
4.3. Structure Learning

The accident dataset is used for training the BN structure with the aides of a Bayesian network visualization software (GeNIe) (BayesFusion, LLC, Pittsburgh, PA, USA). We input 225 records and used the BSA to calculate the BN structure that obtained the highest likelihood (as shown in Figure 3), while we do not provide any background knowledge during the training process to ensure the obtained BN is purely data-driven. The training process takes a total of 0.531 s to train the BN. The BN structure that best fit the provided dataset is presented in Figure 3.
The raw training results of the BN contain a total of 20 nodes and identify 30 interrelationships among these nodes. Specifically, the node of accident severity is the child node of six parent nodes, causing potential impacts among them. There are “human factors”, “type of accident”, “encounter state”, “width”, “visibility” and “hull material”. Two of them are root nodes (i.e., hull material and encounter state) and the other four are intermeddled nodes (i.e., type of accident, width, visibility and human factors). The node of “type of accident” is impacted by density, navigation states, power and encounters state, which is closely related to the surrounding environment and ship states. The width is a ship-related attribute that is connected with tonnage and draught, which is consistent with ship construction. The visibility is a natural environment-related node. It is impacted by the nodes of day/night, age, extreme weather, and season. It should be noted that the link between the nodes of age and visibility is irrational, thus the reliability of the trained BN requires further validation. Thereby, BN is validated in the following part.

4.4. Structure Validation

Face validity is applied to validate the obtained BN structure by improving the confidence of the developed relationships. Based on previous studies and background knowledge, the connection between ‘Age’ and ‘Visibility’ is irrational as no links should be considered in the reality. Moreover, the causal directions of ‘Human factors’ and ‘Type of accident’, ‘Tonnage’ and ‘Type of accident’ should be inverted according to the suggestions given in the previous studies [9,12,30,40]. As a result, a fine-tuned BN structure is adjusted by considering the above inconsistencies, as shown in Figure 4.
It can be found that the interrelationship between the factors maintains a high consistency with the previous studies. Meanwhile, we also invited experts to evaluate the structure of the model and adjust some possible factors in the model.

4.5. Probability Learning

The probability distribution for each node is calculated from the historical accident dataset. The results are presented in Figure 5. During the training process, some interesting findings are noted. For instance, the result shows about 84% of accidents involve human error (84% of ‘Yes’ and 16% of ‘No’). Besides, the accident probability is higher at night than during the day. Fog is confirmed as the most likely weather to causes accidents for ships, followed by rain (34% of fog, 26% of rain, 21% of sunny and 19% of cloud). Moreover, visibility is important in accidents as approximately 49% of accidents occurred in conditions of poor visibility (less than 2 nm). The accident probability increases along with decreased visibility (49% of ‘Less than 2 nm’, 36% of ‘Between 2 and 10 nm’, 13% of ‘Over 10 nm’). Most of the ships involved in the accident are less than 100 m in length (63%), less than 20 m in width (67%) and less than 3000 tons (66%). Thus, the BN proves the small ships are the ones most prone to major accidents. Moreover, the cargo ships are at greater risk than other ships, as 58% of the accidents involve cargo ships.
A new node of ‘Node 1’ is added in the BN to calculate the crisp value of the ‘Accident severity’. The utility values that assign to each state in the node of ‘accident severity’ are 1, 4, 7, 10, from low severity to high servility. The BN shows the overall risk of maritime risk is 5.51, which reveals an average risk for vessels facing maritime accidents in the studied waters.
By the comparison with the model training results and the existing statistical results, we found that the probability distributions of the model are consistent with the statistical conclusions. It proved that the model has high accuracy in the factor probability statistics.

4.6. Content Validation

The content validation aims to discuss the findings of the BN that are consistent with reality. For instance, the findings from the BN should be rational and able to guide further risk mitigations. Thereby, the MI approach is used to prioritise the impact magnitude to the ‘Accident severity’ (i.e., target node). Using Equation (6), the entropy value of all the factors is calculated, as shown in Table 5.
Table 5 shows that the ‘Encounter state’, ‘Hull material’, and ‘Tonnage’ cause the biggest variations in the target node, thus identified as the top 3 impact node on the accident severity. It can be explained by the fact that an irretrievable loss is more likely to arise under certain circumstances, such as crossing. Moreover, wood ships suffer more loss than steel and aluminium ships. The MI sorting is quite different to relative research in [8]. Although identifying the similar RIFs and selecting the same target node, the result of MI shows an obvious diversity. Three conclusions can be drawn:
  • As the encounter states are the main factors leading to high risk of accident, any domain invaders or misbehavers will threaten maritime safety for autonomous vessels.
  • Vessels encountering small ships could lead to a high risk of collision, in which the consequence may minor but the frequency is relatively high.
  • Although the autonomous vessel can avoid having crews onboard, thereby reducing the impact from human factors, the result shows the reduction of accident frequency may not significant as other remaining critical situations (e.g., critical weather, congested waters).
The above-mentioned information is consistent with the concerns, which validates the BN as rational and reliable.
Moreover, the BN should satisfy two axioms in the uncertainty–sensitivity analysis [18]: A slight increase or decrease in the prior probabilities of each parent node should cause a relative change in the posterior probability of the child/target node (e.g., collision risk). Given the variation of subjective probability distributions of each parent node, the influence magnitude from these parent nodes to the child/target node values should reflect the weights of the parent nodes. Thus, validation based on the above axioms is developed and our model is proven following the rules.

5. Discussion

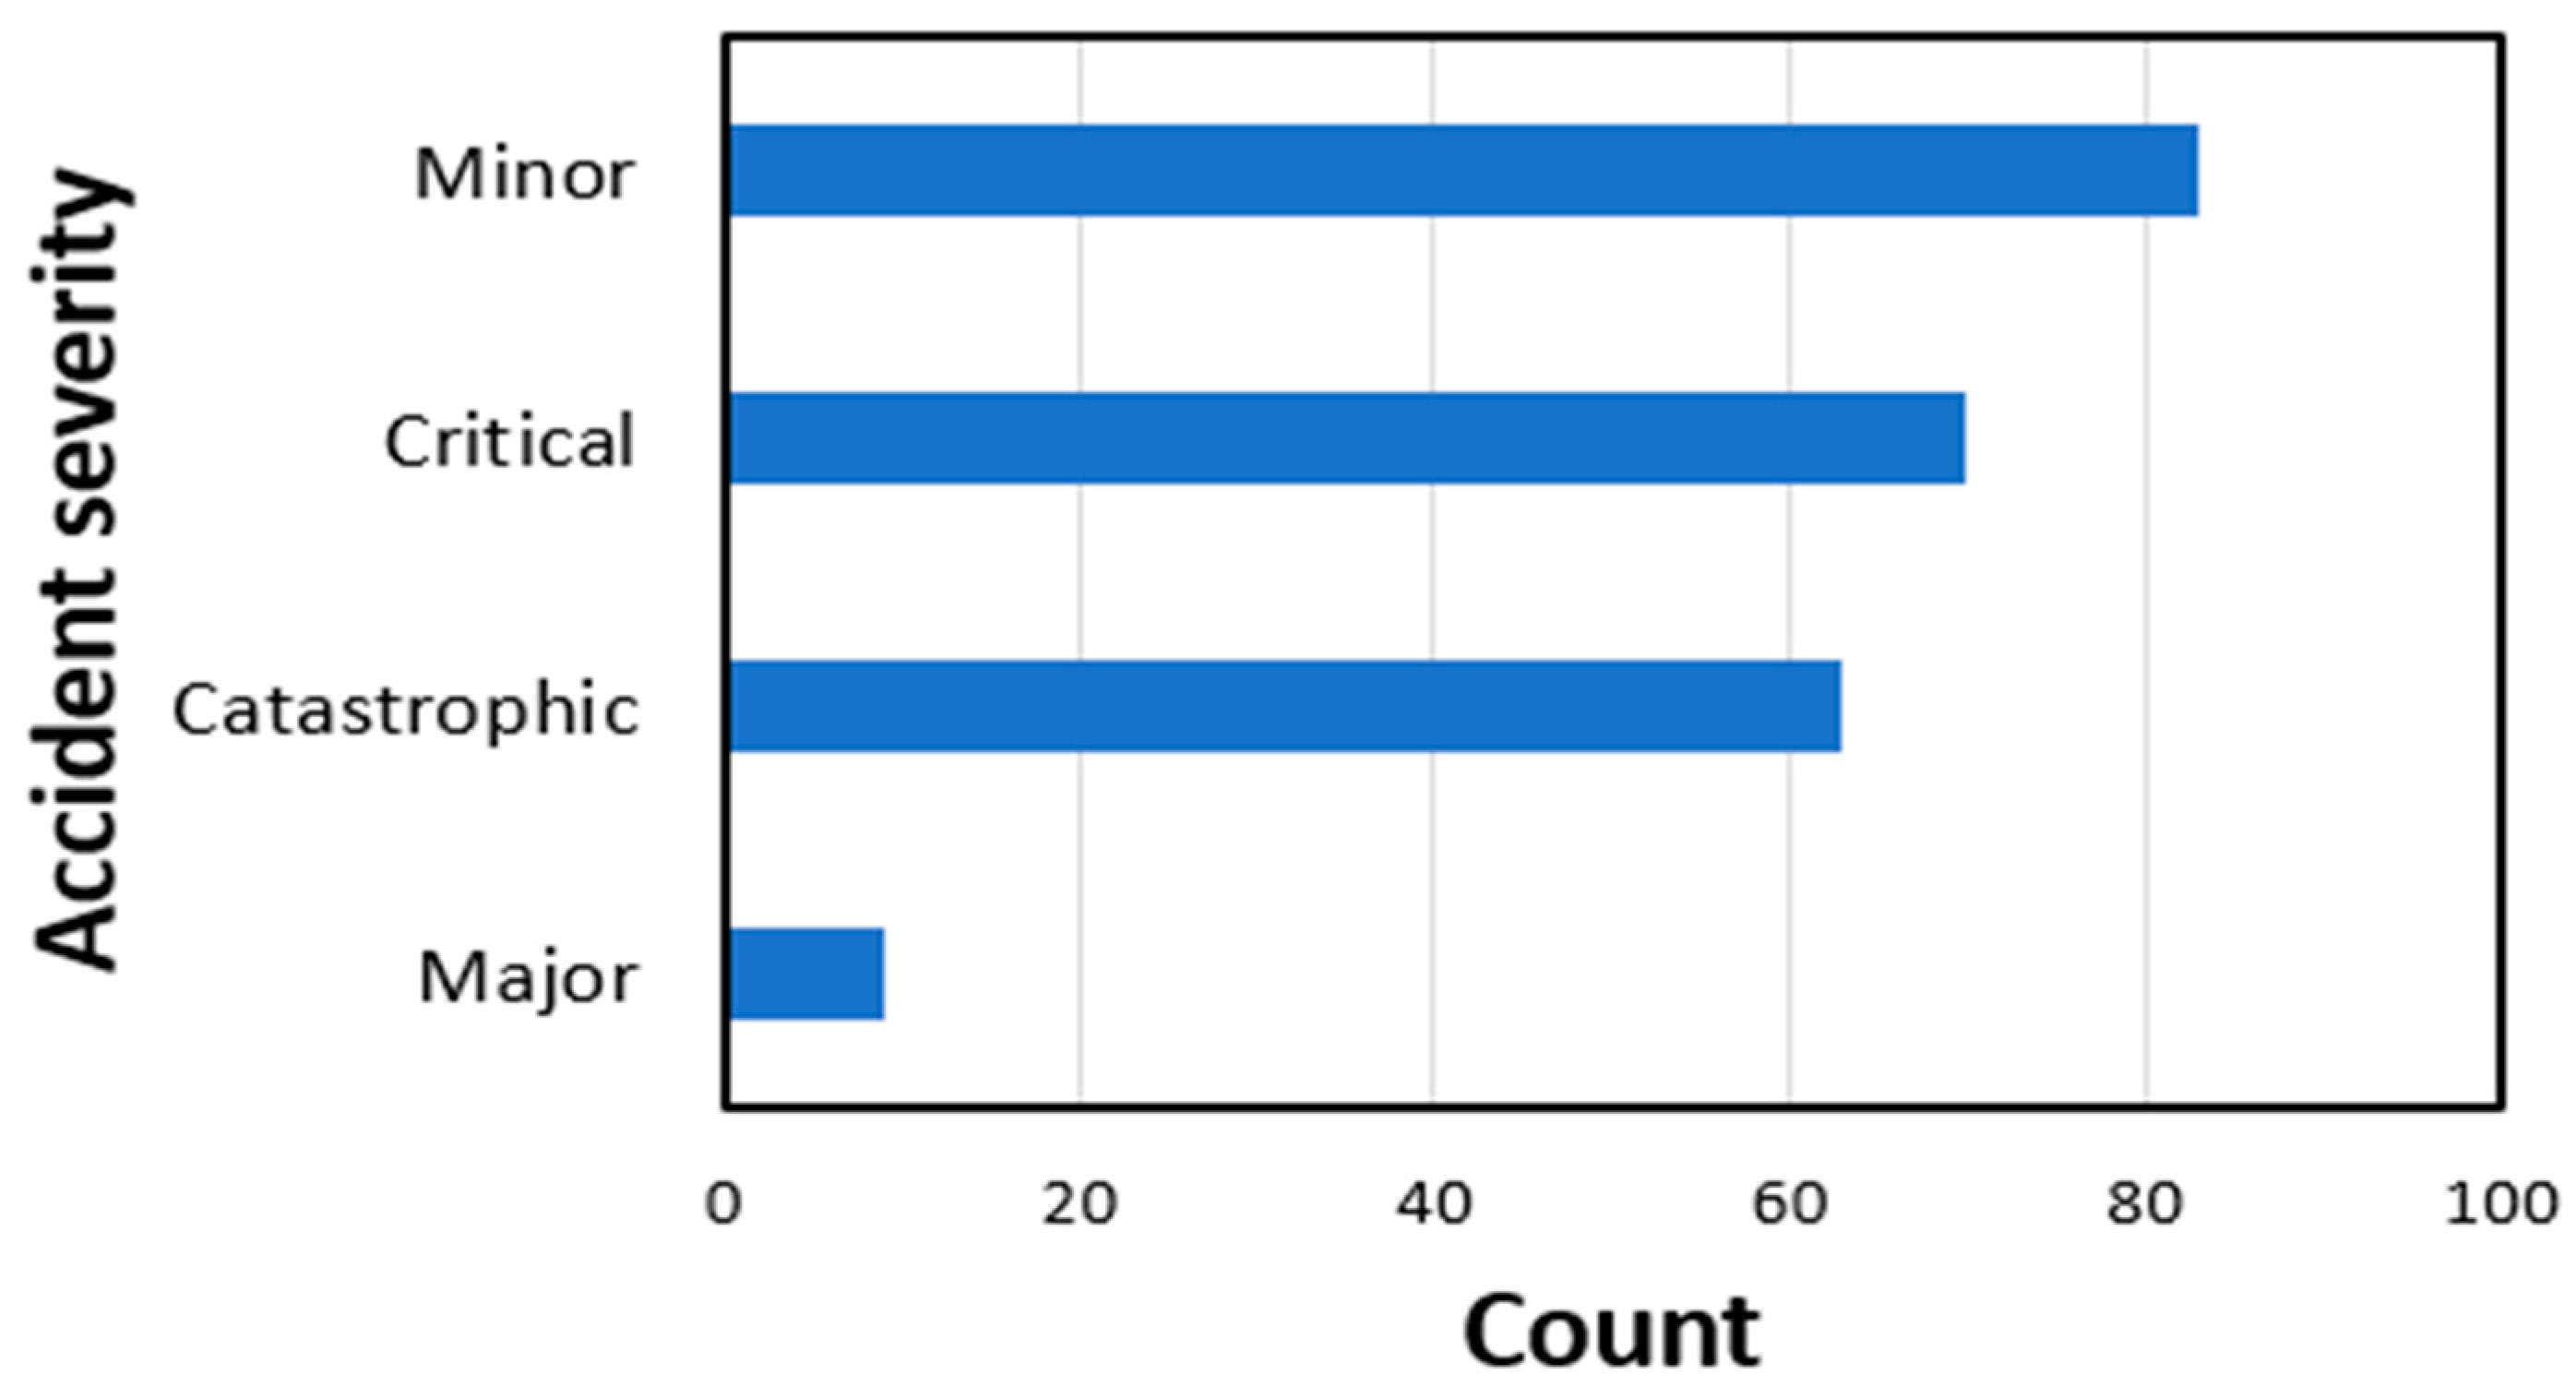
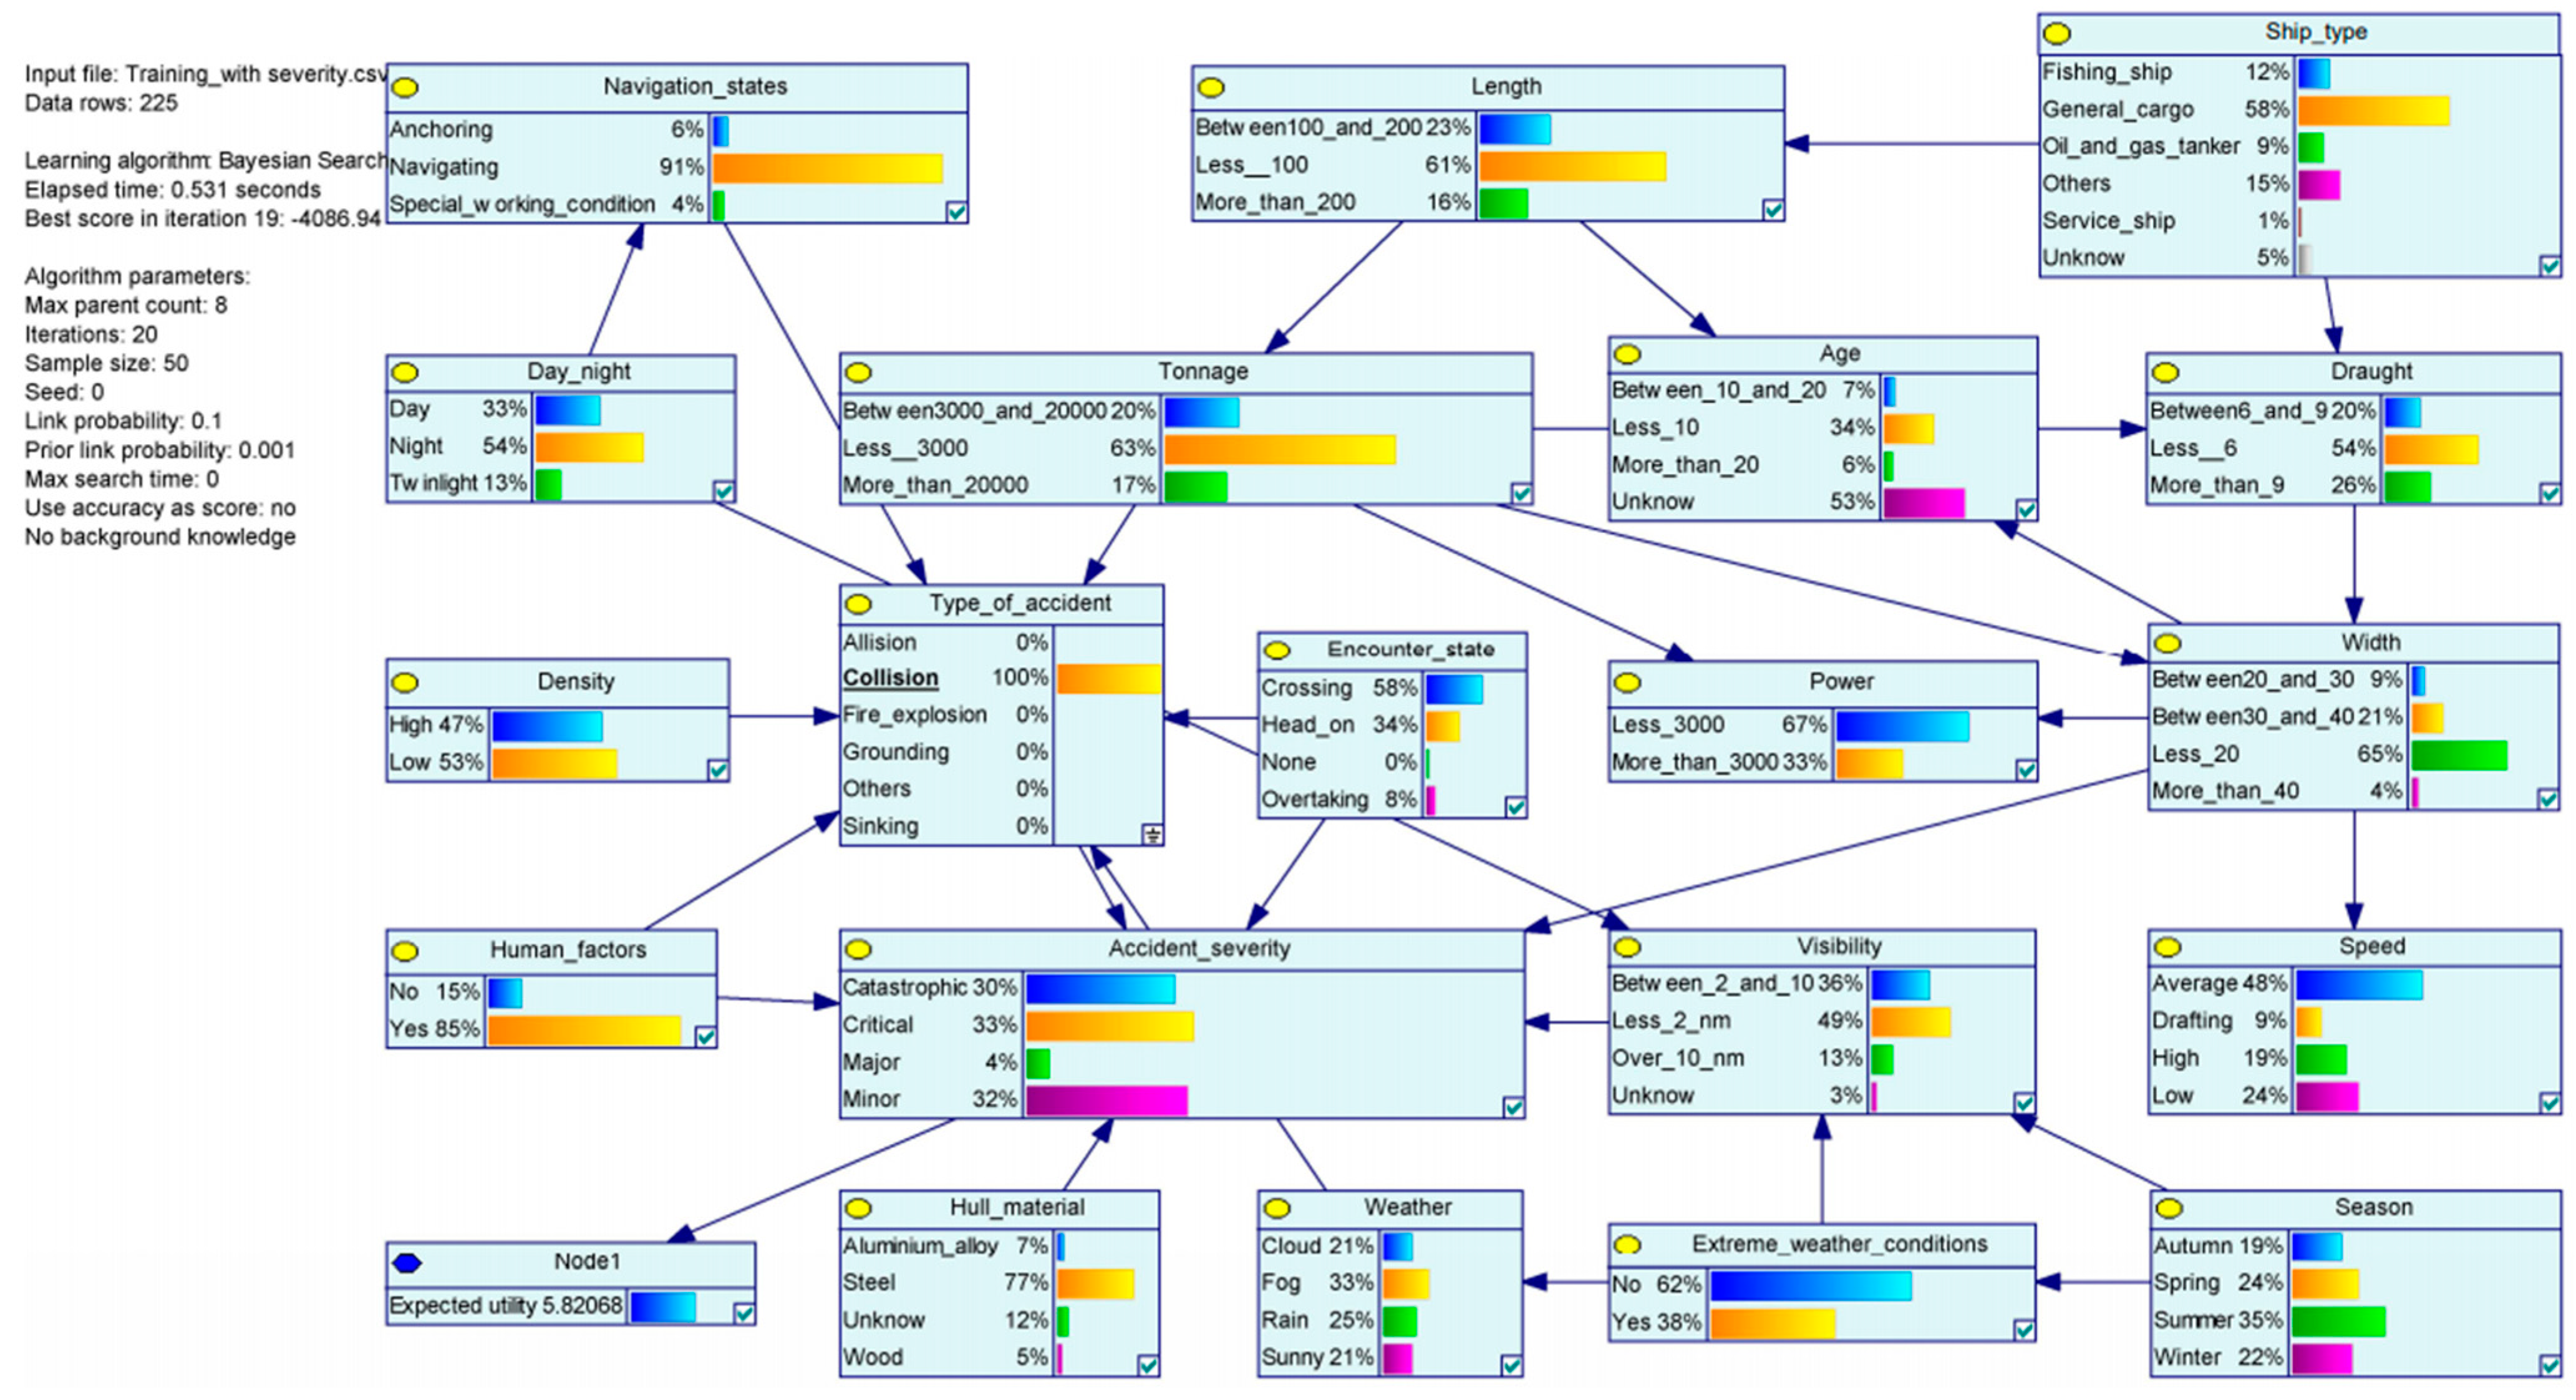
5.1. Major Accident for Autonomous Vessels

The model shows that the ship collisions are predominating for ongoing vessels based on the maritime accident dataset. This could be the main potential risk for autonomous vessels traversing the Yangtze River. To analyse the essential conditions in collision accidents, the developed BN is used to simulate the scenarios by locking the node of ‘type of accident’ as 100% of collisions and leaving the existing evidence on others. Figure 6 shows the state distribution of other RIFs in these conditions.
It can be noted from the result that due to a lack of training, human error has become the main cause leading to collisions (85% Yes and 15% No). This can be efficiently solved by autonomous vessels as the crews are removed from the vessel. In the meantime, ship density shows fewer effects on the autonomous vessel since the BN shows that the difference between high density and low density (i.e., 47% of high and 53% low) is not significant.
Besides, the probability of the collision accidents is affected by the encounter situations and navigation conditions. For example, the encounter state is composed of 58% ‘crossing’, 34% ‘head on’, and 8% ‘overtaking’, which proves that crossing is the major condition causing collision accidents. The navigating ships have a higher percentage (91%) of collision accidents than others (‘anchoring’ and ‘special working ships’). In other words, collision accidents rarely happened between a sailing ship and an anchoring ship. As far as ship characteristics are concerned, the general cargo ship shows the highest percentage (58%) of involvement in collision accidents. The ship tonnage of collision accidents is mainly distributed in the category of ‘less 3000’. The ship length has more probability of ‘less 100’ than other states (‘between 100 and 200’ and ‘more than 200’). Similar considerations show that typical features of small ships (small draught, width and low power) are associated with a higher percentage of collision in the waters. Moreover, the amount of collision accidents occurring during the night-time is relatively higher than at other times (i.e., 33% during the day, 54% at night and 13% during twilight).

5.2. Scenario Analysis

The model enables the severity analysis of accidents based on various scenarios involving human error and natural environmental conditions. Two scenarios are considered to focus on the small ship and critical natural environments to demonstrate the possible research implications of the BN model.

5.2.1. Scenario One: An Autonomous Vessel under Critical Nature Environments

In scenario one, an autonomous vessel navigating under critical nature environmental conditions is estimated. In the meantime, a general cargo ship is selected to compare the risk difference. Here, navigation state and environmental factors, including ‘Season’, ‘Weather’, ‘Extreme weather’, ‘Visibility’, and ‘Day/night’, are chosen. For the general cargo ship, the RIFs are assigned the following states: ‘Navigation state’ = ‘navigating’, ‘Season’ = ‘winter’, ‘Weather’ = ‘fog’, ‘Extreme weather’ = ‘Yes’, ‘Visibility’ = ‘less 2 nm’, and ‘Day/night’ = ‘night’. It is observed that an increase in crisp value (from 5.48 to 6.42) for accident severity compared to the initial state when the weather is cloudy. Due to the poor visibility caused by heavy fog, the crisp value will increase significantly.
In the meantime, the node of visibility is removed from the BN as the poor visibility showing very limited impact magnitudes on autonomous vessels. Consequently, the risk increases from 5.48 to 5.43, which is far less than the scenario of the general cargo ship. However, although the autonomous vessels present their advantages of weather adaptability, all stakeholders should pay great attention when encountering critical nature environments, especially bad weather conditions, given their significant effect on the accident.

5.2.2. Scenario Two: With or without a Human Error Occurring

In scenario two, the crucial factor of human error is tested through the BN to see if the use of autonomous vessel can reduce potential accident risk in the Yangtze River. When setting the nodes to represent a small vessels scenario as: ‘Tonnage’ = ‘less 3000’, ‘Length’ = ‘less 100’, ‘Width’ = ‘less 20’, ‘Power’ = ‘less 3000’, and ‘Draught’ = ‘less 6’. The crisp value is obviously lower than average (raised from 5.21 to 5.45). Then, removing the human factor by locking the node as 100% no, the crisp value is significantly higher when ‘Human factors’ is ‘Yes’ than ‘No’ (5.61 when ‘Yes’ and 5.25 when the state of human factors is ‘No’). In other words, human factors were more likely to lead to the minor accidents, while other RIFs were more likely to lead to critical accidents. Therefore, it is worth noting that although the autonomous vessels are capable of reducing accident risk by removing the crew onboard, the accident risk for autonomous vessels remains. In other words, besides human factors, other environmental factors are more likely to cause serious accidents, which threatens vessel automation in the Yangtze River.

5.3. Recommendations

In the study, the potential risk of accidents for autonomous vessels has been discussed through the real accident model, which is capable of identifying the interactions among accident-related factors. The study determines that the collision risk is the main risk of using autonomous vessels in restricted and congested waters (e.g., the Yangtze River), even when the human factors are removed. It is easy to understand that collision accidents make up high proportions not only in the collected dataset but also in the annual overview of marine accident records worldwide [43]. However, the model concludes that certain numbers of catastrophic accidents are caused by bad weather conditions, which are not being noticed by collision avoidance program designer. Meanwhile, it has drawn a similar conclusion to relevant studies in that the factor of critical weather conditions needs to be considered by stakeholders. For instance, a poor design of control systems could lead to inadequacies of insensitive actions or even loss of control, which makes it difficult to face sudden impacts caused by choppy wind or water conditions. Thereby an emergency call to develop a dynamic intelligent system for autonomous collision avoidance is suggested.
In terms of the concerns about the potential risk caused by high traffic, the questions are well answered in the study, which shows that the risk between high and low traffic volumes are insignificant. In other words, using autonomous vessels could be a good choice to improve the transportation capacity in the Yangtze River, while ensuring that the accident risk remains at an acceptable level. However, as the lack of the valid communication between traditional and unmanned vessels, the arrival of autonomous vessels will increase the difficulties of collision avoidance. More training should be provided to the existing crews.
Finally, the study notes that the other accident risks (i.e., fires, pollutions) to the use of autonomous vessels remain, and in some cases the risk is even higher than that of traditional vessels. The worst imaginable situation is that the mechanical failures (e.g., short circuit, oil leaking) may lead to catastrophic consequences for unmanned vessels. More attention should be paid to the research works related to emergency responses for autonomous vessels.

6. Conclusions

This paper initially identified the potential accident risk of using autonomous vessels in congested waters (i.e., the Yangtze River). For these aims, a novel Bayesian learning approach was applied to develop an accident causations model, which identified the accident factors and the interrelationships from the historical accident dataset. A sensitivity analysis involving MI and scenario analysis was utilized to validate the presented approach. Some interesting findings were concluded:
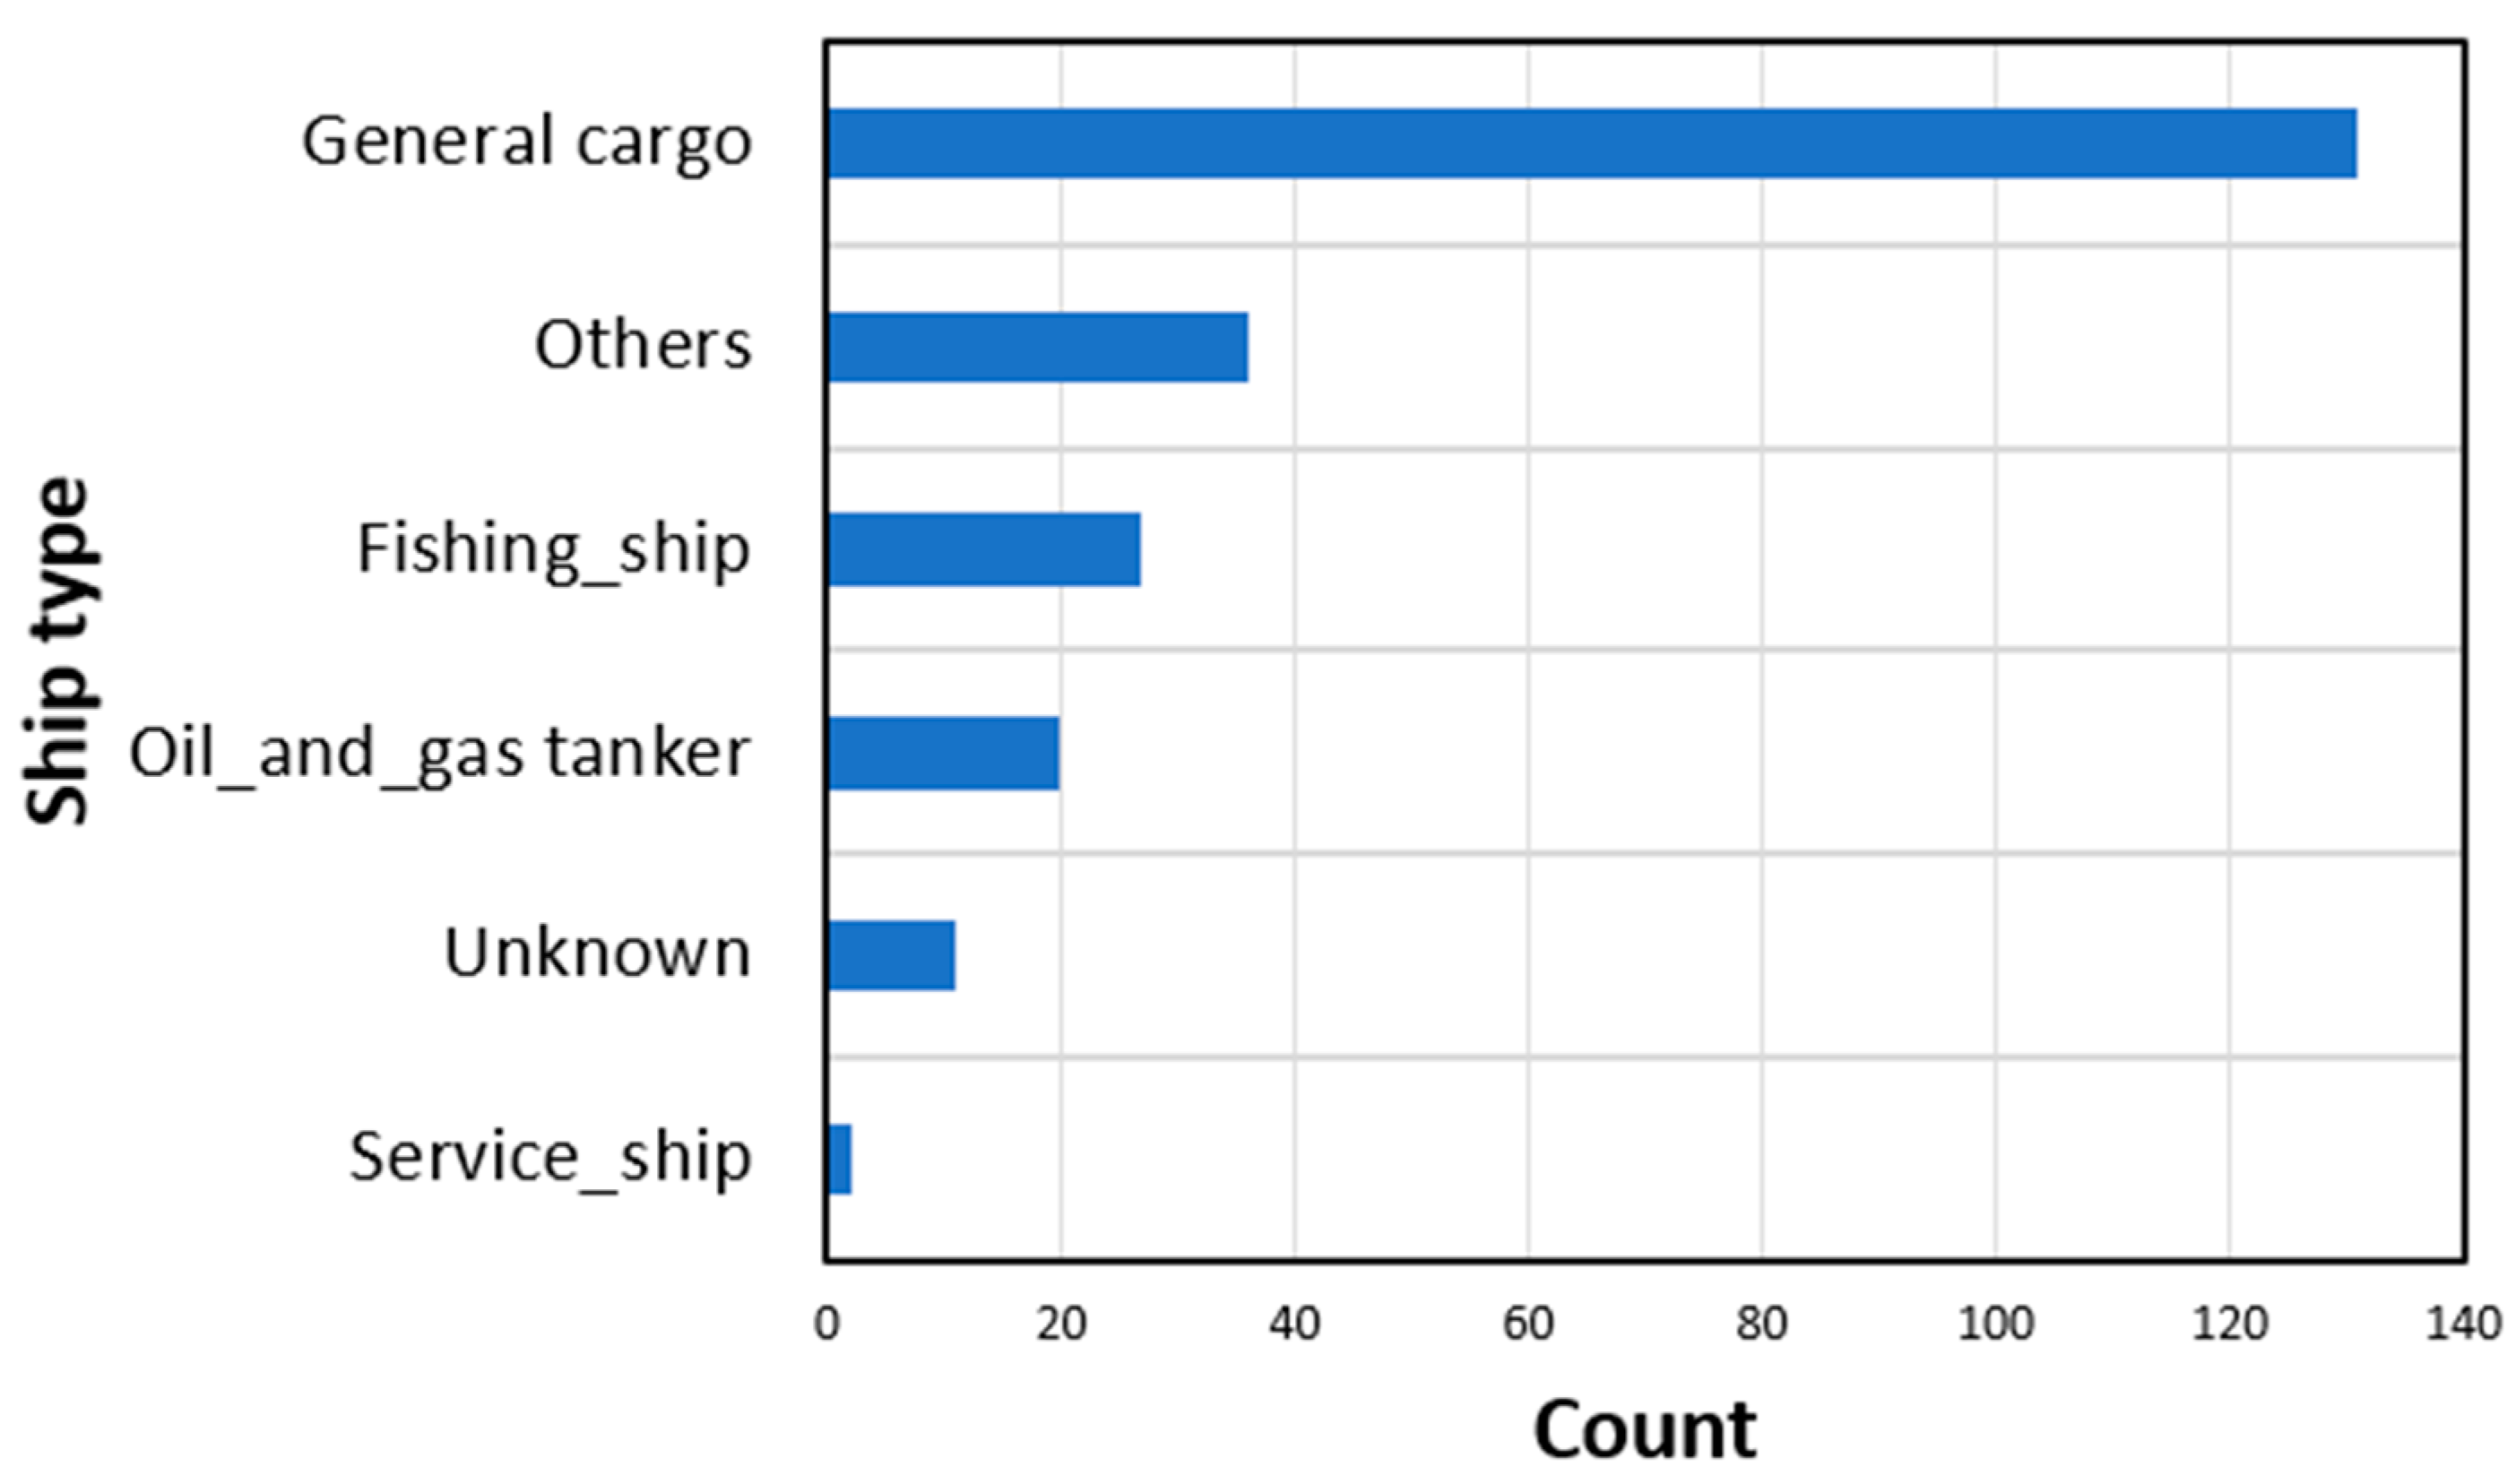
  • Collision accidents make up the majority of accident that occurred in the Yangtze River, and they mostly happen to small autonomous vessels.
  • The use of an autonomous vessel can ease the impacts from ‘Human factors’, ‘Day/night’ and ‘Visibility’, which are proven to be the important RIFs that affect maritime accidents.
  • In terms of the collision risk, the autonomous vessels could face a higher risk of accidents under crossing situations when the ships giving way fail to take sufficient collision avoidance measures. Moreover, bad weather, e.g., rain and heavy sea conditions exacerbate the risk.
  • Although the benefits of using autonomous vessels in the Yangtze River are widely noted, for instance, increasing the transport capacity, reducing collision risk, other accident risks may rise due to the lack of supervision onboard.
  • Although autonomous ships have eliminated human factors, the risk of accidents has not been reduced because of the relationship between human factors and the accident severity.
The above-mentioned findings are beneficial to support the maritime safety of autonomous vessels. However, some limitations are noted: autonomous vessels were not involved in most of the employed accident reports. The shortages would be solved by fusing expert judgements with our Bayesian learning approach in future work. As the network is perfectly constructed, the Dynamic Bayesian Network can be trained for further study.

Author Contributions

Conceptualization, methodology, formal analysis, data curation, X.Z. and Q.Y.; validation, X.Z., H.Y. and Q.Y.; writing—original draft preparation, X.Z.; writing—review and editing, Q.Y. and H.Y.; supervision, H.Y.; funding acquisition, H.Y. All authors have read and agreed to the published version of the manuscript.

Funding

This research was funded in part by Scientific Research Project of Hubei Education Department, grant number D20201501, Natural Science Foundations of China, grant number 52001235, Youth Science Foundation of WIT, grant number 000017/19QD0.

Institutional Review Board Statement

Not applicable.

Informed Consent Statement

Not applicable.

Data Availability Statement

Data sharing not applicable.

Conflicts of Interest

The authors declare no conflict of interest.

References

  1. Abilio Ramos, M.; Utne, I.B.; Mosleh, A. Collision avoidance on maritime autonomous surface ships: Operators’ tasks and human failure events. Saf. Sci. 2019, 116, 33–44. [Google Scholar] [CrossRef]
  2. Ventikos, N.P.; Chmurski, A.; Louzis, K. A systems-based application for autonomous vessels safety: Hazard identification as a function of increasing autonomy levels. Saf. Sci. 2020, 131, 104919. [Google Scholar] [CrossRef]
  3. Wróbel, K.; Montewka, J.; Kujala, P. Towards the assessment of potential impact of unmanned vessels on maritime transportation safety. Reliab. Eng. Syst. Saf. 2017, 165, 155–169. [Google Scholar] [CrossRef]
  4. Porathe, T.; Rødseth, H.; Fjørtoft, K.; Johnsen, S.O. At least as safe as manned shipping? Autonomous shipping, at least as safe as manned shipping? Autonomous shipping, safety and ‘human error’. In Safety and Reliability—Safe Societies in a Changing World, 1st ed.; CRC Press: London, UK, 2018; pp. 417–426. [Google Scholar]
  5. Jalonen, R.; Tuominen, R.; Wahlström, M. Safety of Unmanned Ships: Safe Shipping with Autonomous and Remote Controlled Ships; Aalto University: Helsinki, Finland, 2017. [Google Scholar]
  6. Zhang, D.; Yan, X.P.; Yang, Z.L.; Wall, A.; Wang, J. Incorporation of formal safety assessment and Bayesian network in navigational risk estimation of the Yangtze River. Reliab. Eng. Syst. Saf. 2013, 118, 93–105. [Google Scholar] [CrossRef]
  7. Zhang, D.; Yan, X.; Yang, Z.; Wang, J. A subjective approach for evaluating navigational risk of yangtze river. In Proceedings of the 11th International Probabilistic Safety Assessment and Management Conference and the Annual European Safety and Reliability Conference 2012, PSAM11 ESREL 2012, Helsinki, Finland, 25–29 June 2012. [Google Scholar]
  8. Wang, L.; Yang, Z. Bayesian network modelling and analysis of accident severity in waterborne transportation: A case study in China. Reliab. Eng. Syst. Saf. 2018, 180, 277–289. [Google Scholar] [CrossRef]
  9. Zhang, D.; Yan, X.; Yang, Z.; Wang, J. An accident data—Based approach for congestion risk assessment of inland waterways : A Yangtze River case. J. Reliab. 2013, 288, 176–188. [Google Scholar] [CrossRef]
  10. Van Dorp, J.R.; Merrick, J.R.W. On a risk management analysis of oil spill risk using maritime transportation system simulation. Ann. Oper. Res. 2011, 187, 249–277. [Google Scholar] [CrossRef]
  11. Bye, R.J.; Aalberg, A.L. Maritime navigation accidents and risk indicators: An exploratory statistical analysis using AIS data and accident reports. Reliab. Eng. Syst. Saf. 2018, 176, 174–186. [Google Scholar] [CrossRef]
  12. Fan, S.; Blanco-Davis, E.; Yang, Z.; Zhang, J.; Yan, X. Incorporation of human factors into maritime accident analysis using a data-driven Bayesian network. Reliab. Eng. Syst. Saf. 2020, 203, 107070. [Google Scholar] [CrossRef]
  13. Jokioinen, E.; Poikonen, J.; Jalonen, R.; Saarni, J. Remote and Autonomous Ships—The Next Steps; AAWA Position Paper, Rolls Royce plc: London, UK, 2016. [Google Scholar]
  14. Dghaym, D.; Hoang, T.S.; Turnock, S.R.; Butler, M.; Downes, J.; Pritchard, B. An STPA-based formal composition framework for trustworthy autonomous maritime systems. Saf. Sci. 2021, 136, 105139. [Google Scholar] [CrossRef]
  15. Goerlandt, F. Maritime Autonomous Surface Ships from a risk governance perspective: Interpretation and implications. Saf. Sci. 2020, 128, 104758. [Google Scholar] [CrossRef]
  16. Huang, Y.; Van Gelder, P.H.A.M.J. Collision risk measure for triggering evasive actions of maritime autonomous surface ships. Saf. Sci. 2020, 127, 104708. [Google Scholar] [CrossRef]
  17. Utne, I.B.; Rokseth, B.; Sørensen, A.J.; Vinnem, J.E. Towards supervisory risk control of autonomous ships. Reliab. Eng. Syst. Saf. 2020, 196, 106757. [Google Scholar] [CrossRef]
  18. Chang, C.H.; Kontovas, C.; Yu, Q.; Yang, Z. Risk assessment of the operations of maritime autonomous surface ships. Reliab. Eng. Syst. Saf. 2020, 207, 107324. [Google Scholar] [CrossRef]
  19. Fan, C.; Wróbel, K.; Montewka, J.; Gil, M.; Wan, C.; Zhang, D. A framework to identify factors influencing navigational risk for Maritime Autonomous Surface Ships. Ocean Eng. 2020, 202, 107188. [Google Scholar] [CrossRef]
  20. Chian Tan, W.; Hian Chua, K.; Wu, Y. The Automated Risk Estimation for the Navigation of Autonomous Ships by Learning with Navigation Feature. Int. J. Comput. 2021, 18, 2041003. [Google Scholar] [CrossRef]
  21. Hu, S.; Li, Z.; Xi, Y.; Gu, X.; Zhang, X. Path analysis of causal factors influencing marine traffic accident via structural equation numerical modeling. J. Mar. Sci. Eng. 2019, 7, 96. [Google Scholar] [CrossRef] [Green Version]
  22. Fan, S.; Yang, Z.; Blanco-Davis, E.; Zhang, J.; Yan, X. Analysis of maritime transport accidents using Bayesian networks. Proc. Inst. Mech. Eng. J. Reliab. 2020, 234, 439–454. [Google Scholar] [CrossRef]
  23. Wang, S.; Yin, J.; Khan, R.U. The multi-state maritime transportation system risk assessment and safety analysis. Sustainability 2020, 12, 5728. [Google Scholar] [CrossRef]
  24. Di Nardo, M.; Murino, T. The system dynamics in the human reliability analysis through cognitive reliability and error analysis method: A case study of an LPG company. Int. Rev. Civ. Eng. 2021, 12, 56–68. [Google Scholar]
  25. Soner, O.; Asan, U.; Celik, M. Use of HFACS-FCM in fire prevention modelling on board ships. Saf. Sci. 2015, 77, 25–41. [Google Scholar] [CrossRef]
  26. Knapp, S.; Kumar, S.; Sakurada, Y.; Shen, J. Econometric analysis of the changing effects in wind strength and significant wave height on the probability of casualty in shipping. Accid. Anal. Prev. 2011, 43, 1252–1266. [Google Scholar] [CrossRef] [PubMed]
  27. Li, M.; Mou, J.; Liu, R.; Chen, P.; Dong, Z.; He, Y. Relational model of accidents and vessel traffic using AIS Data and GIS: A case study of the Western port of Shenzhen City. J. Mar. Sci. Eng. 2019, 7, 163. [Google Scholar] [CrossRef] [Green Version]
  28. Heij, C.; Knapp, S. Evaluation of safety and environmental risk at individual ship and company level. Transp. Res. Transp. Environ. 2012, 17, 228–236. [Google Scholar] [CrossRef]
  29. Balmat, J.F.; Lafont, F.; Maifret, R.; Pessel, N. A decision-making system to maritime risk assessment. Ocean Eng. 2011, 38, 171–176. [Google Scholar] [CrossRef]
  30. Talley, W.K.; Yip, T.L.; Jin, D. Determinants of vessel-accident bunker spills. Transp. Res. Transp. Environ. 2012, 17, 605–609. [Google Scholar] [CrossRef]
  31. Mullai, A.; Paulsson, U. A grounded theory model for analysis of marine accidents. Accid. Anal. Prev. 2011, 43, 1590–1603. [Google Scholar] [CrossRef] [Green Version]
  32. Sotiralis, P.; Ventikos, N.P.; Hamann, R.; Golyshev, P.; Teixeira, A.P. Incorporation of human factors into ship collision risk models focusing on human centred design aspects. Reliab. Eng. Syst. Saf. 2016, 156, 210–227. [Google Scholar] [CrossRef]
  33. Celik, M.; Lavasani, S.M.; Wang, J. A risk-based modelling approach to enhance shipping accident investigation. Saf. Sci. 2010, 48, 18–27. [Google Scholar] [CrossRef]
  34. Zhang, M.; Zhang, D.; Goerlandt, F.; Yan, X.; Kujala, P. Use of HFACS and fault tree model for collision risk factors analysis of icebreaker assistance in ice-covered waters. Saf. Sci. 2017, 111, 128–143. [Google Scholar] [CrossRef]
  35. Uğurlu, Ö.; Köse, E.; Yıldırım, U.; Yüksekyıldız, E. Marine accident analysis for collision and grounding in oil tanker using FTA method. Marit. Policy Manag. 2013, 42, 163–185. [Google Scholar] [CrossRef]
  36. Weber, P.; Medina-Oliva, G.; Simon, C.; Iung, B. Overview on Bayesian networks applications for dependability, risk analysis and maintenance areas. Eng. Appl. Artif. Intell. 2012, 25, 671–682. [Google Scholar] [CrossRef] [Green Version]
  37. Trucco, P.; Cagno, E.; Ruggeri, F.; Grande, O.A. Bayesian Belief Network modelling of organisational factors in risk analysis: A case study in maritime transportation. Reliab. Eng. Syst. Saf. 2008, 93, 845–856. [Google Scholar] [CrossRef]
  38. Cooper, G.F.; Herskovits, E. Bayesian Method for the Induction of Probabilistic Networks from Data. Mach. Learn. 1992, 9, 309–347. [Google Scholar] [CrossRef]
  39. Yu, Q.; Liu, K.; Yang, Z.; Wang, H.; Yang, Z. Geometrical risk evaluation of the collisions between ships and offshore installations using rule-based Bayesian reasoning. Reliab. Eng. Syst. Saf. 2021, 210, 107474. [Google Scholar] [CrossRef]
  40. Zhang, J.; Teixeira, P.; Soares, C.G.; Yan, X.; Liu, K. Maritime Transportation Risk Assessment of Tianjin Port. Risk. Anal. 2016, 36, 1171–1187. [Google Scholar]
  41. Yu, Q.; Liu, K.; Chang, C.; Yang, Z. Realising advanced risk assessment of vessel traffic flows near offshore wind farms. Reliab. Eng. Syst. Saf. 2020, 203, 107086. [Google Scholar] [CrossRef]
  42. Zhang, J.; Yan, X.; Zhang, D.; Haugen, S.; Yang, X. Safety management performance assessment for Maritime Safety Administration (MSA) by using generalized belief rule base methodology. Saf. Sci. 2014, 63, 157–167. [Google Scholar] [CrossRef]
  43. European Maritime Safety Agency. Annual Overview of Marine Casualties and Incidents. European Union. 2020. Available online: http://www.emsa.europa.eu/newsroom/latest-news/item/4266-annual-overview-of-marine-casualties-and-incidents-2020.html (accessed on 4 September 2021).
Figure 1. The distribution of ship type.
Sustainability 13 09985 g001
Figure 2. The distribution of accident severity.
Sustainability 13 09985 g002
Figure 3. The structure of the BN.
Sustainability 13 09985 g003
Figure 4. The fine-tuned BN structure.
Sustainability 13 09985 g004
Figure 5. The probabilities of the BN.
Sustainability 13 09985 g005
Figure 6. Collision accidents in the Yangtze River.
Sustainability 13 09985 g006
Table 1. RIFs from the relevant literature.
Literature SourcesShip TypeShip AgeShip FlagShip SpeedTonnageRain, Fog, WindVisibilityLocationSeasonTime of a DayHuman Factors
Wang et al. [23]
Hu et al. [21]
Wang and Yang [8]
Fan et al. [12]
Heij and Knapp [28]
Knapp et al. [26]
Balmat et al. [29]
Talley et al. [30]
Li et al. [27]
Mullai and Paulsson [31]
Sotiralis et al. [32]
√: The related RIFs used in the study.
Table 2. Dataset example.
12345678910
Human error ( x 1 )YesNoYesYesYesNoYesNoYesYes
Accident ( x 2 )YesYesNoYesYesNoYesYesYesYes
Table 3. Definitions of the Risk Influence Factors (RIFs).
NumberFactorsUnitDescriptions
1LengthmetreLess 100, Between 100 and 200, More than 200
2WidthmetreLess 20, Between 20 and 30, Between 30 and 40, More than 40
3TonnagetonLess 3000, Between 3000 and 20000, More than 20000
4DraughtmetreLess 6, Between 6 and 9, More than 9
5PowerkilowattLess 3000, More than 3000
6Ship type Oil and gas tanker, General cargo, Fishing ship, Service ship, Others
7Hull material Steel, aluminium alloy, wood
8AgeyearLess 10, Between 10 and 20, More than 20
9Season Spring, Summer, Autumn, Winter
10Day/Night Day (8:00–17:00), Night (19:00–5:00), Twilight (5:00–7:00 and 17:00–19:00)
11SpeedknotLow (2–6), Average (6–12), High (greater than 12)
12Encounter state Crossing, Head on, Overtaking, None
13Density High, Low
14Navigation states Navigating, Anchoring, Special working conditions
15Weather Cloud, Wind, Rain, Fog
16Extreme weather conditions Yes, No
17Visibilitynautical miles (nm)Less 2, Between 2 and 10, over 10
18Type of accident Collision, Allision, Grounding, Fire/explosion, Sinking, Others
19Human factors Yes, No
Table 4. Classification of the consequences of accidents.
MinorMajorCriticalCatastrophic
Ships over 3000 gross tonnageBelow minor accidentSerious injury, or economic loss between 500 k * and 3000 k1–2 fatalities, or economic loss between 3000 k and 5000 kOver 2 fatalities, or economic loss over 5000
Ships between 500 and 3000Below minor accidentSerious injury, or economic loss between 200 k and 500 k1–2 fatalities, or economic loss between 500 k and 3000 kOver 2 fatalities, or economic loss over 3000
Ships below 500 gross tonnageBelow minor accidentSerious injury, or economic loss between 100 k and 200 k1–2 fatalities, or economic loss between 200 k and 500 kOver 2 fatalities, or economic loss over 500 k
* Thousand Chinese Yuan (CNY).
Table 5. Mutual information results.
FactorEntropy Value(Percent) Ratio
Accident severity1.73100
Encounter state0.34219.77
Hull material0.28616.53
Tonnage0.1589.13
Width0.1589.13
Ship type0.1337.69
Length0.1186.82
Human factors0.0533.06
Draught0.0261.50
Navigation states0.0231.33
Weather0.0160.92
Density0.0150.87
Type of accident0.0150.87
Season0.0090.52
Visibility0.0080.46
Day/night0.0040.23
Extreme weather conditions0.0040.23
Power
Speed
Age
Publisher’s Note: MDPI stays neutral with regard to jurisdictional claims in published maps and institutional affiliations.

