1. Introduction
The origin of information asymmetry is found in the lemon market theory proposed in 1970 by the 2001 Nobel laureate economist Akerlof [
1]. In a free market, it should be easy to strike a deal between the buyer and the seller with payment and delivery, but this is often not the reality. As the theory posits, information asymmetry about the product is the main reason. Akerlof uses the secondhand car market as an example. Only the seller knows whether the car is good or not, and the buyer has no idea. A buyer who has been cheated would then tell others, and as a result, all buyers would only be willing to make low price offers for secondhand cars so as to mitigate risks and avoid losses. This in turn makes the sellers with actual quality secondhand cars less willing to trade compared to somebody with a “lemon” (an American slang meaning an inferior product), because the price is simply too bad. The overly low price also discourages sellers from providing quality products. Consequently, low-quality goods awash the market and high-quality goods are squeezed out. In the end, the secondhand market shrinks or even disappears. Information asymmetry among market participants causes adverse selection and moral hazards, and bad money drives out good money in the market.
Information asymmetry is commonplace in the capital markets due to agency problems [
2]. This is particularly the case with financial statements on which companies present operating results, corporate health, and the ability for sustainable development. As senior managers possess information different from others, it is difficult for shareholders, creditors, employees, and other stakeholders to understand the true picture of the company’s financials, until the company sinks into financial distress or declares bankruptcy [
3]. This may compromise the public’s confidence in the financial system [
4] or even the capital market [
5,
6]. It is in opposition to the health, development, and sustainability of the global capital market [
7].
Financial statements are the basic reports that reflect the financial status and operating results of a company. They are also the primary reference for decision making by investors, shareholders, creditors, employees, other stakeholders, and other users of accounting and financial reporting information [
8,
9,
10,
11]. The faithful representation of a company’s operating result and financial status in financial statements is indeed a form of corporate social responsibility to society and the capital market.
The Enron scandal in the U.S. in 2001 and the global financial crisis spanning 2008–2009 severely damaged the world economy. One of the main causes of these events was the failure of CPAs and auditors through issuances of inaccurate audit reports [
3,
12]. There has also been much financial statement fraud in the Taiwan capital market. Examples include PEWC, Procomp Informatics, Infodisc Technology, Summit Technology, and ABIT Computer in 2004, Rebar in 2007, XPEC Entertainment in 2016, and Pharmally and TOPBI in 2020–2021.
According to the 2020 Global Study on Occupational Fraud and Abuse published by the U.S. Association of Certified Fraud Examiners [
13], financial statement fraud occurs at a lower frequency than asset misappropriation and corruption but cause higher economic losses than other fraud. The integration of the international capital markets and the complexity of economic models these days have seen a growing variety of fraudulent practices. Fraud prevention is becoming more and more difficult. Therefore, the effective reduction and prevention of financial statement fraud are imperative.
CPAs or auditors are sometimes involved in fraud. The Enron scandal in the U.S. in 2001 is the most obvious case in point. Enron Corporation’s external auditor, Arthur Andersen, was headquartered in Chicago of the U.S. and was among the Big Five accounting firms in the world at that time. Following the scandal, parts of Arthur Andersen were acquired Ernst and Young (EY) and parts by Price Waterhouse Coopers (PwC). Arthur Andersen was accused of using reckless audit standards due to a conflict of interest from the huge fees paid by Enron. In 2000, Arthur Andersen received USD 25 million in audit fees and USD 27 million in consulting fees from Enron. The audit method was questioned, because of a lack of appropriate audits on Enron’s revenue recognition and knowledge in auditing special purpose entities (SPEs), derivatives, and other accounting topics [
14].
After the Enron fraud in 2001, the U.S. Congress passed the Sarbanes–Oxley Act (SOX Act) in 2002 to protect the rights of the investing public and the functioning of capital markets. The SOX Act mainly covers the strengthening of regulatory oversight, corporate governance, and CPA independence. It also enhances the legal liability of company CEOs, CFOs, and external CPAs. The SOX Act requires U.S. listed companies to ensure the effectiveness of internal control procedures and auditors to prove management’s internal control assessment. The SOX Act seeks to increase the robustness of financial reporting procedures in order to reduce financial statement fraud.
According to the 2002 SOX Act, the Public Company Accounting Oversight Board (PCAOB) was established as the regulator of CPAs auditing the financial statements of public companies in the U.S. The stringent requirement is for CPAs and auditors to avoid willful or material negligence and to shun away from direct or indirect assistance to management’s financial statement fraud. Subsequently, the American Institute for Certified Public Accountants (AICPA) published the Statement on Auditing Standards No. 99 (SAS 99): Consideration of Fraud in a Financial Statement Audit, to foster accuracy and reliability of financial reporting and disclosure. Under the regulation of the Sarbanes–Oxley Act and SAS 99, CPAs and auditors must gather the adequate and appropriate evidence to determine the issuance of audit reports and opinions on the audited company as a going concern. To deter and avoid fraud in financial statements, the board should also establish an effective management system and fraud prevention mechanism [
9].
Taiwan implemented “Consideration of Fraud in a Financial Statement Audit” Auditing Standard Bulletin No. 43 [
15] in 2006. Bulletin 43 sets out specific regulations on the audits conducted by CPAs and auditors, in order to ensure effective audits on errors in financial reporting and to prevent material and unfaithful representation of financial statements due to fraud. Audit teams should discuss the possibility of management seeking to manipulate earnings and devise audit procedures and measures accordingly. Auditing Standards Bulletin No. 74 [
16] effective at the end of 2020 was formulated in reference to the International Standards on Auditing (ISA) 240 (ISA 240) under the same topic of auditors’ responsibilities relating to fraud in the audit of financial statements. This replaced “Consideration of Fraud in a Financial Statement Audit” Auditing Standards Bulletin No. 43 released in 2006. According to Auditing Standards Bulletin No. 74, financial statement fraud involve willful and unfaithful representation, including deliberate and erroneous amounts, omissions, or negligence in disclosure, so as to deceive users of financial statements. To mislead the users of financial statements and influence the perception about corporate performance and profitability, management may attempt to manipulate earnings and conduct fraudulent financial reporting.
Earnings manipulation typically starts with small and inappropriate adjustments to assumptions or changes to judgement. This escalates to financial statement fraud due to pressure and incentives. Financial statement fraud comes in a number of forms: (1) manipulation, forgery, or tampering of accounting records or relevant evidence; (2) intentional and unfaithful statement or deliberate omission of transactions, events, or other material information; and (3) willful and erroneous use, recognition, measurement, classification, expression, or disclosures of relevant accounting principles. The reasons contributing to fraud can be classified into three categories: (1) incentives or pressure; (2) opportunities and attitudes; and (3) behavioral rationalization. This is the fraud triangle people are familiar with. In addition to audits carried out according to generally accepted auditing principles, auditors have the responsibility to exercise professional skepticism throughout the audit process, take into account the possibility of management breaching control, and perceive fraud that can slip through effective audit procedures for errors.
Article 9 of Auditing Standards Bulletin No. 74 says, “Regarding the failure of the audited parties in compliance (such as committing fraud), auditors may have extra responsibility under laws and regulations or relevant occupational ethics, or the laws and regulations or the relevant occupational ethics may have different requirements from this or other bulletins or outside the scope of this or other bulletins.” Compared with Auditing Standards Bulletin No. 43, Auditing Standards Bulletin No. 74 require auditors, in the event of identified fraud or suspicious fraud, to confirm whether laws or relevant occupational ethics demand that: (1) CPAs should report to appropriate competent authorities; and (2) CPAs should honor responsibilities when it is appropriate to report to appropriate competent authorities. In addition to the definition of fraud characteristics and the responsibilities of preventing and detecting fraud, Auditing Standards Bulletin No. 74 also emphasizes the exercise of professional skepticism by CPAs and auditors and the discussion within audit teams. The exercise of professional skepticism requires auditors to continuously question the information and audit evidence obtained for any material and unfaithful representation due to fraud. This includes consideration of the reliability of the information as audit evidence and identification of the elements in control operations concerning the control over the preparation and maintenance of such information. Due to the unique nature of fraud, the exercise of professional skepticism is particularly important in the consideration of the risks of material and unfaithful representations. Even if experience tells auditors that management and governance units are honest and reliable, there may still be material and unfaithful representations as a result of fraud. Auditors should exercise professional skepticism throughout the entire audit process.
“Audit Reports on Financial Statements” Auditing Standards Bulletin No. 57 [
17] effective in 2016 primarily regulates the responsibility of CPAs in forming the audit opinions on financial statements and the format and contents of the issued audit reports based on audit results. According to Auditing Standards Bulletin No. 57, CPAs should form audit opinions based on whether all the material aspects of the financial statements are prepared by following the applicable financial reporting framework. To form audit opinions, CPAs should reach conclusions regarding whether it can be reasonably assured that there are no material unfaithful representations in the financial statements due to fraud or errors. When a CPA arrives at conclusions regarding whether all material aspects of the financial statements follow the applicable financial reporting framework, the CPA should issue an unqualified audit opinion. The circumstances where modified opinions must be issued are regulated and guided in detail in “Modified Audit Opinions” Auditing Standards Bulletin No. 59 [
18] effective in 2018.
When auditing the financial statements of TWSE/TPEx listed companies for general purposes, CPAs should also observe the regulations described in “Communication of Key Audit Matters for Auditing Reports” Auditing Standards Bulletin No. 58 [
19] effective in 2018 regarding the communication of key audit matters when auditing reports.
With the COVID-19 global crisis, the number of infections and deaths has increased, and the impact on the performance indicators, sustainability, sustainable development of capital markets, and information asymmetry of companies is extremely huge and unprecedented. Some literature points out that the impact of COVID-19 includes: economic recession, stock market turmoil, severe employment situation (increased unemployment), depression in travel and related industries, medical system collapse, corporate financial distress or bankruptcy [
20,
21,
22,
23,
24]. Because of these severe impacts, the performance of enterprises is worse, and the sustainability and sustainable development of capital markets have been negatively affected. Of course, the information will be more opaque and the information asymmetry will be more obvious and serious. Furthermore, COVID-19 has changed the type of work and the way of going to work. Many companies adopt the method of remote work, and performance indicators must be changed accordingly. The huge harm and economic and commercial losses caused by COVID-19 will indeed increase the motivation and behavior of financial statement fraud. CPAs and auditors should be more careful during the audit process, especially for physical inventory and important confirmations. In 2020, the Financial Examination Bureau in Taiwan published “Matters of Attention for Remote Auditing of Financial Reports for Publicly Issued Companies” due to the impact of COVID-19 on audits. The purpose of these matters of attention is to remind auditors to make use of digital technology in the assistance for the acquisition of appropriate audit evidence. However, this does not replace audit procedures, and CAPs may not refer to the matters of attention as a basis for audit opinions.
The UN Global Compact proposed the concept of ESG (environment, social, governance) in 2004, which is regarded as an indicator for evaluating the operation of a company. There are three main aspects of ESG. Environmental protection: greenhouse gas emissions, water and sewage management, biodiversity and other environmental pollution prevention and control. Social responsibility: customer welfare, labor relations, diversification and inclusiveness and other aspects of the stakeholders affected by the sales industry. Corporate governance: business ethics, competitive behavior, supply chain management, etc. are related to company stability and reputation. Due to the challenges of the current business environment, green and sustainable finance, corporate social responsibility, and financial and non-financial performance are attracting widespread attention. In addition, green and sustainable finance, corporate social responsibility, and intellectual and human capital have become core issues for measuring organizational success, competitive advantage, and market influence [
25]. If the company’s operators and top management can pay more attention to corporate social responsibility, uphold conscience and sustainable operation, it will also reduce the occurrence of financial statement fraud.
Financial statement fraud may be a precursor to financial distress or bankruptcy of an enterprise, and has a great impact on macro and business activity levels, especially the listed companies. The macro impact includes: capital markets, financial markets, and even the country’s overall economy and GDP. The impact at the business activity level includes: the sustainable operation of the company and the interests of the stakeholders (shareholders, creditors, customers, suppliers, employees, and social relations).
Governments around the world have formulated stricter regulations to prevent financial statement fraud and required company boards to establish an effective internal control and fraud prevention mechanism and for CPAs and auditors to carefully carry out audits. However, financial statement fraud emerges from time to time. It is imperative to find an effective model to detect financial statement fraud so that CPAs and auditors can use this tool as assistance for better decision-making and issuance of accurate audit reports and opinions. This also avoids any losses due to audit failures. One after another, corporate fraud compromise the creditability of CPAs and affect the reliability of financial reporting principles and audit standards and the effectiveness of regulatory regimes. This is the responsibility shared by practitioners and academics.
To tackle the shortcomings of the traditional approach to financial statement fraud detection and to embrace the era of big data and artificial intelligence, the use of deep learning algorithms to detect financial statement fraud appears to be the way to go, but there is limited literature. Deep learning algorithms can quickly and effectively handle large amounts of data and are powerful tools for modeling. This study thus aims to use the recurrent neural network (RNN) and long short-term memory (LSTM), two powerful and advantageous deep learning algorithms, to construct a detection model for financial statement fraud. Both financial and non-financial variables (also known as corporate governance variables) are used. The purpose is to establish an effective detection model for financial statement fraud, so as to enhance the awareness of financial statement users in potential fraud and detect the signs of financial statement fraud. This model is expected to reduce the losses due to financial statement fraud and maintain the sustainable development of capital markets.
2. Related Works
Some studies in the literature indicate that financial statement fraud is increasingly serious [
8,
9,
10,
11,
26,
27,
28]. What is worse is that criminals are getting better at circumventing regulatory schemes, and fraud are evolving into greater complexity [
29]. In fact, most financial statement fraud is implemented with the awareness or consent of management [
30]. Ill-intended managers seek to manipulate earnings by committing financial statement fraud [
31].
Except for major shareholders sitting on the board, most shareholders cannot directly participate in corporate operations, but rather have no choice but to entrust the company to management. This inevitably creates information asymmetry and insufficient transparency due to agency problems. At this juncture, it is up to the ethical standard of managers, the robust auditing of financial statements, and the issuance of close to faithful audit reports and opinions by CPAs (certified public accountants) and auditors. Except for CPAs who collude with management by issuing untruthful audit reports and opinions, most CPAs adhere to occupational ethics, relevant accounting and audit standards, and financial laws and regulations. However, audit failure occurs from time to time. This seriously undermines the reputation of CPAs and may lead to claims by investors for compensations or even criminal liability. Many business decisions depend on the accuracy of financial statements, given the lack of available resources for complete due diligence. In fact, the penalties on perpetrators are not a sufficient deterrent in many regulatory jurisdictions [
32].
The detection of financial statement fraud is difficult and challenging [
33]. The traditional approaches to the detection of financial statement fraud are regression analysis, discriminant analysis, cluster analysis, and factor analysis. Hamal and Senvar [
34] suggest that the detection of financial statement fraud requires sophisticated analytical tools and techniques, rather than the traditional methods adopted by decision-makers like auditors. However, there is no one-size-fits-all method for the detection of financial statement fraud according to the literature. Craja, Kim, and Lessmann [
35] indicate that the models constructed with machine learning techniques can effectively detect financial statement fraud, keep up with the constant evolution of financial reporting fraudulent behavior, and adopt the newest technology to respond. Gupta and Mehta [
36] also prove that the detection models built with machine learning techniques boast higher accuracy than traditional methods. Most of the early studies on the detection of financial statement fraud refer to financial ratios as the research variable. Current research widely uses both financial ratios and non-financial variables (or corporate governance variables), given the advocacy and emphasis of corporate governance by practitioners [
6,
8,
10,
28,
32,
37,
38,
39].
Different from studies relying on traditional statistical methods, some literature uses data mining and machine learning techniques for the detection of financial statement fraud. In addition to better accuracy in prediction than traditional statistical methods, data mining and machine learning techniques produce more accurate classifications and predictions with machine learning on massive amounts of data [
9,
10,
40]. Moreover, data mining and machine learning techniques do not need the presumptions required by traditional statistics and can effectively handle non-linear problems [
9]. For example, methods such as Artificial Neural Network (ANN), Support Vector Machine (SVM), Decision Tree (DT), and Bayesian Belief Network (BBN) are being used to detect financial statement fraud [
7,
8,
10,
28,
32,
34,
38,
40,
41]. In the era of artificial intelligence, deep learning techniques are used by studies for the detection of financial statement fraud [
35,
42]. Compared to machine learning, deep learning can better process massive volumes of data and have greater predictivity [
43]. While deep learning is based on neural networks, it has more layers than neural networks and can effectively capture features and handle complex issues. Compared to machine learning, it can more effectively detect financial statement fraud [
35].
4. Empirical Results
According to
Section 3.4 Sampling and Research Process, the empirical results of this study based on the RNN model and the LSTM model are as follows.
For the algorithms, programming, and coding of this study, please see the
Appendix A.
4.1. Validation for Modeling
Validation is important to modeling. This study adopts a number of measures to ensure model validity.
First, the raw data are normalized and standardized, so that all values are between 0 and 1. Normalization and standardization provide two benefits to machine learning algorithms: (1) acceleration of convergence speed; and (2) enhancement of model detection accuracy.
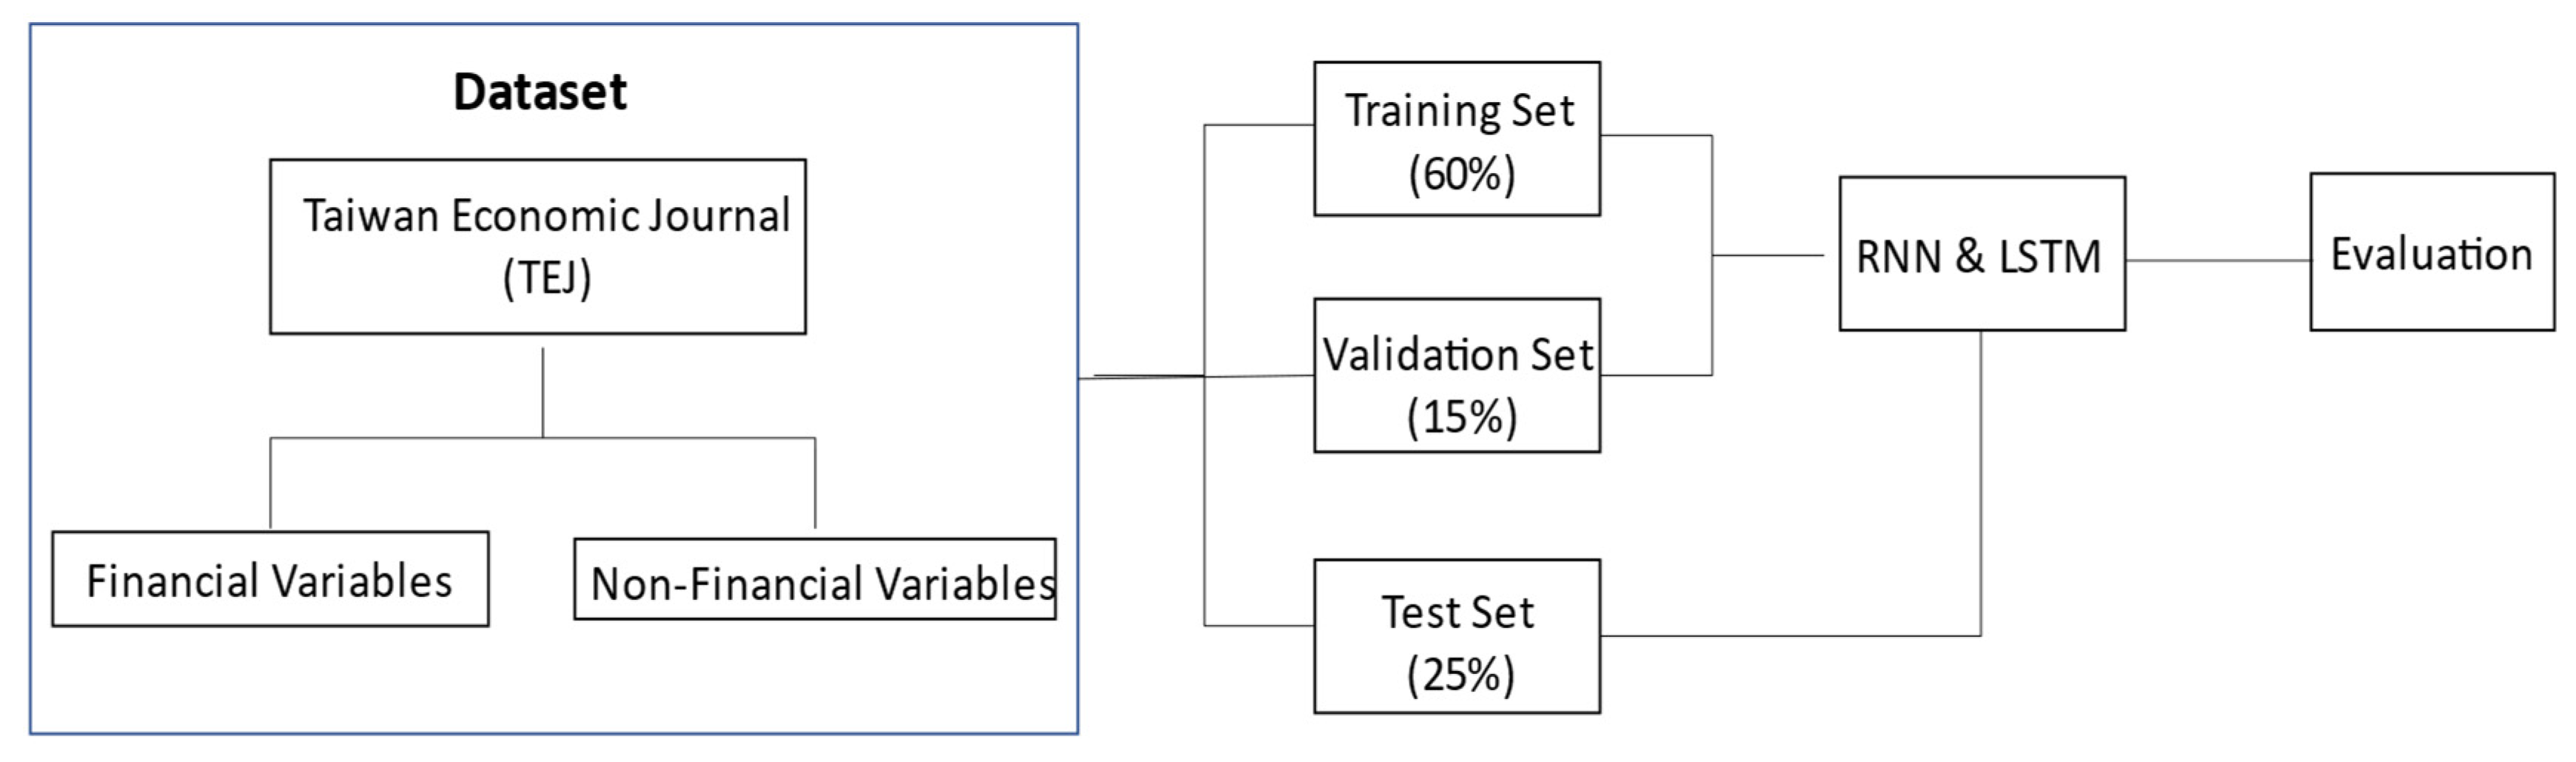
Second, data are randomly sampled and not sent back to the pool, to avoid bias due to repeated sampled data. In the process of RNN and LSTM modeling, 60% (= 80% × 75%) of the data are randomly sampled as the training dataset for parameter fitting in the learning process. The best detection model is established via constant optimization. The validation dataset is based on 15% (= 20% × 75%) randomly sampled data, for the validation of the model and the status of convergence. Hyper-parameters are adjusted to avoid overfitting and to determine the stopping point of training. The remaining 25% of data serve as the test dataset to assess model generalization and detection capabilities after 250 epochs.
Third, the optimizer Adaptive Moment Estimation (Adam) built in TensorFlow is used to adjust the optimal parameters in this study. These optimal parameters are: learning rate = 0.001, beta 1 = 0.9, beta 2 = 0.999, epsilon = 1 × 10⁻⁷, batch size = 3, epochs = 250, validation_split = 0.2, dropout = 0.25, activation = Sigmoid and ReLU.
Finally, a loss function is deployed for model optimization. Multiple performance metrics are referenced to assess the model performance. These metrics include the confusion matrix (accuracy, precision, sensitivity (recall), specificity, and F1 score), Type I and Type II error rate, and ROC curve/AUC.
4.2. RNN Modeling and the RNN Model
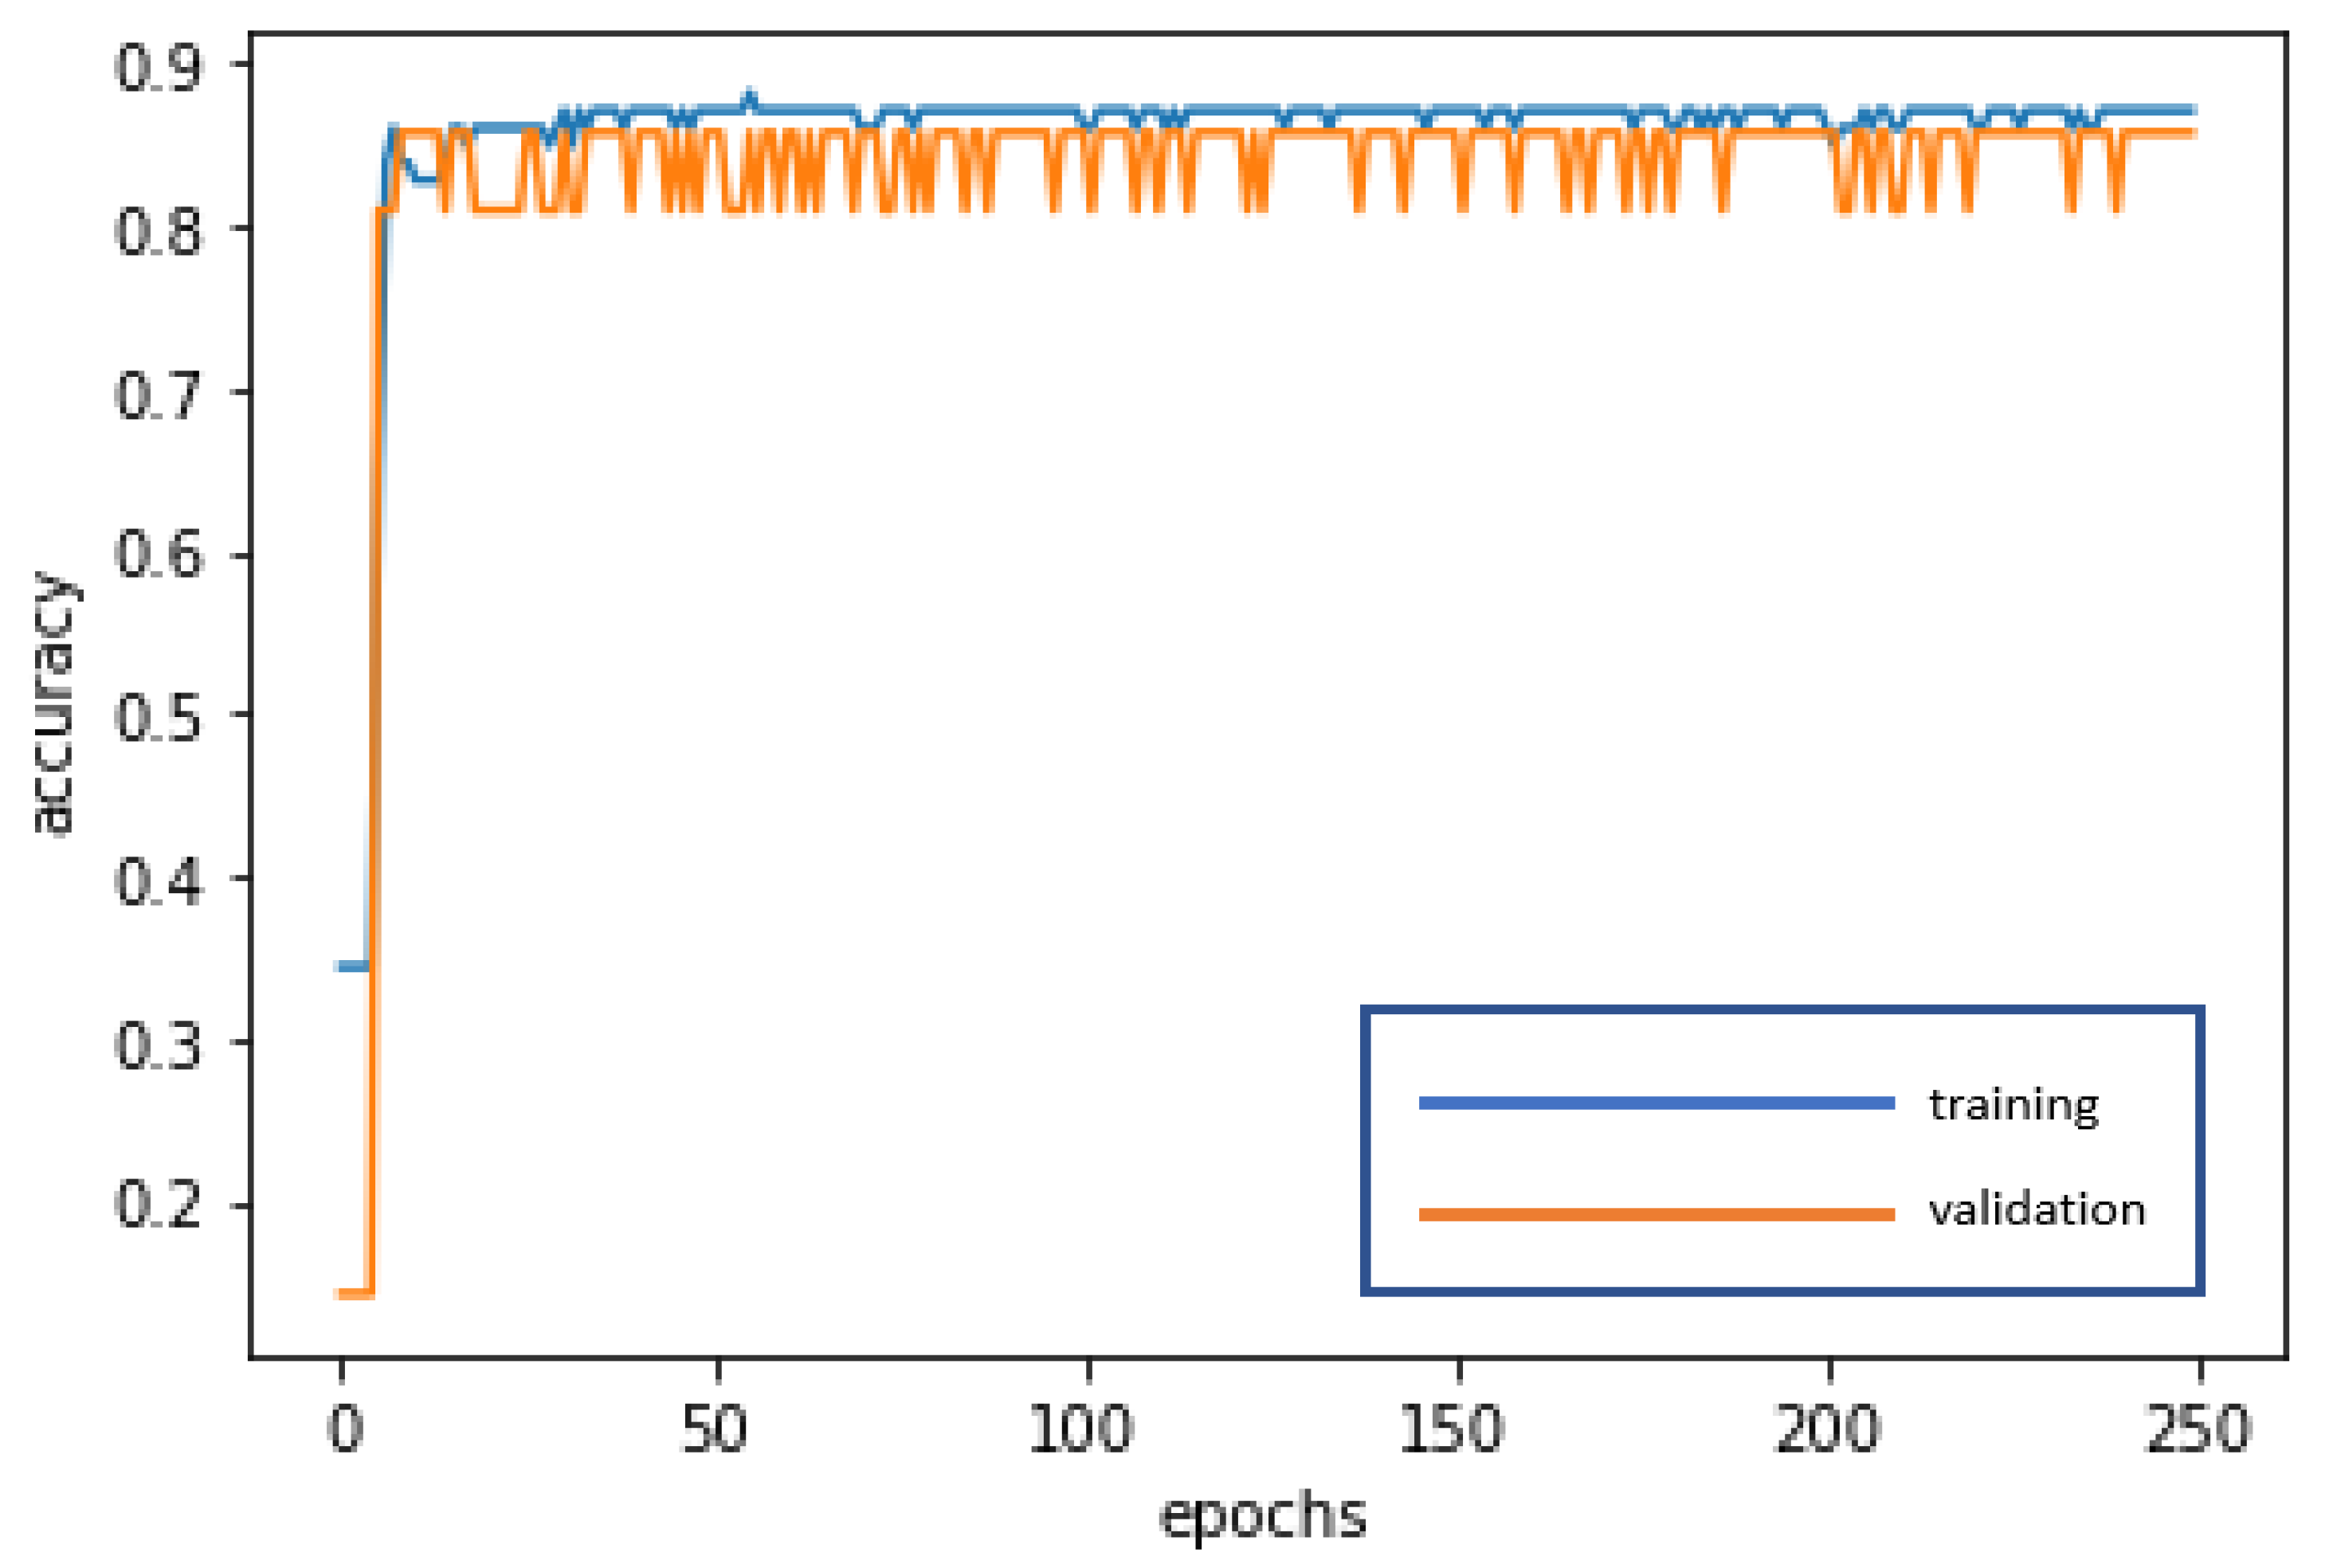
The RNN is used for deep learning and training to achieve stabilization and establish the optimal model. The loss curve becomes smoother, the gradient drops, and the accuracy improves along with training. The training of 250 epochs only takes 0.3 seconds. The training dataset and the validation dataset exhibit accuracy of 87.10% and 85.71%, respectively. The test dataset is also used to test model stability with an accuracy of 87.18%. The limited difference in the results with the training dataset and the validation dataset demonstrates model stability and goodness-of-fit (no overfitting). The model accuracy rates are summarized in
Table 3.
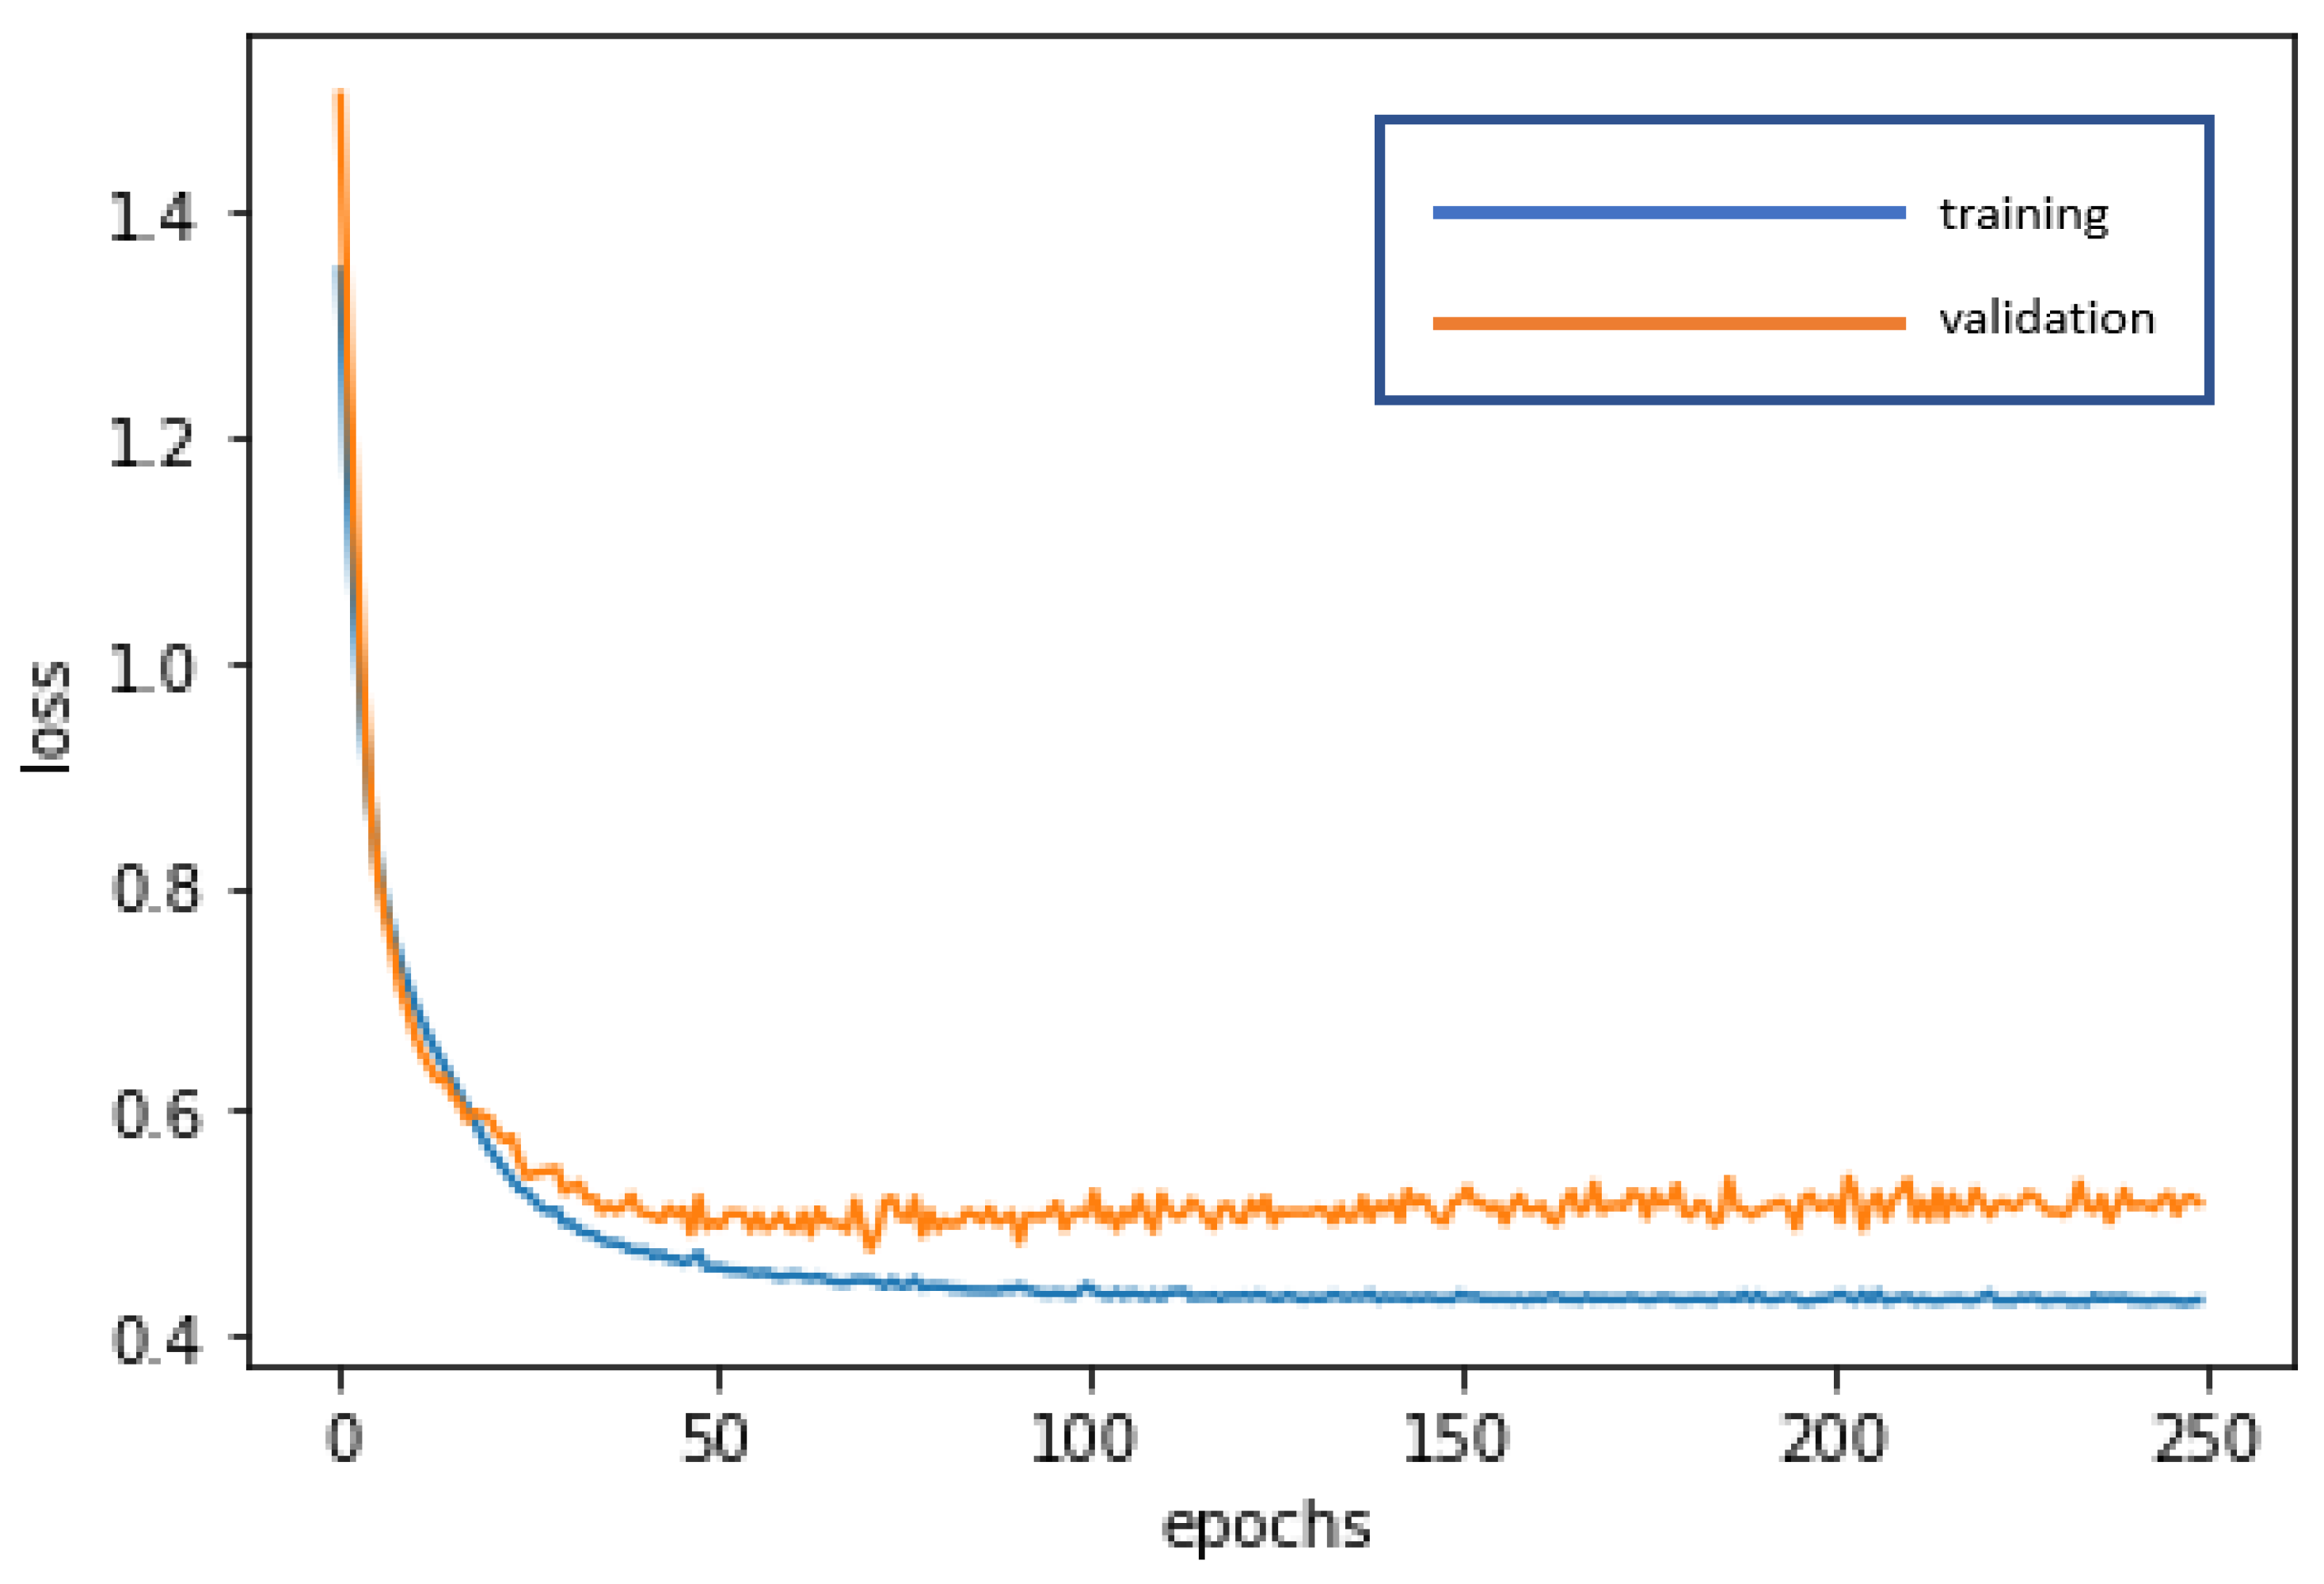
Figure 4 and
Figure 5 present the loss function graph and the accuracy graph of the modeling process. Type I error rate and Type II error rate of the test dataset are 5.13% and 7.69%, respectively. These levels are not considered high.
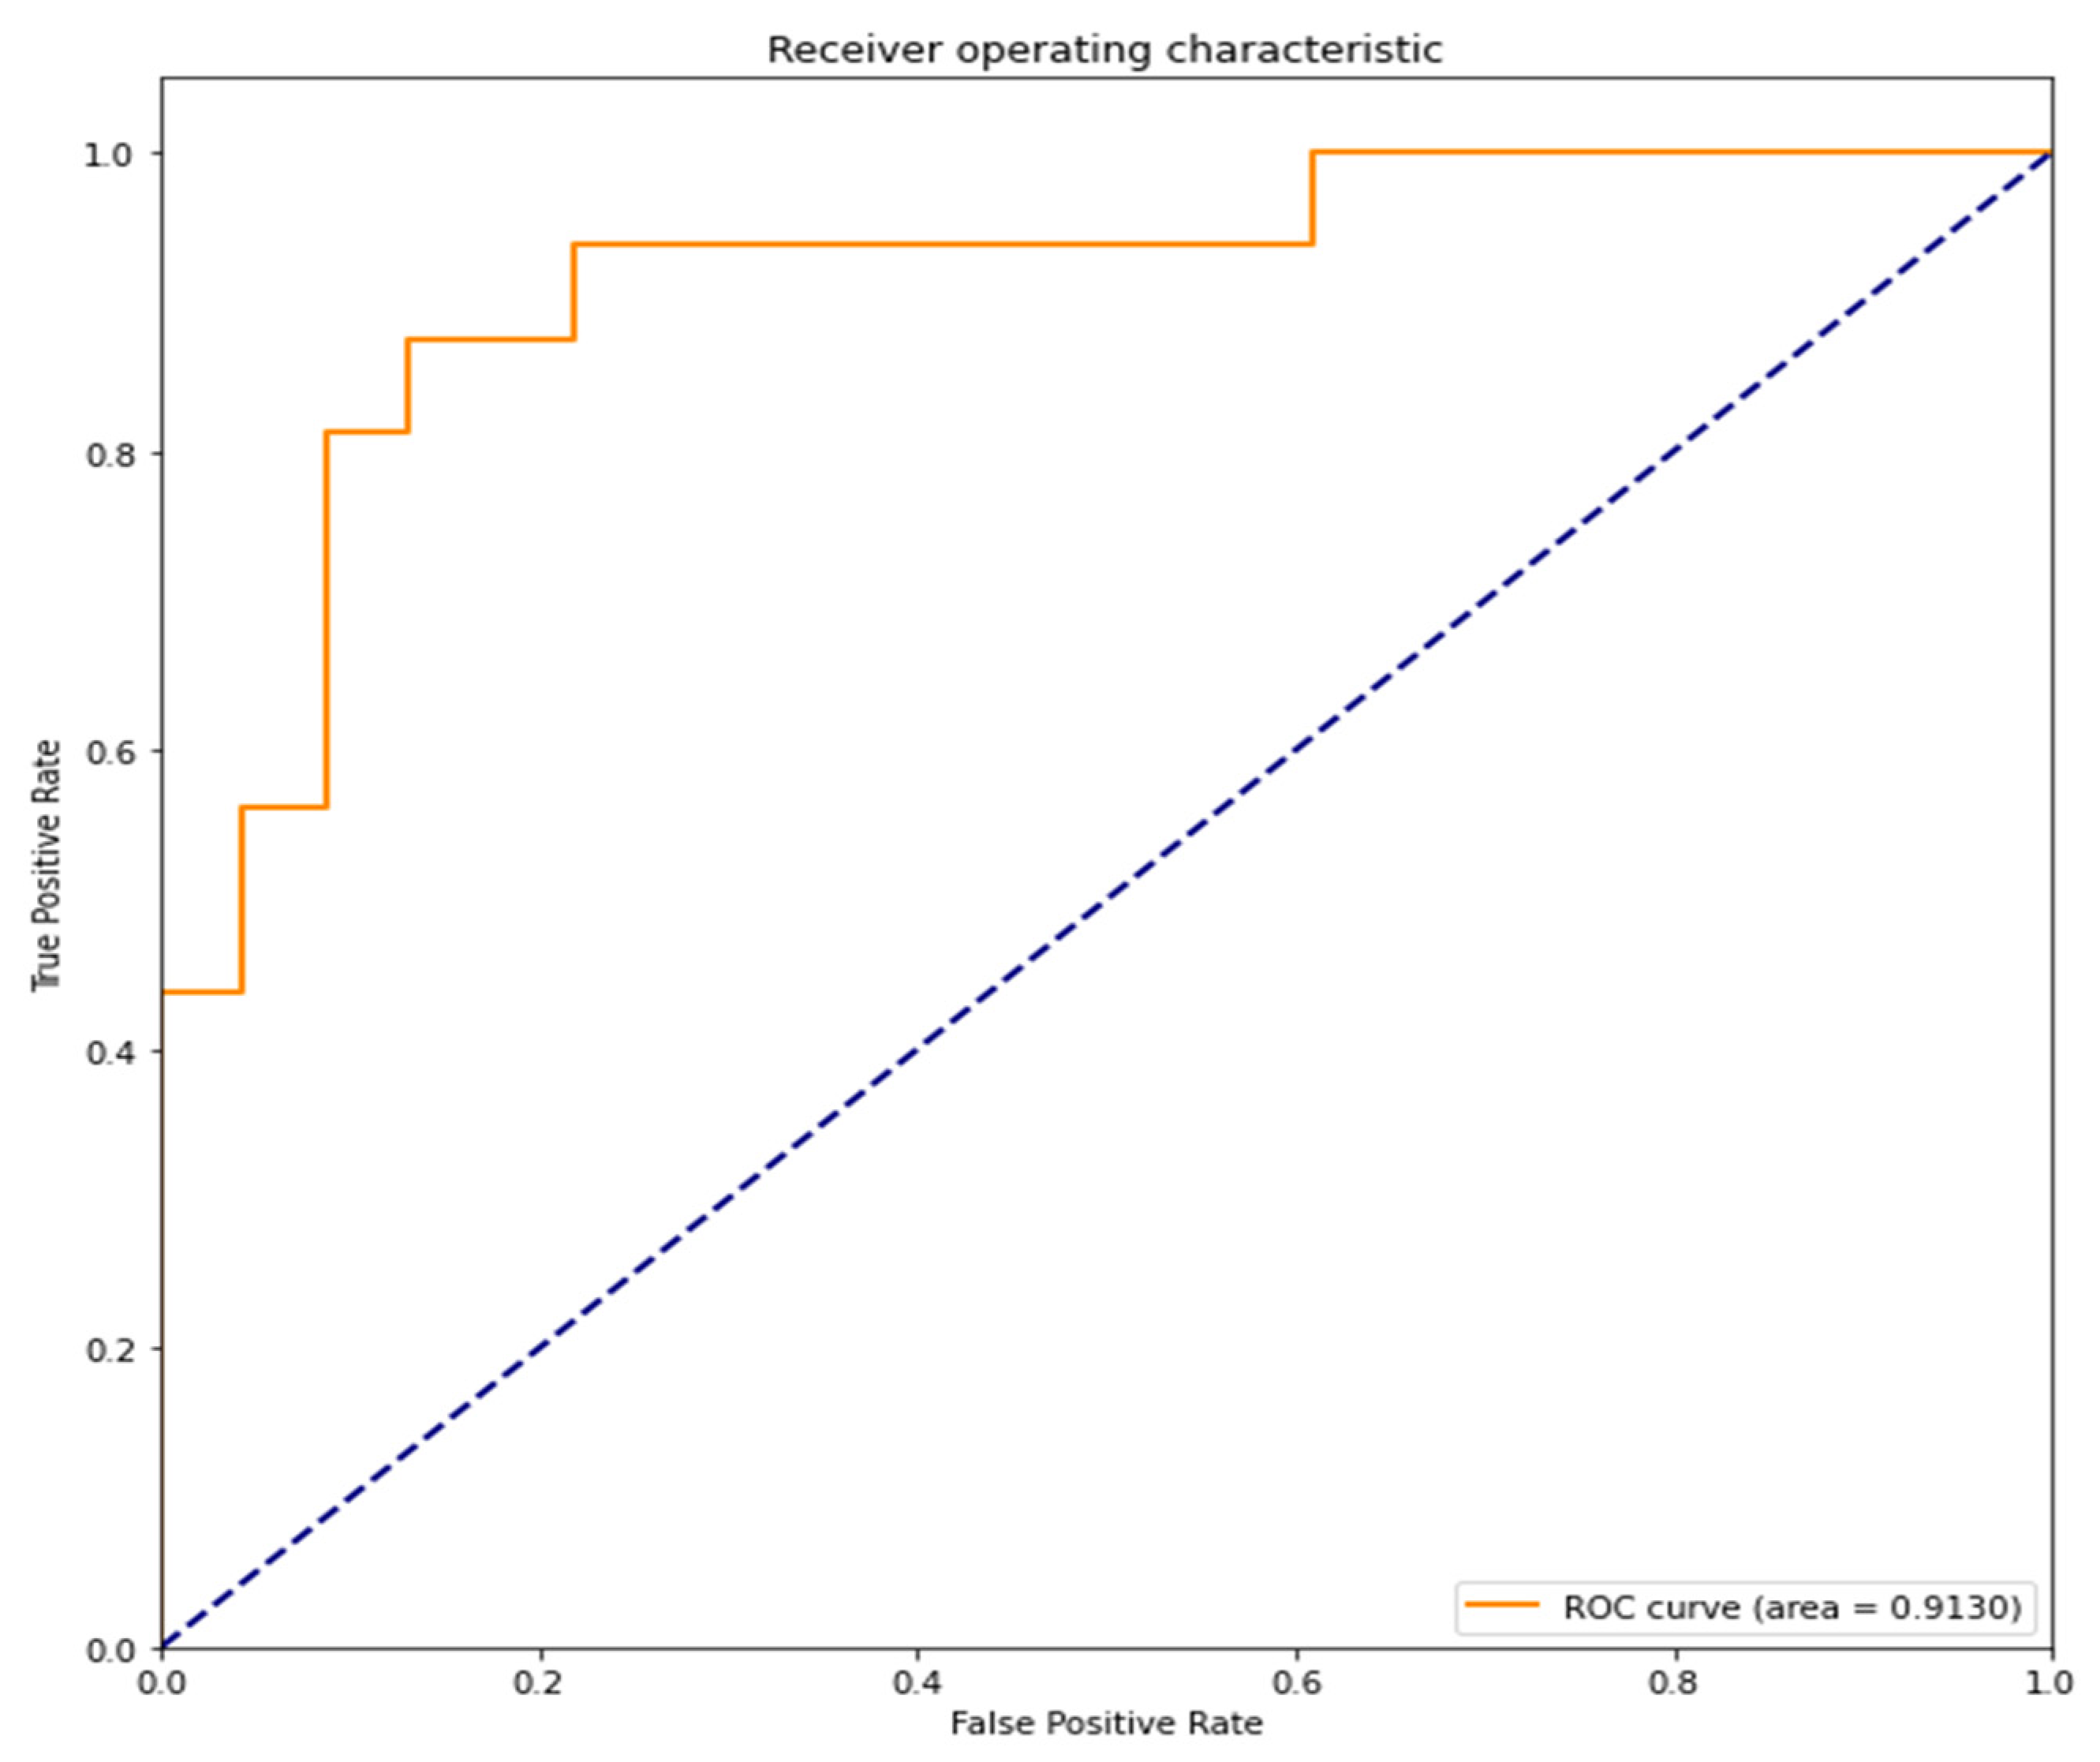
The confusion matrix of the RNN model is as follows: accuracy = 87.18%, precision = 86.67%, sensitivity (recall) = 81.25%, specificity = 91.30%, and F1-score = 83.87%. These values suggest good model performance.
The area under the curve (AUC) of the receiver operating characteristic curve (ROC curve) is 0.9130 (91.30%). A value close to 1 indicates high accuracy (
Figure 6).
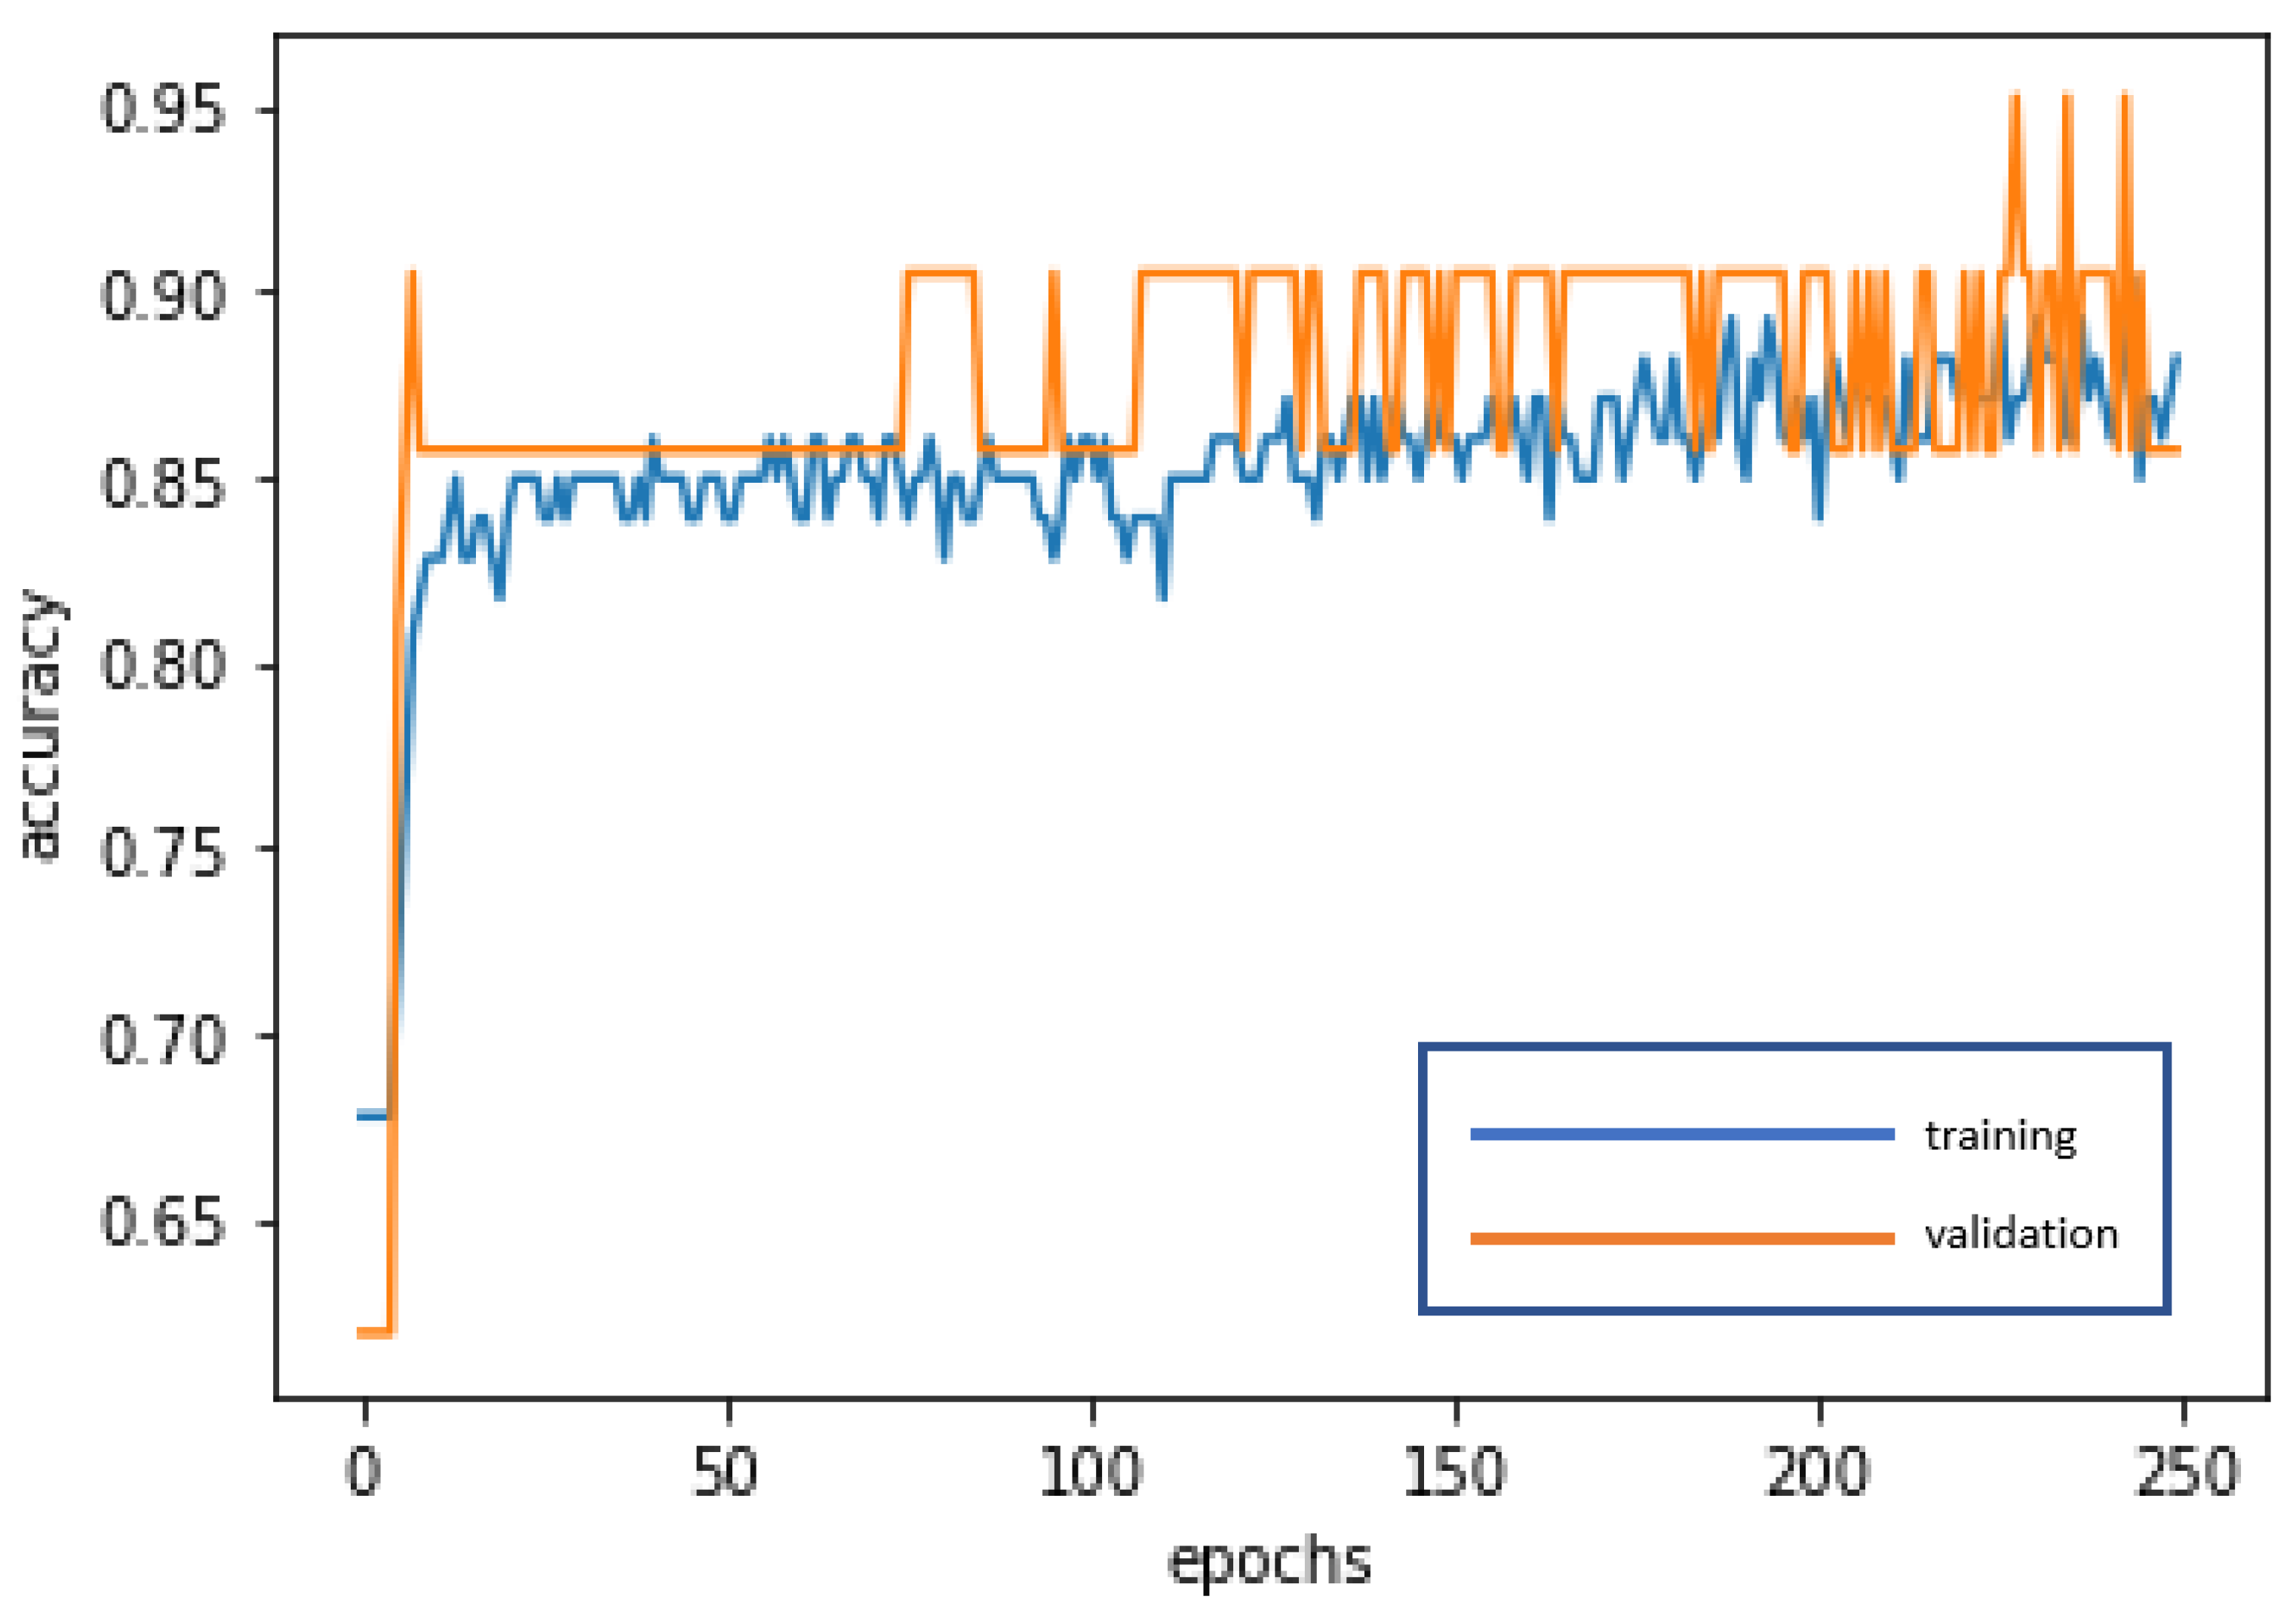
4.3. LSTM Modeling and the LSTM Model
The LSTM is used for deep learning and training to achieve stabilization and establish the optimal model. The loss curve becomes smoother, the gradient drops, and the accuracy increases along with training. The training of 250 epochs only takes 1.5 seconds. The training dataset and the validation dataset report accuracy of 88.17% and 85.71%, respectively. The test dataset used to test model stability has an accuracy of 94.88%. The model is highly stable and has goodness-of-fit (no obvious overfitting). The model accuracy rates are summarized in
Table 4.
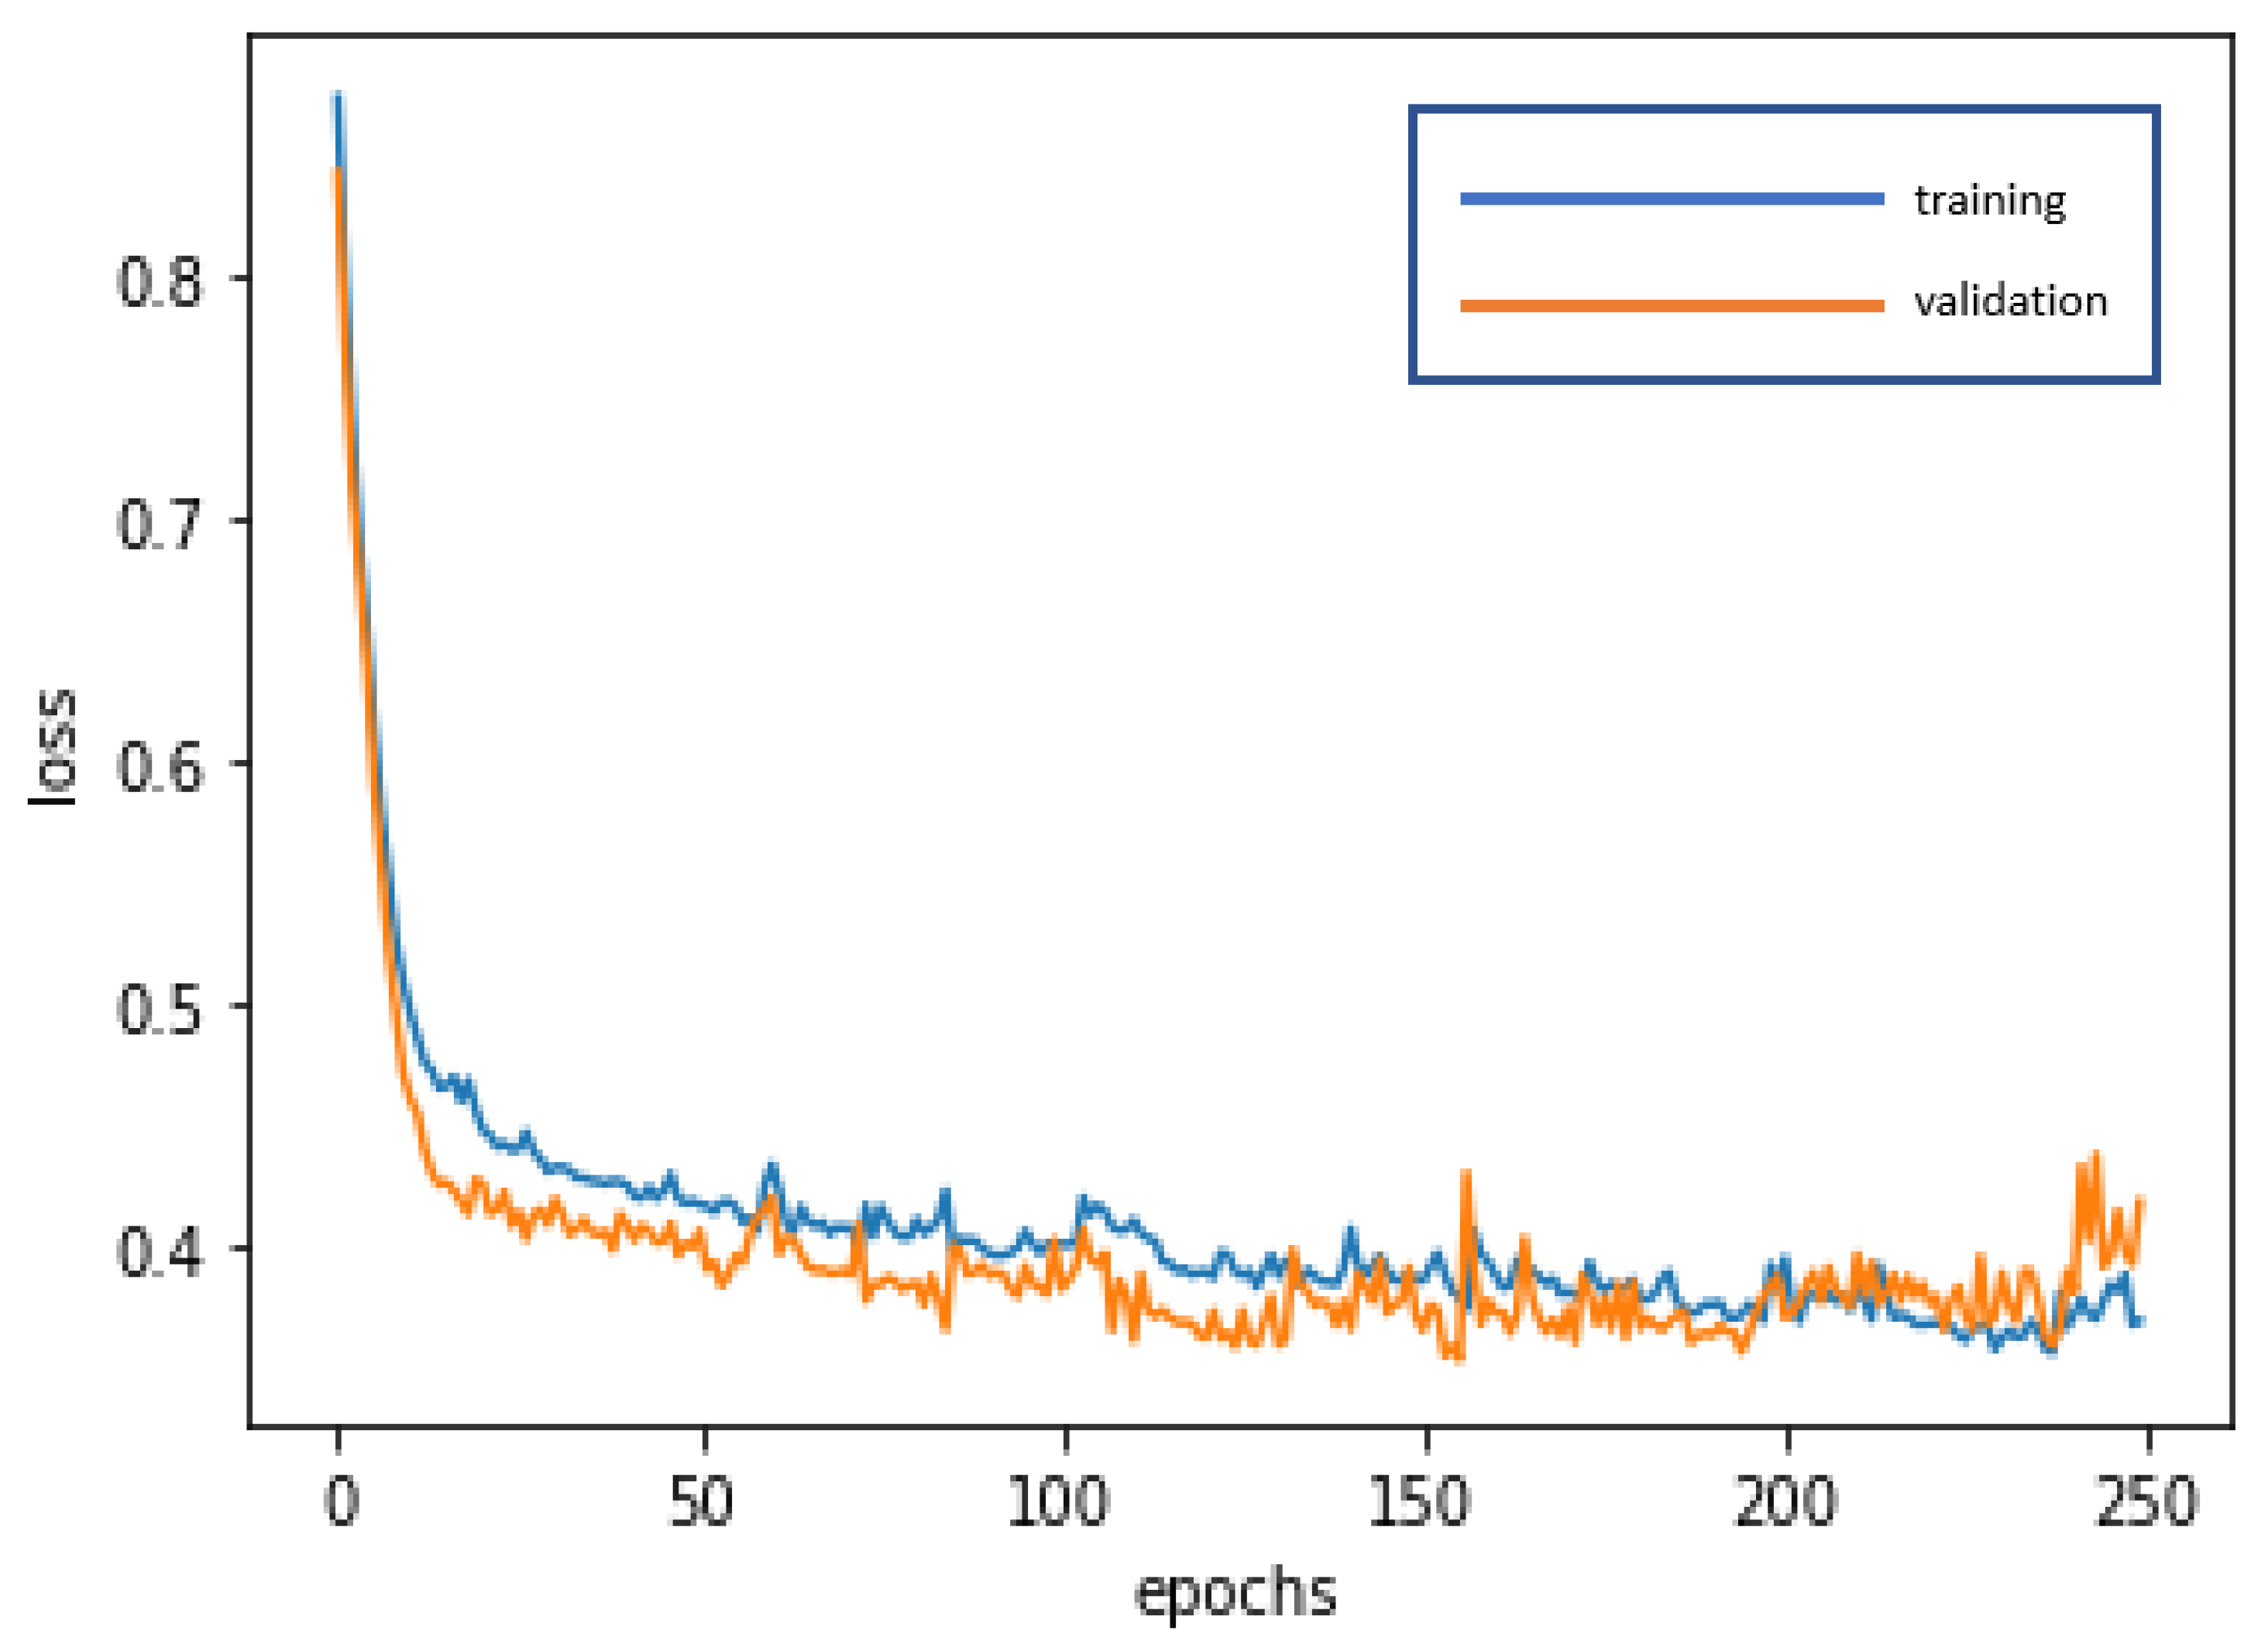
Figure 7 and
Figure 8 present the loss function graph and the accuracy graph of the modeling process. Type I error rate and Type II error rate of the test dataset are 2.56% and 2.56%, respectively. These levels are considered fairly low.
The confusion matrix of the LSTM model is as follows: accuracy = 94.88%, precision = 92.31%, sensitivity (recall) = 92.31%, specificity = 96.15%, and F1-score = 92.31%. These values suggest great model performance.
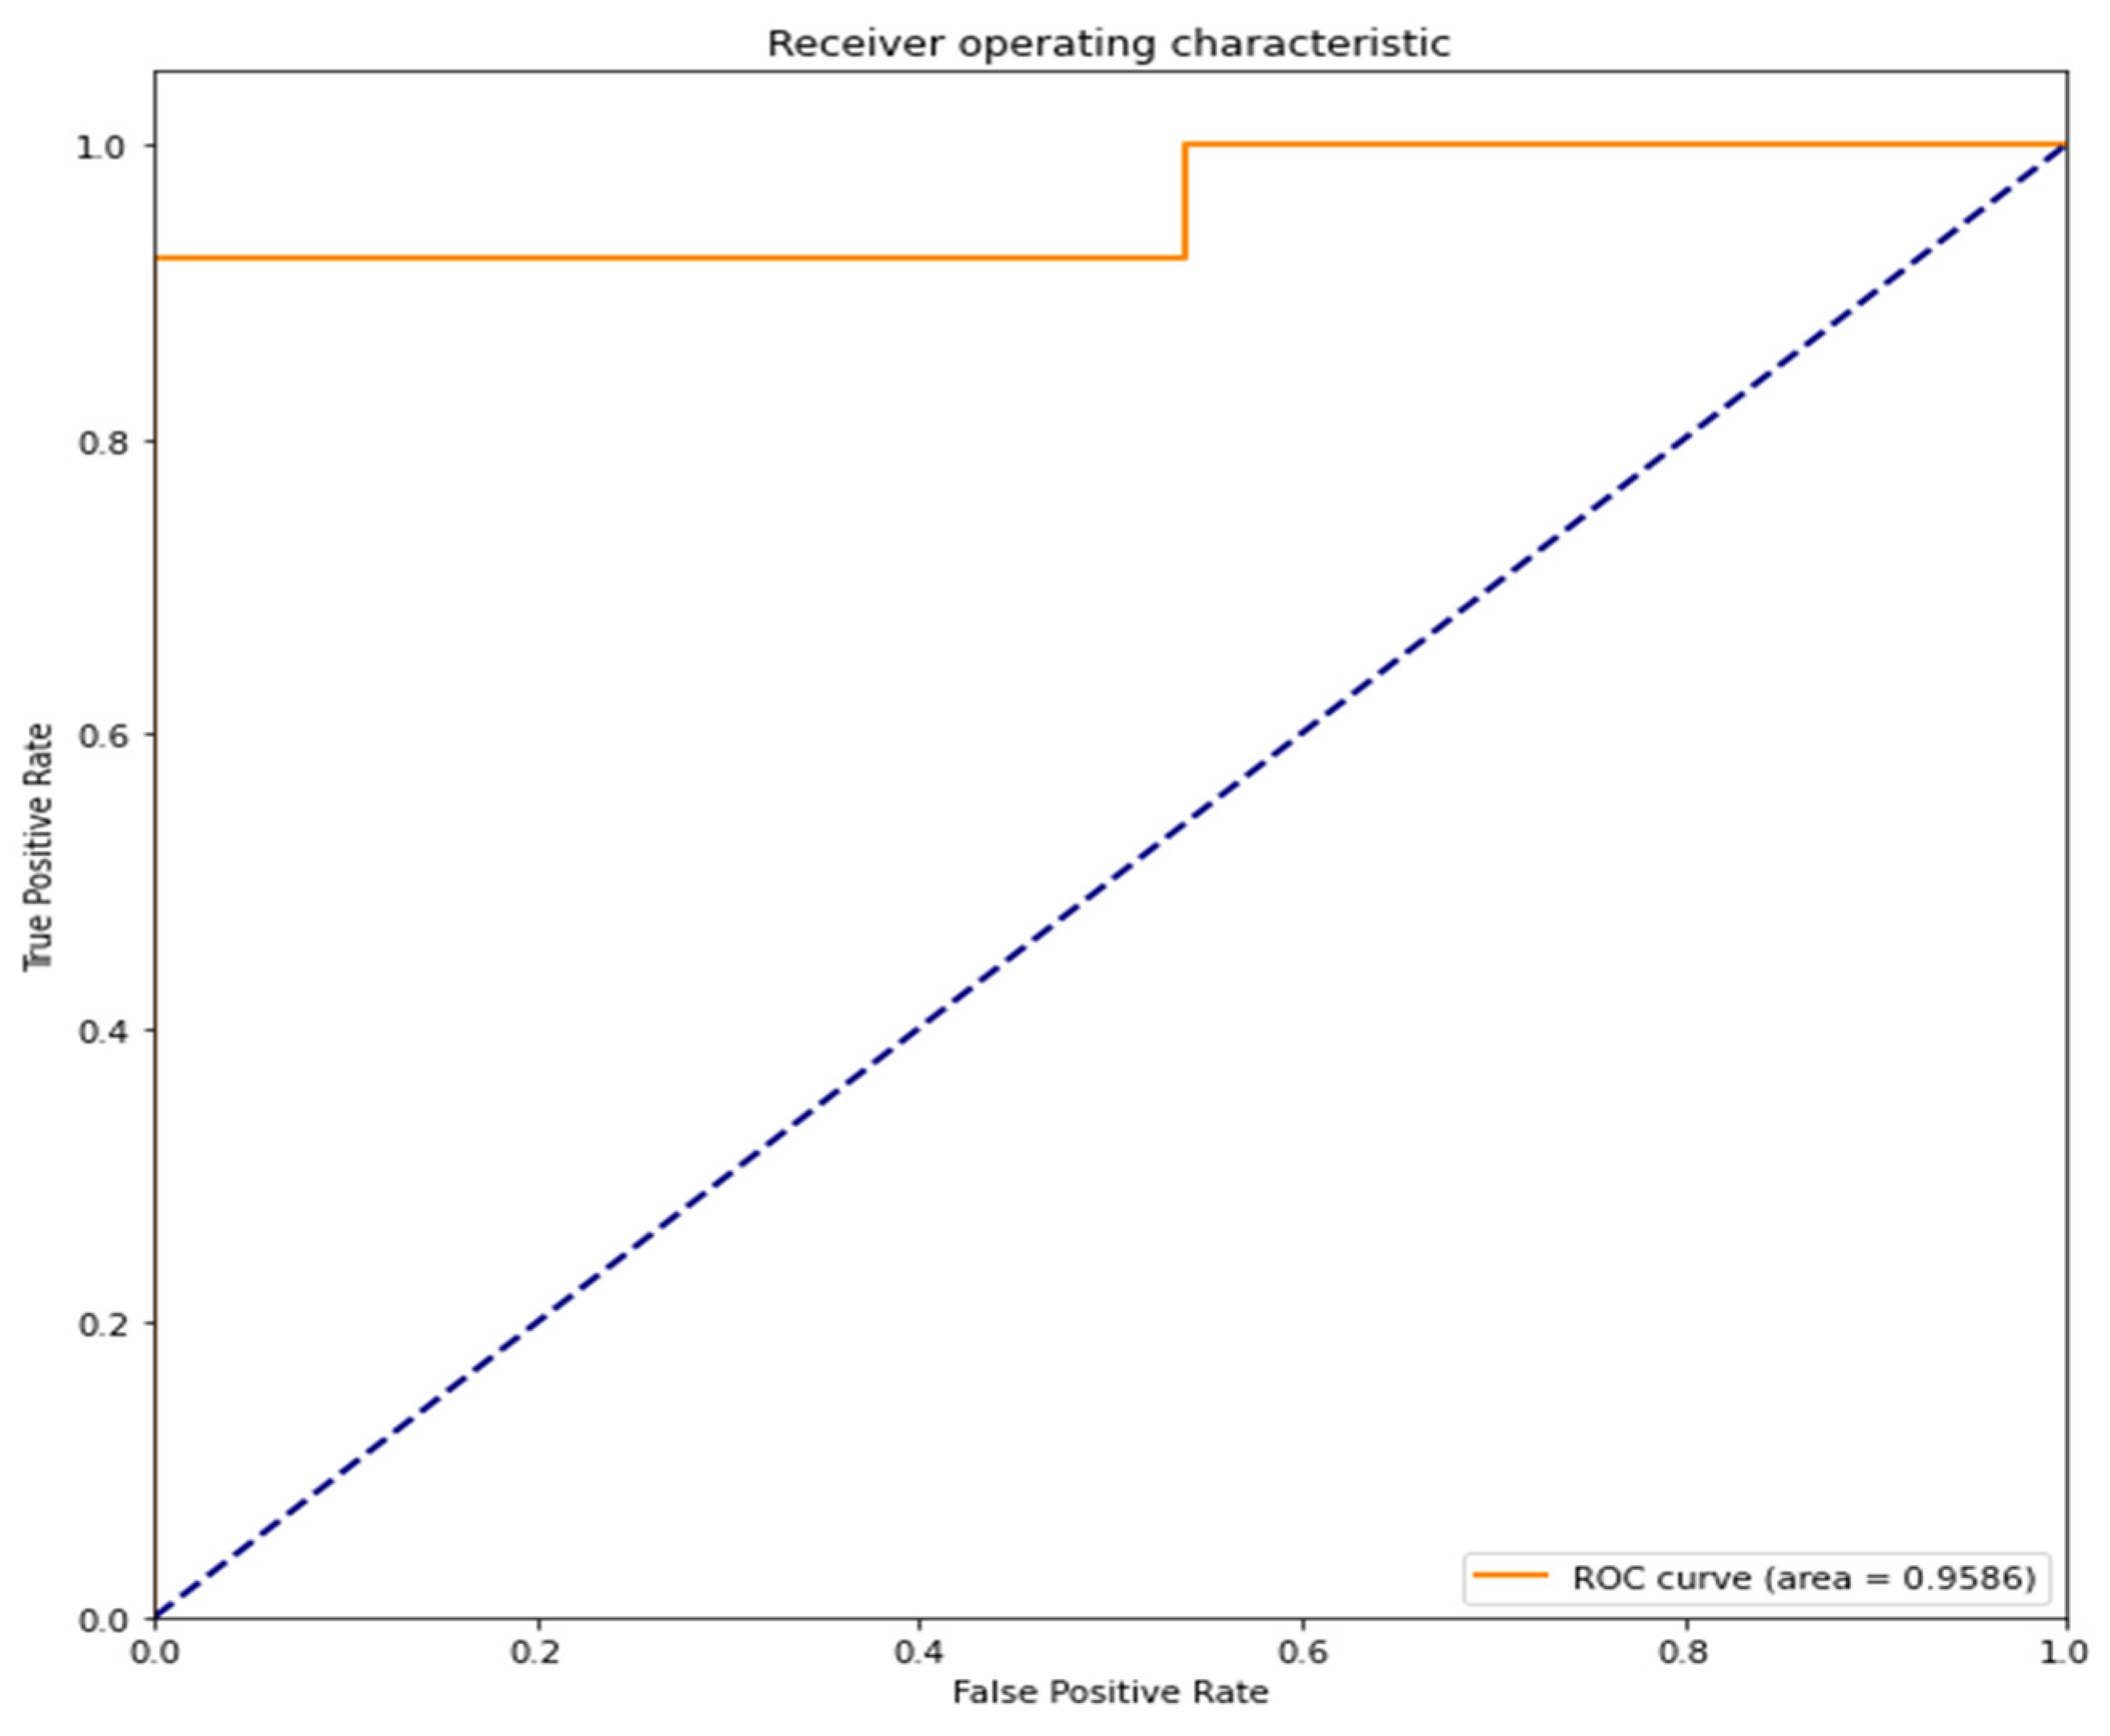
The area under the curve (AUC) of the receiver operating characteristic curve (ROC curve) is 0.9586 (95.86%). A value close to 1 indicates high accuracy (
Figure 9).
5. Discussion
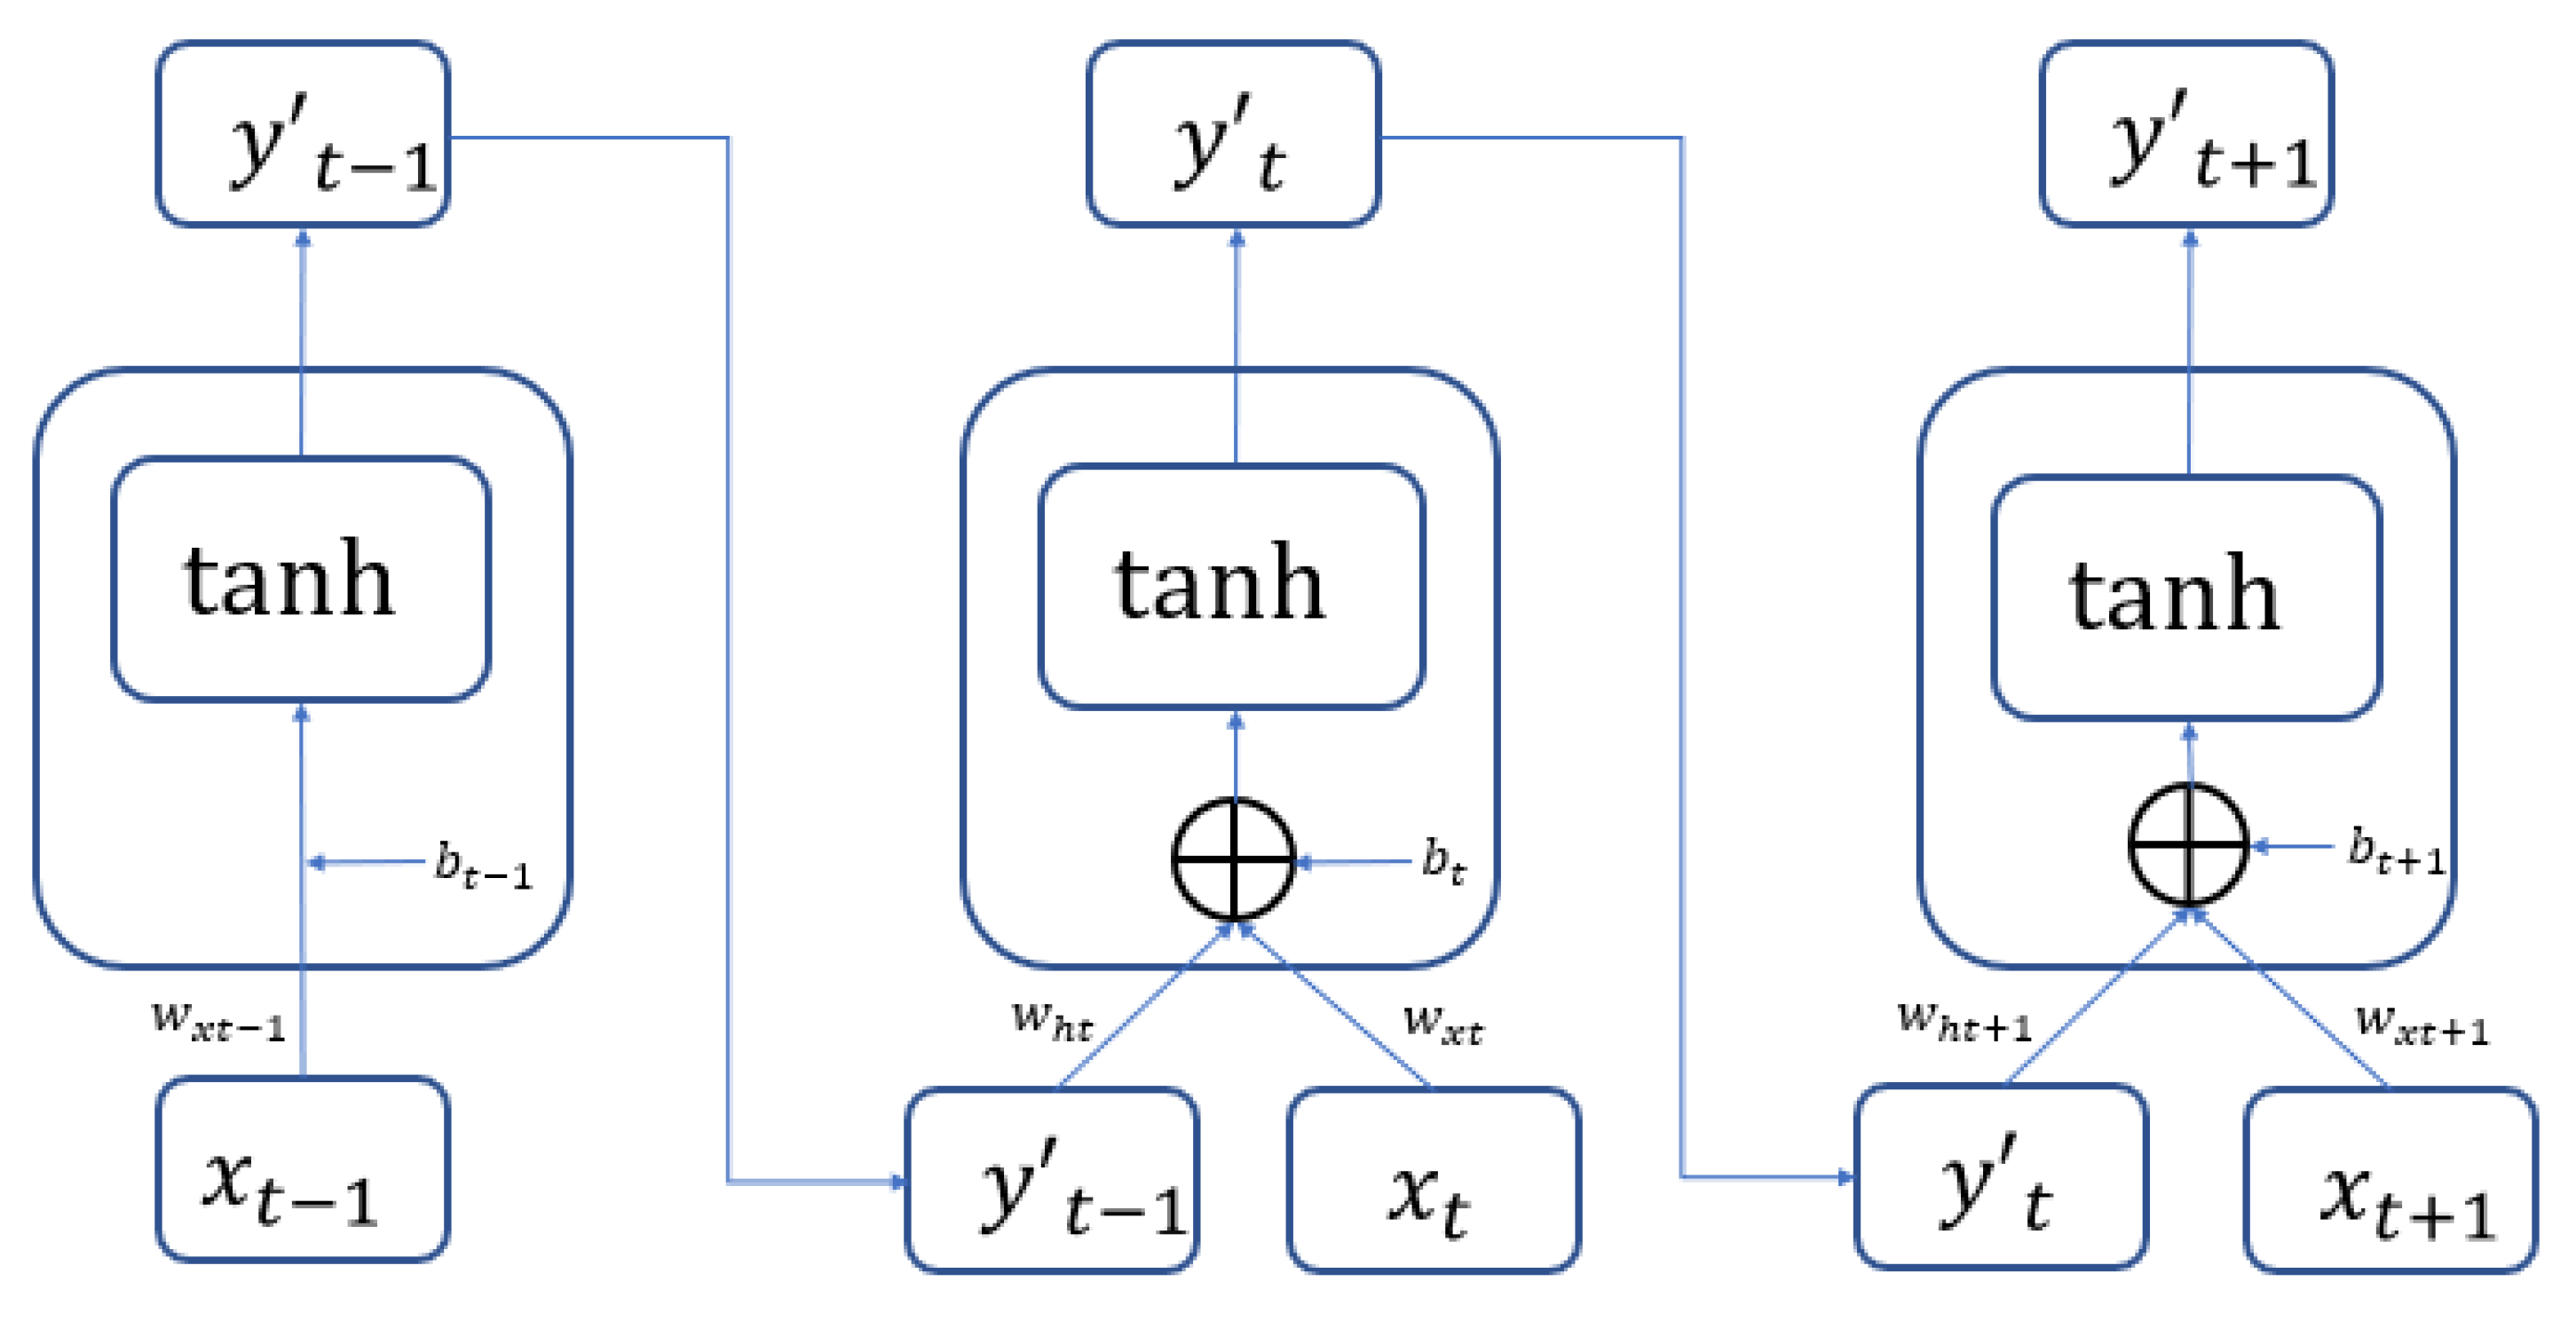
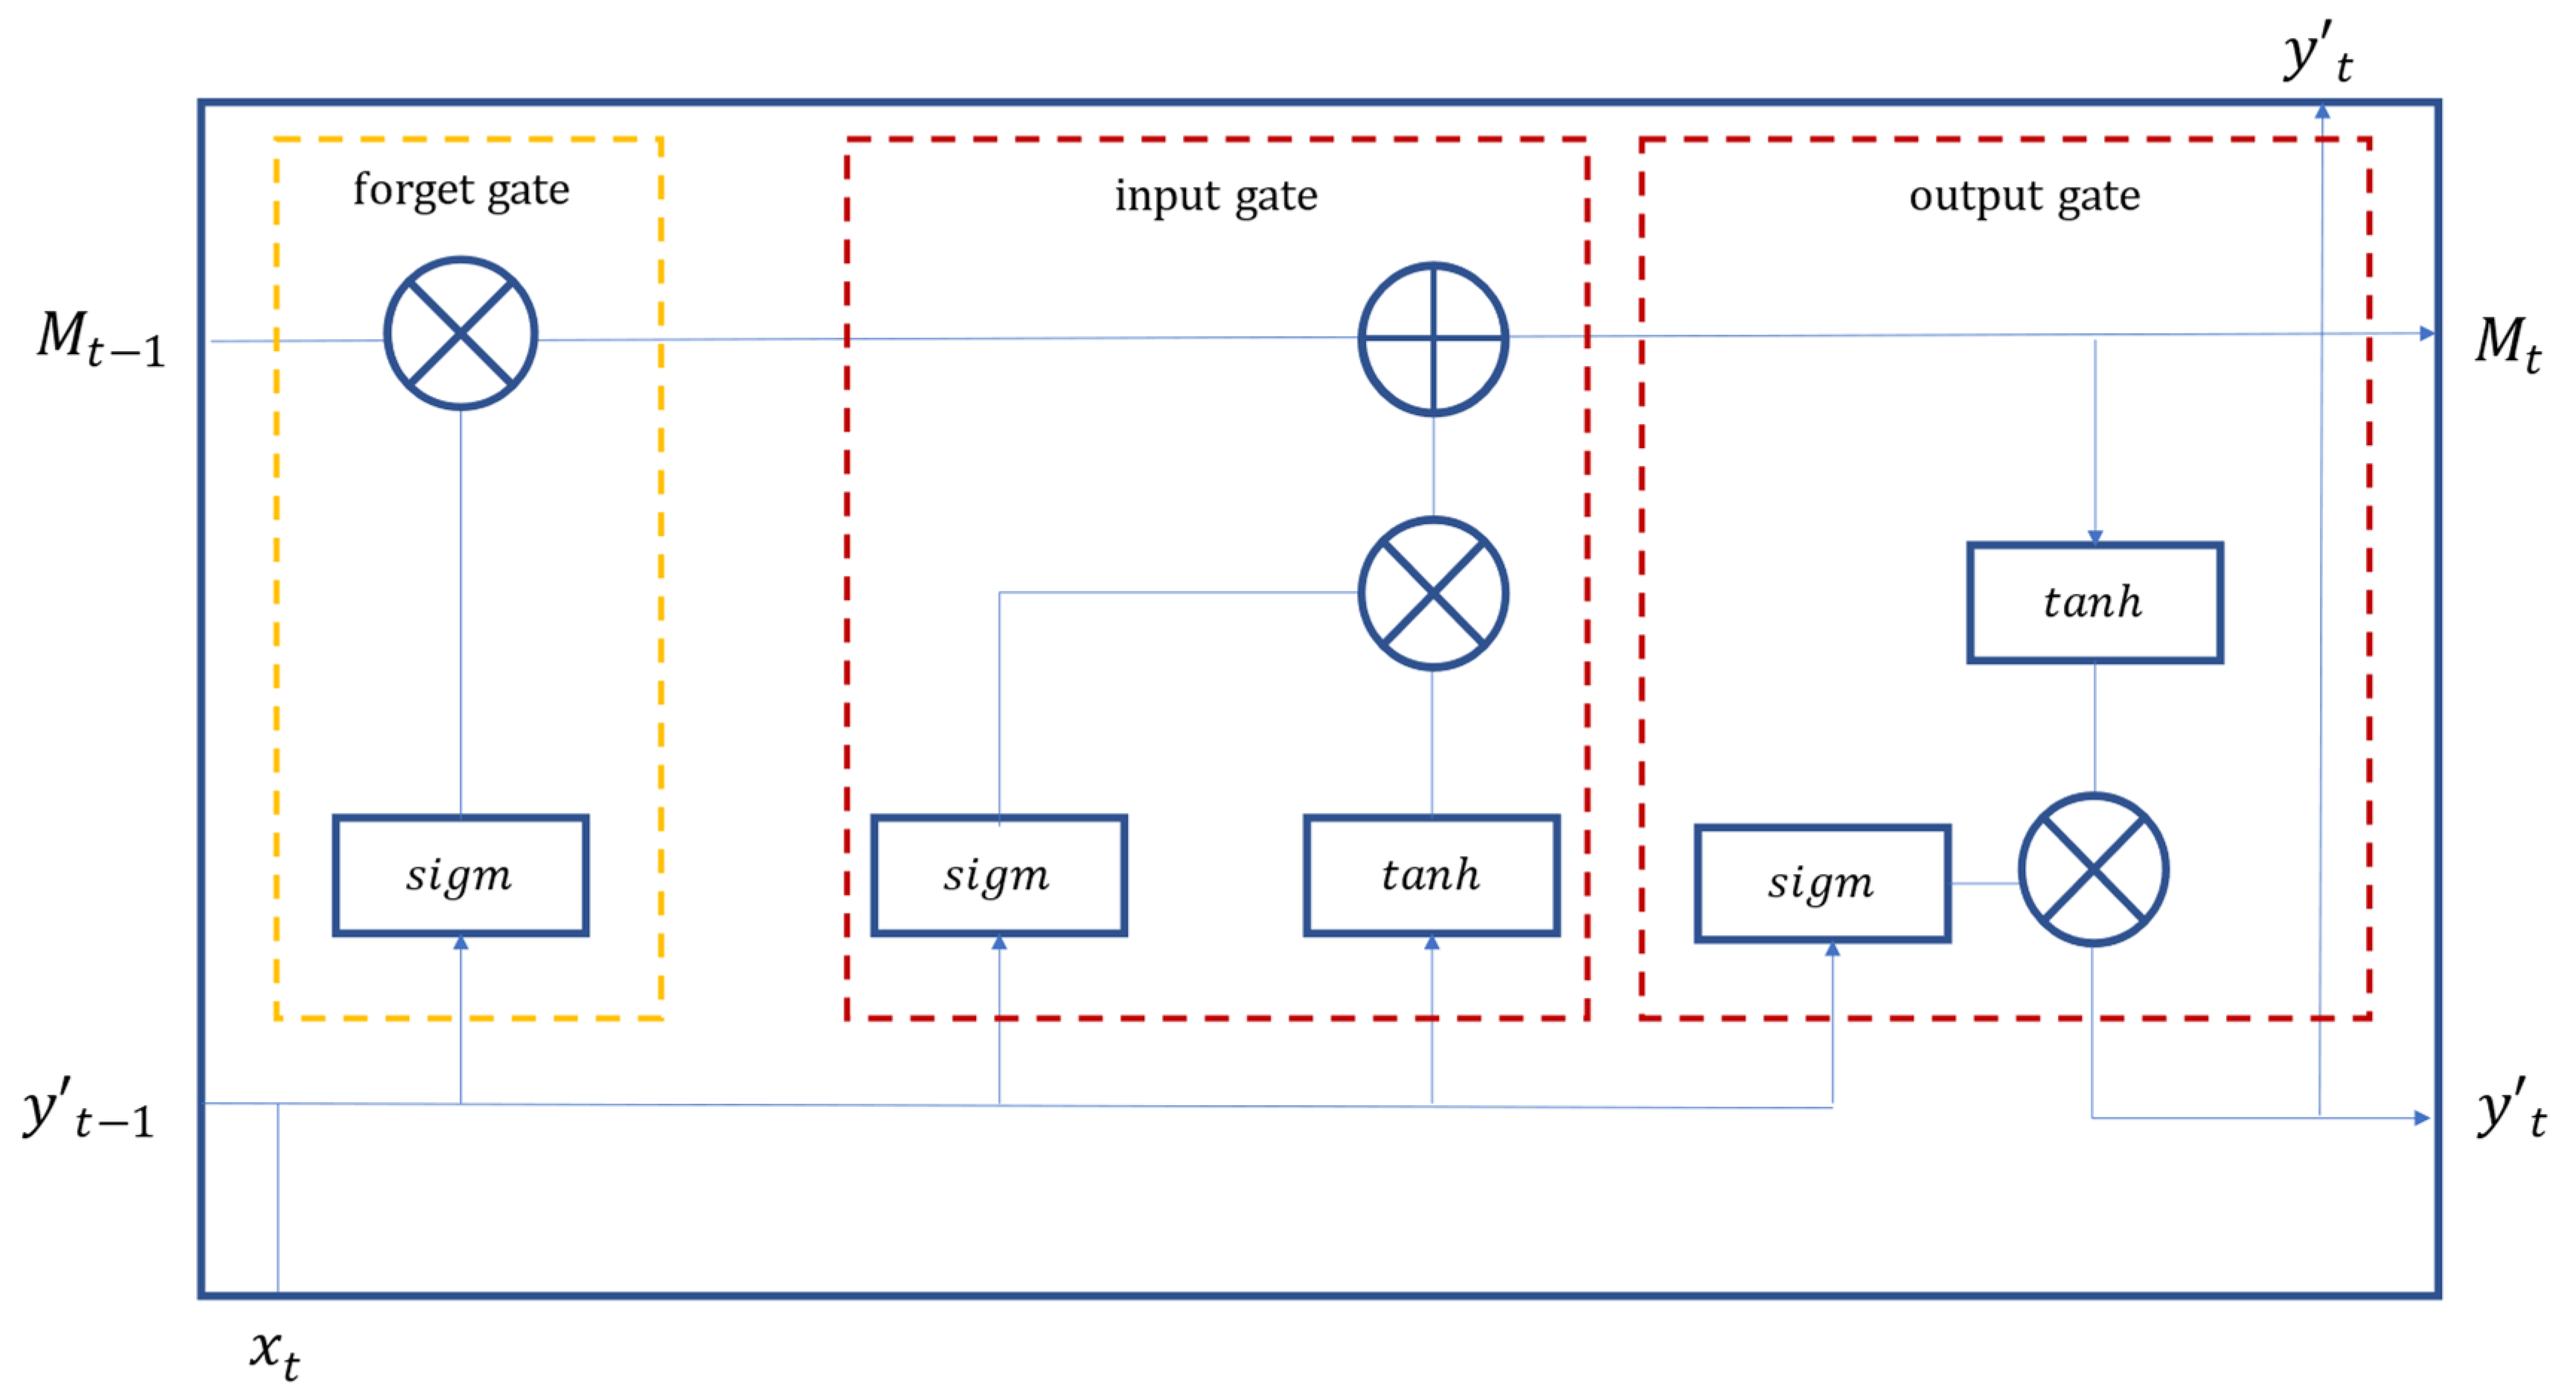
RNN and LSTM are two popular and representative deep learning algorithms. LSTM addresses the possible poor performance of long-term memory of RNN models. LSTM is innovative for the addition of three steps (i.e., forget, update, and input) in the neurons, so as to dramatically enhance long-term memory performance. Both RNN and LSTM can quickly and effectively process large data volumes and establish models. They both have good capabilities in learning, optimization, and prediction (detection). In addition, validation is important to modeling.
This study adopts a number of measures to ensure model validity as follows. (1) The raw data are normalized and standardized so that all the data values are between 0 and 1. (2) Random sampling is performed and data are not placed back to the pool, in order to avoid bias due to repeated data. (3) Adaptive Moment Estimation (Adam), the optimizer built-in TensorFlow, is used to adjust the optimal parameters. (4) Multiple performance metrics are referenced to evaluate the model performance.
This paper selects a total of 18 variables frequently used to measure financial statement fraud. They consist of 14 financial variables and 4 non-financial variables (also known as corporate governance variables). RNN and LSTM are used for deep learning and optimization to establish an optimal model. The modeling process starts with a random sampling of 60% of the data as the training dataset. The parameters in the dataset are fitted in the learning process, and the best prediction model is derived with constant optimization. The validation dataset is sampled randomly from 15% of the total data, for the validation of the status and convergence with stable accuracy. Hyper-parameters are adjusted to avoid overfitting. The remaining 25% of the data is used as the test dataset, to assess the generalization and detection capability of the model (i.e., the performance of the model).
The empirical results indicate that the test dataset in the LSTM model boasts a detection accuracy of 94.88%, or better than that of the RNN test dataset at 87.18%. Both models produce an accuracy rate higher than 85%. These are great results in social science [
10,
11]. As far as error rates are concerned, Type I error rate and Type II error rate of the LSTM model are both 2.56%, or lower than Type I error rate of 5.13% and Type II error rate of 7.69% for the RNN model. Type I error rate indicates the probability of predicting fraud for non-fraudulent companies. Type II error rate indicates the probability of predicting no fraud for fraudulent companies. Type II errors cause the heaviest losses for financial statement users.
To enhance the effectiveness of model performance and stability assessment, this paper incorporates the confusion matrix and the ROC curve/AUC indicators. The confusion matrix of the LSTM model is as follows: accuracy = 94.88%, precision = 92.31%, sensitivity (recall) = 92.31%, specificity = 96.15%, and F1-score = 92.31%. The values suggest great model performance. The confusion matrix of the RNN model is as follows: accuracy = 87.18%, precision = 86.67%, sensitivity (recall) = 81.25%, specificity = 91.30%, and F1-score = 83.87%. These numbers also indicate good model performance. However, the LSTM model outperforms the RNN model in detection according to confusion matrix values.
ROC curve/AUC is often used as a performance metric for binary classification models. An ROC curve consists of sensitivity and specificity. The closer the area underneath is to 1, the more accurate the model’s classifications are. The LSTM model reports an AUC (area under the curve) value of 0.9586 (95.86%). This is very close to 1, indicating high accuracy. It is also better than the RNN model’s AUC value of 0.9130 (91.30%). Both models perform well.
Table 5 summarizes the performance of the RNN model and the LSTM model in the detection of financial statement fraud. Both models achieve good results. The two models constructed by this study are suitable for the detection of financial statement fraud. That said, LSTM outperforms the RNN model.
6. Conclusions and Suggestions
Information asymmetry is commonplace in capital markets due to agency problems. This is particularly the case with financial statements in which companies present operating results, corporate health, and their ability for sustainable development. Except for a few shareholders involved in company operations, it is difficult for other stakeholders to understand the true picture of the company’s financials until the company sinks into financial distress or declares bankruptcy. This undermines the public’s confidence in the financial system and the capital market. It also damages the health, development, and sustainability of the global capital market. All governments in the world have formulated more stringent regulations to prevent fraud, advocated corporate governance, and required company boards to establish an effective internal control and fraud prevention mechanism. CPAs and auditors are also strictly required to adhere to occupational ethics, relevant accounting and auditing standards, and financial regulations, in order to act as gatekeepers by using audit reports and audit opinions to reduce the likelihood of financial statement fraud. However, financial statement fraud still occurs from time to time. It is imperative to find an effective model to detect financial statement fraud so that CPAs and auditors can use this tool as assistance.
To tackle the shortcomings of the traditional approach to financial statement fraud detection and to embrace the era of big data and artificial intelligence, the use of deep learning algorithms to detect financial statement fraud is the proper way to go, but there is limited relevant literature. Hence, this study uses a recurrent neural network (RNN) and long short-term memory (LSTM), which are two powerful and advantageous deep learning algorithms. Both financial and non-financial data of 153 TWSE/TPEx listed companies in 2001–2019 are utilized for deep learning and training, until the model is stabilized as the optimal model.
To ensure model validation and the effectiveness of the model’s generalization and prediction capabilities, this study refers to multiple performance indicators, including the confusion matrix (accuracy, precision, sensitivity (recall), specificity, and F1-score), Type I error rate and Type II Error rate, and ROC curve/AUC values to compare the performance of the two models. The results show that the LSTM model outperforms slightly at 94.88% accuracy (the most frequently used performance metric). The two models constructed by this study perform well and are suitable for the detection of financial statement fraud. This research thus contributes to academic research and capital market practices in relation to fraud prevention.
This study urges CPAs, management teams, and financial regulatory bodies to ensure the fulfillment of auditing responsibilities and support to companies in their robust corporate governance and internal control. CPAs should issue audit reports such as “qualified opinion”, “disclaimer opinion”, and “adverse opinion” upon financial information and physical asset inventory to which they have doubt. Management should act with morality and integrity and serve as good role models to be accountable to all stakeholders, without forging or cheating with financial data and financial reporting. Financial regulatory bodies should ensure that laws and regulations are robust and up to date. Strict control should be exercised on companies and CPAs by keeping a close eye on any illegal or inappropriate behavior, in order to protect the rights of the investing public and the sustainability of the capital markets.
This study makes the following recommendations for future research: To begin, deep learning algorithms are a concrete representation of academic research methods in the age of artificial intelligence; researchers may also use other deep learning algorithms, such as DNN, DBN, CNN, CDBN, and GRU, to construct financial statement fraud detection models. Second, as research variables, incorporate indicators of economic growth or recession (such as GDP) or other macroeconomic variables [
45]. Third, consider using additional econometric models, such as QARDL-ECM, to address specific economic and financial asymmetry issues, such as long- and short-term asymmetry, as well as asymmetry between different financial markets [
46]. Fourth, in addition to the commonly used financial variables, it is necessary to consider non-financial variables when evaluating financial statement fraud. Finally, financial and non-financial variables should be adjusted to reflect different economic conditions, capital markets, financial regulations, and corporate types.


