1. Introduction
In the Architecture, Engineering, and Construction (AEC) industry, the increasing complexity of construction projects demands the work of complex organizations and multidisciplinary professional groups for their execution [
1,
2]. During project development, the civil engineer coordinates and collaborates with diverse stakeholders, for example, architects, builders, engineers, suppliers, workers, and the community [
3]. Such activities require technical knowledge, and personal or behavioral skills as leadership, social skills, professional ethics, and effective communication [
4,
5,
6]. These skills complement each other and make it easier for the professional to work effectively in multidisciplinary groups during the development of construction projects [
7,
8,
9]. With the rapid growth of sustainable development, there has been a growing demand for social sustainability to be included into the AEC industry [
10,
11]. Social sustainability covers social considerations of the final user and health and safety issues of the project team [
12,
13]; therefore, social sustainability is associated to the management practices that includes employee skills training (BIM education program, information communication technologies, teamwork, among others) [
10].
The demand of the AEC industry for professionals with technical skills and soft skills has moved universities to incorporate methodologies that promote the learning and development of those skills in their civil engineering training processes [
5,
14]. Consequently, the universities have gone from professor exposition as main teaching method to the use of collaborative methodologies which promote these types of social skills among the students by the use of group work (GW) or team-based learning methodologies [
15].
GW is a learning method based on students working together in groups relying on and supporting one another through cooperation and collaboration to achieve a set goal. This is formally termed cooperative learning or collaborative learning [
16,
17]. Those groups in civil engineering depend on the instructor’s selection of the students in the classroom and their attendance to the operational needs of the tasks and activities of the course [
14]. They are also traditional classroom learning groups created to carry out a specific assignments [
18]. The selection of the students to form GW is a central issue since several studies indicate that when group members’ are too close to each other it distracts students from the main task, causes lower acquisition of social skills, and leads to the academic homogeneity of members, which further endangers the learning performance [
14,
19,
20,
21].
The most frequent methods for selecting students for GW are random association, by the affinity of the students, or selected by the instructor [
19]. When selected by the instructor, team members can be chosen by the relevant skills needed for the tasks assigned to the group, looking for an optimal distribution of those skills across the teams [
22,
23] or the use of a criterion of rotation of the members of the groups to achieve diversity in each task. This diversity is understood as a reduced presence of close friends or acquaintances in the same group.
In any type of selection, the instructor is responsible for establishing the initial rules for the formation of the groups and, to reduce GW failures, should structure and control them in an intentional manner to obtain the planned outputs [
22]. However, at the beginning of a course, the instructor can hardly identify students’ particular skills or the closeness pre-existing between them. Such conditions are diverse depending on the semester of the course and whether students are at the beginning or end of their undergraduate program [
14]. In addition, the evolution of personal relations within the group, influenced by mutual trust, searching for advice to solve problems, and social affinities, defines the closeness of people [
24].
Even the most alert instructors lack information about the ways in which their students relate to each other in the courses, and thus so relies on their observation skills without having the tools that allow them to confirm their assumptions. Thus, the pre-existing social relations between the students and their individual social skills may be not considered for the formation of the groups. Therefore, it would be hard to apply adjustments or to know the impact of the selection of the member of the GW on the performance of the students.
Social Network Analysis (SNA) provides a tool for knowing the social relationships that occur within classrooms [
25]. From the study proposed by Krackhardt and Hanson [
24], it has been applied in various companies and organizations, including in the analysis of the relationships between students of higher education centers. SNA allows instructors, through network metrics, to identify the members of the groups that have outstanding communication, knowledge, and relational characteristics. There are not many studies that use SNAs to assess interactions in student contexts. A recent paper presented a four-year longitudinal study, where the authors evaluated the friendship and learning networks of civil engineering students using SNA [
26]; however, it does not explore the relationship between interaction networks and students’ academic performance, neither does it include suggestions for academics’ management of work teams. Another study evaluated the relationship between student academic performance and team interactions using SNA [
27]; nevertheless, this was a single capstone course effort where BIM methodology was taught, so it is unknown what happens in courses in previous years and in subjects where management and collaboration methodologies are not necessarily taught. There is also insufficient background information to provide instructor with tools on strategies to form work groups.
It is important for instructors to know the social dynamics, as well as students’ preexistent conditions that affect GW and its outcomes [
22]. This leads us to ask the following research questions: (1) What are the characteristics of the social networks of general communication, trust, and consultation within civil engineering classrooms? (2) Are these characteristics related to the performance of the students in the course and in the GW? (3) Is there a social diversity among the members of the GW? The main objective of this research was to characterize social networks inside the classrooms of civil engineering, aiming to unveil student’s closeness relations and identify individuals with high levels of trust, knowledge, or skills highlighted by their classmates. It was also sought to establish if there is any relationship between a student’s closeness with the performance of the GW measured by their grades.
The information provided by the network diagrams generated by SNA may enable instructors to leverage these relations with the aim to improve the formation of workgroups, considering not only pedagogy but students’ social interactions [
28], making the method of selecting the members of the work groups more efficient and providing a control tool that the traditional forms of selection do not have. The paper is formed by five sections. The first is the present section, the second is the theoretical framework, the third describes the methodology used for SNA and correlation analysis, the fourth contains the results and discussion, and finally, the fifth section contains the conclusions.
3. Materials and Methods
To achieve the objective of this study, all the courses of the civil engineering undergraduate program of a university in Ecuador were invited to participate. The first step was to explain to the students and teachers that the objective of the research was to improve GW implementation in Civil Engineering classrooms. In addition, they were informed that the participation would be voluntary under conditions of confidentiality of the information and anonymity. In total, 4 of 10 courses (40% participation) freely agreed to participate in the study, without any condition on the composition of the group of students, only verifying that GW had been developed within them [
43]. Of the total number of students in the 4 courses, 93 of 102 answered the survey, that is, a 91% participation rate was obtained.
Four courses accepted the conditions and participated in the research: the National Reality Chair in second semester, Topography II in fourth semester, Project Management in ninth semester, and Graduation projects in tenth semester. The civil engineering undergraduate program has a duration of ten semesters. There are many courses where collaborative GW is carried out. The semesters, the chairs, and the description of the GW developed in them are described in
Table 1.
To obtain information of the social networks that are formed in the courses, online surveys were applied through the virtual classrooms that teachers use to support a b-learning mode of teaching. These were applied four weeks after the courses started to allow all students to have the opportunity to interact in the classroom. The survey asked three questions that allowed the definition of three interaction networks.
Table 2 shows the type of network and its respective question. Each student became a coded node, and a link was assumed as the student’s statement regarding the interaction with another student. The direction of the interaction was abstracted and a weight equal to 1 was assigned in all cases. Under such a decision, social networks are considered undirected. In other words, it does not matter from whom the interaction was declared in the survey originated.
The survey and method used in this study is an adaptation of that was developed by Krackhardt and Hanson [
24] and have been tested in previous studies [
44]. In addition, social relations inside a social network are better defined by the participants [
41], even though there is always the risk of respondent bias when answering the questionnaire. Aiming to avoid this bias, the research team procured those participants who answered freely and voluntarily, so students would not have an incentive to be dishonest about their social connections and would provide reliable data.
The collected information was processed on an electronic sheet (MS Excel) and then imported into social network analysis software (Gephi 0.9.2). With this information, interaction diagrams (sociograms) were developed, and network and individual indices (metrics) were calculated. For each course, social networks of general interaction, trust, and problem-solving were developed based on the study by Krackhardt and Hanson [
24].
Social network analysis (SNA) is a methodology whose application in the study of human relations has been widely disseminated in various areas [
41,
45]. The SNA is based on a set of indicators that measure the interactions between the members of a group of people, which are represented in graphs by means of links and nodes [
46]. Social network indicators, also called metrics, characterize individuals in a group by their number of connections or relationships with other group members. In addition, social networks are characterized by the connectivity of all group members. These characteristics of the network, its nodes, and their relationships are the necessary input for the SNA [
45].
The same group of individuals can generate different social networks depending on the type of relationship that exists between them, motivated by labor, family, corporate, and cooperation interests, among others. In each of them, there are differences in the level of communication and social influence of its members [
33] depending on the number of strong links between close friends and weak links between acquaintances [
47]. The relationships between people have different motives, and the networks that can be modeled and analyzed vary according to the reasons that motivate their study.
Various SNA metrics are particularly useful when analyzing friendship or work relationships within social networks. Among them are, at the level of individuals, the degree, the modularity, and the clustering coefficient; at the network level (global metrics), the average degree, diameter, density, number of components, and the average clustering coefficient measure the degree of cohesion [
31]. The global metrics were discussed in this study, as the researchers seek to explain the interactions of the whole group. The referred global metrics are descripted in
Table 3.
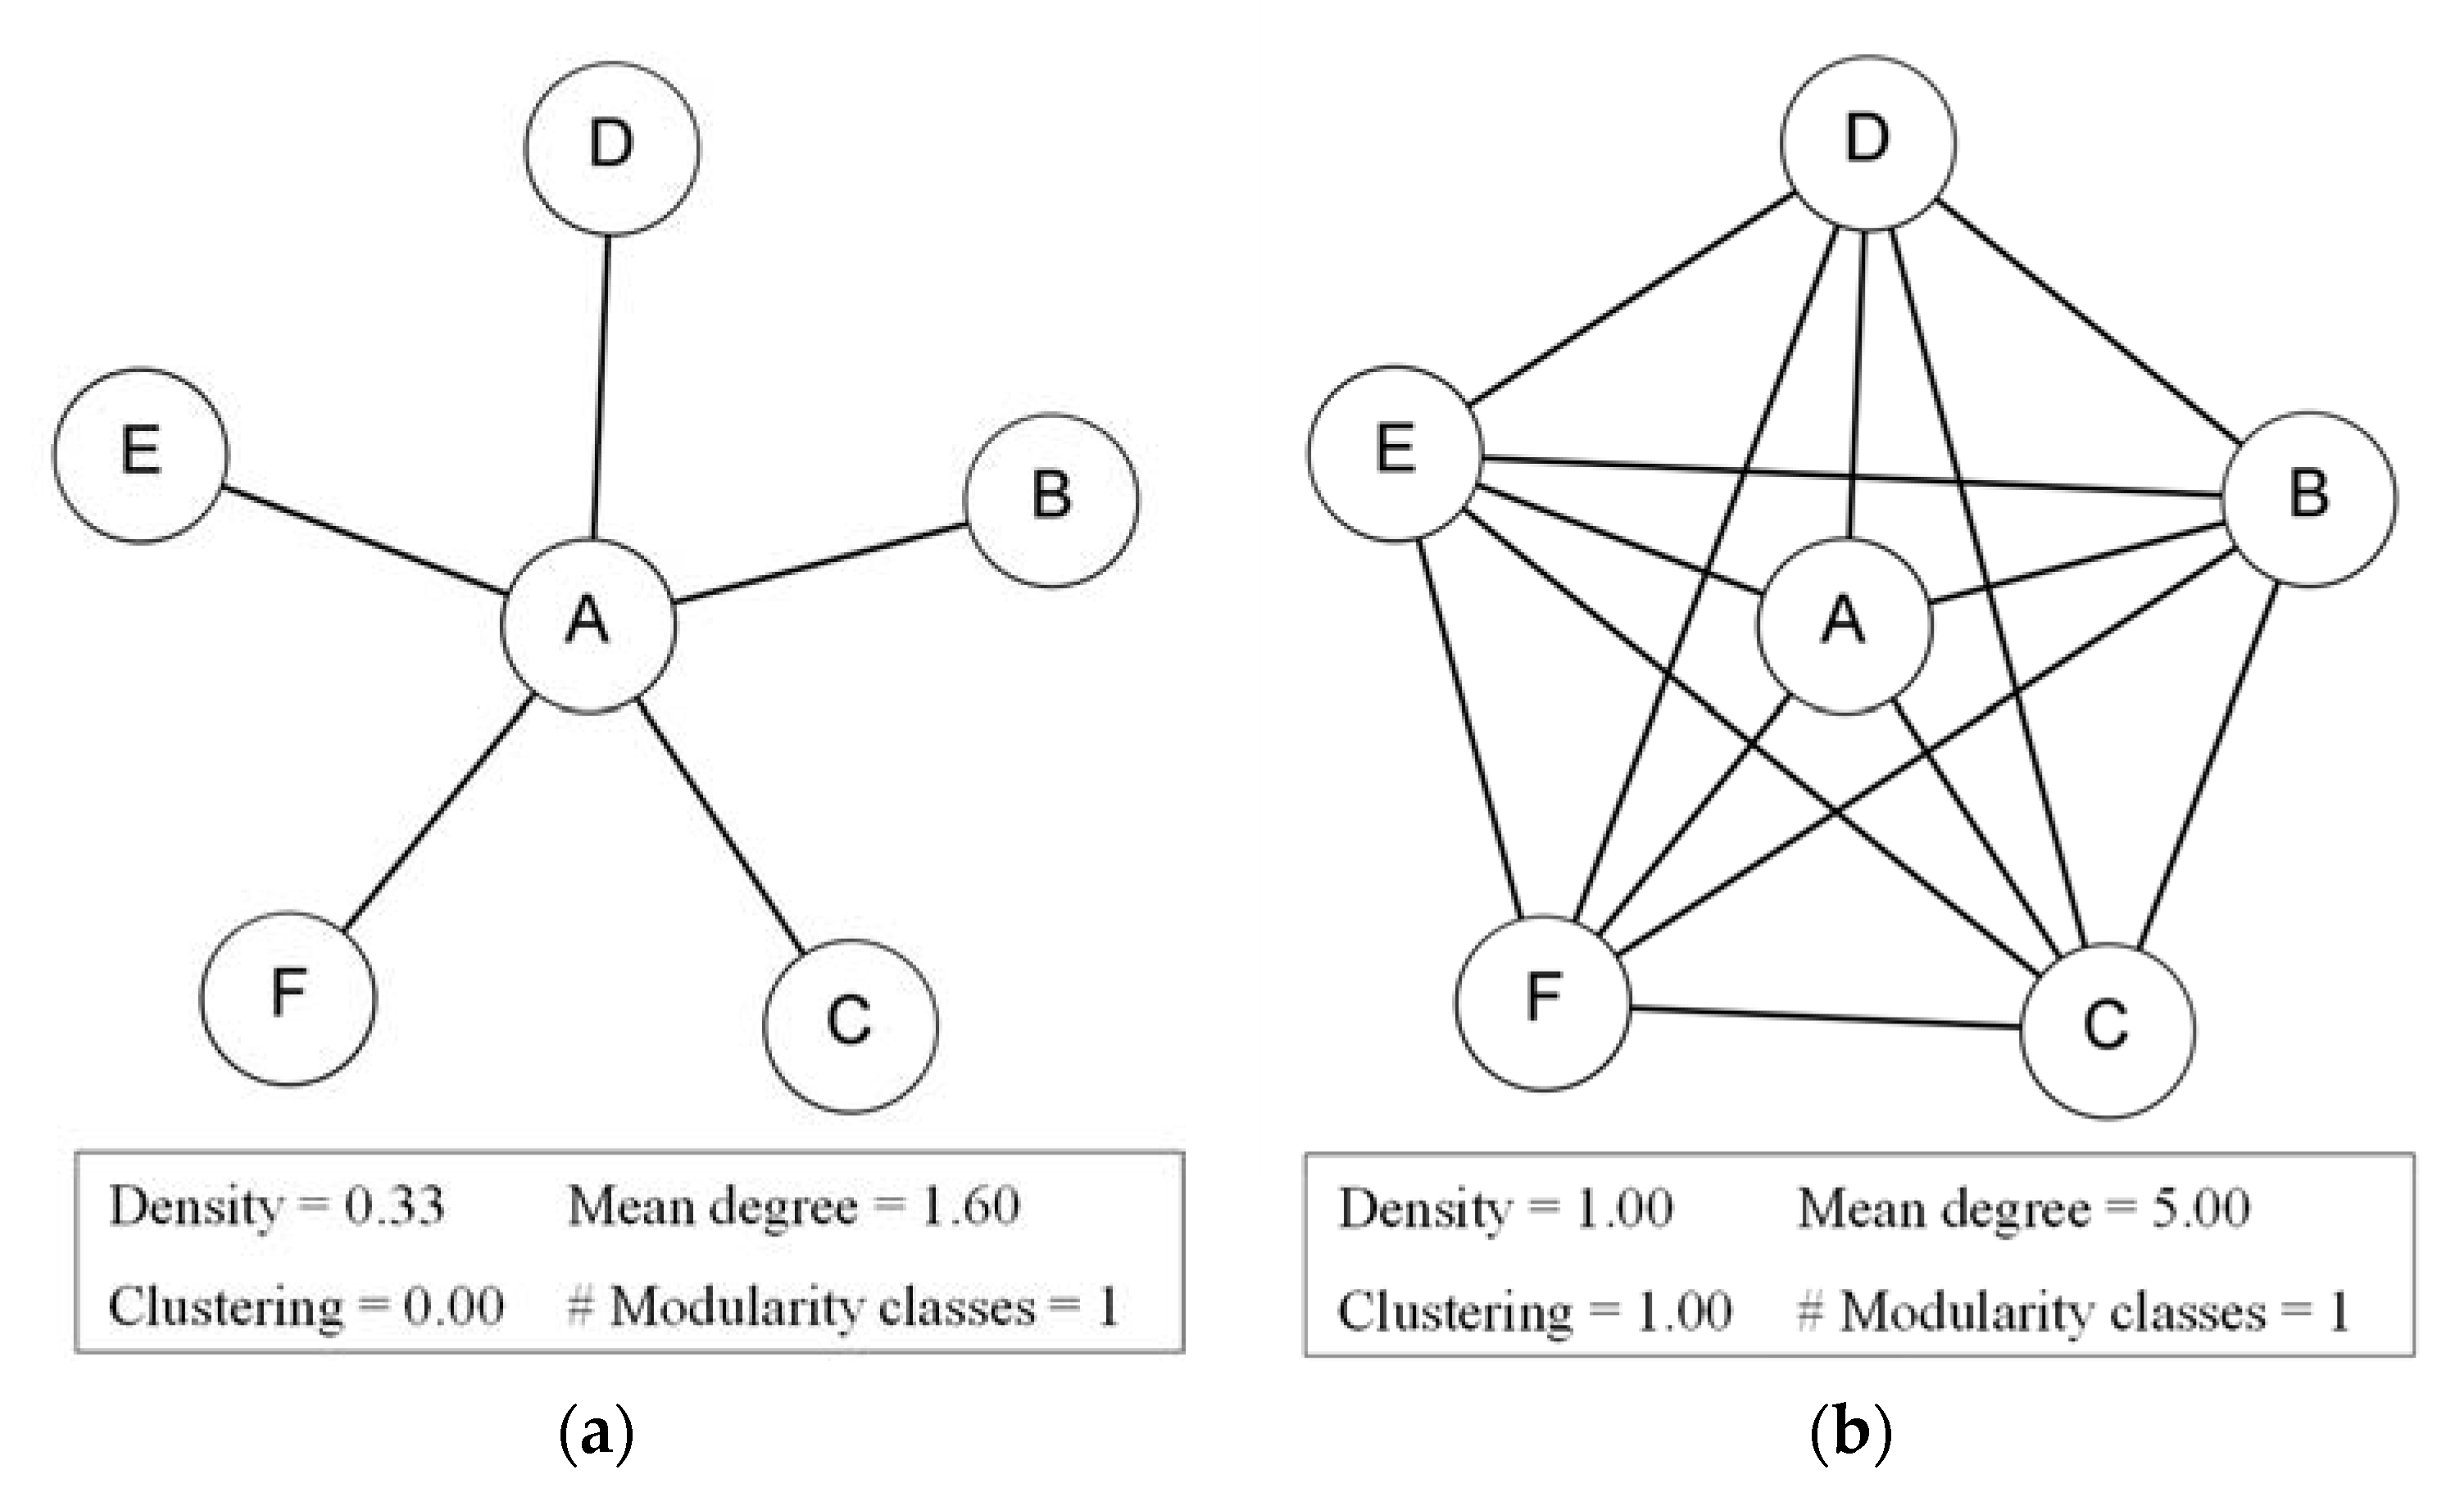
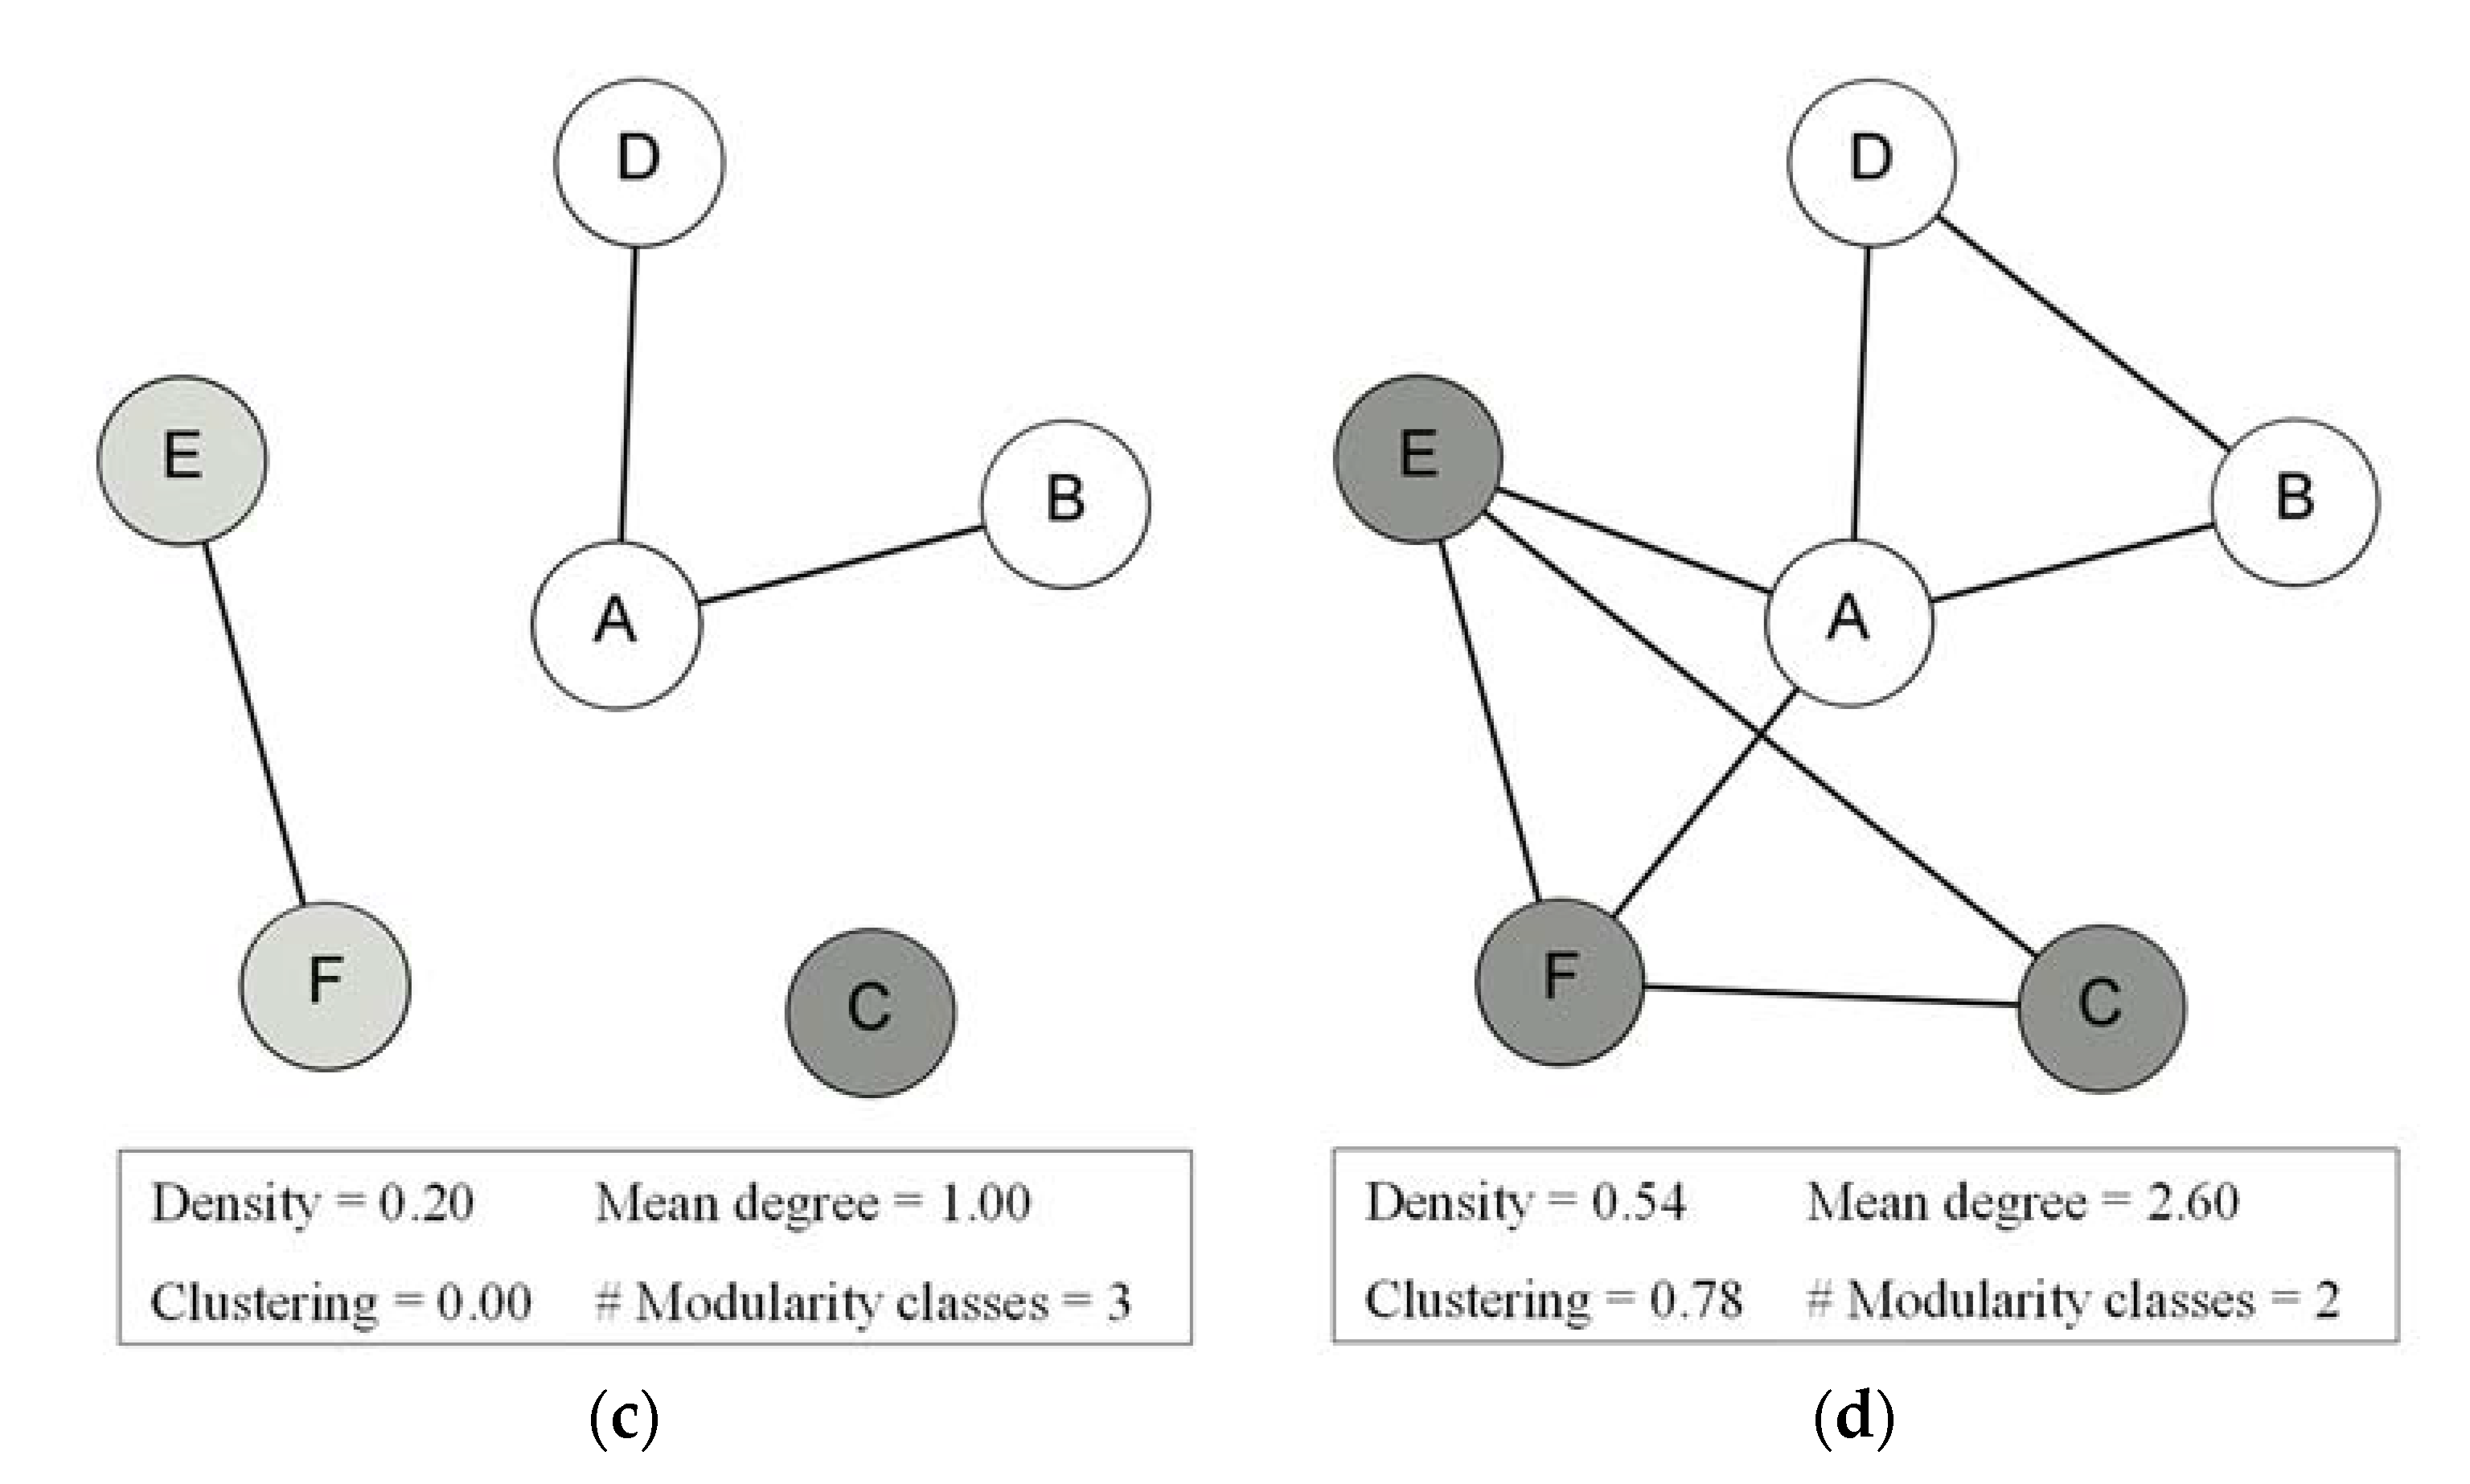
The sociograms generated using the SNA help to visualize the global metrics presented in
Table 3. As an example,
Figure 1 presents four sociograms in a network of six people (nodes). Each sociogram shows different interactions (links) among its members, which are represented graphically and mathematically, through the global metrics.
Figure 1a shows a network centralized in node A, which is the only person who connects with the other network members. This behavior is supported by an average degree of connection of 1.6 people, i.e., that on average each node connects with other 1.6 nodes of a total of 5 potential connections. Complementarily, the density of this sociogram is 0.33 (5/15), which is lower than the density of the sociogram in
Figure 1b, where the actual connections are equivalent to the possible connections (15/15). Another difference between the sociogram in
Figure 1a,b is the clustering coefficient; in the first one, there are no triads generated between the nodes, while in the second one, there are all the possible triads between the nodes. Therefore, the clustering coefficient in
Figure 1a is 0 and that in
Figure 1b is 1. Nevertheless, in both sociograms, there is only one modularity class, that is, in these two sociograms there are no sub-communities within the whole network.
Figure 1c contains only 3 connections of the potential 15; it is the network with the lowest density and the lowest average degree of all the shown sociograms. Additionally,
Figure 1c) presents three clearly disconnected sub-communities (number of modularity classes equal to three); this is remarked through the node colors. Furthermore, the clustering coefficient is zero since there is no triad in this network. It is not necessary that the sub-communities are completely disconnected to have more than one modularity class. For example, in the sociogram of
Figure 1d, it is possible to visualize two modularity classes, that is, two sub-communities (gray and white nodes) are generated because there is a relatively superior connection between one group of nodes and the other. Additionally, in
Figure 1d, triads can be appreciated between the nodes ABD, AEF, and EFC, thus, there is a clustering coefficient higher than the sociograms in
Figure 1a,c, but lower than
Figure 1b.
The degree of a node is its number of connections, and it constitutes a basic metric to characterize the members of a social network according to their importance or centrality. High-degree nodes are assumed to have a high probability of receiving and transmitting information within the network [
41].
The grouping coefficient of a node defines the probability that two randomly selected friends of that node are friends of each other. The grouping coefficient of a node varies from 0, when none of the friends of the node are friends with each other, to 1, when all of the friends of the node are friends with each other [
34]. The coefficient is calculated by dividing the number of triads existing in the network by the number of possible triads in it. A triad is made up of three nodes that maintain mutual connections with each other in the form of a closed triangle.
Members who have many connections with other members of a network tend to have low grouping coefficients, while nodes with a low degree tend to form triads more easily, and this also happens in small networks with highly cohesive groups [
46]. Modularity allows for knowing the distribution of the network in communities. Communities are formed with members interacting with each other by some common characteristic, making their connections more systematic and less random [
33]. The densities of interaction within communities are often different from the density of interactions between them. Identifying communities is used to design SNA-based intervention strategies [
45].
The analysis of the characteristics of the networks, which are related to the connectivity, flow of information, and communication, usually focuses on cohesion indicators such as the average degree of their members, the density of the network, the number of components, and the average length on the way [
41].
The average degree is calculated from the degree of each one of the nodes of the divided network for the number of nodes. It is assumed that a high average degree implies high connectivity of its members and a low dispersion in isolated groups.
The density of the network calculated as the number of existing connections divided by the possible number of achievable connections of its members defines how closely its members are related. Low densities are associated with hemophilia and the appearance of many groups within the social network [
46].
The average path length is the average of all the shortest possible routes among all nodes in the network. Low values, close to 1, suggest a greater efficiency of the network to transmit information among its members.
The number of components indicates how many isolated groups a social network is divided into. When there is more than one component, not all members of the network can contact another. Then, the number and size of components in a network define topological regions that can be associated with the ease of sharing information and resources [
46,
48].
Finally, the centrality metrics of each member of the network were calculated: degree and intermediation. The characteristic metrics of each network: average degree, diameter, and average path length. For the analysis of the networks, the SNA criteria were applied to identify the central members of the networks and the network characteristics that facilitate the communication of their members. On the other hand, teachers were asked for the qualifications of each student in the courses, both for the general activities and for the activities carried out as GW. Using the social network metrics, a comparative analysis was carried out at each level of the career, using the average degree. In addition, students’ grades, and network metrics were used in a correlation analysis with the Spearman method to establish whether the connectivity characteristics of social networks are related to the grades obtained by students in the semester and in the GW.
4. Results
4.1. Comparative Analysis of Social Networks
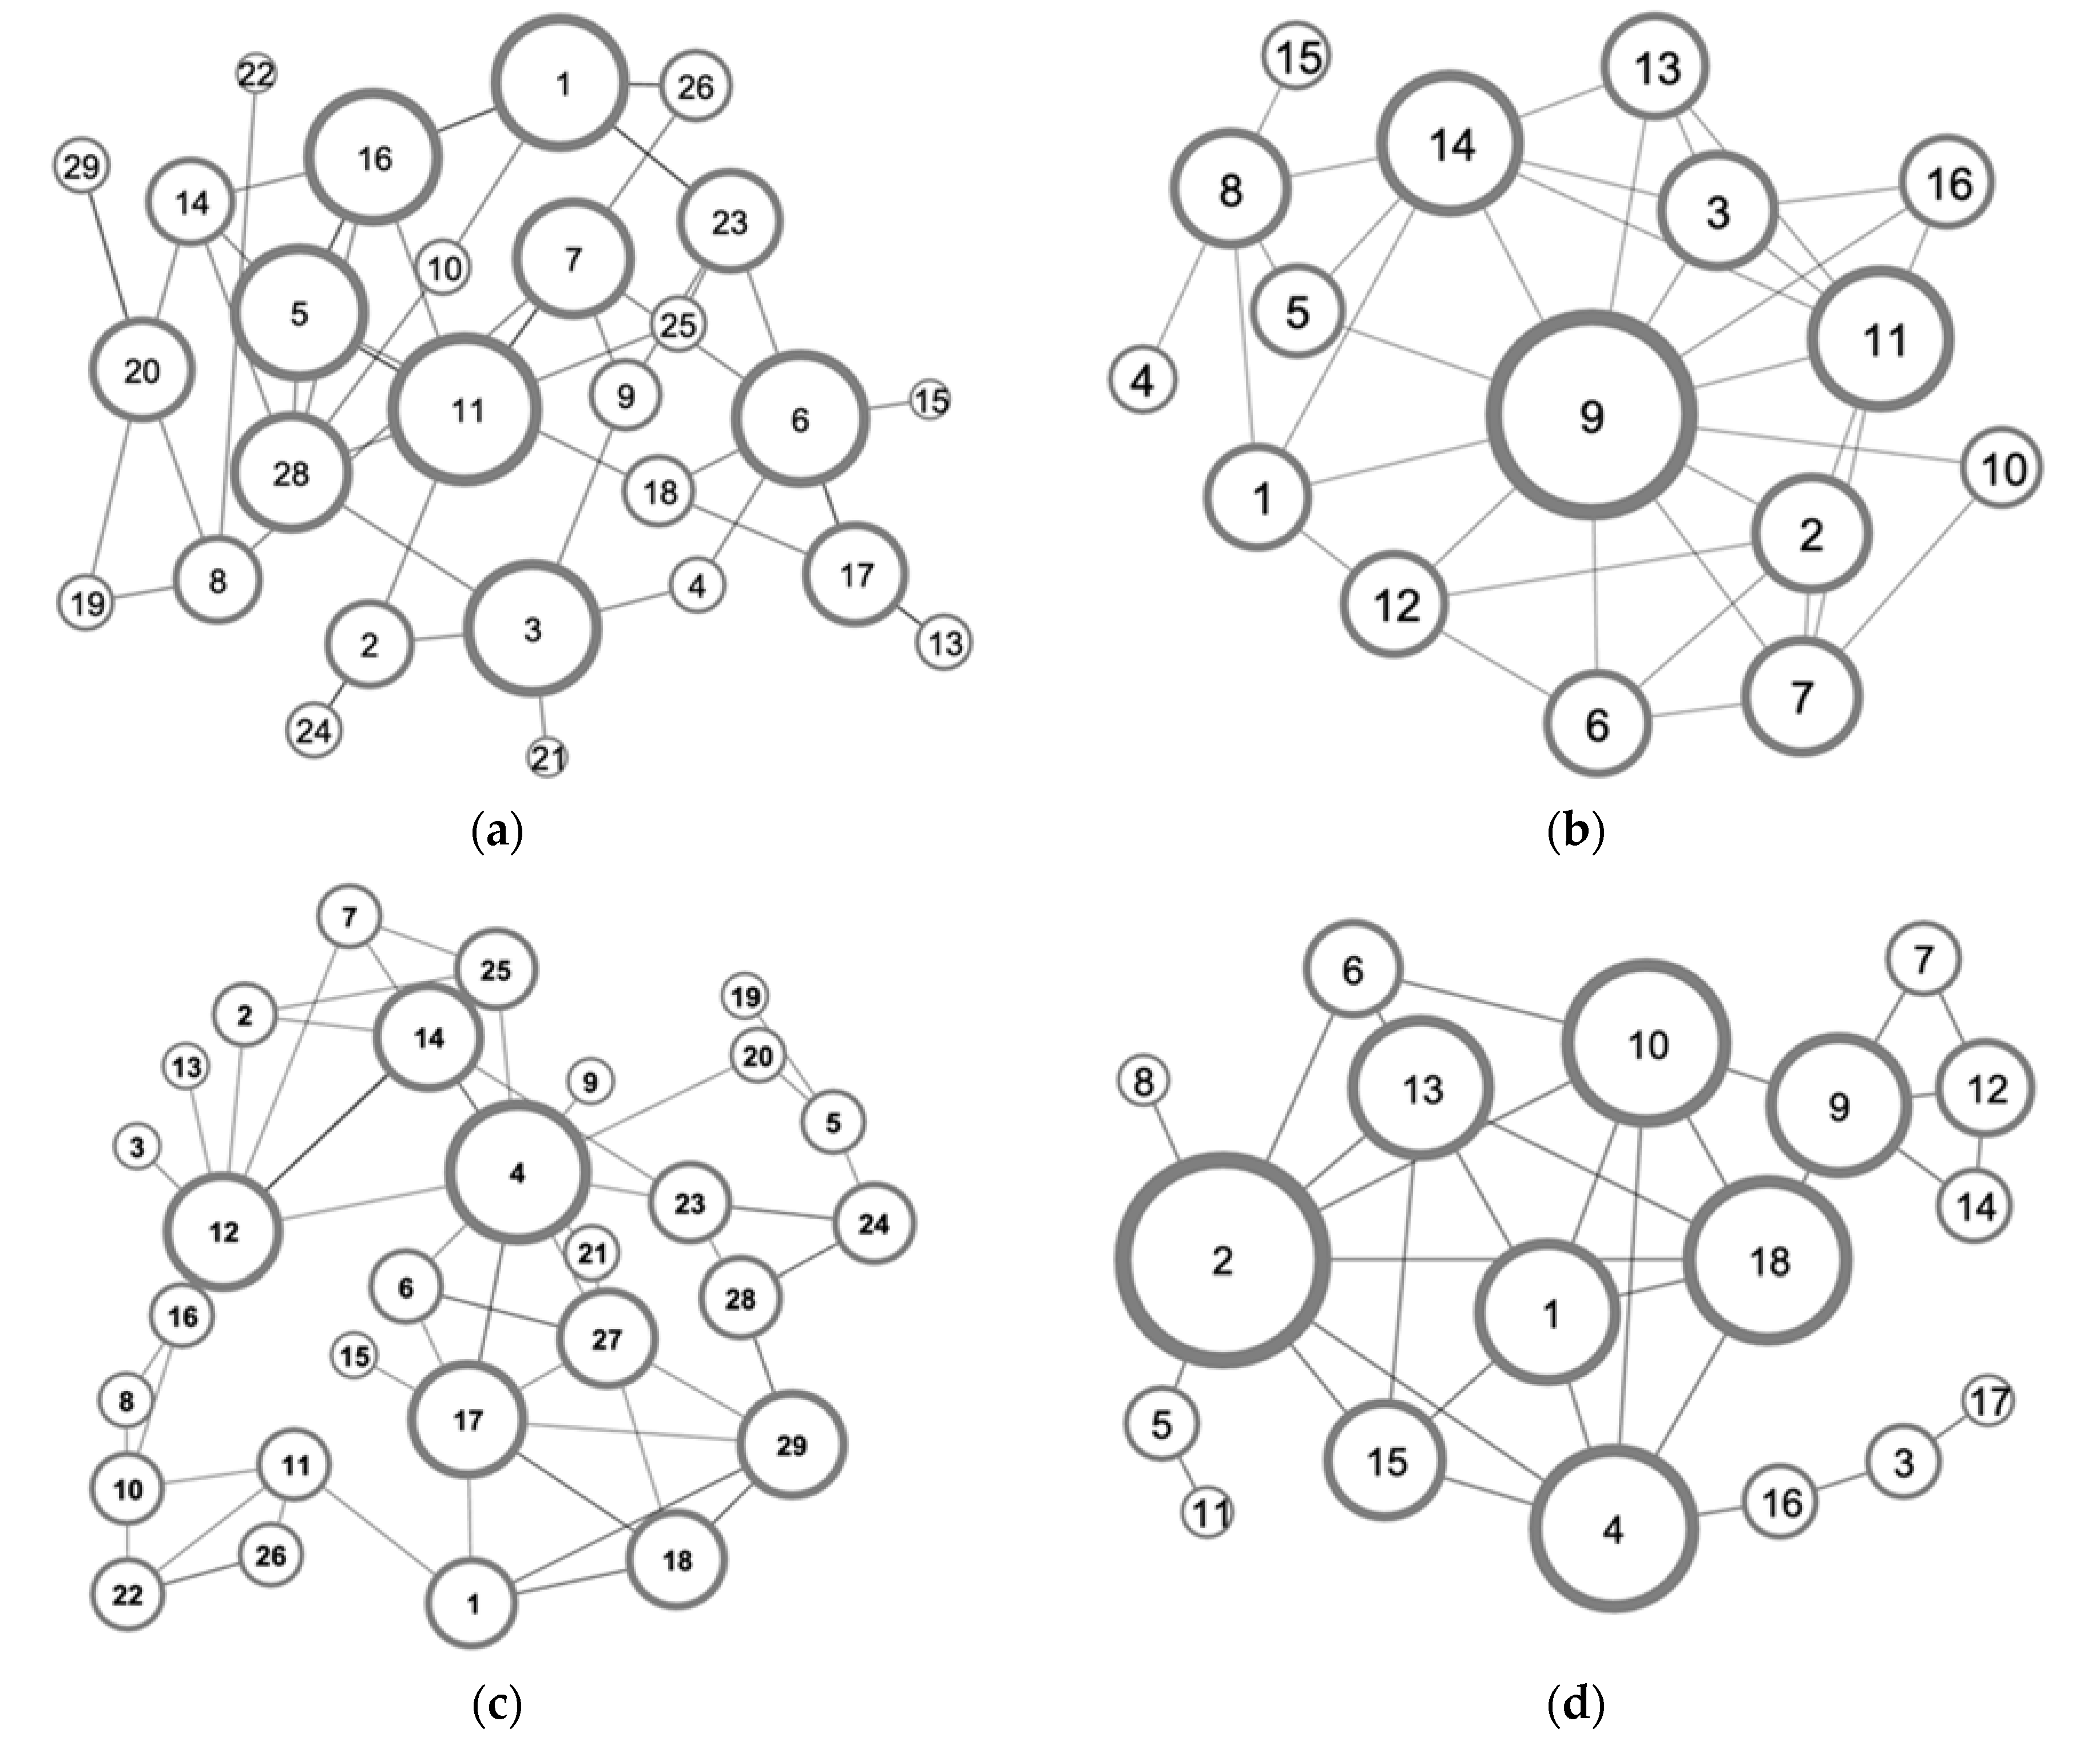
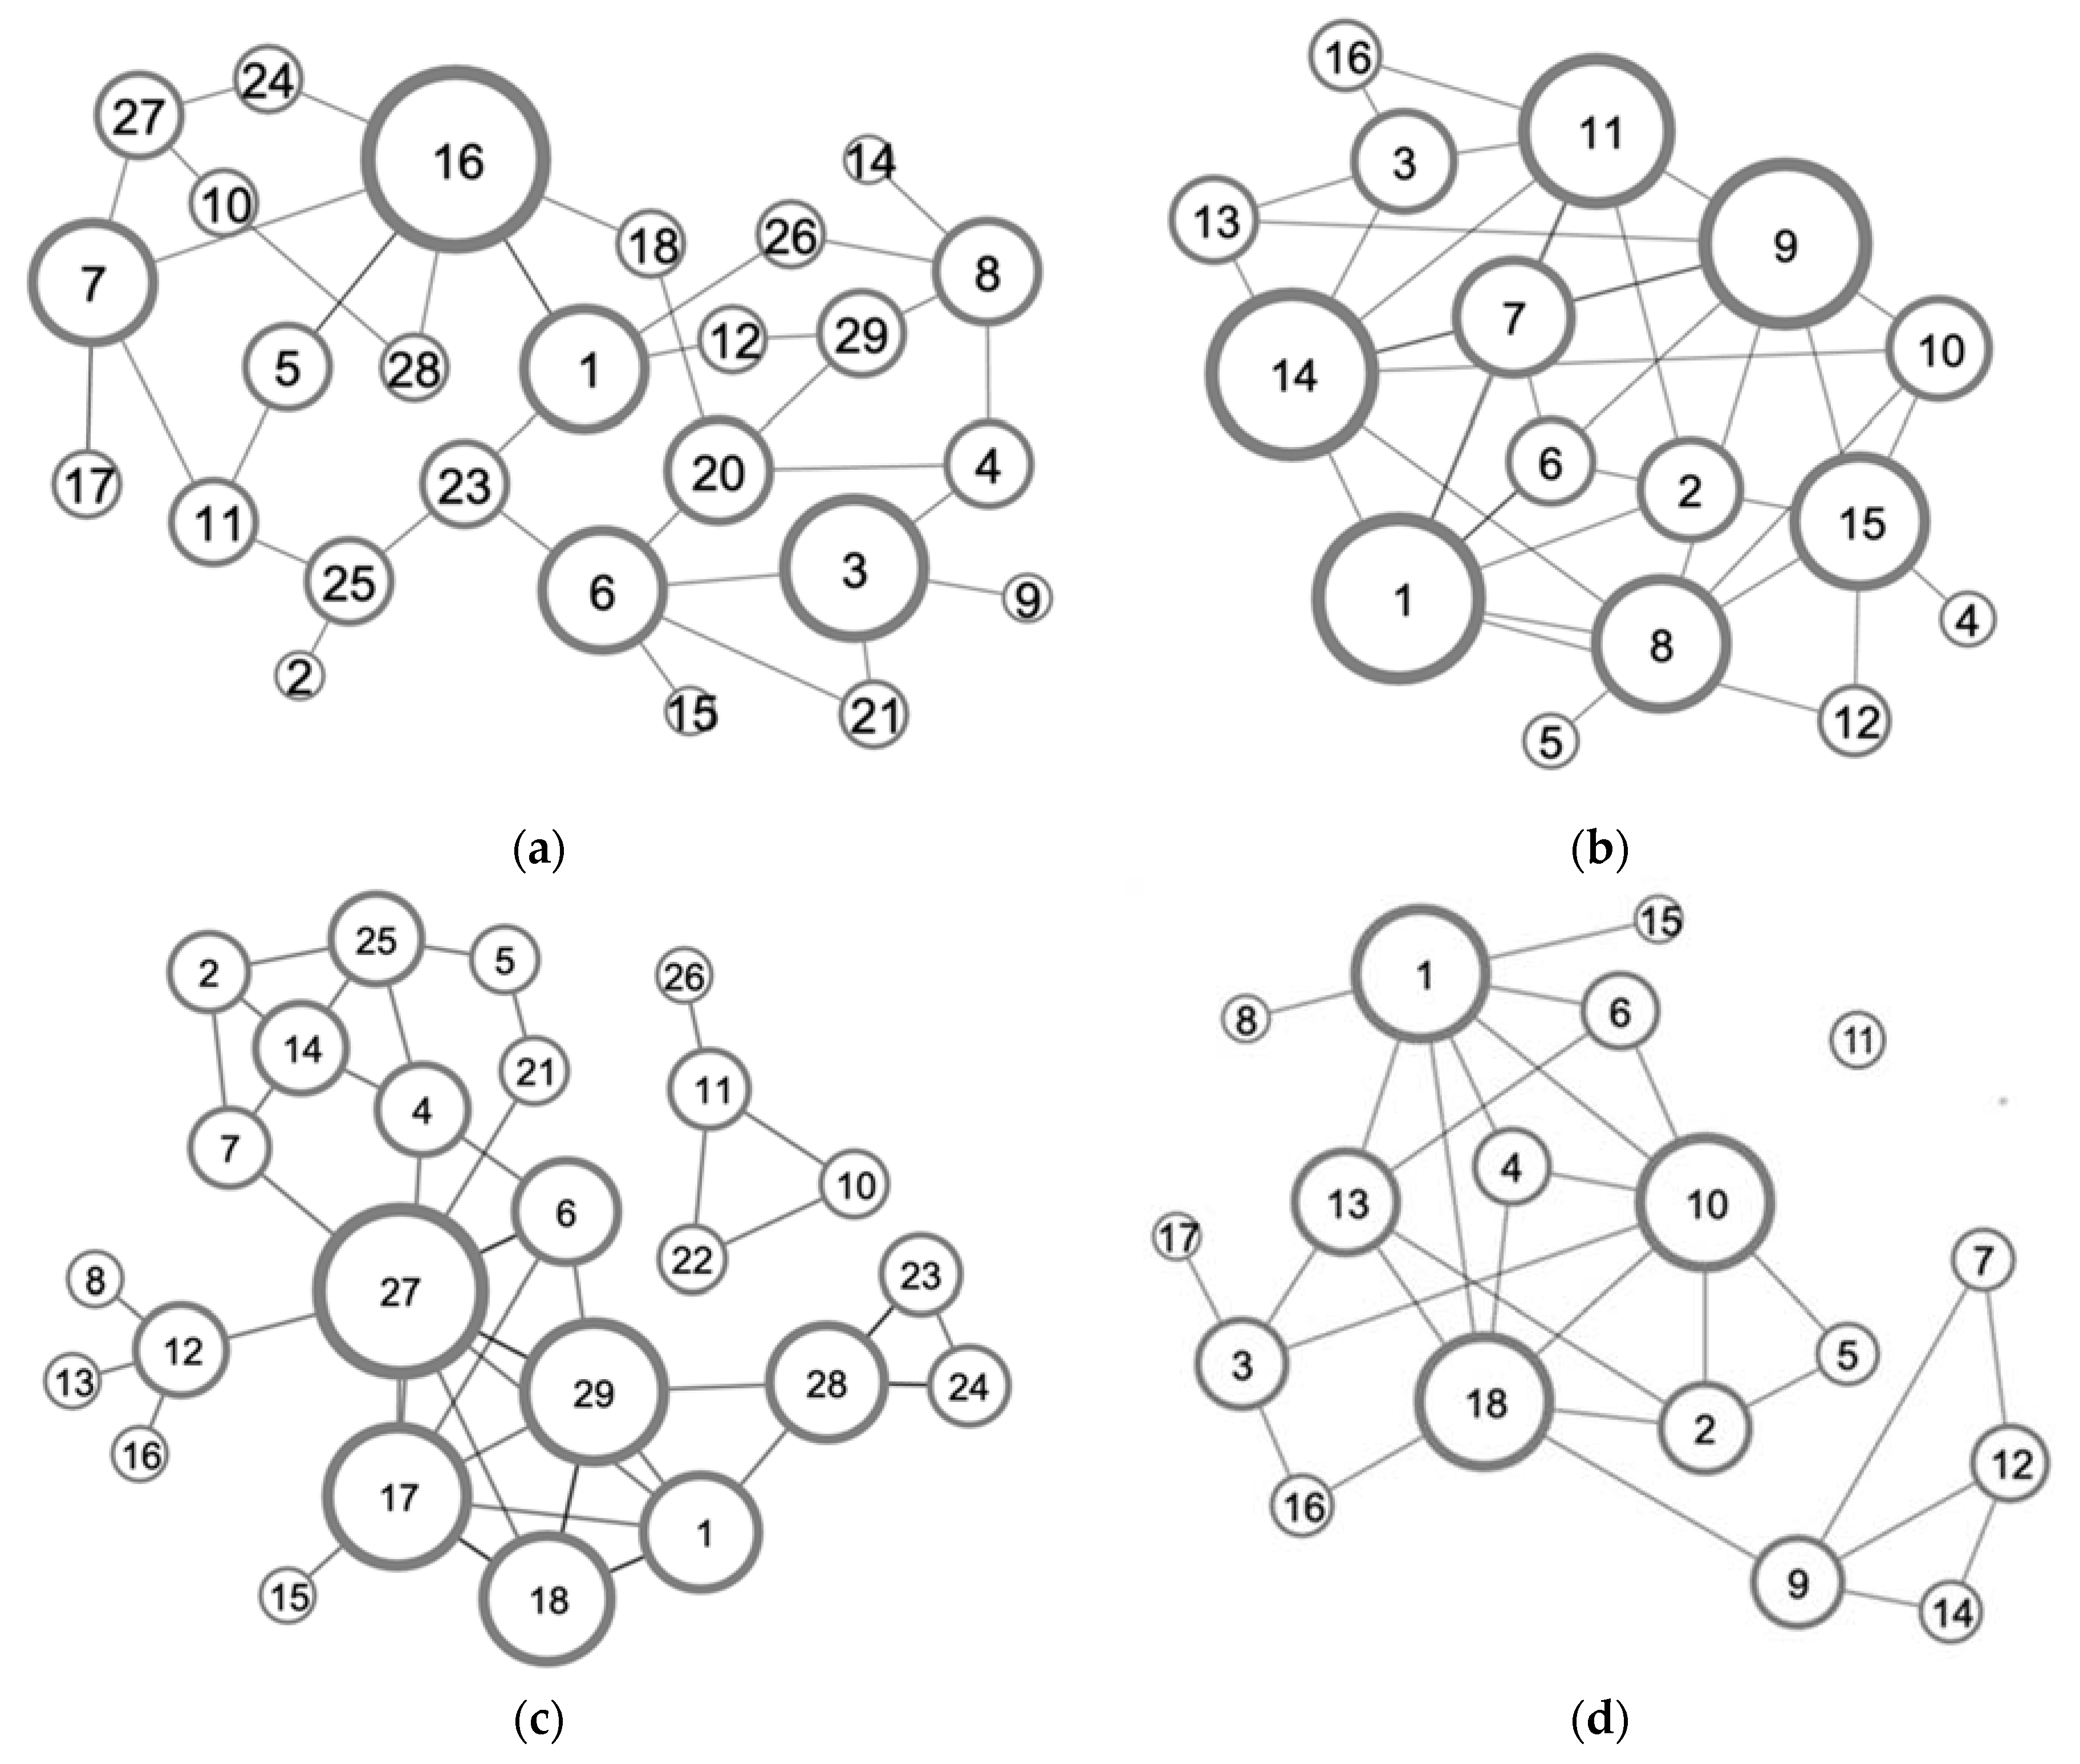
The results of the SNA are shown in
Table 4, in groups containing six social network metrics, for each of the courses participating in the study and for general communication networks (
Figure 2), personal trust (
Figure 3), and consultation (
Figure 4).
The density of the three networks in all semesters is low, with a maximum of 30% in the fourth semester and a minimum of 6% in the tenth-semester trust network. This is uncharacteristic of small networks with less than 30 people in which it is easy to make contacts, which reveals poor communication between students in the courses. In addition, low densities in social networks are a sign of the existence of several small groups of friends in the courses [
46]. Results shown in
Table 4 are depicted ahead in network graphs, showing the members with a higher degree in a bigger node size.
The links between students include several intermediate members, which is reflected in long diameters, as happens in the second semester. Although the diameters of the trust networks seem shorter, it must be considered that they are the diameters of the small groups that make up these networks and that, in some cases, they do not incorporate several individuals isolated from the course
Figure 3.
The average clustering coefficient shows that in the second semester, there are members with many connections but with few closed triads, especially in the consultation network. The clustering coefficient increases as the career progress, and from the fourth to the tenth semester, the percentage of triads increases because personal relationships become more selective both in general relation and in consultations.
When making a comparison of the average network degree, in general, the metric of the trust networks is lower than the other two networks. Trust relationships are limited to small groups of frequent interaction or friends (strong ties), while general interaction and consultation networks include relationships between acquaintances (weak ties), often contacted through other members of the course (
Figure 2 and
Figure 4). Weak ties are related to the incorporation of new information and opportunities for individuals [
34], so the union of many weak ties in the consultation network would help to spread the knowledge perceived by its members, and in this point, it is critical that the information have good quality [
24].
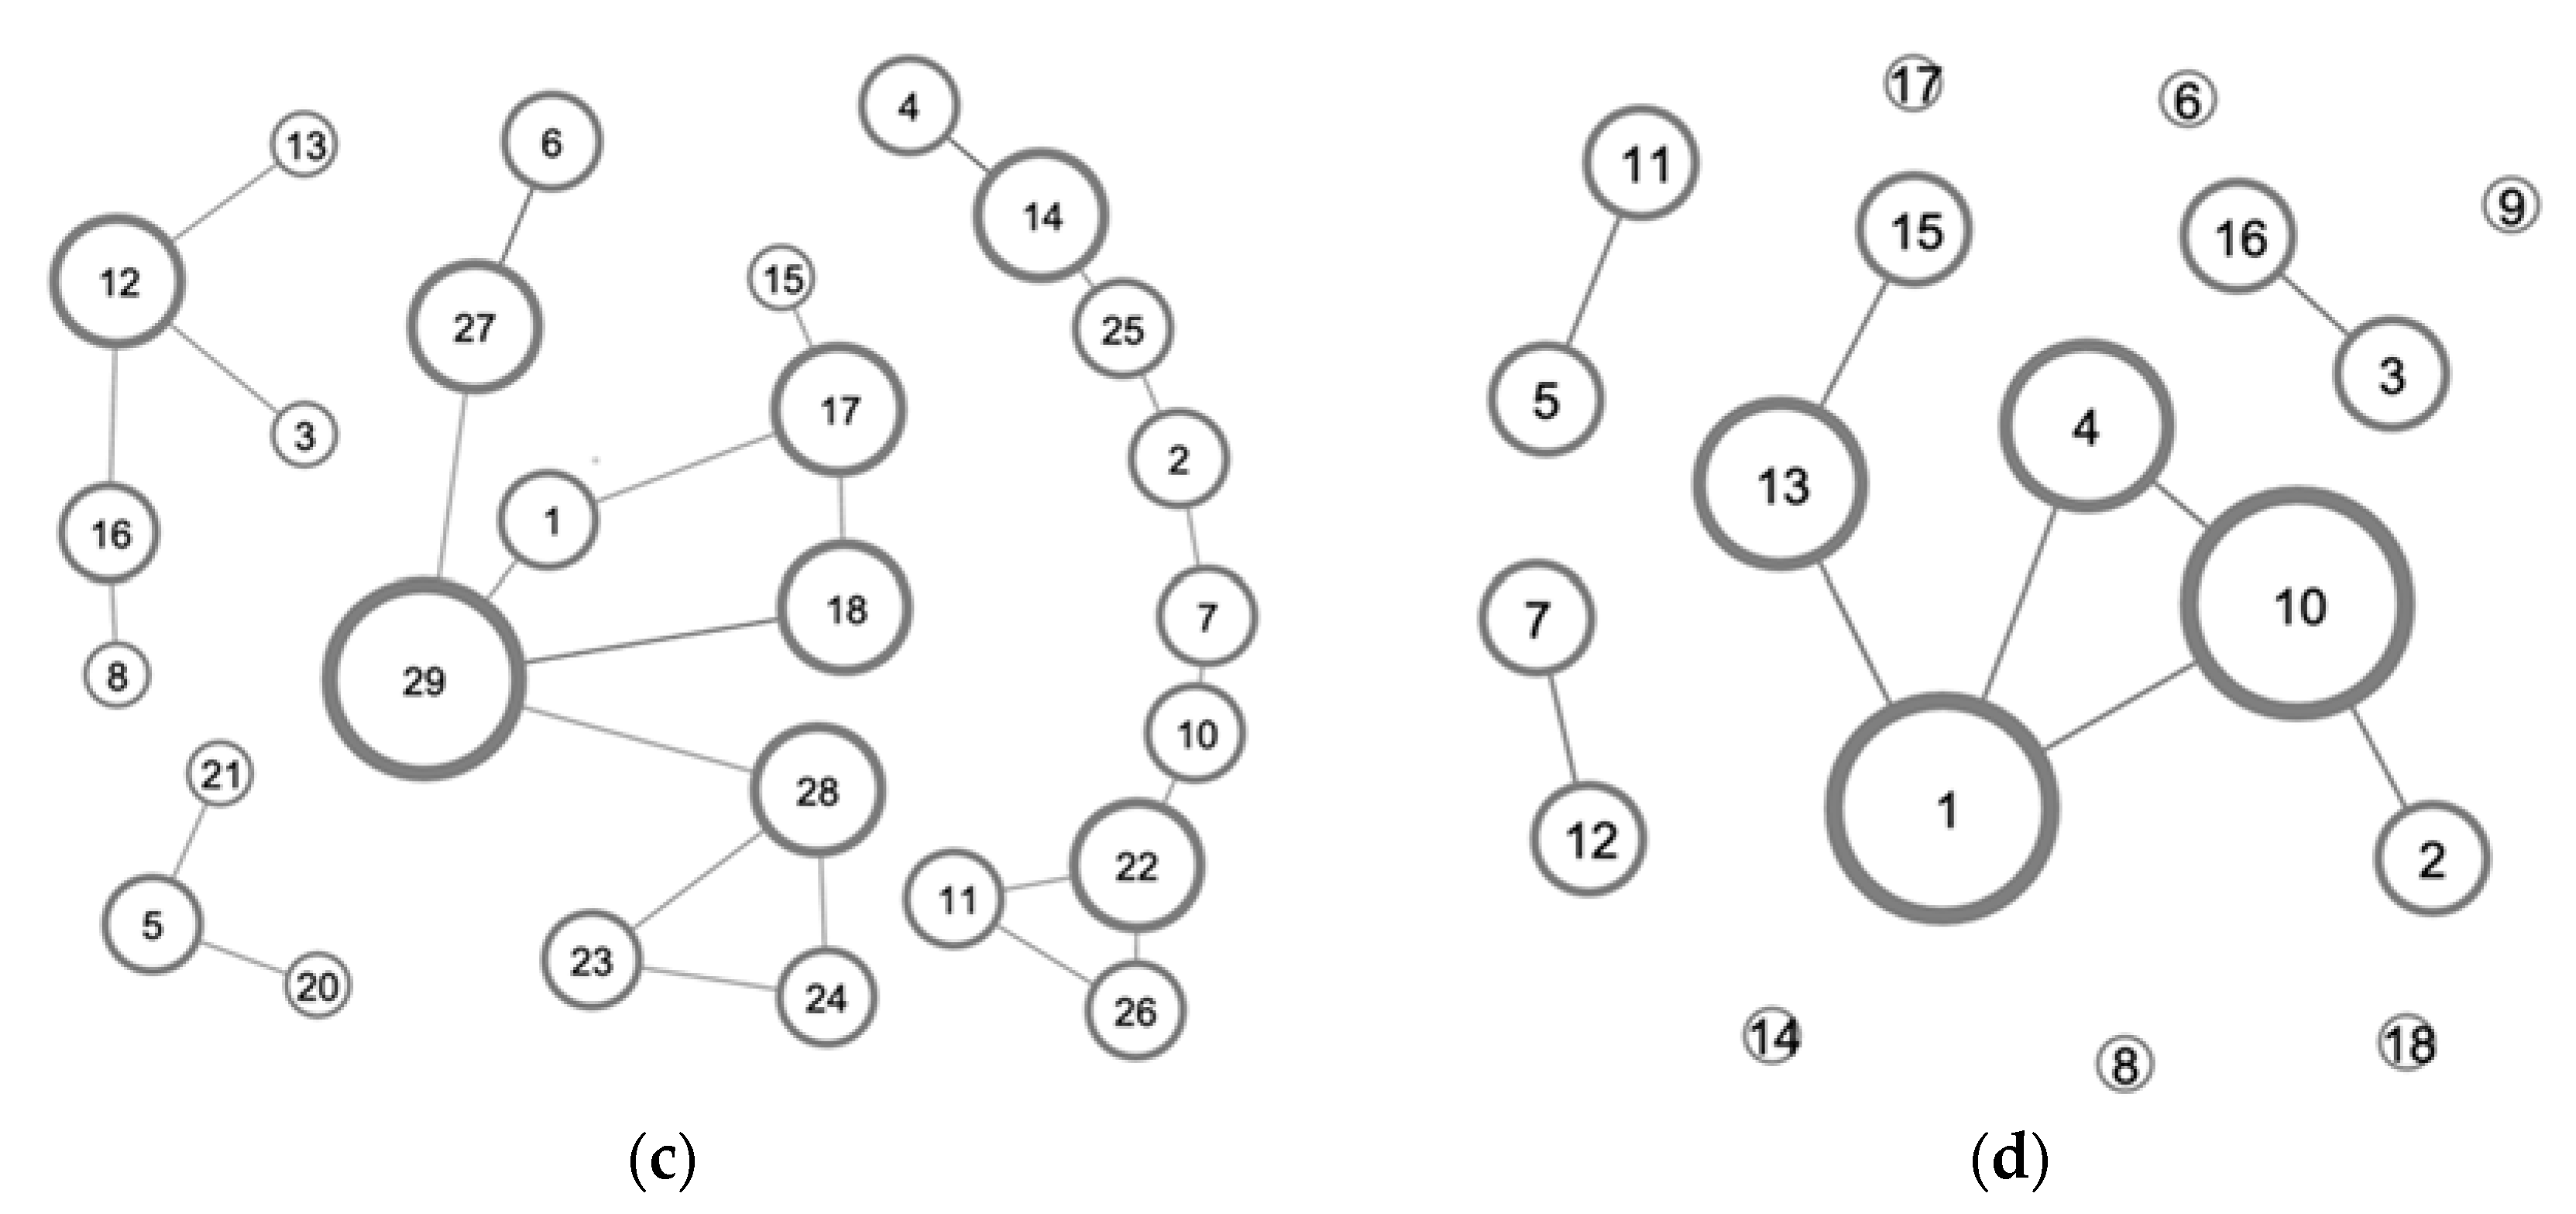
Another interesting issue in the courses studied is that trust networks have few components in the initial semesters, whereas in the last semesters, there is a tendency towards individuality. This occurs in the ninth semester, with four clearly identified groups, and the tenth semester (end of career), in which a small central group appears, several couples, and isolated individuals (
Figure 3). In the first semesters of social integration, trust networks with few compact components would make the information that enters the groups weakly innovative. On the other hand, in the last semesters, when developing GW, people who do not have confidence would be interacting. This is of paramount importance, since trust is necessary to achieve effective communication and fulfillment of commitments [
36]. The number of components within the trust networks grows from the second semester to the tenth, and the disintegration grows as the career progresses, a social deterioration that is not being managed by teachers, as they do not have tools that allow them to notice it.
Another remarkable aspect in the studied group is the structural similarity of the social networks of general interaction and that of consultations in all the semesters of the degree. Those networks present a more abundant interaction than in the trust network, indicating that the greatest number of contacts among students occurs for reasons of informal chatting or academic work. From this point of view, it is easier to achieve a contagion of behaviors or learning by working with the networks of highest contact [
34].
The results of the comparative analysis could be indicating that the GW have focused only on the tasks. Trust is what drives the fulfillment of commitments, so that a group in which people interact with each other without trust could hardly be fulfilling the objectives set in collaborative learning [
30]. This raises questions that should be answered by the actors in the learning process after an analysis of the context and the GW results.
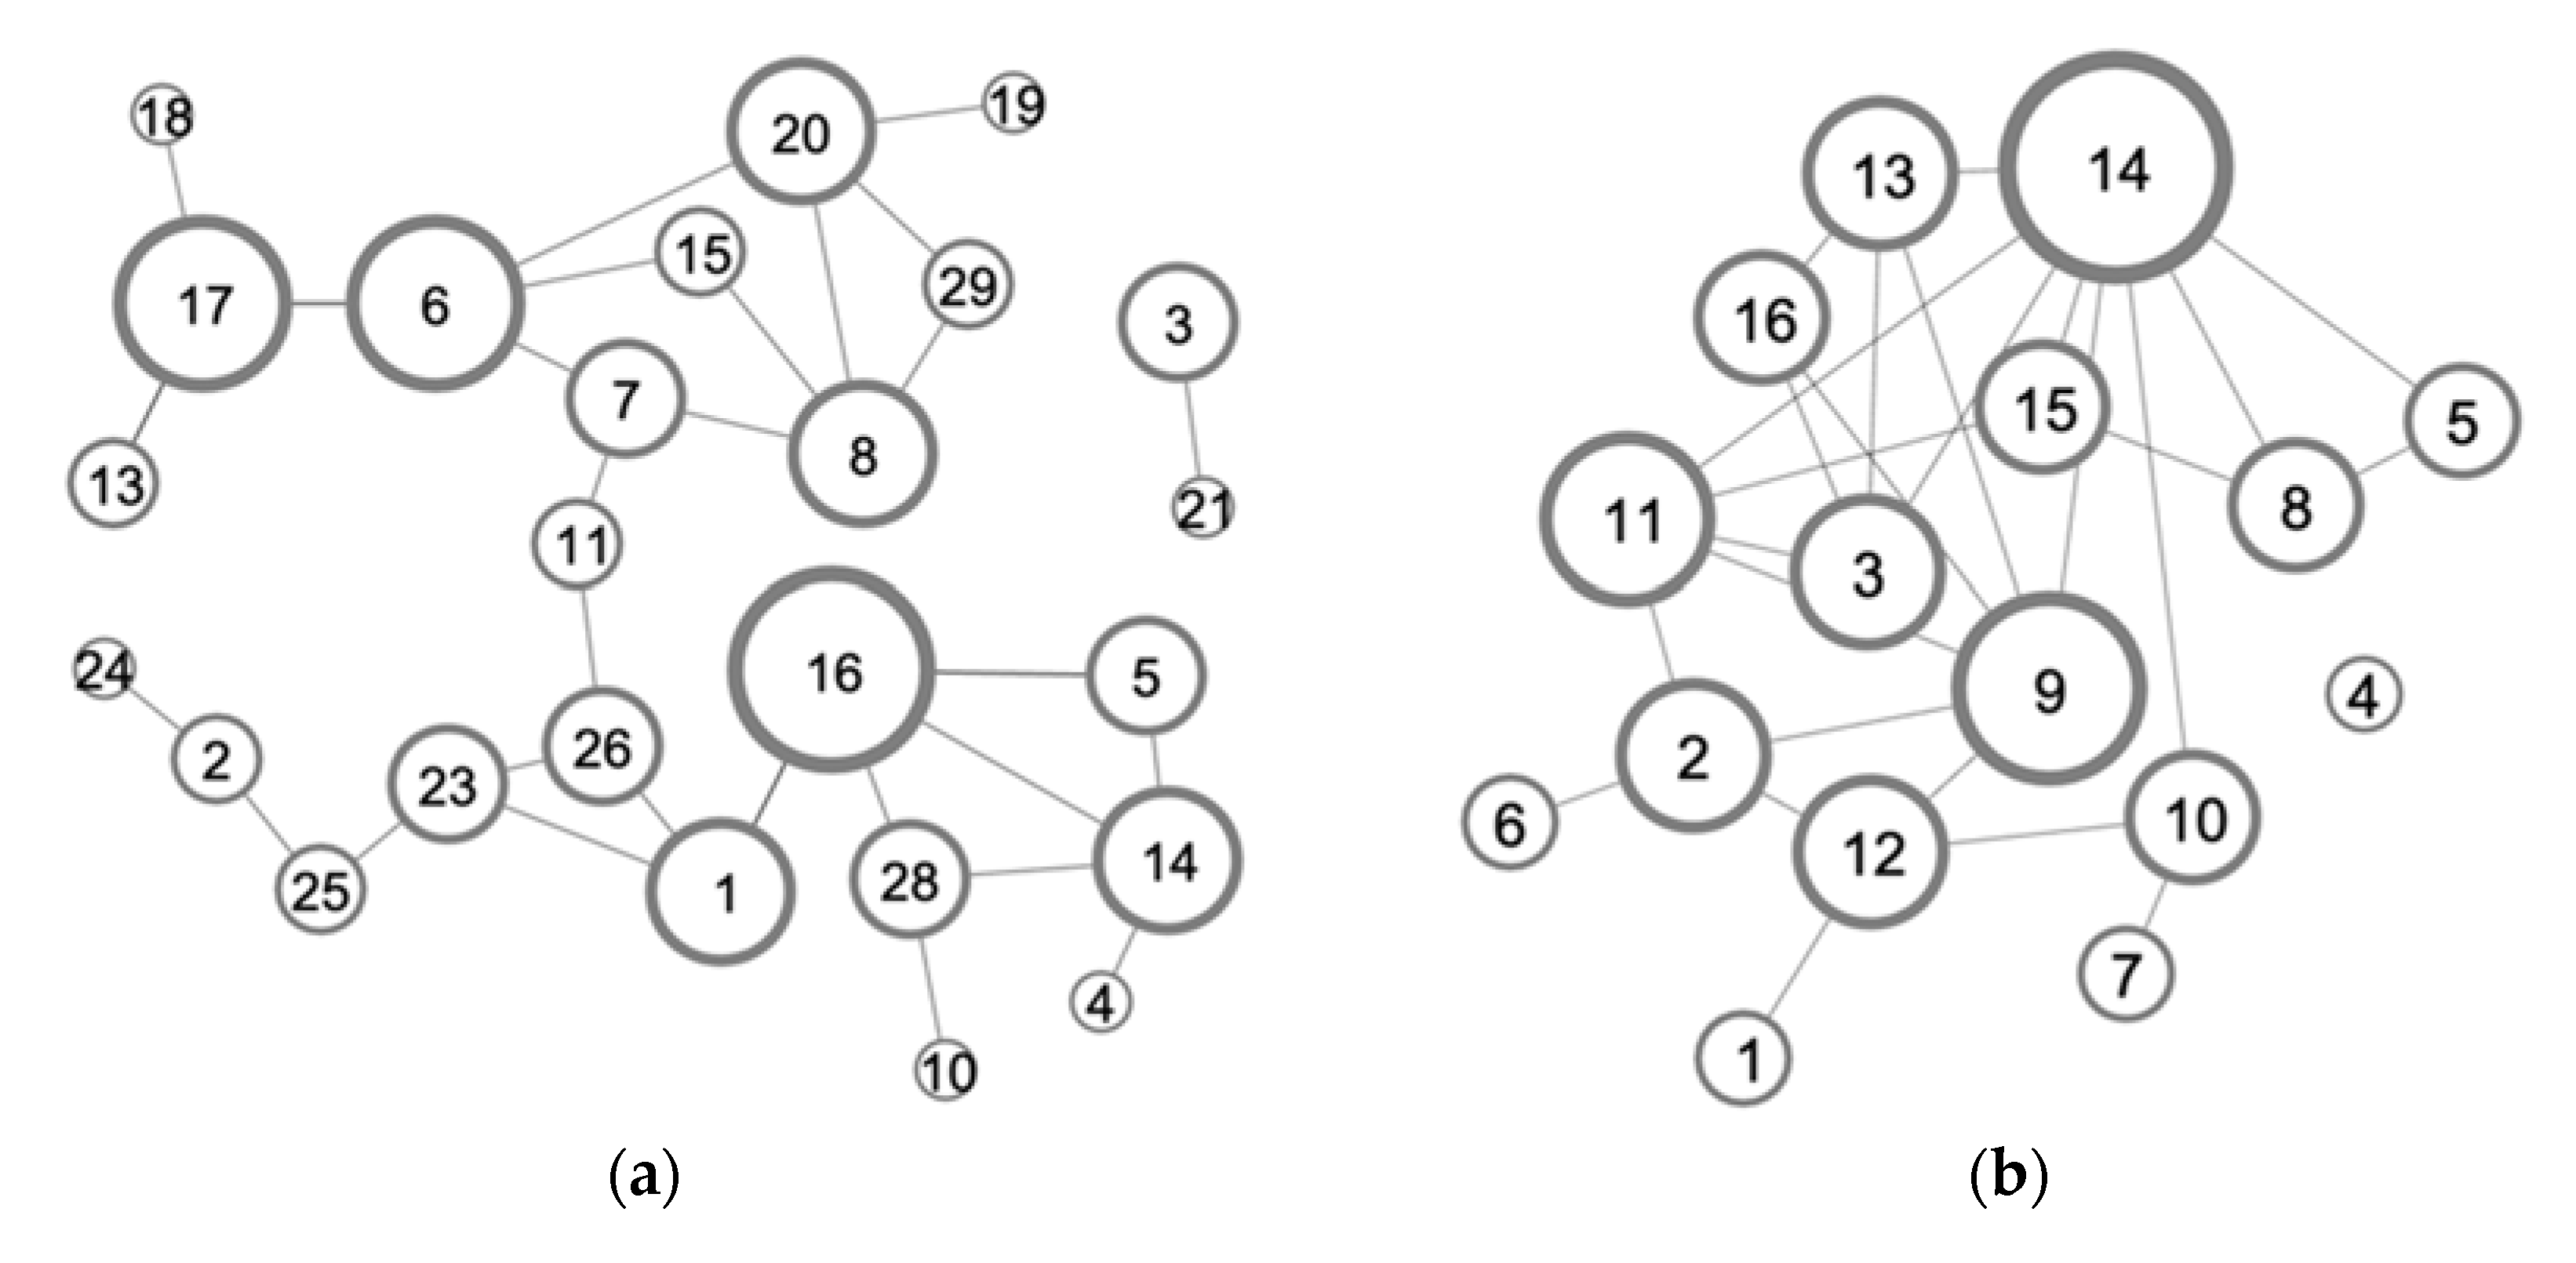
4.2. Social Networks and Group Work
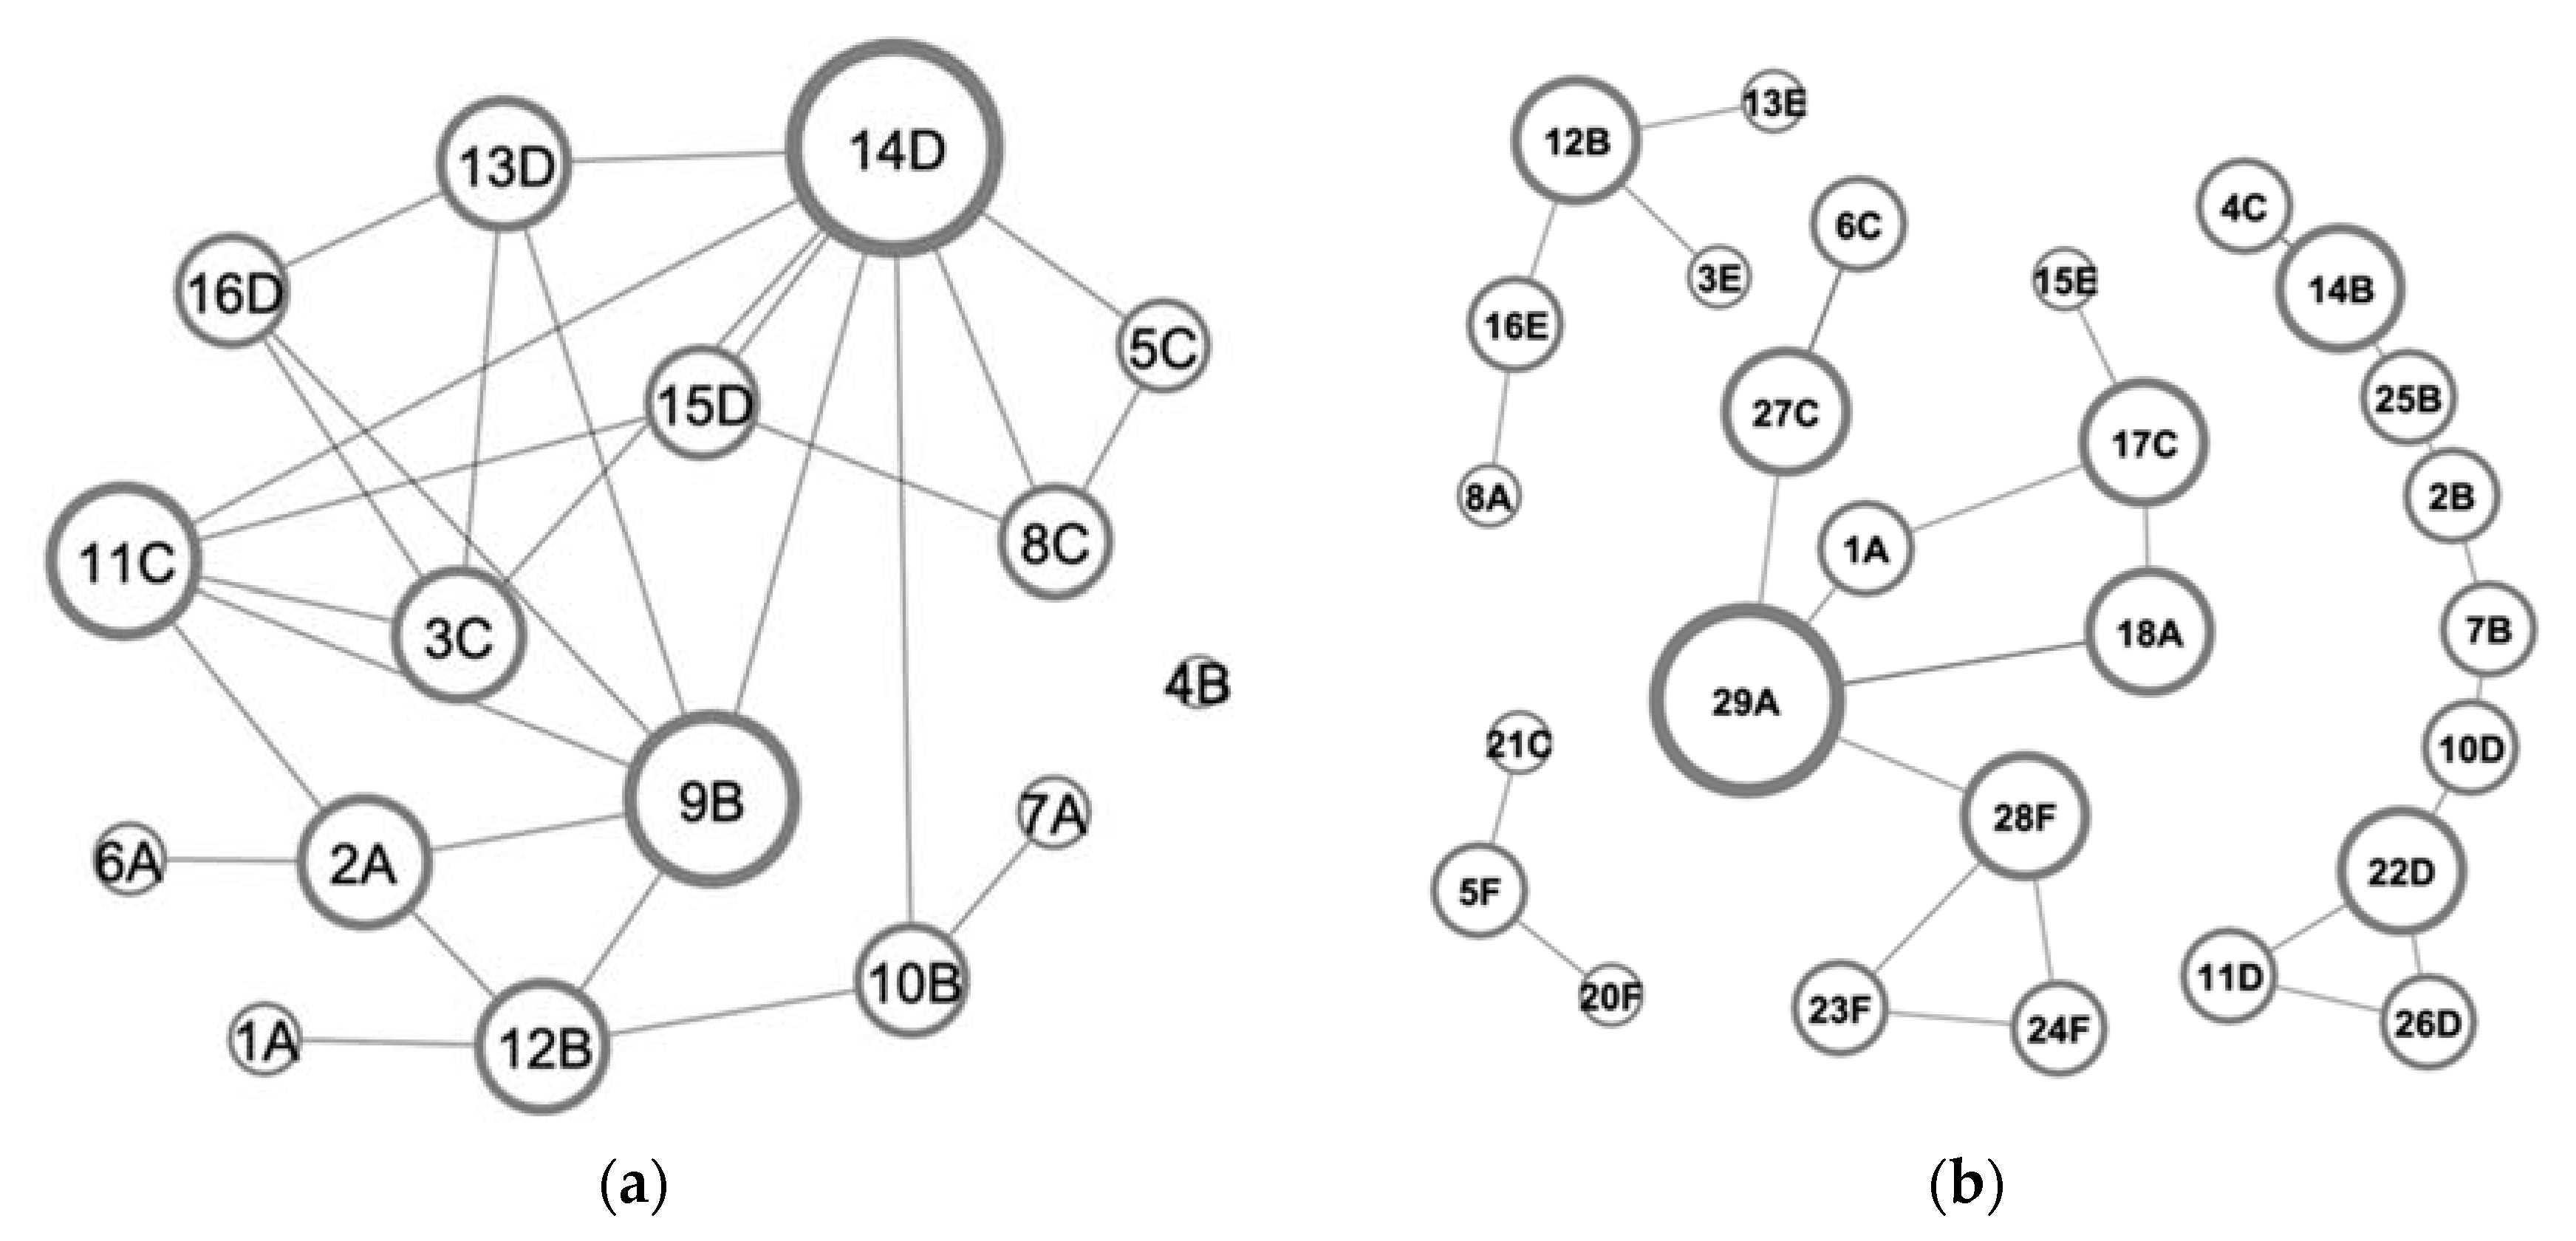
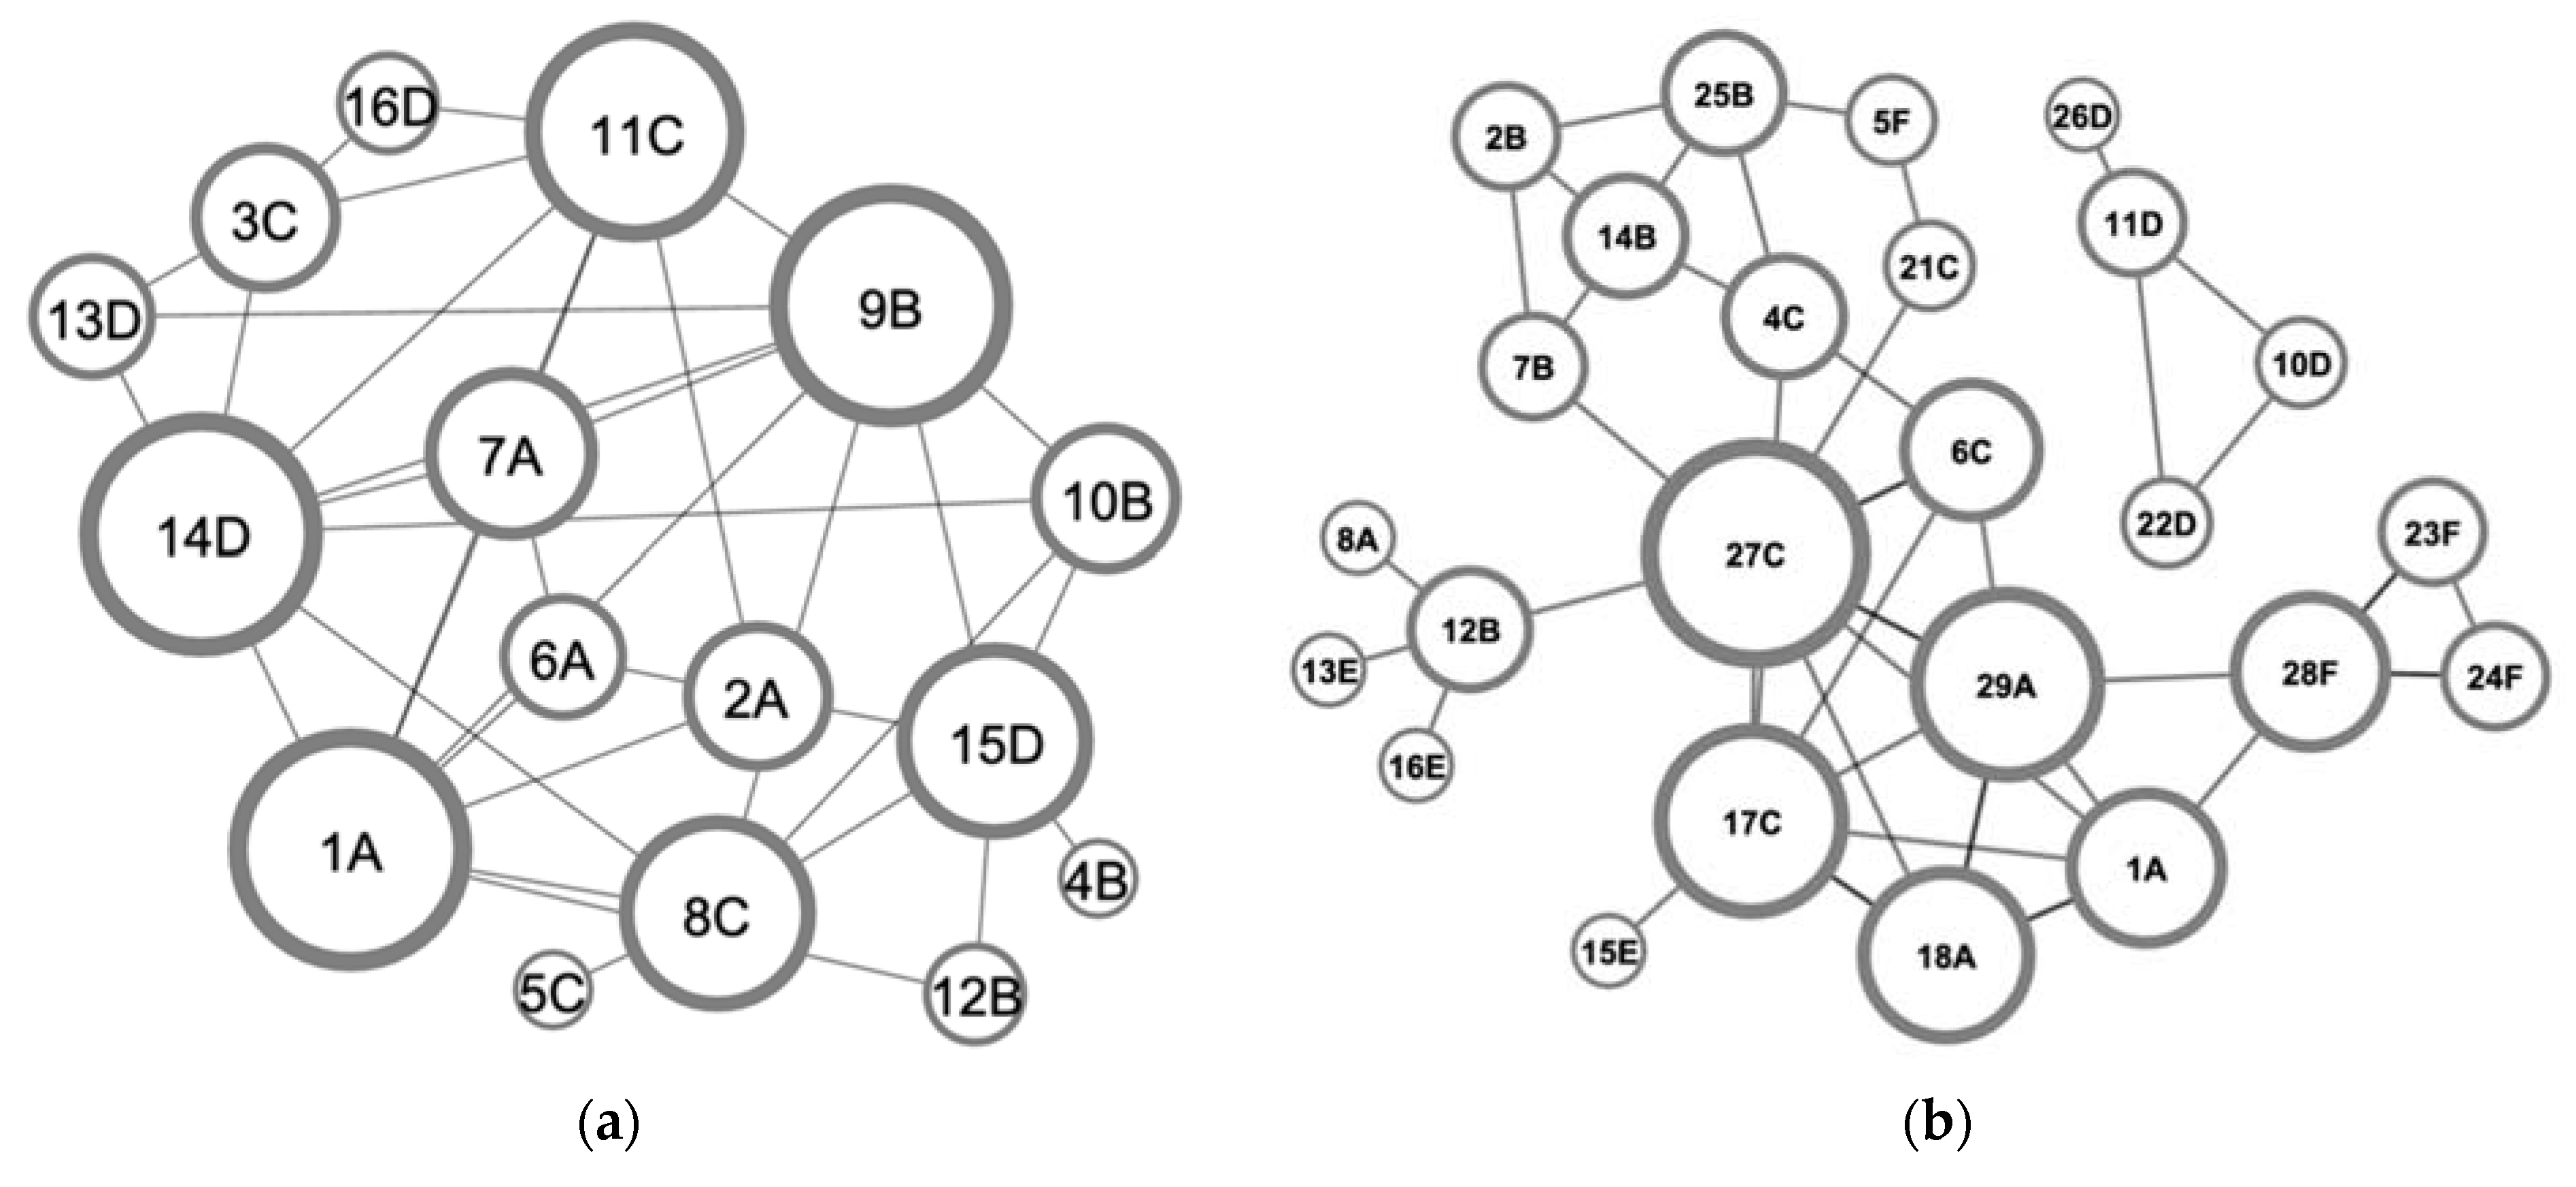
The SNA allows us to look at another important aspect, which is the diversity of the members of the group. In this study, the social networks of two courses that made up the working groups were analyzed, the fourth semester of the professor and the ninth semester by affinity and kept them fixed during the semester. The resulting graphs allow us to appreciate the trust and consultation networks of the fourth semester and ninth semester, as shown in
Figure 5 and
Figure 6, highlighting the groups formed by letters on the social network diagram (Group A, Group B, Group C, Group D, Group E, and Group F).
The fourth semester diagrams show a certain diversity, from the point of view of the social network, among the members that make up the workgroups that were chosen by the teacher. However, many of the members of the groups belong to trust or consulting cliques that existed before the professor’s intervention.
It is evident in the ninth semester diagrams that the members of the groups were trust associated and hooked up central consulting people with a high average degree. There are closed cliques based on triads that attach to a member of another subgroup; this is especially noticeable in consulting networks. It is also visible that few groups formed by affinity come from trust networks. This means that when affinity selection is allowed, it is not always out of friendship or trust, but it may be for the convenience of integrating members with a useful quality for the performance of the group.
In either case, the recommended diversity for the GW has not been achieved due to group conformation mistakes. Affinity association is the most popular among students, but it produces exclusive groups that selectively incorporate some students from other social groups and generate isolated individuals who associate out of necessity rather than affinity. In semester nine, where groups 2, 7, 14, and 25 incorporate student 12 that belongs to another trust clique, students 13 and 16 are forced to form another group, not out of affinity but out of necessity, with node 15.
Additionally, in the fourth and ninth semesters, a statistical analysis was applied to determine if there is any significant difference between the medians of the GW scores of these two courses, aiming to find a difference in performance due to group selection. Each course has a different number of students: 16 in the fourth semester and 29 in the ninth semester, so the Kruskal Wallis test was applied, which does not require equal sample sizes. The result [χ2 (1, N = 29) = 28.94, p = 0.0001] supports the idea that there is a significant difference between the scores of the two groups studied, given that the mean of the fourth semester is greater and variability is lower [Mean (M) = 7.55, Standard Deviation (SD) = 0.58] than the media of the ninth semester whose variability is higher [M = 5.47, SD = 1.10].
4.3. Social Networks and Performance
The results of the correlation analysis between the individual metrics of the course members and their GW and semester grades are presented ahead. No significant correlations were found between the metrics of the three social networks and the scores obtained by the second-semester students. However, a moderate but significant correlation was found between the semester grades and those of the GW, [ρ (30) = 0.57, p = 0.0025].
Spearman’s test for the fourth semester showed a significant correlation between their semester grades and those of the GW, [ρ (14) = 0.94,
p <0.0001]. The test also yielded other meaningful correlations between the grades, the clustering coefficient, and the modularity coefficient of its members, as shown in
Table 5.
The members of the fourth semester consulting and trust networks with high modularity present low grades. Membership in modules with dense connections, but with sparse connections between modules, seems to be negative for student performance.
The clustering coefficient is also associated to the poor performance of such individuals. Network members who are closest to forming closed triads with their general communication network neighbors have lower grades. The presence of closed and exclusive groups within the course hinders communication and dissemination of knowledge among course members, despite the implementation of the GW. In addition, in the ninth semester, an important correlation was found between their semester grades and those of their GW, [ρ (25) = 0.81,
p = 0.0001]. The other meaningful correlations are detailed in
Table 6.
In the ninth semester, the fact that a student belongs to a module that is not well connected to other modules in the consultation network is negative for their GW grades. However, the fact that an individual has a high number of connections in the general interaction and trust networks is directly related to a better performance in both semesters and GW. This highlights the importance of relationships between group members as a determinant of better performance [
33]. Finally, in the tenth semester, a relevant correlation was also found between their semester grades and those of their GW, [ρ (16) = 0.77,
p = 0.0002]. No correlations were found between the trust network metrics with the students’ grades. That was expected since students with the greatest dispersion in the trust network would not generate enough commitment for the GW [
36]. The other meaningful correlations found are detailed in
Table 7.
Moderate correlations with high significance indicate that there is a direct relationship between network members who are forming closed triads in the general interaction and problem consulting network with achieving better grades. A better relationship between the students of the course impacts their individual performance and not the GW performance [
49].
5. Discussion
The selection of the teacher-created groups with some diversity in terms of social relations may be appropriate when the variety of points of view are necessary for learning. For example, in semester four, the teacher’s decision to form the work group B made the trust group of nodes 9, 10, and 12 incorporate isolated node 4, who is closer to consult node 15 when it comes to working. This happens even when there is no significant diversity in the conformation of the groups from the point of view of the social relations of the two courses described by the social network diagrams. In this case, the SNA graphs allowed us to detect the characteristics resulting from the group formations that have been noticed by Guirao and Escobar [
14]. The instructor could use this information to create better balanced groups in terms of closeness diversity of its members [
22]. In addition, it can be thought that the formation of the groups by teacher selection produced a better performance of the groups than the association by affinity. In this case, the method of selecting the students that make up the groups would have a relationship with their performance, unlike what was found in Gunderson and More [
17] for engineering students. Instructors must consider that, beyond the way in which the GW members are selected, there is a social structure that affects such selection and GW performance. However, these results should be analyzed considering the differences inherent in each subject and the type of GW that is developed.
The results associated with clustering coefficient and grades shows a dissociation between the modules that the students form in the social network and the groups that are selected for the GW. Perhaps the groups or modules that are formed for the GW are not the most appropriate. An analysis of the triads and modules of the networks could provide a guide for the formation of working groups. There is a clear opportunity for improvement that the instructor can implement. The use of collaborative techniques, such as JigSaw for example, could help to widen communication and cooperation among all the students, breaking the triads and cliques. Another option is the creation of web communities or the use of virtual learning management systems, where students can strengthen their interaction, communication, collaboration, and coordination skills. In this study, interactions were evaluated through student perception surveys, as opposed to other experiences in which the effectiveness of massive processes in the universities’ web communities was evaluated [
50].
The results presented above make clear two facts that occur in the courses studied. The correlations between the semester grades and the GW emphasize the importance of good grades in the GW as they determine the semester performance. On the other hand, the fact that no relevant correlations appear between individual centrality in the consulting networks and the student’s qualifications means that those students who are frequently consulted by their classmates are not necessarily the best-rated. This implies that such students could be consulting the wrong people. It should be noted that low grades are not necessarily associated with a single factor, and they may have different causes, such as motivation, communication, learning facilities, proper guidance, and family stress, among other aspects [
51].
From a long-term perspective, engineering students and future professionals in the AEC industry will have to design, build, and operate sustainable projects now and in the future. The life cycle approach has been explored in depth from the economic and environmental perspective; however, the social perspective in construction has been less addressed [
10]. Within the social perspective, AEC professionals are expected to be able to interact effectively with different stakeholders of their projects (clients, users, work team, community, suppliers, subcontractors, among others); therefore, the development and practice of interaction skills that are promoted in group work are fundamental. This paper provides tools for teachers to identify students who are not developing their teamwork, communication, collaboration, and coordination skills; consequently, teachers could propose improvement actions for students who have dropped out and actions to enhance the skills of the advantaged students.
6. Conclusions
The use of SNA in the classrooms of a civil engineering degree allowed for identifying the characteristics of its social network structure in the aspects of trust, general interaction, and problem consulting. The last two present an important connectivity reflected in the average degree of their members and in the density of connections, which indicates that informal chat and the search for knowledge on course topics motivates communication among students of all the semesters of the degree. Conversely, trust networks appear to be made up of various components and disconnected cliques. This characteristic of the social relationship shows that people who do not trust each other are in GW.
It was also possible to see a pattern of the behavior of the networks according to the semesters of the degree. In the first semesters, there is a tendency for networks formed by various interconnected groups. Aspects that should be considered by teachers when working with collaborative techniques that seek the development of integration skills and social skills. However, this cannot be confirmed because of the cross-sectional nature of this study. To study the evolution of student behavior, it is recommended to perform a longitudinal study with a course from the first semester to the tenth semester.
A relationship was established between the social characteristics of individuals in the networks with their educational performance expressed as grades. The existence of closely connected groups and triads within the networks is related to low grades in the first semesters of the degree. While the clustering and the degree in the networks of trust, general communication, and consultations in the last semesters are related to a better performance of the students, perhaps driven by the selection of their contacts that is evident in the number of components of the networks.
The SNA was also useful to identify the diversity of the members in the formation of the collaborative methodologies GW. It was established that in the studied courses, neither the selection made by the teacher nor the selection by affinity achieves an important social diversity in the formation of the groups. The results of this application of SNA in a civil engineering career show its usefulness in diagnosing the composition of three main social networks: general interaction, trust, and consultation. These should serve as an input for a better configuration of the GW when considering the pre-existing relationships between the students. In this way, segregation can be reduced by preventing certain students from always being in the same workgroups, which reduces the possibility of spreading knowledge and new ideas.
The correlation analysis between the students’ grades and their social network metrics allowed us to know if the GW methodology is effectively producing any effect on student performance. A lack of relationship would be an indicator of deficiencies in the application of the GW that should be corrected in a timely manner. There are limitations of this research, the main one being the small sample size and the fact that it only constitutes a snapshot of the social networks studied, as they are in constant evolution. In addition, the free will to participate is assumed as a source of reliable information from social networks and there is always the risk of bias due to personal perceptions.
The results of the diagnosis established in this paper remain to be applied in the conformation of GW as well as the measurement of its impact on the students’ qualifications and on the development of other non-technical skills such as leadership and communication. The structure patterns of the social networks of trust in the different semesters that tend to a greater segregation as the students progresses in the career, is an issue that remains to be investigated. Additionally, another line of future research is to apply different strategies to create work groups and evaluate their performances. It would be interesting to include in the evaluation other variables of interest, such as attitudinal variables, students’ previous performances, context variables, among others. Finally, how the skills acquired by civil engineers in GW are related to the development of sustainable projects needs future research.


