
Determinants of Internationalization as Levers for Sustainability: A Study of the Portuguese Pharmaceutical Sector


Abstract
1. Introduction
2. Background
2.1. Pharmaceutical Industry
2.2. The Internationalization of Pharmaceutical Companies
2.3. The Portuguese Pharmaceutical Industry
3. Theoretical Framework
3.1. Determinants of Pharmaceutical Industry Internationalization
3.1.1. Internationalization Strategic Orientation
3.1.2. Competitive Advantages
3.1.3. Barriers in the Process of Internationalization
3.1.4. Entry Mode Selection
3.1.5. The Role of R&D
3.1.6. Internationalization Performance
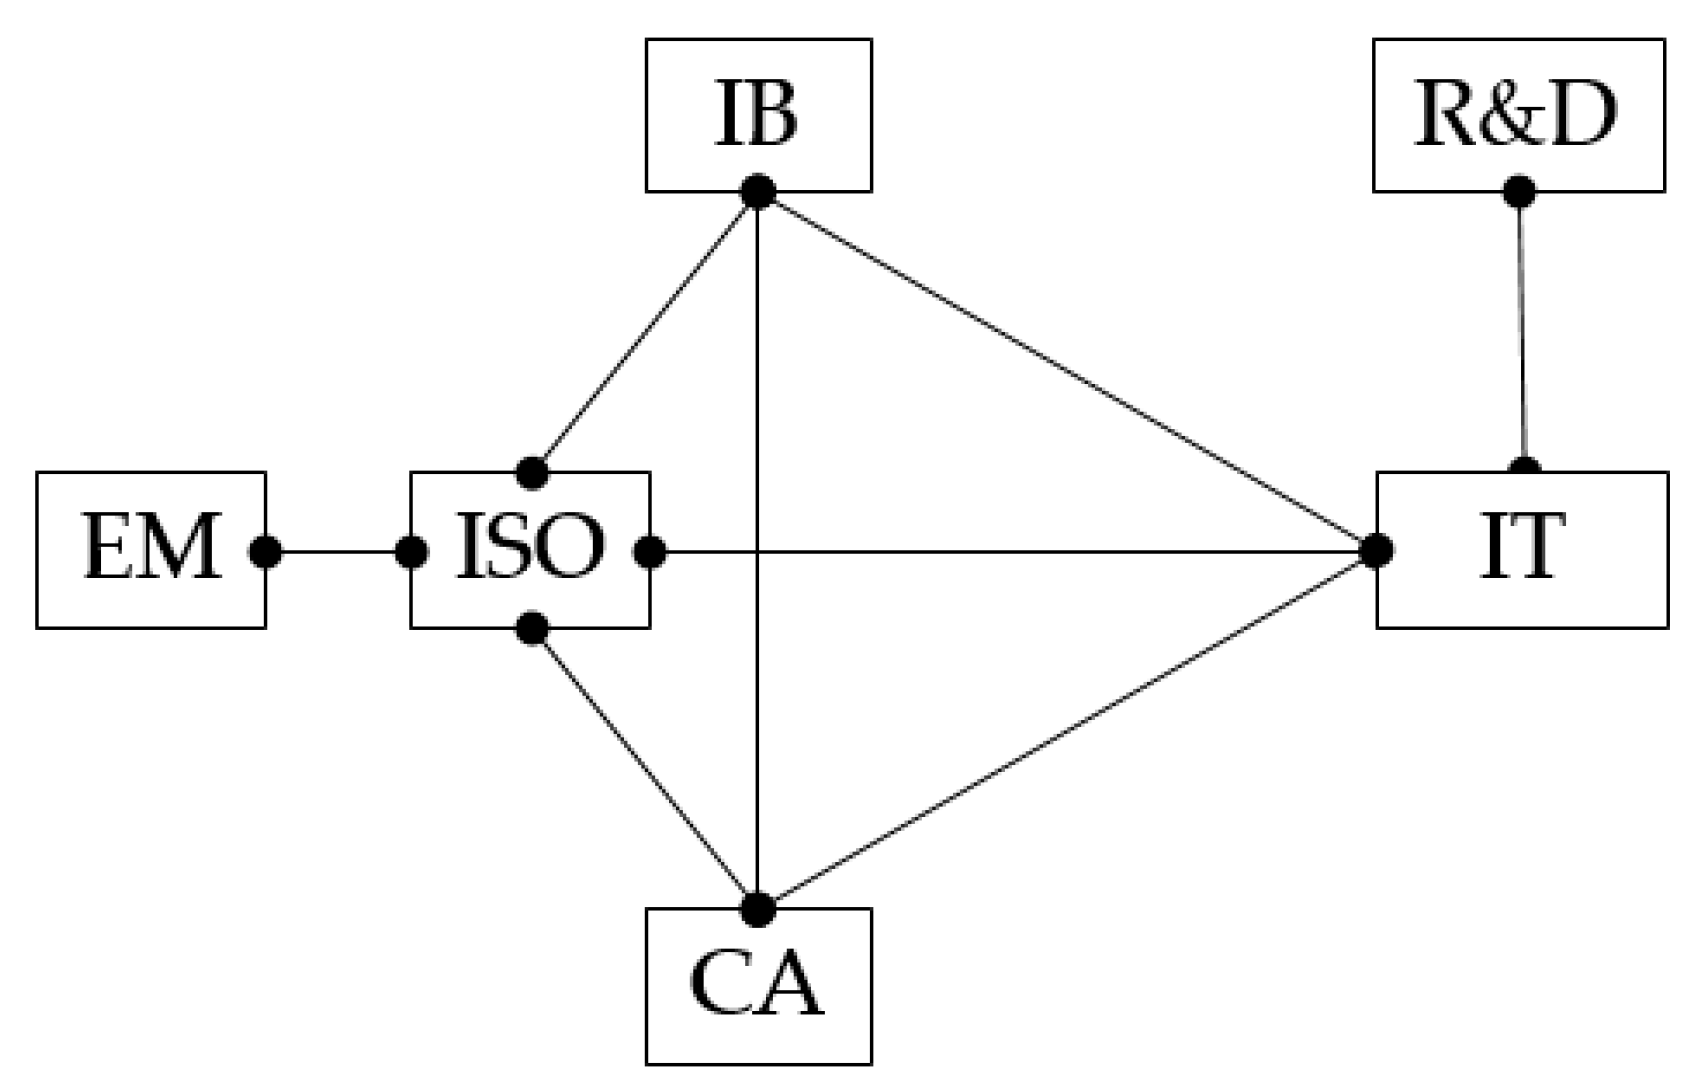
3.1.7. Research Framework
4. Methodology
4.1. Methodological Options
4.2. Questionnaire and Scales
4.3. Sampling Process
5. Findings
5.1. Descriptive Analysis
5.2. Hypotheses Confirmation
5.2.1. International Strategic Orientation
5.2.2. Competitive Advantages
5.2.3. Internationalization Barriers
5.2.4. Entry Mode Selection
5.2.5. The Role of R&D
6. Discussion
7. Conclusions, Limitations, and Future Directions
Author Contributions
Funding
Acknowledgments
Conflicts of Interest
Appendix A

| Reference | Study Type | Object of Study | Internationalization Theory | Sample (Companies) | Internationalization Determinants |
|---|---|---|---|---|---|
| Fina and Rugman (1996) [12] | Empirical | Internationalization Strategies | Uppsala | 1 | EM, IB |
| Buckley and Chapman (1997) [11] | Empirical | Internationalization Strategies | Uppsala | 10 | ISO |
| Javalgi and Wright (2003) [13] | Conceptual | Entry Mode | EM, IB, ISO | ||
| Chittoor and Sougata (2007) [14] | Empirical | Internationalization Strategies | Cluster Analysis | 40 | CA |
| Kuntluru et al. (2012) [15] | Empirical | Internationalization Strategies | Life Cicle | 103 | EM |
| Wrona and Trapczynski (2012) [7] | Empirical | Internationalization Strategies | OLI | 5 | CA, EM, IB |
| Chitour (2013) [16] | Conceptual | Entry Mode | EM, IB | ||
| Mowla et al. (2014) [17] | Empirical | Internationalization Strategies | OLI | 1 | EM |
| Campins (2015) [18] | Empirical | Internationalization Strategies | Uppsala Resources and Capacities | 2 | EM |
| Barbosa et al. (2016) [19] | Empirical | Internationalization Strategies | Resources and Capacities | 163 | IB |
| Diaz et al. (2017) [20] | Empirical | Internationalization Strategies | 1 | CA | |
| Pereira and Gomes (2017) [21] | Empirical | Internationalization Strategies | OLI Uppsala | 4 | EM |
| Rentala et al. (2017) [22] | Empirical | Export performance | 23 | CA | |
| Teramae et al. (2020) [23] | Empirical | Internationalization Strategies | 30 | ISO |
Appendix B
| Variable | Dimension | Items | Comments | Scale |
|---|---|---|---|---|
| Internationalization Strategic Orientation (ISO) [43,59] | 1 | Do managers have an effective “international mindset” or do they replicate the “local strategy” on foreign markets. 1: Focus on local market; 2: Focus on foreign markets. * | Nominal, two point | |
| Entry Mode (EM) [61] | 1 | Strategies for penetrating foreign markets. 1: no direct financial investment (export and licensing); 2: direct financial investment (Joint ventures, direct investment) * | Nominal, two point | |
| Competitive Advantages (CA) [48] | Cost (CCA) | 2 | Capture the different competitive advantages and their relevance for international activity. 1: Fully disagree;…; 4: Neither disagree or agree;...; 7: Fully Agree * | Ordinal, seven-point Likert |
| Service (SCA) | 5 | |||
| Product (PCA) | 3 | |||
| Internationalization Barriers (IB) [51] | Internal (IIB) | 6 | Captures the main barriers for internationalization and whether these are internal or external to the company. 1: Fully disagree;…; 4: Neither disagree or agree;...; 7: Fully Agree * | Ordinal, seven-point Likert |
| External (EIB) | 6 | |||
| Years of International Activity [46,48] | 1 | 1: <5 years; 2: 5–10 years; 3: 11–15 years; 4: 16–20 years; 5: 21–25 years; 6: 26–30 years; 7: >30 years | Ordinal, seven point | |
| Countries with Intern. Activity [46,48] | 1 | 1: No int. activity; 2: <10 countries; 3: 10–20 countries; 4: 21–30 countries; 5: 31–40 countries; 6: 41–50 countries; 7: >50 countries | Ordinal, seven point | |
| Yearly Turnover [61] | 1 | 1: <25 M€; 2: 26–50 M€; 3: 51–75 M€; 4: 76–100 M€; 5: 101–150 M€; 6: 151–200 M€; 7: >200 M€ | Ordinal, seven point | |
| % International business turnover [46,48] | 1 | 1: <15%; 2: 15–30%; 3: 31–45%; 4: 46–60%; 5: 61–75%; 6: 76–90%; 7: >90% | Ordinal, seven point | |
| Total number of Employees [61] | 1 | 1: <50; 2: 51–100; 3: 101–200; 4: 201–300; 5: 301–400; 6: 401–500; 7: >500 | Ordinal, seven point | |
| % International business employees [46,48] | 1 | 1: <15%; 2: 15–30%; 3: 31–45%; 4: 46–60%; 5: 61–75%; 6: 76–90%; 7: >90% | Ordinal, seven point | |
| R&D Investment [14] | 1 | % Total turnover attributed to R&D investment. 1: <6%; 2: 6–8%; 3: 9–11%; 4: 12–14%; 5: 15–17%; 6: 18–20%; 7: >20% | Ordinal, seven point | |
| Main International Activity | 1 | 1: innovative products; 2: commodities/others | Nominal, two point |
Appendix C. Variable’s Questionnaire
Appendix D
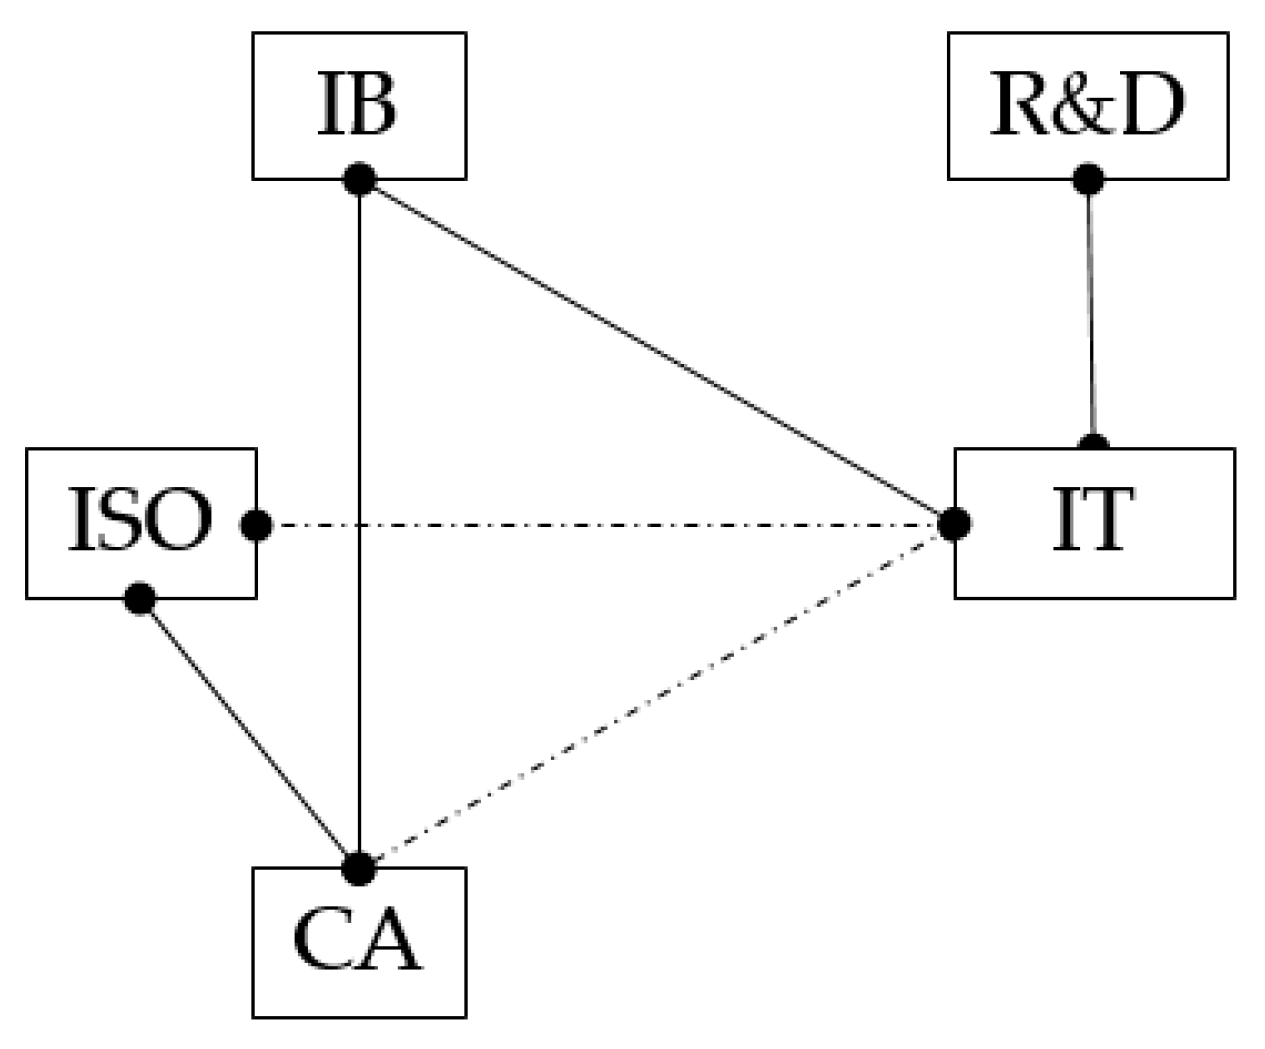
| Hypothesis | Test | Result | Hypothesis Validation |
|---|---|---|---|
| H1a. Different ISOs have different levels of turnover | Mann–Whitney | U = 0.500 p = 0.042 | Yes |
| H1b. Different ISOs have different levels of international business’ turnover | Mann–Whitney | U = 1.500 p = 0.086 | No |
| H2a. Companies with more CA are associated with a bigger turnover | Spearman’s Correlation | rs = 0.313 p > 0.05 | No |
| H2b. Companies with more CA are associated with bigger international business’ turnover | Spearman’s Correlation | rs = 0.693 p < 0.05 | Yes |
| H2c. Companies with more CA are associated with an ISO focused on foreign markets | Mann–Whitney | U = 1.000 p = 0.047 | Yes |
| H3a.Companies with more IB are expected to have less international business’ turnover | Spearman’s Correlation | rs = −0.717 p < 0.05 | Yes |
| H3b.Companies with more IB are expected to have less CA | Spearman’s Correlation | rs = −0.785 p < 0.01 | Yes |
| H3c.Companies with less IB are expected to have ISO’s focused on foreign markets | Mann–Whitney | U = 4.000 p = 0.273 | No |
| H4. IEM corresponds to ISO’s focused on foreign markets | Mann–Whitney | U = 6.000 p = 0.453 | No |
| H5.Large R&D investment is associated with bigger international business’ turnover | Spearman’s Correlation | rs = 0.650 p < 0.05 | Yes |
References
- EFPIA. The Pharmaceutical Industry in Figures. The European Federation of Pharmaceutical Industries and Associations. Available online: www.efpia.eu (accessed on 20 May 2021).
- APIFARMA. The Pharmaceutical Industry in Portugal, Knowing How to Invest, Knowing How to Innovate, 75 Years Old; Apifarma: Lisbon, Portugal, 2014. [Google Scholar]
- Barney, J.; Wright, M.; Ketchen, D. The resource-based view of the firm: Ten years after 1991. J. Manag. 2001, 27, 625–641. [Google Scholar] [CrossRef]
- Hollensen, S. Global Marketing: A Decision-Oriented Approach, 5th ed.; Pearson Education: Harlow, UK, 2011. [Google Scholar]
- Karampli, E.; Souliotis, K.; Polyzos, N.; Kyriopoulos, J.; Chatzaki, E. Pharmaceutical innovation: Impact on expenditure and outcomes and subsequent challenges for pharmaceutical policy, with a special reference to Greece. Hippokratia 2014, 18, 100–106. [Google Scholar]
- Bartlett, C.; Ghoshal, S. Going global: Lessons from late movers. Harv. Bus. Rev. 2000, 78, 132–145. [Google Scholar]
- Wrona, T.; Trąpczyński, P. Re-explaining international entry modes: Interaction and moderating effects on entry modes of pharmaceutical companies into transition economies. Eur. Manag. J. 2012, 30, 295–315. [Google Scholar] [CrossRef]
- DiMasi, J.; Grabowski, H.; Hansen, R. Innovation in the pharmaceutical industry: New estimates of R&D costs. J. Health Econ. 2016, 47, 20–33. [Google Scholar] [PubMed]
- International Screening Year 2020. IQVIA. Available online: https://www.iqvia.com/ (accessed on 20 May 2021).
- Penrose, E. The Theory of the Growth of the Firm; Blackwell: Oxford, UK, 1959. [Google Scholar]
- Buckley, P.; Chapman, M. A longitudinal study of the internationalization process in a small sample of pharmaceutical and scientific instrument companies. J. Mark. Manag. 1997, 13, 43–55. [Google Scholar] [CrossRef]
- Fina, E.; Rugman, A. A test of internalization theory and internationalization theory: The Upjohn company. Manag. Int. Rev. 1996, 36, 199–213. [Google Scholar]
- Javalgi, R.; Wright, R. An international market entry model for pharmaceutical companies: A conceptual framework for strategic decisions. Int. J. Med. Mark. 2003, 3, 274–286. [Google Scholar] [CrossRef]
- Chittoor, R.; Sougata, R. Internationalization paths of Indian pharmaceutical firms: A strategic group analysis. J. Int. Man. 2007, 13, 338–355. [Google Scholar] [CrossRef]
- Kuntluru, S.; Muppani, V.; Khan, A. Foreign direct investment and export performance of pharmaceutical firms in India: An empirical approach. Int. J. Econ. Fin. 2012, 4, 216–226. [Google Scholar] [CrossRef]
- Chitour, H. Big pharma in China: The driving forces behind their success: A qualitative analysis. Chin. Stud. 2013, 2, 169–177. [Google Scholar] [CrossRef]
- Mowla, M.; Hoque, N.; Mamun, A.; Uddin, M. Entry mode selection, location choice and the sequence of internationalization: A case study on Ranbaxy laboratories Ltd. Asian Soc. Sc. 2014, 10, 145–154. [Google Scholar]
- Campins, M. Modalities for the internationalization of Argentine pharmaceutical companies from a historical perspective: The Cases of Bagó and Sidus. Apuntes 2015, 42, 95–136. [Google Scholar] [CrossRef]
- Barbosa, D.; Ayala, A.; Sandoval, A. The Colombian pharmaceutical industry: Factors affecting export. Eur. J. Manag. Bus. Econ. 2016, 25, 39–46. [Google Scholar] [CrossRef]
- Díaz, H.; Lenis, J.; Rizo, A. Internationalization process in the pharmaceutical sector: The case of the Colombian company Tecnoquímicas. Est. Ger. 2017, 33, 421–437. [Google Scholar] [CrossRef]
- Pereira, A.; Gomes, J. A study of the internationalization strategies of the Brazilian pharmaceutical industries. Account. Org. Mag. 2017, 11, 68–79. [Google Scholar]
- Rentala, S.; Anand, B.; Shaban, M. Determinants of export performance: An empirical analysis of the Indian pharmaceutical and automobile industries. In International Business Strategy; Palgrave Macmillan: London, UK, 2017; pp. 241–257. [Google Scholar]
- Teramae, F.; Makino, T.; Lim, Y.; Sengoku, S.; Kodama, K. International Strategy for Sustainable Growth in Multinational Pharmaceutical Companies. Sustainability 2020, 12, 867. [Google Scholar] [CrossRef]
- Barney, J. Firm resources and sustained competitive advantage. J. Manag. 1991, 17, 99–120. [Google Scholar] [CrossRef]
- Johanson, J.; Vahlne, J.E. The internationalization process of the firm: A model of knowledge development and increasing foreign markets commitments. J. Int. Bus. 1977, 8, 23–32. [Google Scholar] [CrossRef]
- Dunning, J. The eclectic (OLI) paradigm of international production: Past, present and future. Int. J. Econ. Bus. 2001, 8, 173–190. [Google Scholar] [CrossRef]
- Ribau, C.; Moreira, A.; Raposo, M. Internationalization of the firm theories: A schematic synthesis. Int. J. Bus. Glob. 2015, 15, 528–554. [Google Scholar] [CrossRef]
- AICEP. Flash Pharmaceutical Industry. Available online: www.portugalglobal.pt/ (accessed on 20 December 2020).
- APIFARMA, Portuguese Pharmaceutical Data. Available online: https://www.apifarma.pt (accessed on 20 August 2019).
- INE. Portuguese Statistic Indicators. Available online: www.ine.pt (accessed on 20 August 2019).
- Pordata. Portuguese Economic Indicators. Available online: www.pordata.pt (accessed on 10 September 2019).
- Kor, Y.; Mahoney, J.; Siemsen, E.; Tan, D. Penrose’s the theory of the growth of the firm: An exemplar of engaged scholarship. Prod. Oper. Manag. 2016, 25, 1727–1744. [Google Scholar] [CrossRef]
- Morgan, N.; Kaleka, A.; Katsikeas, C. Antecedents of export venture performance: A theoretical model and empirical assessment. J. Mark. 2004, 68, 90–108. [Google Scholar] [CrossRef]
- Williamson, O. Markets and Hierarchies: Analysis and Antitrust Implications. A study in the Economics of Internal Organization; The Free Press: New York, NY, USA, 1975. [Google Scholar]
- Andersen, P.; Ahmad, S.; Chan, W. Revisiting the theories of internationalization and foreign market entry mode: A critical review. Int. J. Bus. Comm. 2014, 4, 37–86. [Google Scholar]
- Johanson, J.; Mattsson, L. Internationalization in industrial systems: A network approach. In Strategies in Global Competition; Hood, N., Vahlne, J.E., Eds.; Croom Helm: New York, NY, USA, 1988. [Google Scholar]
- Cunningham, M.; Culligan, K. Competitiveness through networks of relationships in information technology product markets. In Proceedings of the 4th IMP International Conference, Manchester, UK, 7–9 September 1988; pp. 156–180. [Google Scholar]
- Chen, J.; Sousa, C.; Xinming, H. The determinants of export performance: A review of the literature 2006–2014. Int. Mar. Rev. 2016, 33, 626–670. [Google Scholar] [CrossRef]
- Cavusgil, S.; Bilkey, W.; Tesar, G. A note on the export behavior of firms: Exporter profiles. J. Int. Bus. Stud. 1979, 10, 91–104. [Google Scholar] [CrossRef]
- Cavusgil, S.; Nevin, J. Internal determinants of export marketing behavior: An empirical investigation. J. Mark. Res. 1981, 18, 114–119. [Google Scholar] [CrossRef]
- Wind, Y.; Douglas, S.; Perlmutter, H. Guidelines for developing international marketing strategies. J. Mark. 1973, 37, 14–23. [Google Scholar] [CrossRef]
- Perlmutter, H. The tortuous evolution of the multinational corporation. Prac. Man. 1969, 17, 13–18. [Google Scholar]
- Shoham, A. The EPRG Framework: Does it Affect Managerial Perceptions of Export Success? In Global Perspectives in Marketing for the 21st Century. Developments in Marketing Science, Proceedings of the Academy of Marketing Science, Qawra, Malta, 23 June 1999; Springer: Cham, Germany, 2015. [Google Scholar]
- Johansson, J. Global Marketing: Foreign Entry, Local Marketing and Global Management, 5th ed.; McGraw Hill: New York, NY, USA, 2008. [Google Scholar]
- Porter, M. Competitive Advantage: Creating and Sustaining Superior Performance; Free Press: New York, NY, USA, 1985. [Google Scholar]
- Ferreira, M.; Simões, L. The interrelationships between resources, capabilities, export competitive advantages and export performance. Int. J. Exp. Mark. 2016, 1, 142–165. [Google Scholar] [CrossRef]
- Freire, A. Strategy, Success in Portugal; Verbo: Lisbon, Portugal, 2003. [Google Scholar]
- Kaleka, A.; Morgan, N. Which competitive advantage? Competitive advantage: Market performance relationships in international markets. J. Int. Mar. 2017, 25, 25–49. [Google Scholar] [CrossRef]
- Kahiya, E. Five decades of research on export barriers: Review and future directions. Int. Bus. Rev. 2018, 27, 1172–1188. [Google Scholar] [CrossRef]
- Root, F. Entry Strategies for International Markets; Lexington Books: New York, NY, USA, 1994. [Google Scholar]
- Anil, N.; Shoham, A.; Pfajfar, G. How export barriers, motives, and advantages impact export performance in developing countries. Int. J. Exp. Mark. 2016, 1, 117–141. [Google Scholar] [CrossRef]
- Safari, A.; Saleh, A. Key determinants of SMEs’ export performance: A resource-based view and contingency theory approach using potential mediators. J. Bus. Ind. Mar. 2020, 35, 635–654. [Google Scholar] [CrossRef]
- Ulrich, A.; Boyd, B.; Hollensen, S. Financial Performance of Entry Mode Decisions: Effects of Control in an Internationalization Context. Int. J. Bus. Man. 2012, 24, 12–28. [Google Scholar] [CrossRef]
- Teramae, F.; Makino, T.; Lim, Y.; Sengoku, S.; Kodama, K. Impact of Research and Development Strategy on Sustainable Growth in Multinational Pharmaceutical Companies. Sustainability 2020, 12, 5358. [Google Scholar] [CrossRef]
- Bryman, A.; Cramer, D. Data Analysis in Social Sciences: Introduction to Techniques Using SPSS for Windows, 3rd ed.; Celta Editores: Oeiras, Portugal, 2003. [Google Scholar]
- Quivy, R.; Campenhoudt, L. Research Manual in Social Sciences, 4th ed.; Gradiva: Lisbon, Portugal, 2005. [Google Scholar]
- Iberinform. Available online: www.iberinform.pt (accessed on 20 November 2019).
- Morgan, C. Use of proper statistic technics for research studies with small samples. Am. J. Physiol. Lung Cell Mol. Physiol. 2017, 313, 873–877. [Google Scholar] [CrossRef] [PubMed]
- Shoham, A.; Rose, G.; Albaum, G. Export motives, psychological distance and the EPRG framework. J. Glob. Mark. 1995, 8, 9–37. [Google Scholar] [CrossRef]
- Daszkiewicz, N.; Wach, K. Motives for going international and entry modes of family Firms in Poland. J. Int. Man. 2014, 6, 5–18. [Google Scholar] [CrossRef]
- Oliveira, J.; Yazdani, N.; Cadogan, J.; Hodgkinson, I.; Tsougkou, E.; Jean, R.; Story, V.; Boso, N. The empirical link between export entry mode diversity and export performance: A contingency-and institutional-based examination. J. Bus. Res. 2018, 88, 505–512. [Google Scholar] [CrossRef]
- Zou, S.; Fang, E.; Zhao, S. The effect of export marketing capabilities on export performance: An investigation of Chinese exporters. J. Int. Mark. 2003, 11, 32–55. [Google Scholar] [CrossRef]
- Field, A. Discovering Statistics using SPSS; Artmed: Porto Alegre, Brazil, 2009. [Google Scholar]
- Pestana, M.; Gageiro, J. Data Analysis for Social Sciences: The Complementarity of SPSS; Syllable: Lisbon, Portugal, 2005. [Google Scholar]
- Google Forms. Available online: www.forms.google.com (accessed on 30 March 2020).
- Krejcie, M.; Morgan, D. Determining sample size for research activities. Edu. Psy. Meas. 1970, 30, 607–610. [Google Scholar] [CrossRef]
- Kruskal, W.; Mosteller, F. Representative sampling I: Non-scientific literature. Int. Stat. Rev. 1979, 47, 13–24. [Google Scholar] [CrossRef]
- Reis, J.; Forte, R. The impact of industry characteristics on firms’ export intensity. Int. Area Stud. Rev. 2016, 19, 266–281. [Google Scholar] [CrossRef]
- Almeida, A.; Oliveira, S. Estimated Health Sector Turnover in Portugal; Porto Business School: Porto, Portugal, 2014. [Google Scholar]


| 2018 | 2019 | 2020 | ||||
|---|---|---|---|---|---|---|
| Sales | M.S.% | Sales | M.S.% | Sales | M.S.% | |
| North America | 433,262 | 44.7% | 457,197 | 44.4% | 478,676 | 45.3% |
| Europe | 215,882 | 22.3% | 229,876 | 22.3% | 240,379 | 22.7% |
| China | 105,859 | 10.9% | 115,607 | 11.2% | 103,408 | 9.8% |
| Japan | 72,429 | 7.5% | 73,973 | 7.2% | 72,732 | 6.9% |
| Latin America | 36,140 | 3.7% | 39,130 | 3.8% | 44,001 | 4.2% |
| Portugal | 3670 | 0.4% | 3860 | 0.4% | 3945 | 0.4% |
| Rest of World | 102,262 | 10.5% | 110,555 | 10.7% | 114,582 | 10.8% |
| World | 969,504 | 100% | 1,030,199 | 100% | 1,057,723 | 100% |
| Mean Yearly Value% | 2008–2010 | 2011–2013 | 2014–2016 | |
|---|---|---|---|---|
| Export Intensity (1) | PT | 14.0 | 17.9 | 19.5 |
| PPI | 42.8 | 62.5 | 85.7 | |
| Coverage rate of imports by exports (2) | PT | 70.9 | 87.8 | 90.3 |
| PPI | 22.9 | 31.6 | 40.6 | |
| Import penetration rate on the domestic market (3) | PT | 18.7 | 19.9 | 21.1 |
| PPI | 76.5 | 84.1 | 93.7 | |
| Variable/Dimension | No. Items | Mean | Median | SD |
|---|---|---|---|---|
| International Strategical Orientation (ISO) | 1 | 1.80 | 2.00 | 0.42 |
| Entry Mode (EM) | 1 | 1.20 | 1.00 | 0.42 |
| Competitive Advantages (CA) | 10 | 4.40 | 4.00 | 0.84 |
| Cost Competitive Advantages (CCA) | 2 | 4.20 | 4.00 | 0.92 |
| Service Competitive Advantages (SCA) | 5 | 4.50 | 4.50 | 0.85 |
| Product Competitive Advantages (PCA) | 3 | 3.90 | 4.00 | 0.74 |
| Internationalization Barriers (IB) | 12 | 4.40 | 4.50 | 0.97 |
| Internal Internationalization Barriers (IIB) | 6 | 4.10 | 4.00 | 1.10 |
| External Internationalization Barriers (EIB) | 6 | 4.80 | 5.00 | 0.79 |
| Years of International Activity | 1 | 5.00 | 4.50 | 1.25 |
| Countries with International Activity | 1 | 6.20 | 7.00 | 1.40 |
| Yearly Turnover | 1 | 5.00 | 5.00 | 2.00 |
| % Turnover from international business | 1 | 4.60 | 4.50 | 1.90 |
| % Turnover to R&D | 1 | 4.20 | 4.00 | 2.39 |
| Total number of Employees | 1 | 6.20 | 7.00 | 1.03 |
| % Employees to international business | 1 | 2.20 | 1.50 | 1.93 |
| Main International Activity | 1 | 1.80 | 2.00 | 0.42 |
Publisher’s Note: MDPI stays neutral with regard to jurisdictional claims in published maps and institutional affiliations. |
© 2021 by the authors. Licensee MDPI, Basel, Switzerland. This article is an open access article distributed under the terms and conditions of the Creative Commons Attribution (CC BY) license (https://creativecommons.org/licenses/by/4.0/).
Share and Cite
Vieira, J.; Frade, R.; Ascenso, R.; Martinho, F.; Martinho, D. Determinants of Internationalization as Levers for Sustainability: A Study of the Portuguese Pharmaceutical Sector. Sustainability 2021, 13, 9792. https://doi.org/10.3390/su13179792
Vieira J, Frade R, Ascenso R, Martinho F, Martinho D. Determinants of Internationalization as Levers for Sustainability: A Study of the Portuguese Pharmaceutical Sector. Sustainability. 2021; 13(17):9792. https://doi.org/10.3390/su13179792
Chicago/Turabian StyleVieira, Jorge, Rui Frade, Raquel Ascenso, Filipa Martinho, and Domingos Martinho. 2021. "Determinants of Internationalization as Levers for Sustainability: A Study of the Portuguese Pharmaceutical Sector" Sustainability 13, no. 17: 9792. https://doi.org/10.3390/su13179792
APA StyleVieira, J., Frade, R., Ascenso, R., Martinho, F., & Martinho, D. (2021). Determinants of Internationalization as Levers for Sustainability: A Study of the Portuguese Pharmaceutical Sector. Sustainability, 13(17), 9792. https://doi.org/10.3390/su13179792