Abstract
Climate change has become a global concern, and the development of a green economy has attracted wide attention. Understanding the driving factors and growth potential of provincial-level carbon productivity is crucial for China’s green economic development in the new normal phase. In this study, the logarithmic mean Divisia index (LMDI) is adopted to systematically investigate the driving factors of provincial carbon productivity and explore the growth potential of provinces’ carbon productivity based on the clustering analysis. The results show that: (1) China’s provincial carbon productivity presents an increasing trend in 2001–2017, but the differences in carbon productivity among provinces are widening. (2) Economic activity and industrial structure are key to push up regional carbon productivity in China, while energy intensity is the main factor pulling it down. (3) The potential for carbon productivity improvement varies greatly among provinces in the four groups. Specifically, in groups 1 and 2, the developed provinces have little potential for improving carbon productivity, while the developing provinces in group 4 are just the opposite. These findings can enlighten policymakers that the development of a green economy should focus on optimizing and upgrading industrial structure and reducing energy intensity, and provincial heterogeneity must be considered when formulating green economic development policies.
1. Introduction
Global climate change has been rendered an indisputable fact, with its main driving force being the rapid increase in CO2 emissions that is caused by human activities. To meet the challenge of climate change, low-carbon sustainable development has become a common choice in the world. Both the micro-enterprises [1,2] and the macro-regions [3,4] actively explore sustainable development measures in the development process. A low-carbon economy is the fundamental strategic choice to deal with climate change under the framework of sustainable development. As the world’s largest CO2 emitter, the Chinese government has put forward the development strategy of a low-carbon economy and ecological civilization. The core of low-carbon development is to achieve the dual goals of economic growth and carbon emission reduction, which requires an increase in carbon productivity. Therefore, production and lifestyle based on carbon productivity is not only the key to promote low-carbon development but also an important way to achieve sustainable development. Carbon productivity, termed by Kaya and Yokobori [5], refers to the ratio of gross domestic product (GDP) to CO2 emissions of a country (region) over a certain period, thereby reflecting the economic benefits of CO2 emissions. Carbon productivity is an important indicator to measure the level of green and low-carbon development [6]. The McKinsey Global Institute pointed out that humans must raise carbon productivity 10-fold over the next three decades to keep atmospheric greenhouse gas concentrations below 500 ppm by 2050 [7].
China’s economic development has entered “the new normal phase” (a stage of economic development when the economic growth rate changes from high speed to medium-high speed and the economic structure is optimized constantly), which puts forward higher requirements for the green and low-carbon transformations of the economic system. China has proposed low-carbon development for a long time. Although there are some achievements, it is difficult to estimate which factors play a leading role in improving carbon productivity. Which factors are the main contributors to the improvement of carbon productivity? What is the potential of carbon productivity improvement in each province? It is helpful for policymakers to formulate effective policies.
Identifying carbon productivity drivers is critical for developing an effective strategy for increasing carbon productivity. Due to the unbalanced regional development in China, there are large differences in industrialization, urbanization, industrial structure, and economic development among provinces. At present, Beijing, Shanghai, and Tianjin have entered the post-industrialization stage, while most central and western provinces are still in the middle stage of industrialization. In 2017, the proportion of tertiary industry in Beijing and Shanghai was 80.6% and 70.5%, respectively, while in Xinjiang and Ningxia, it was less than 50%. Guangdong’s GDP accounted for more than 10% of the national GDP in 2017, while the GDP of Hainan, Xinjiang, and Ningxia accounted for only 2.27% of China’s GDP [8]. The carbon emission reduction policies implemented across various provinces are also different, such as the cap-and-trade scheme. The world’s first, largest, and most prominent cap-and-trade scheme is the EU Emissions Trading Scheme (EU ETS). Since its establishment in 2005, the EU ETS has had an important impact on carbon dioxide emissions, economic performance, and innovation in the European power sector and energy intensive industries [9]. Studies showed that EU ETS has not only been extremely effective in reducing industrial carbon emissions but also affected the financial performance of firms [10,11]. Like the EU, China has adopted a cap-and-trade model for its ETS pilot. In 2011, China prepared for the construction of carbon market and approved the pilot of carbon emission trading in seven provinces and cities, including Beijing, Tianjin, Shanghai, Chongqing, Hubei, Guangdong, and Shenzhen. In 2013, the Shenzhen carbon trading pilot was officially launched, and the remaining six regional pilot trading platforms were launched within one year. It was found that China’s carbon market trading has an impact on carbon emission reduction and economic output, but the impact is regional heterogeneity [12]. Therefore, provincial carbon productivity drivers need to account for regional divergences.
These studies decompose the driving factors of carbon productivity, which are typically conducted from the perspective of industry and region. At the industrial level, Zhang et al. (2017) [13] analyzed the driving factors of carbon productivity change in China’s construction industry during 2005–2016. Hu and Liu (2016) [14] found the promotion effects of technological innovation on the carbon productivity of the construction industry in Australia. Long et al. (2016) [15] investigated industrial carbon productivity driving factors in 30 provinces of China from 2005 to 2012 and indicated that industrial energy efficiency, the opening degree, technological progress, and the industrial scale structure have significantly positive effects on industrial carbon productivity. Additionally, Lu et al. (2014) [16] compared the driving factors of carbon productivity changes in eight major industries in China and revealed that the structure factors hindered the growth of China’s carbon productivity and carbon productivity growth mainly comes from the industrial production efficiency. At the regional level, Li and Wang (2019) [17] studied the impact of social and economic development on China’s carbon productivity. Du and Li (2019) [18] and Cheng et al. (2019) [19] selected several economies around the world to examine how green technological innovation influences carbon productivity. Long et al. (2020) [20] calculated the heterogeneous impact of foreign direct investment (FDI) on China’s carbon productivity and showed that local FDI has a positive impact on local carbon productivity while FDI in surrounding areas has a negative impact on it. Zhang et al. (2014) [21] found that the growth rate of carbon productivity is determined by variables such as technological progress, substitution effect between capital and energy, and substitution effect between labor and energy, and the effects of technical efficiency, random difference, scale efficiency, and energy structure are limited.
In terms of research methods, index decomposition analysis (IDA) is the most commonly used method for studying the driving factors of carbon-emission-related indicators. Although IDA contains many methods, the choice in the present is essentially between the refined Laspeyres index method and the logarithmic mean Divisia index (LMDI) method [22]. In other words, the basic Laspeyres and the simple average Divisia methods have almost been abandoned because of their low performance. The formulae for the refined Laspeyres method are very complex, especially when the number of factors exceeds three, which is often the case in environmental decomposition studies, and the formula for different numbers of factor cases is very different. By comparison, LMDI has the advantage of leaving no residuals, easing interpretation of factor effects, and having consistent decomposition formulae for different numbers of factors [23]. Therefore, in practical application, the LMDI method has more extensive application [24]. For example, Liao et al. (2019) [25] adopted the LMDI method to analyze the driving factors of provincial-level CO2 emissions from the power sector in China and found the change characteristics of each driving factor over time. Wen and Li (2020) [26] combined the LMDI method with the spectral clustering method to study industrial CO2 emissions driving factors in 30 provinces of China and showed the difference of impact mechanisms on CO2 emissions from the temporal and spatial angle. Cao et al. (2020) [3] used the LMDI method to examine the drivers of the growing environmental footprints in China’s food system and revealed the impact mechanism of food consumption on the environment.
Some studies have decomposed China’s carbon productivity from regional and industrial perspectives based on the LMDI method. For example, Chen et al. (2018) [27] studied factors that drive the change in electric carbon productivity using LMDI. Lu et al. (2015) [28] analyzed China’s carbon productivity driving factors using LMDI. These studies are valuable for understanding the driving factors of China’s carbon productivity, but none of them has explored the growth potential of carbon productivity on the basis of decomposition of influencing factors. However, the growth potential of carbon productivity is the key problem to be solved urgently for the Chinese government to decompose the carbon productivity target from top to bottom.
To fill the above gap, this study estimates the potential of carbon productivity improvement in China’s provinces from the perspective of convergence. This study not only clarifies the contributions of carbon productivity drivers but also explores the growth potential of carbon productivity in each province on the basis of decomposition and clustering. In this study, the provincial panel data of China from 2001 to 2017 were used to identify carbon productivity trends and driving factors between provinces, thereby intending to provide a basis for a region-oriented carbon productivity elevation strategy. First, carbon productivity in 30 provinces were calculated, and the LMDI was used to investigate the effect of drivers on regional carbon productivity. Second, the 30 provinces were clustered into four groups using the hierarchical clustering and K-means algorithm, according to carbon productivity features and driving mechanisms. Finally, provincial carbon productivity growth potentials were determined, and specific promotional strategies were put forward.
The rest of this study is organized as follows: Section 2 describes the carbon emission calculation method, LMDI decomposition model, K-means clustering, and the carbon productivity growth potential counting method that was used in this study as well as the corresponding data description. Section 3 presents the empirical results and discussion. Section 4 concludes the study and proposes corresponding implications.
2. Methods
2.1. Carbon Productivity Accounting
According to Kaya and Yokobori [5], carbon productivity is expressed as:
where CP is carbon productivity, Y is GDP, and C is CO2 emissions.
As CO2 emissions from fossil fuel combustion (i.e., energy-related emissions) account for more than 90% of the total CO2 emissions in China [29], this study focuses on energy-related CO2 emissions. This study involves both provincial and sectoral levels; thus, a bottom-up sector-based approach is established for calculating the energy-related CO2 emissions of a province. According to the Intergovernmental Panel on Climate Change (IPCC) guidelines, the formula for calculating provincial CO2 emissions is as follows:
where index k represents province, i represents sector, and j represents the type of fossil fuel. is the consumption of fossil fuel j in sector i in province k. is the low calorific value of fossil fuel j. is the carbon content of fossil fuel j. is the carbon oxidation rate of fossil fuel j. The accounting includes 30 provinces in China, which means that Tibet, Hong Kong, Macao, and Taiwan are not considered (due to the problems of inconsistent statistical caliber or missing data).
For sectoral division, the sector category in China’s energy balance sheet issued by the official is adopted, that is, agriculture, forestry, animal husbandry, and fishery; industry; construction; transportation, storage, and post; wholesale and retail trades, hotels, and catering services; other sectors, shown in Table 1.

Table 1.
Classification of sectors.
In terms of the types of fossil fuel, 21 types were chosen from 26 types in China’s energy statistical system. The types excluded from the CO2 emission accounting system, such as Naphtha, Lubricants, Paraffin, White spirit, and Bitumen asphalt, are rarely used for combustion; in other words, the consumption of them can be almost considered to have no CO2 emissions. The emission factors of different fossil fuel types are listed in Table 2.
Table 2.
Emission factors of fossil fuels.
Please note that this study does not account for the indirect CO2 emissions generated by inter-provincial electricity imports/exports. The energy input and CO2 emissions in the process of thermal power generation and heating supply are included in the industrial sector. Accordingly, CO2 emissions from the final consumption of electricity and heating are not considered to avoid double accounting. Meanwhile, the energy consumption used as raw materials and materials in the industrial sector should be deducted because they are non-energy use. In addition, energy consumption and CO2 emissions in the household sector are integrated into the other sectors.
2.2. LMDI Decomposition Model of Carbon Productivity
The decomposition model decomposes a total indicator into several driving factors and quantifies the contribution of each driving factor. This method is widely used to study the driving force of CO2 emissions [30]. This paper adopts the LMDI method to decompose the driving factors of provincial-level carbon productivity, and the formula is as follows:
where is the value added of sector i in province k; is the CO2 emissions of sector i in province k; is the fossil fuel consumption of sector i in province k; and , , and are the energy consumption, value added, and population in province k, respectively. Accordingly, denotes the industrial structure from the perspective of carbon productivity; is the carbon intensity effect of energy consumption; is the energy structure effect; is the energy intensity effect; represents the economic activity effect; and is the ratio of population to CO2 emissions.
The change of provincial carbon productivity from the period of 0 to T can be expressed by the definite integral of its first derivative versus time in an interval (0, T), as shown in Equation (4).
In order to eliminate the influence of time, t, on all factors, the logarithmic average function proposed by Ang and Choi (1997) [31] is used as a weighting factor, as shown in Equation (11). The contribution values of various driving factors on carbon productivity between the base year 0 and the target year T for province k can be calculated using the following equations:
2.3. Carbon Productivity Growth Potential Analysis Method
Referring to the method adopted in determining energy intensity conservation potential, this paper calculates the growth potential of provincial carbon productivity. The conservation potential of energy intensity is defined as the difference between the current value and the target energy efficiency value. The environmental convergence has been confirmed, including the convergence between developed and developing countries [4] and provinces within a country [32]. Based on the convergence theory, the energy efficiency of each province converges to the highest value in the region; therefore, the highest value in the region is set as the target of intensity conservation [32]. Drawing on this idea, this paper classifies provinces with similar characteristics of carbon productivity into one group. On this basis, the highest carbon productivity value of each group is set as the target of carbon productivity promotion in provinces of this group. The carbon productivity growth potential for province k can be expressed as follows:
where is the carbon productivity growth potential for province k and is the maximum carbon productivity in group g, to which the province k belongs.
Based on the decomposition of carbon productivity driving factors, the K-means clustering algorithm is used to classify the 30 provinces in China, to clarify and compare the carbon productivity characteristics of each province. The K-means clustering algorithm is a type of automated clustering algorithm that seeks the optimal solution through iteration. First, K initial cluster centers are selected from the given data sample, X. By calculating the distance between each point and the cluster center, each point is assigned to the cluster where the nearest cluster center is located. After the distribution, the center points of each cluster are determined again, then the points are distributed again, and the cluster centers are updated, iterating until the change of the cluster center points is very small. Suppose there are M clustering objects and N clustering variables. The cluster object is expressed as , . For any two objects and , the Euclidean distance is calculated as follows:
According to the study of Liao et al. (2019) [20], the objective function is defined as:
With the sample data of 30 provinces, , , , , , , carbon productivity in 2017, and annual growth rate of carbon productivity from 2001 to 2017 are taken as clustering variables. In addition, according to hierarchical clustering results, this paper adopts k = 4 as the best clustering number.
2.4. Data
The latest release of the China Energy Statistical Yearbook only counts the data of 2017, which leads to the carbon emission calculating only up to 2017; therefore, this paper investigates until 2017 (The latest release of the China Energy Statistical Yearbook was checked in September 2020). Considering the influences of government planning on carbon productivity, the studied period is from 2001 to 2017, which covers China’s most recent four five year plan periods (FYPP). The fossil fuel consumption data are extracted from the “energy balance sheet” in the “China Energy Statistical Yearbook” (National Bureau of Statistics, 2001–2017). To calculate the industrial structure of energy consumption in 30 provinces, the physical energy consumption of each sector is converted into standard coal, and the standard coal conversion coefficient adopted is extracted from the China Energy Statistics Yearbook. The low calorific value of most energy types is extracted from the China Energy Statistics Yearbook, while a few that are missing in the China Energy Statistics Yearbook are taken from the China Emission Accounts and Datasets (CEADs) [33]. Carbon content and carbon oxidation rate are taken from the China Low-Carbon Development Report (2017). The data on GDP and provincial value added come from the Energy Statistical Yearbook of each province, and the regional GDP index (previous year = 100) is used to adjust the nominal GDP of all provinces in each year to the actual GDP at constant price in 2001. In addition, the population at the end of each year is chosen as the population data for the 30 provinces, which are extracted from the China Statistical Yearbook.
3. Results and Discussion
3.1. Trends of Carbon Productivity
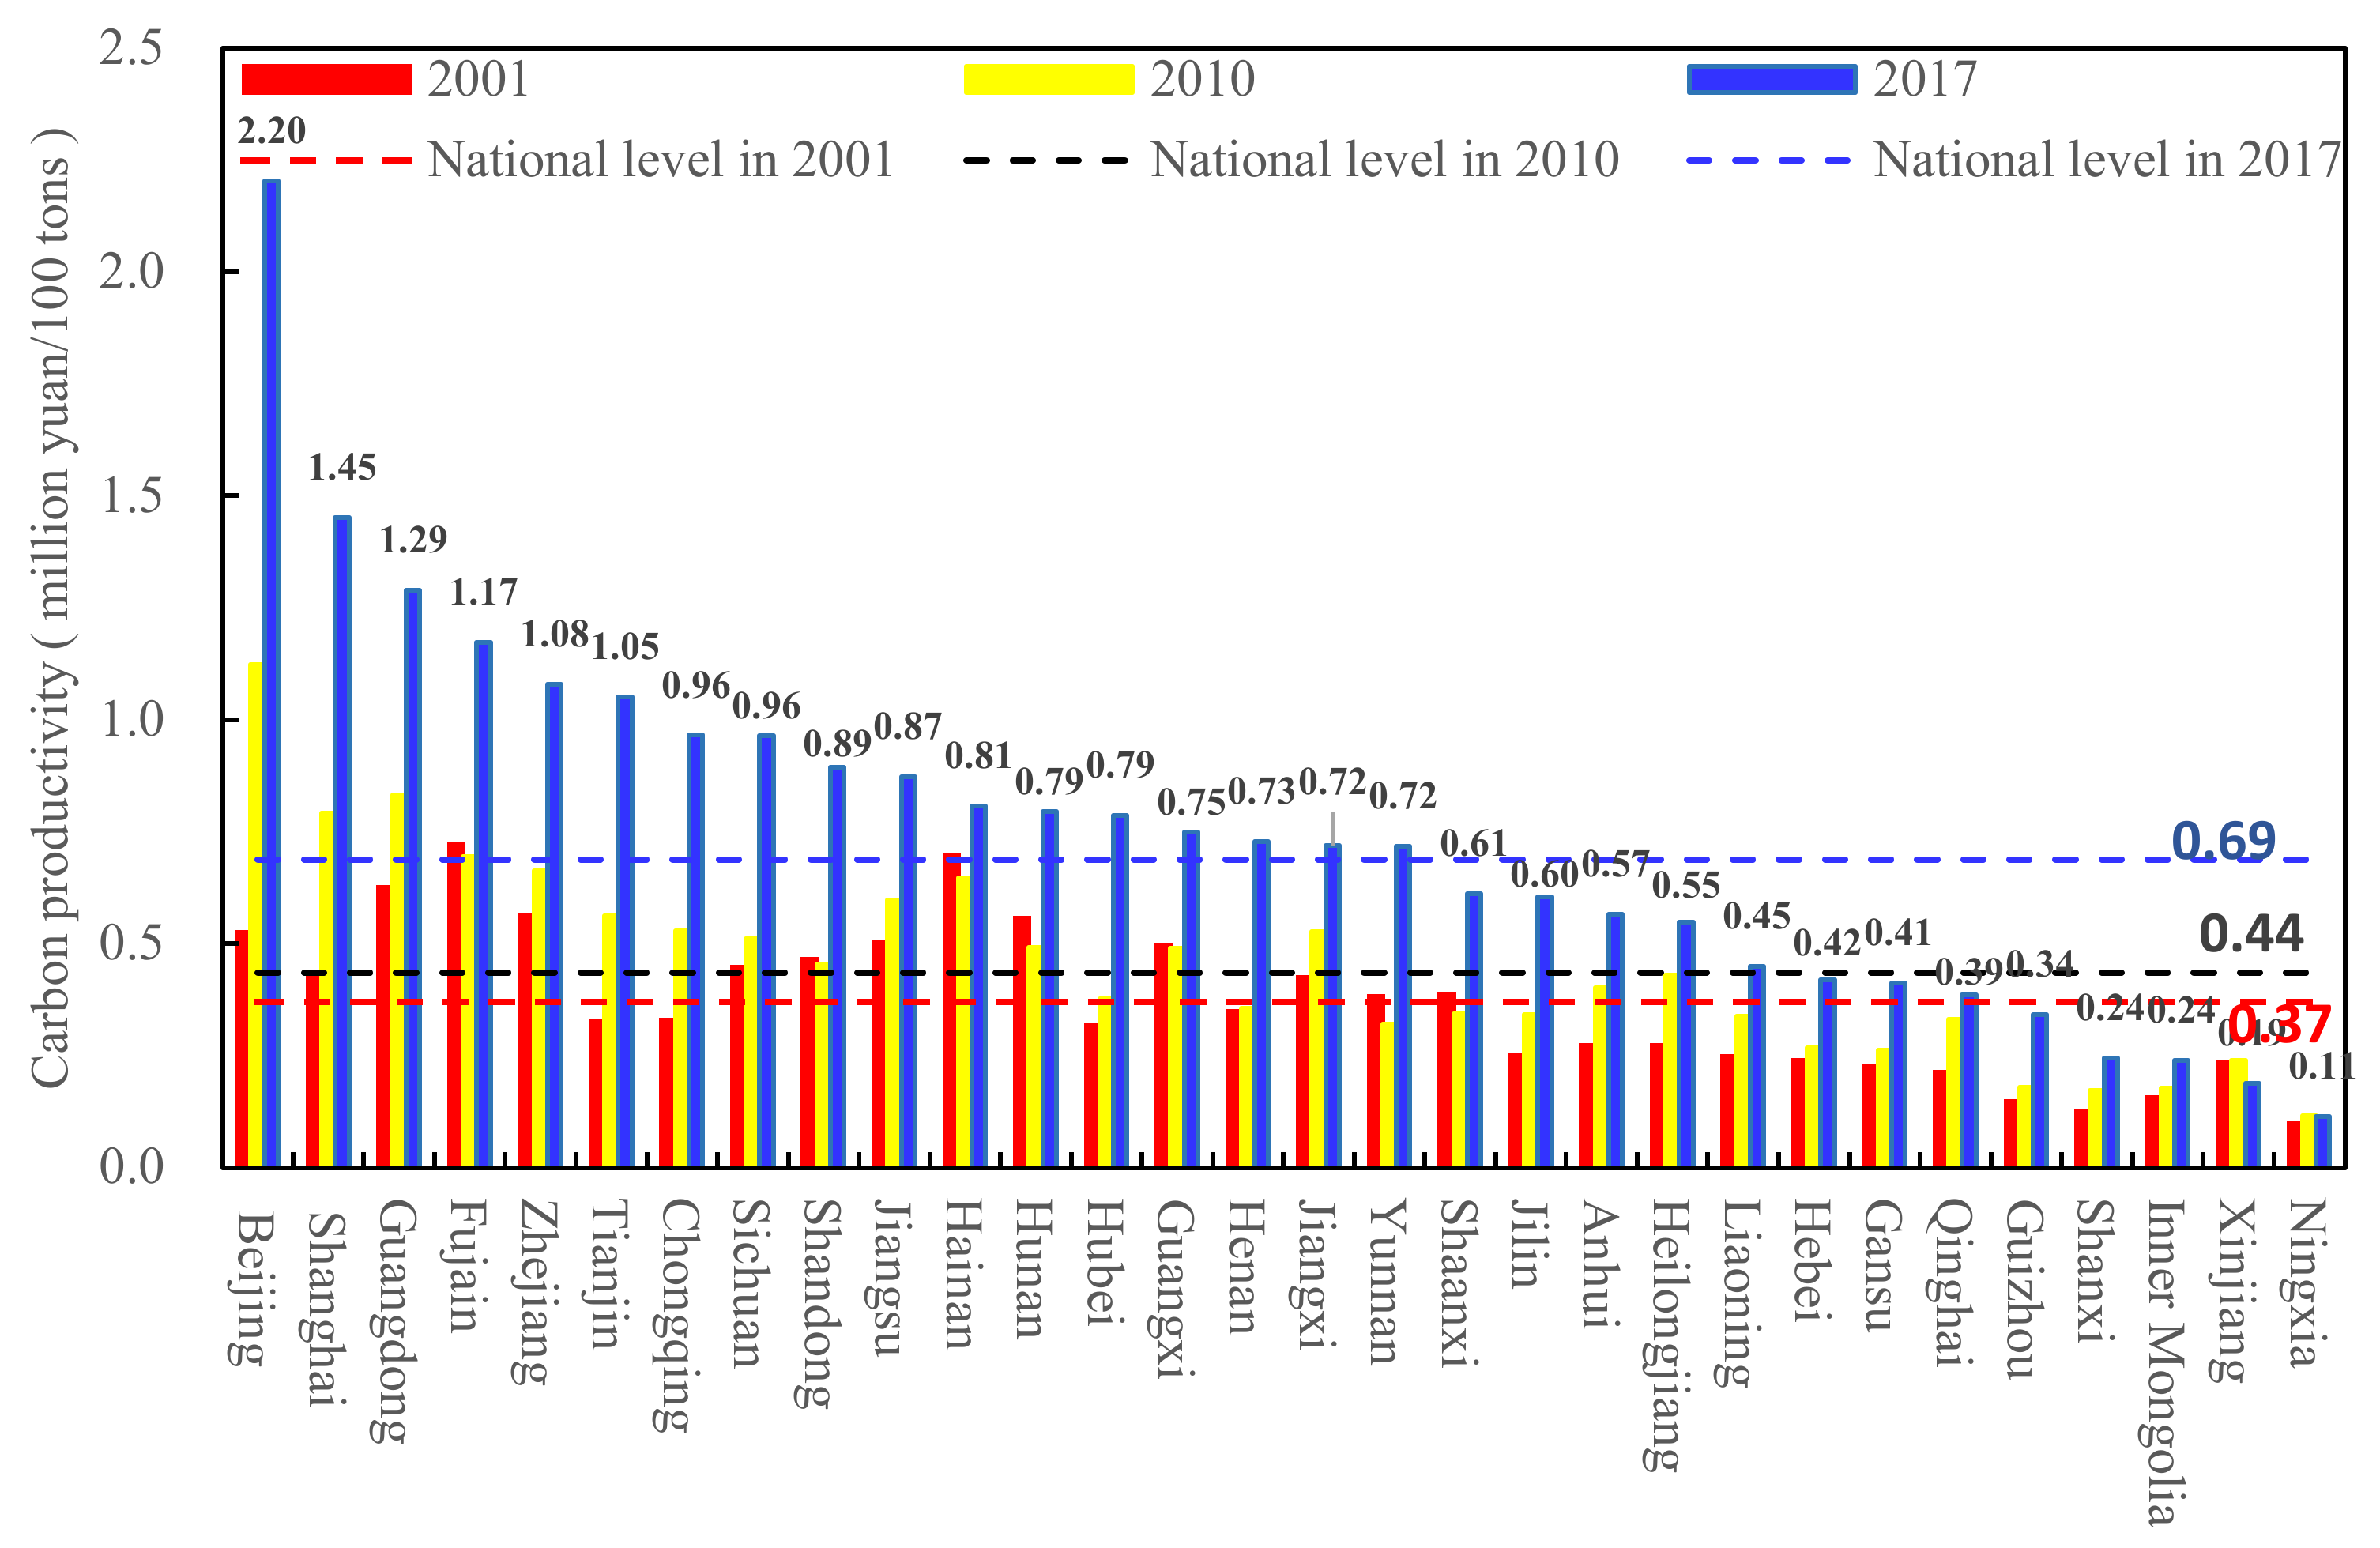
Figure 1 shows the carbon productivity of 30 provinces in China from 2001 to 2017. The average of 30 provinces is taken as the national carbon productivity level, which is indicated by a dotted line. China’s carbon productivity was 0.37 million yuan/100 tons in 2001, increased to 0.44 million yuan/100 tons in 2007, and further increased to 0.69 million yuan/100 tons in 2017. The annual growth rate of China’s carbon productivity grew greatly from 1.74% in 2001–2010 to 6.86% in 2010–2017.

Figure 1.
Carbon productivity of 30 provinces in China from 2001 to 2017.
China’s carbon productivity showed an upward trend from 2001 to 2017, and the growth accelerated significantly in the new normal. In the 10–11th FYPP (2001–2005 to 2006–2010), China entered a new period of accelerated modernization and opening up. Since joining the World Trade Organization in 2001, China’s foreign trade has grown rapidly. With the rapid development of China’s economy, China’s energy consumption has increased dramatically. In 2009, China surpassed the United States and became the largest energy consumer in the world. Although the government had issued an energy development plan, China was in a period of rapid growth in terms of both economic development and energy consumption demand. Therefore, China’s carbon productivity grew slightly at this stage. In the 12th FYPP (2011–2015), the Chinese government issued the “Comprehensive Work Plan for Energy Conservation and Emission Reduction” and began to implement dual control measures for energy consumption and energy intensity. The growth of carbon emissions from fossil fuel combustion was gradually controlled. In 2014, China’s economic development entered a new stage, paying more attention to the quality and efficiency of economic development, achieved remarkable energy conservation and emission reduction, and maintained medium- and high-speed economic growth. China kept economic growth while controlling carbon emission; therefore, its carbon productivity in this stage accelerated significantly (12–13th five year plan).
There is a significant degree of variation in the carbon productivity of the 30 provinces in China; further, this gap is widening. In 2017, Beijing’s carbon productivity was significantly more, thereby exceeding 2 million yuan/100 tons, whereas those of the other provinces were lower than 1.5 million yuan/100 tons. Moreover, Ningxia has the lowest carbon productivity of only 0.11 million yuan/100 tons. Beijing’s carbon productivity is 19.03 times that of Ningxia. More than half of the 30 provinces have a higher carbon productivity than the national average. Beijing, Shanghai, Guangdong, Tianjin, Fujian, Sichuan, Chongqing, Shandong, Jiangsu, Hainan, Hubei, Hunan, Guangxi, Henan, Yunnan, and Jiangxi contribute to China’s carbon productivity growth, while other provinces produce a negative effect. From 2001 to 2017, carbon productivity in Beijing, Shanghai, Guangdong, and Tianjin has shown rapid growth. In 2001, Beijing’s carbon productivity was only 0.52 million yuan/100 tons, which increased to 1.12 million yuan/100 tons in 2010 and reached 2.16 million yuan/100 tons in 2017. Beijing’s average annual growth rate of carbon productivity was 9.29% in 2001–2017. However, the growth of carbon productivity in Xinjiang, Ningxia, and some other provinces has been minor. Different growth rates of carbon productivity aggravate the gap of carbon productivity between regions.
3.2. Driving Factors of Carbon Productivity
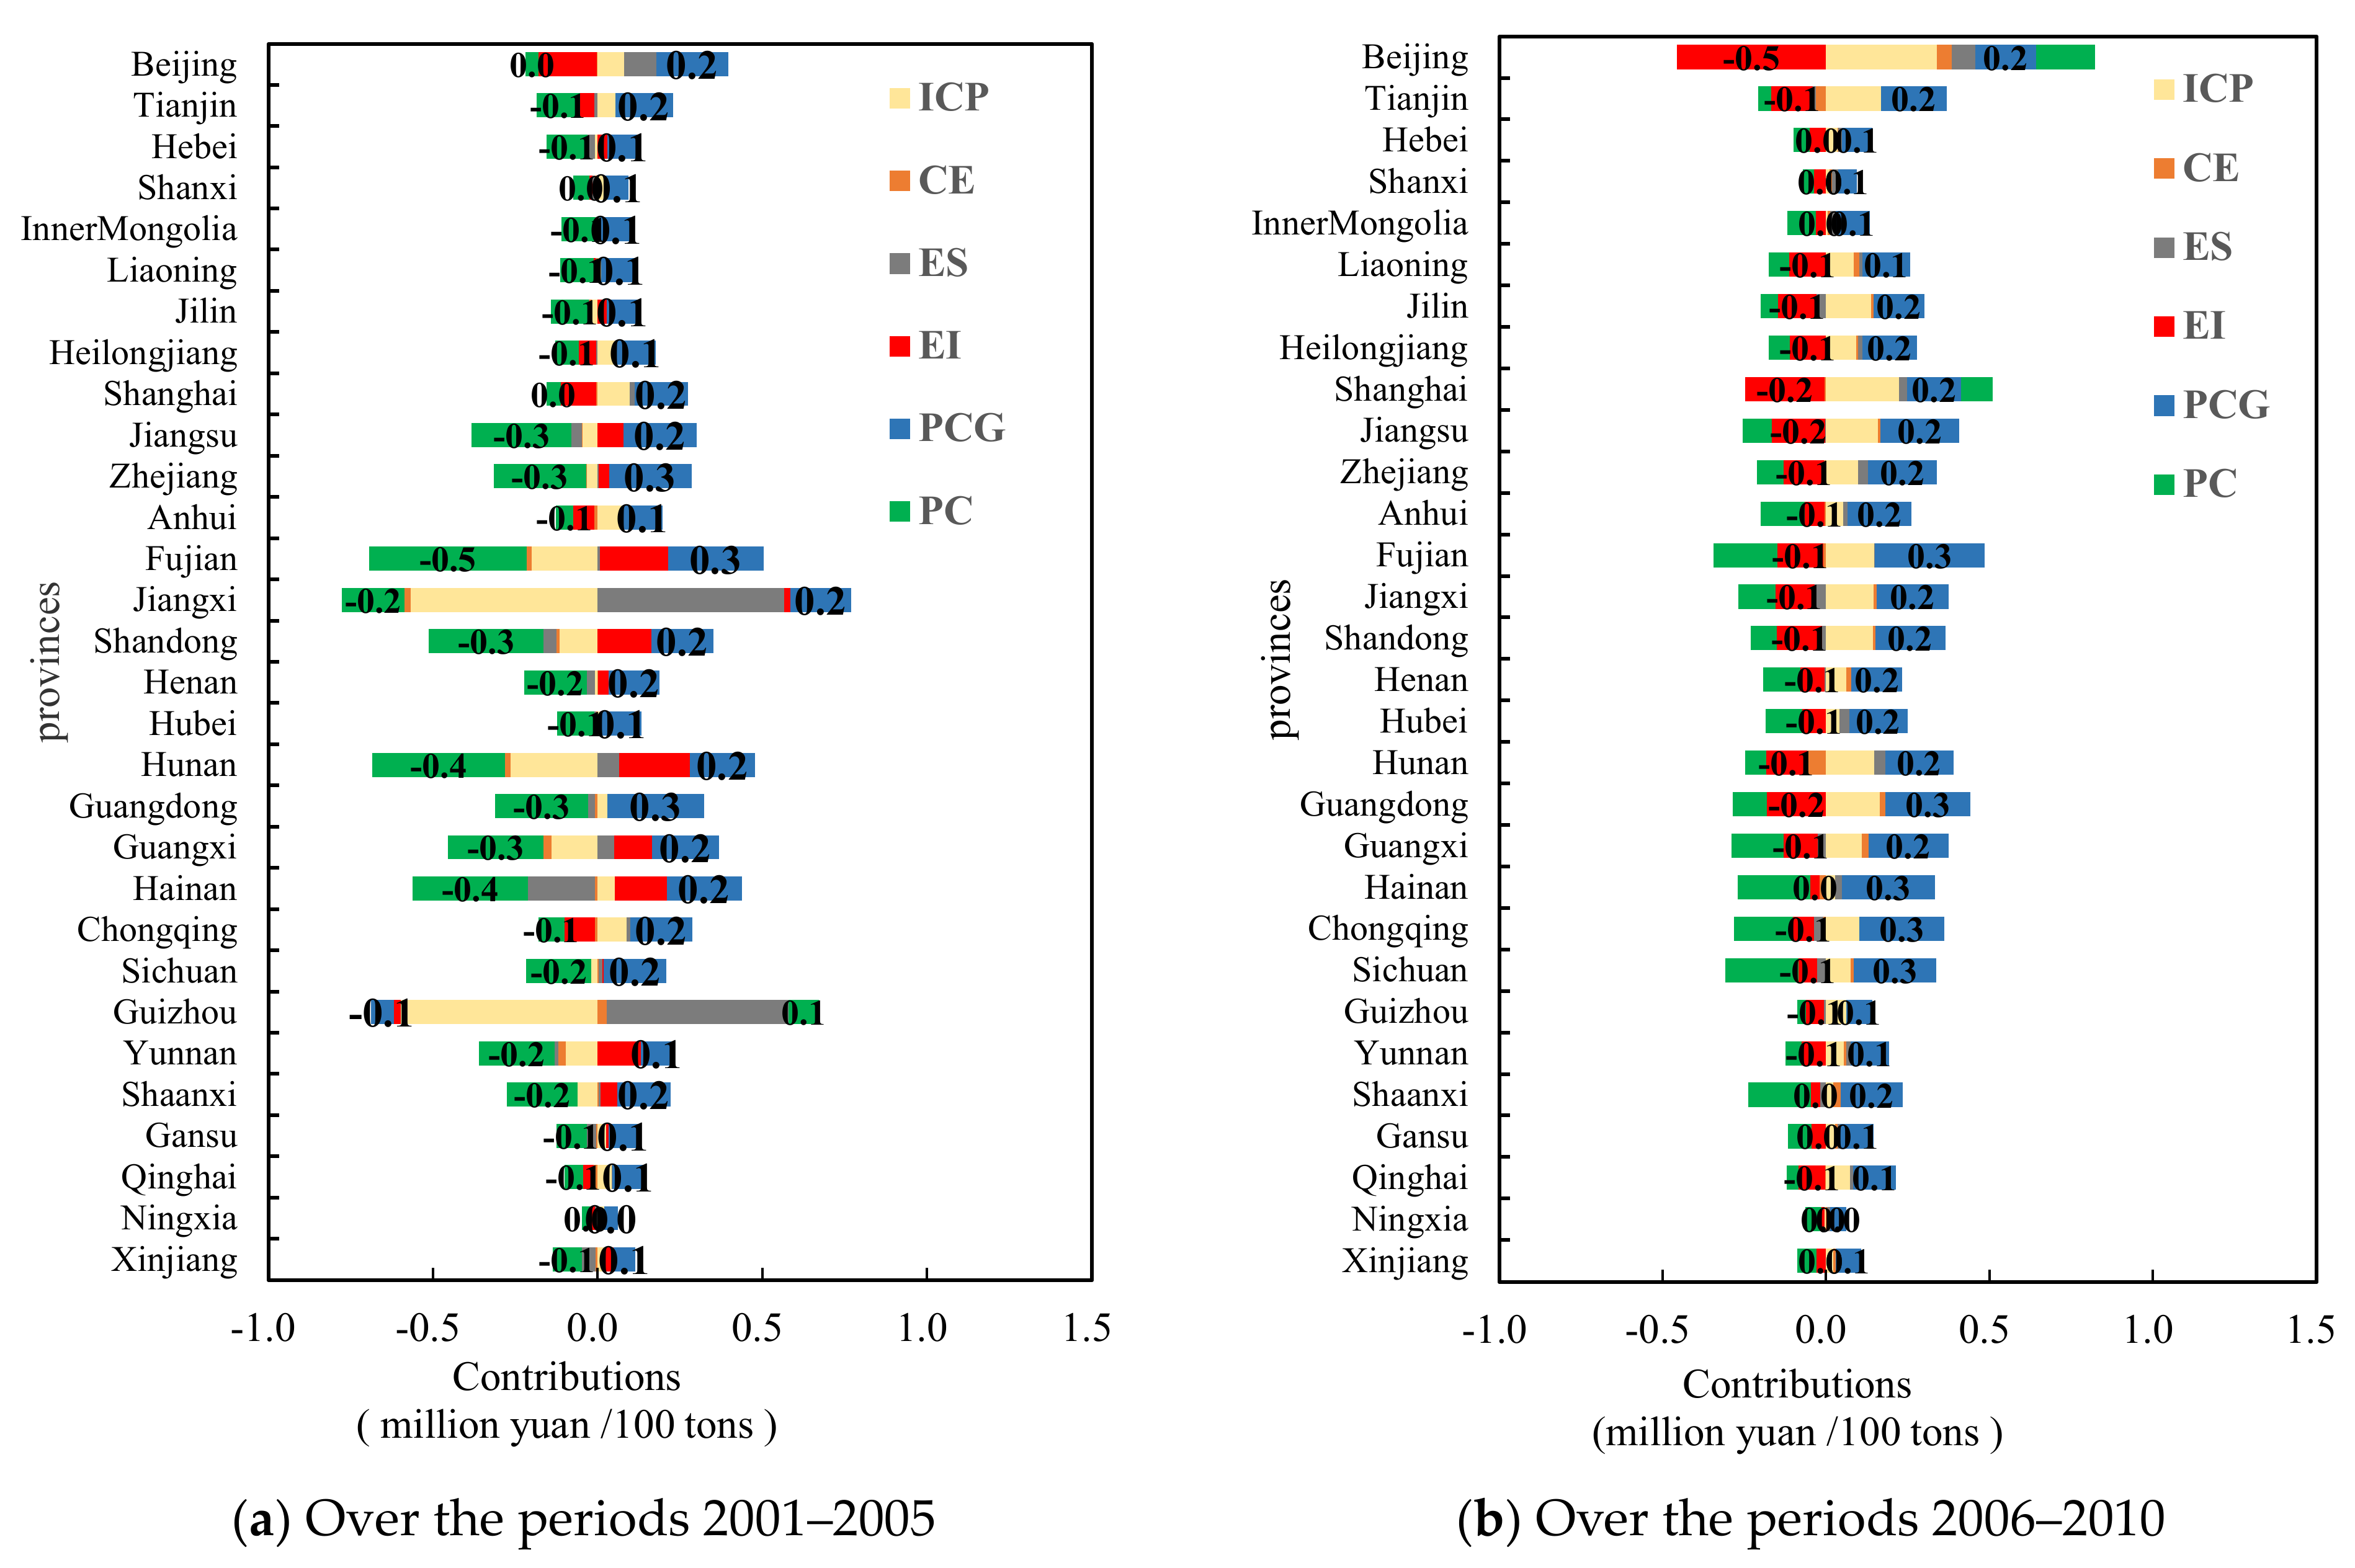
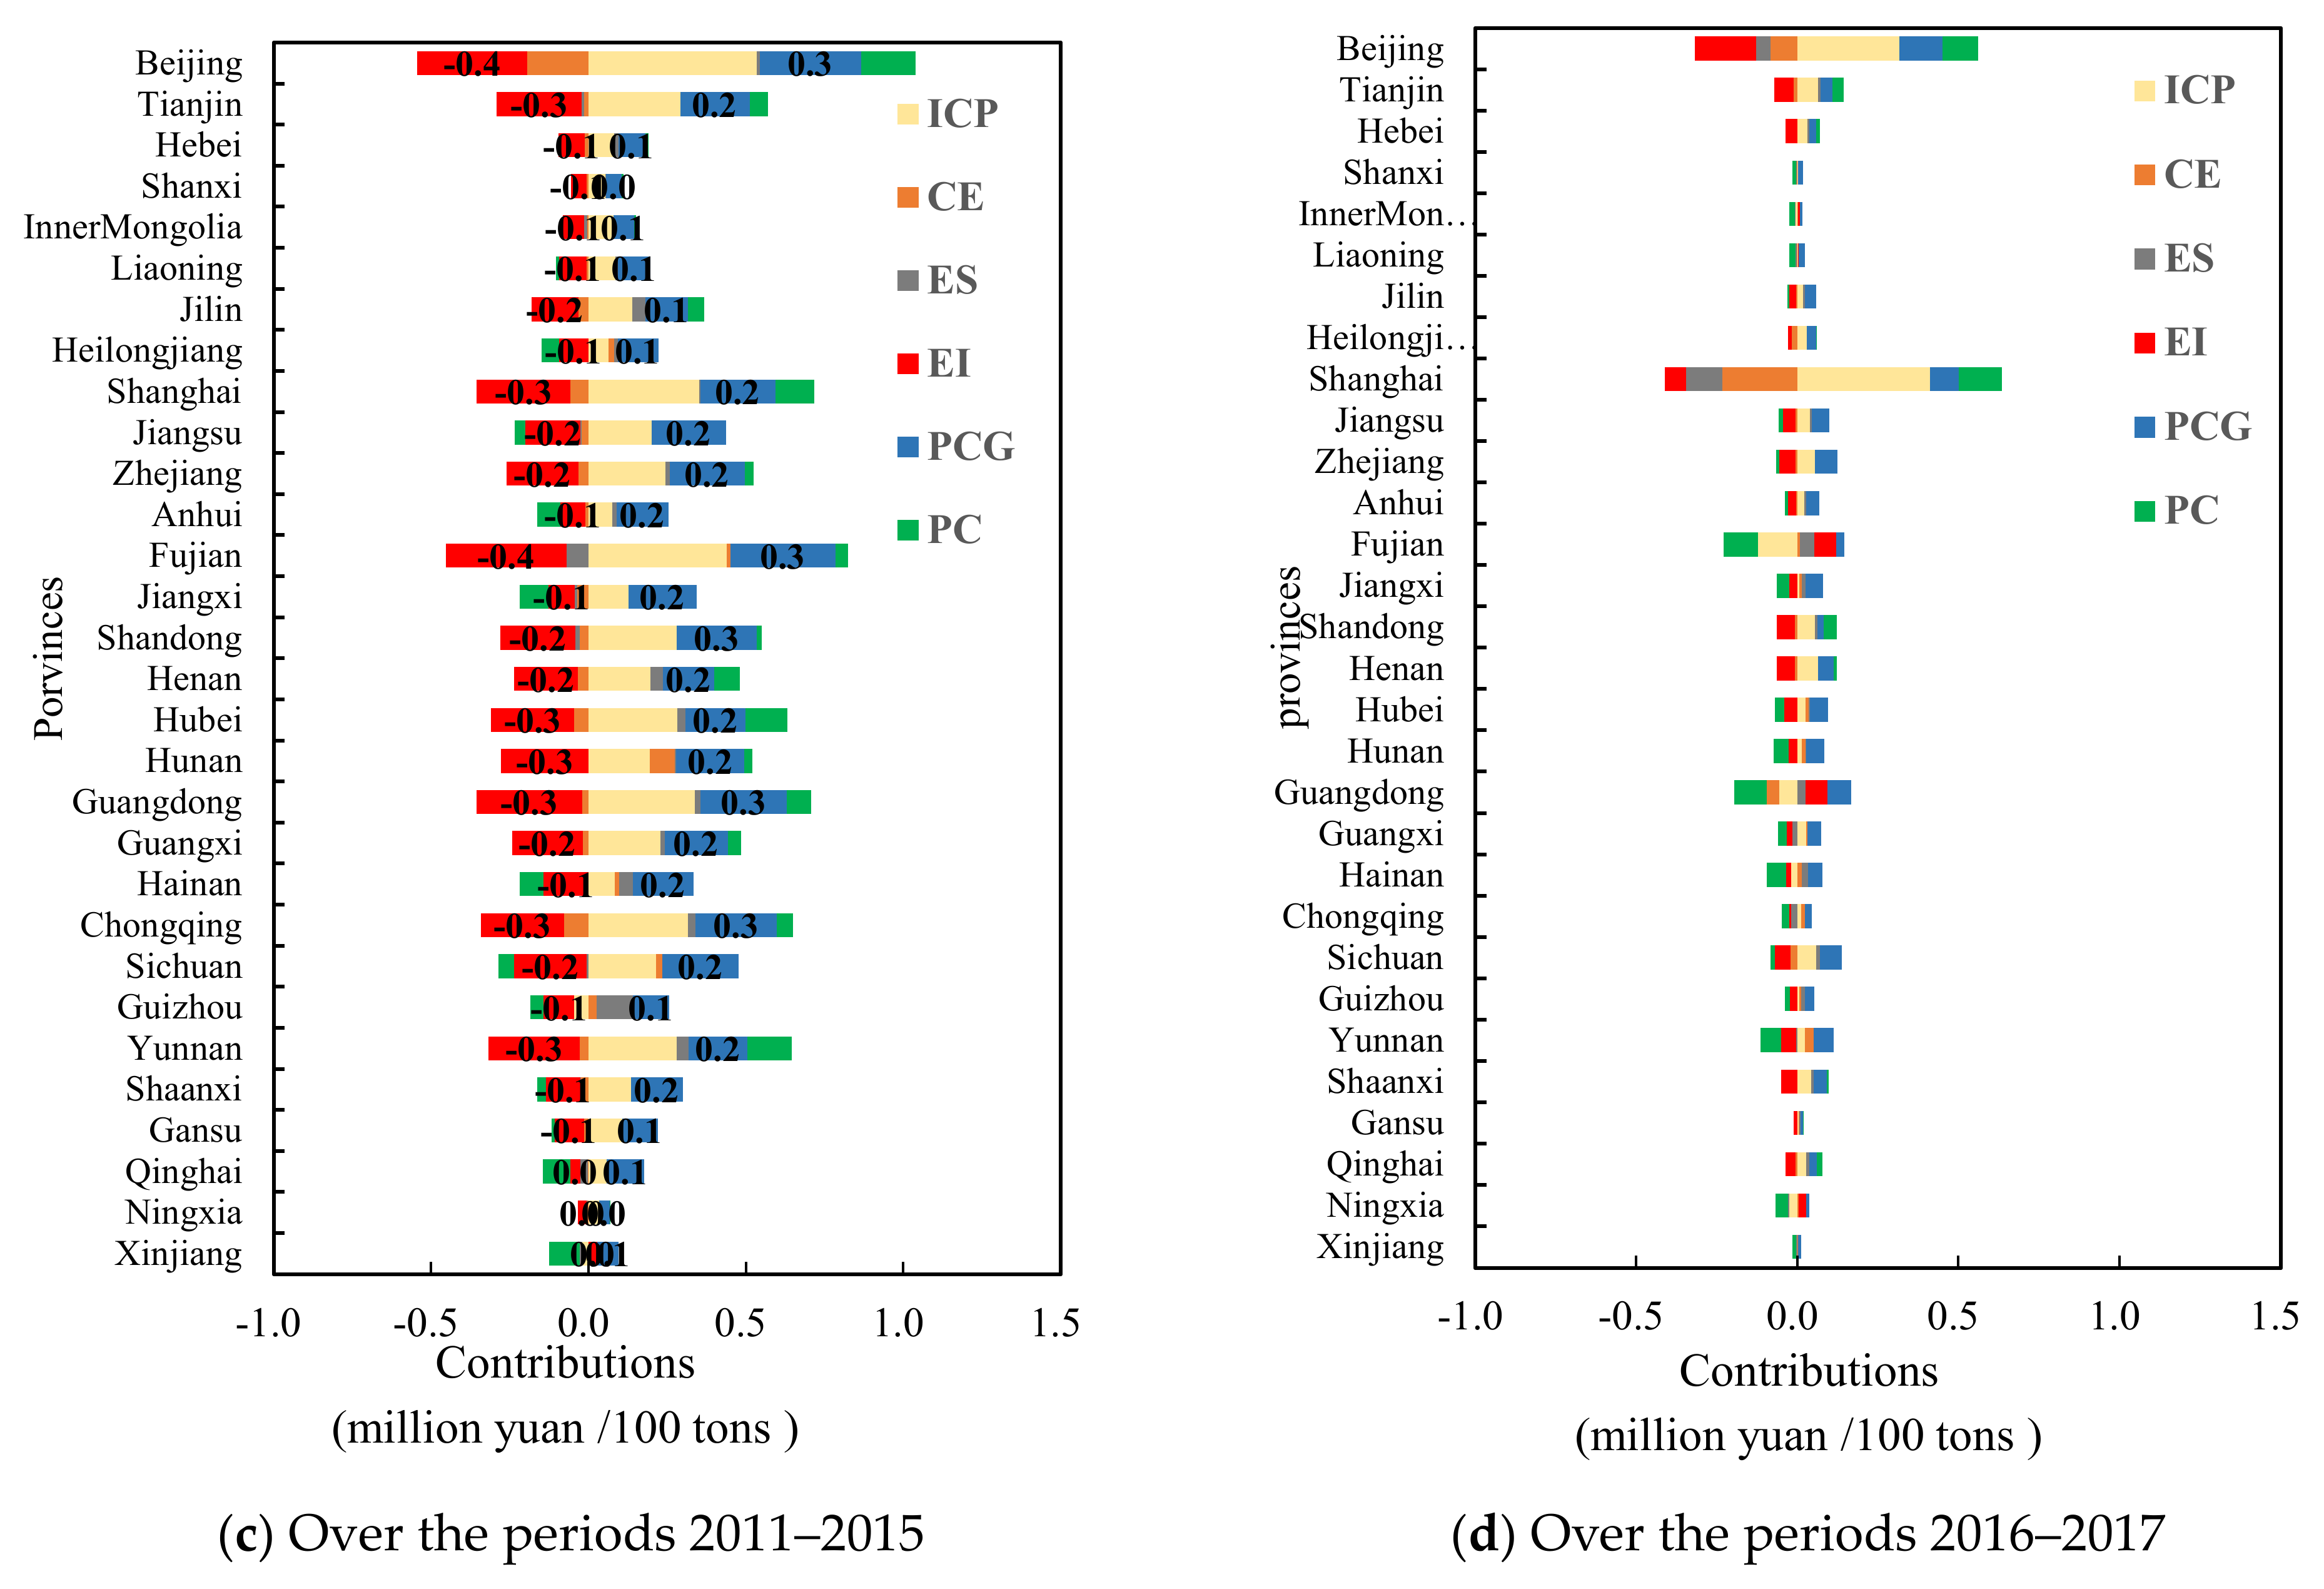
Figure 2 shows the driving factors of carbon productivity change in China’s provinces in four FYPPs. It can be seen that the contributions of various factors to carbon productivity change varied considerably across provinces and over time, while presenting some consistency on the whole. More specifically as follows:

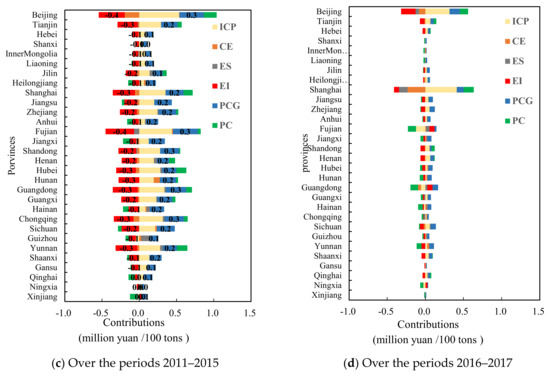
Figure 2.
Decomposition of provincial carbon productivity changes in China.
With the development of the economy, the inhibiting effect of energy intensity on carbon productivity is obviously enhanced. Figure 2 shows that the contribution values of energy intensity on carbon productivity are obviously decreasing. The average contribution values of energy intensity are 0.023 million yuan/100 tons, −0.102 million yuan/100 tons, and −0.173 million yuan/100 tons in the 10th, 11th, and 12th FYPP, respectively. In the 10th FYPP (2001–2005), the contribution values of energy intensity on carbon productivity are negative in only 10 provinces, most of which are the developed provinces, such as Beijing, Shanghai, and Tianjin. Conversely, in the other 20 provinces, energy intensity contributes positively to the changes in carbon productivity. In general, energy intensity has little impact on the provincial carbon productivity in China in 2001–2005, which shows that China’s economic development has less dependence on energy consumption in the 10th FYPP. However, in all provinces in the 11th FYPP (2006–2010) and all provinces except for Xinjiang in the 12th FYPP (2011–2015), the contribution values of energy intensity on carbon productivity are negative. Especially, in most provinces, the contribution values of energy intensity dominate the negative contribution in 2011–2015 (see Figure 2c), indicating that energy intensity becomes a key factor hindering the improvement of provincial carbon productivity in this stage. In addition, the contribution values of energy intensity in a few provinces, such as Ningxia, Inner Mongolia, Xinjiang, Shanxi, and Liaoning, switch from negative to positive in the 13th FYPP (2016–2017) (see Figure 2d). One explanation could be that the economic growth of these resource-based provinces is in a bottleneck, while the growth rate of energy consumption has not slowed down.
Economic activity has always played a leading role in the elevation of provincial carbon productivity in China. Figure 2 represents that GDP per capita has positive and significant effects on the provincial carbon productivity changes in four FYPPs. A rapid and steady economic growth is crucial for increasing carbon productivity. In the 10th FYPP (2001–2005), China’s GDP growth rate was observed to rise continuously, shifting from 7.3% in 2001 to 9.9% in 2005. In the 11th FYPP (2006–2010), China’s economy maintained a high-speed development trend, with a growth rate of 11.4% in 2007. Accordingly, the positive effects of economic activities in Figure 2a,b are significantly higher than those provided by the other factors. In the 12–13th FYPP (2011–2015 to 2016–2017), China’s economy improved slowly and entered the new normal stage in 2014. The positive effects of the economic activities are slightly weakened as shown in Figure 2c,d which is in line with the positive effects induced by the industrial structure. Hence, sustained economic development is the cornerstone for augmenting carbon productivity.
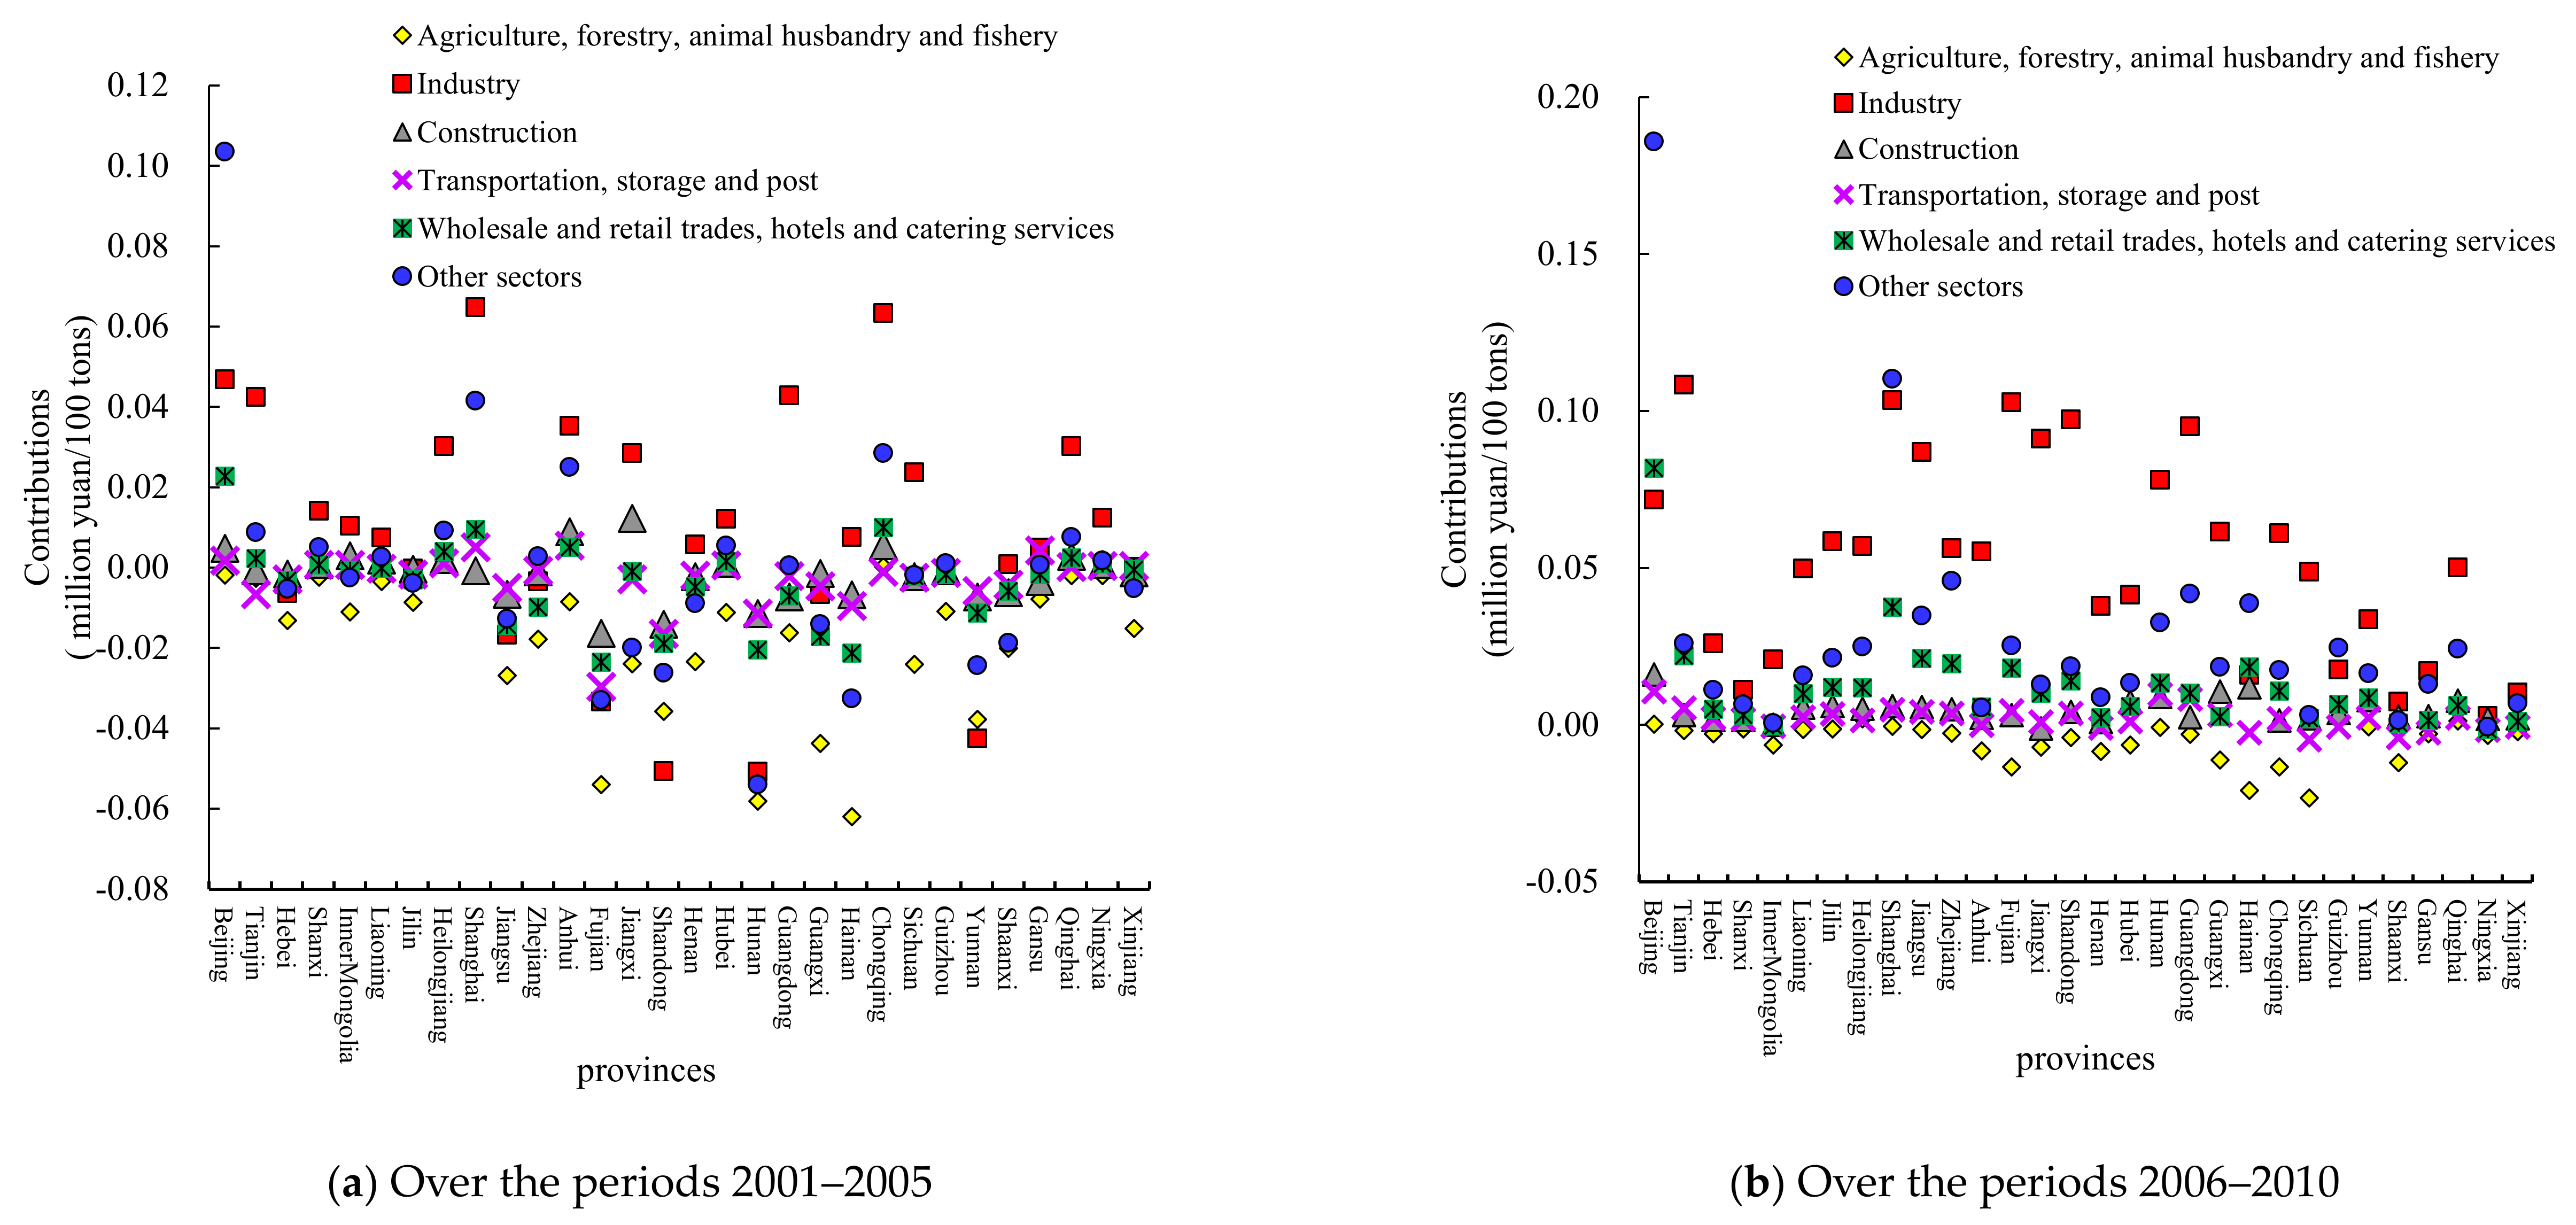
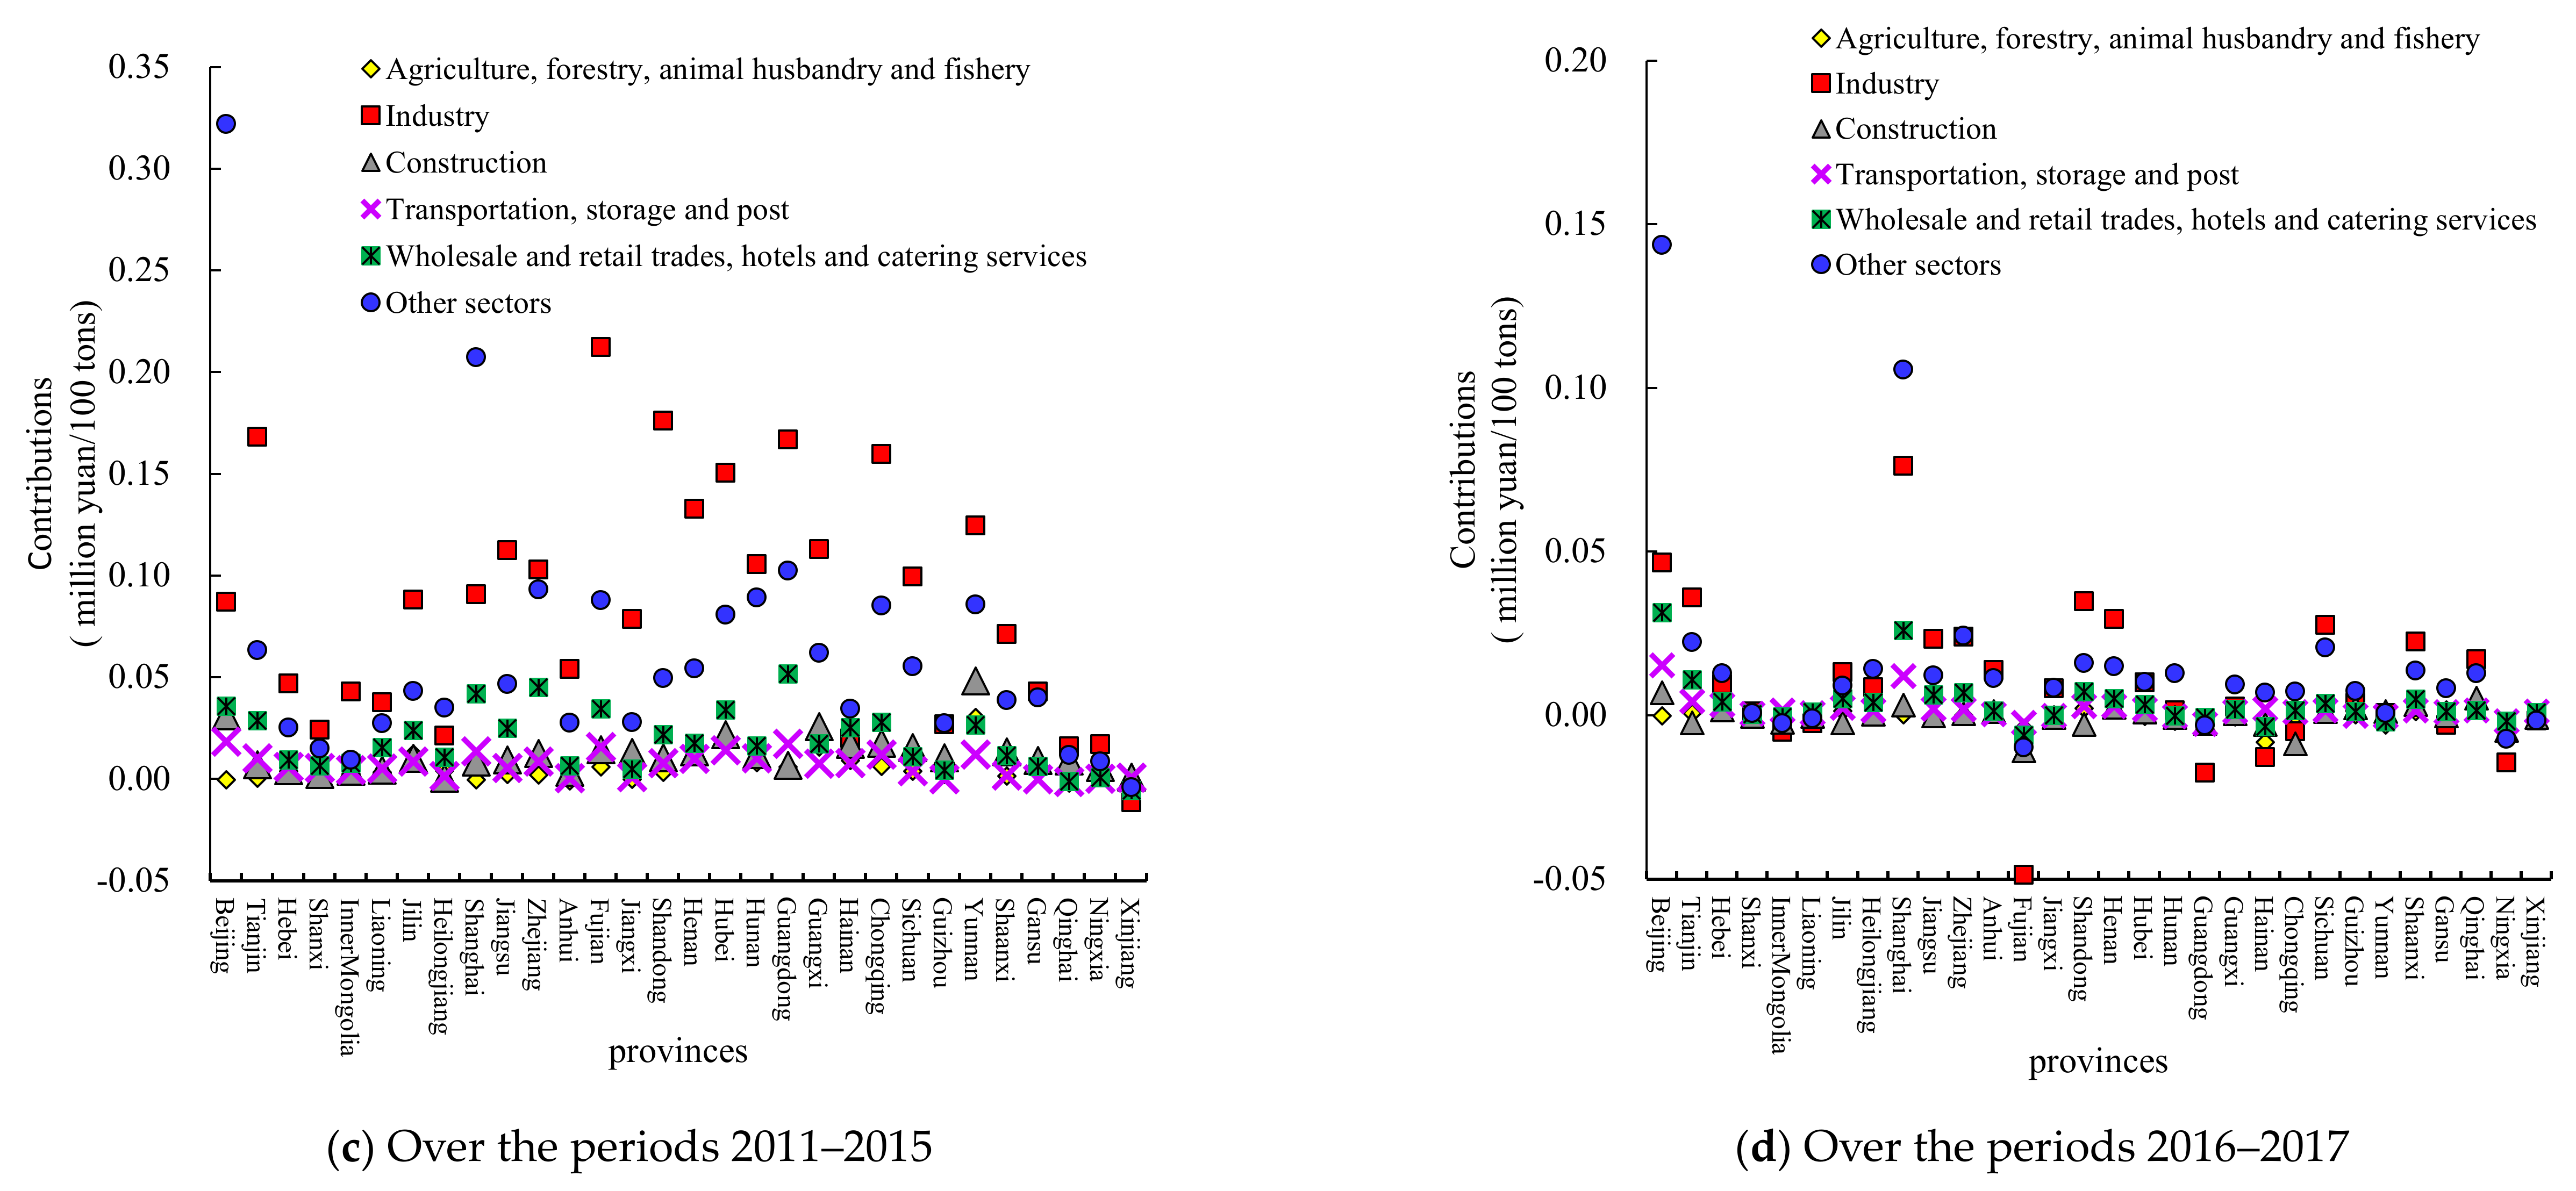
The industrial structure is another key factor driving the growth of carbon productivity in China’s provinces. Figure 2 shows that the provincial sectorial structure’s contribution to carbon productivity was negative over the period 2001–2005. Since 2006, provincial sectorial structure’ contribution values had shifted from negative to positive, and the contribution values show a growth trend. In the 10th FYPP (2001–2005), sectorial carbon productivity had an adverse influence on the growth of carbon productivity in the less developed provinces, such as Guizhou and Jiangxi (see Figure 2a). The contribution values of Guizhou and Jiangxi were −0.74 million yuan/100 tons and −0.59 million yuan/100 tons, respectively. In the 11th FYPP (2006–2010), the sectorial carbon productivity factor of each province is one of the main driving factors in increasing regional carbon productivity, except in Ningxia (see Figure 2b). Beijing and Shanghai’s industrial structure contributed substantially to the carbon productivity changes, with 0.33 million yuan/100 tons and 0.22 million yuan/100 tons, respectively. In the 12th FYPP (2011–2015), the industrial structure greatly influenced regional carbon productivity changes, which has become the core driving factor (see Figure 2c). Sectorial structure’s influences on Beijing, Fujian, Tianjin, and Shanghai were strong and strengthened significantly in Guangdong, Hunan, and Zhejiang. In the 13th FYPP (2016–2017), the effects of sectorial structure on developed provinces, such as Beijing, Tianjin, Shanghai, and Guangdong, remained outstanding (see Figure 2d). In addition, the contribution of each industry to carbon productivity changes is different and changing. Figure 3a shows that in 10th FYPP (2001–2005), provincial agriculture, forestry, animal husbandry, and fishery; wholesale and retail trades, hotels and catering services, and other sectors have negative contributions to carbon productivity changes, and agriculture, forestry, animal husbandry, and fishery’s contribution is greater than other sectors. Figure 3b,d shows that since 2006, with the acceleration of industrialization, regional industrial contributions in China have increased significantly, and other service and wholesale and retail trades, hotels, and catering services’ effects on carbon productivity changes have switched from negative to positive, which played a major role in promoting carbon productivity. The transportation, storage, and post industries, wholesale and retail trades, and hotels and catering services contributed less in driving the carbon productivity growth. Thus, elevating carbon productivity needs to focus on increasing the contribution of transportation, storage, and post industries, wholesale and retail trades, and hotels and catering services. In summary, the industrial structure is the core factor in improving regional carbon productivity. This factor reflects the comprehensive effects of industrial structure and technical level in a region. China’s provinces should optimize their industrial structure according to their resource endowment, accelerate the transformation of new and old kinetic energy, cultivate new industries and stimulate industrial vitality, so as to reduce carbon emissions while improving industrial efficiency.
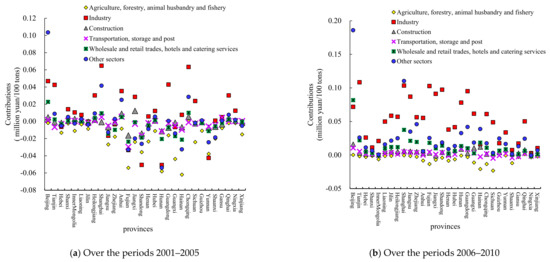
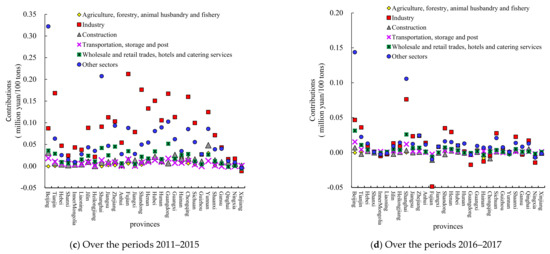
Figure 3.
Industrial contribution value of provincial carbon productivity changes in China.
Carbon intensity, energy structure, and population scale have a limited effect on regional carbon productivity in China. Figure 2 shows that the carbon intensity of energy consumption and energy structure has little contribution to regional carbon productivity changes. In Figure 2a,b, the contribution value of the ratio of population to CO2 was negative in the 10–11th FYPP (2001–2005 to 2006–2010). In the 12–13th FYPP (2011–2015 to 2016–2017), the population scale contribution values have become positive in most provinces, such as Beijing and Shanghai, but there are limited consequences (see Figure 2c,d).
The results of this paper show that China’s carbon productivity has regional heterogeneity, which is consistent with the research of Li et al. (2018), Zhang et al. (2014), and Lu et al. (2014) [16,21,34]. This paper finds that economic activity, industrial structure, and energy intensity are the main factors affecting China’s regional carbon productivity. This result is consistent with Li et al. (2018) [34]. However, Zhang et al. (2014) believe that increasing China’s carbon productivity level should focus on technological progress, capital energy substitution effect, and labor energy substitution effect. This is mainly due to the different decomposition methods of carbon productivity drivers [21].
This study analyzes the changes in China’s carbon productivity driving factors. China’s carbon productivity in 2011–2017 shows a trend of accelerating growth as compared to that in 2001–2010. This is because China’s economic development has entered a new normal. After entering the new normal, the improvement in China’s carbon productivity is mainly due to the optimization and upgradation of industrial structures. In the new normal stage, China has been actively seeking economic transformation, focusing on the transformation to a knowledge civilization. China no longer emphasizes development through reliance on low-value-added industries, high consumption, high pollution, and high-emission industries, and encourages economic growth to rely more on strategically emerging industries, vigorously developing green industries, and circular economies. Therefore, the improvement in industrial structure offsets China’s carbon dioxide emissions, while significantly contributing to emission reduction via an intensive and sustainable development model in the new normal stage. China needs to eliminate backward production capacity through structural reforms on the supply side of operations and adjust industrial structure at the regional level.
3.3. Growth Potential of Carbon Productivity
3.3.1. Clustering Results
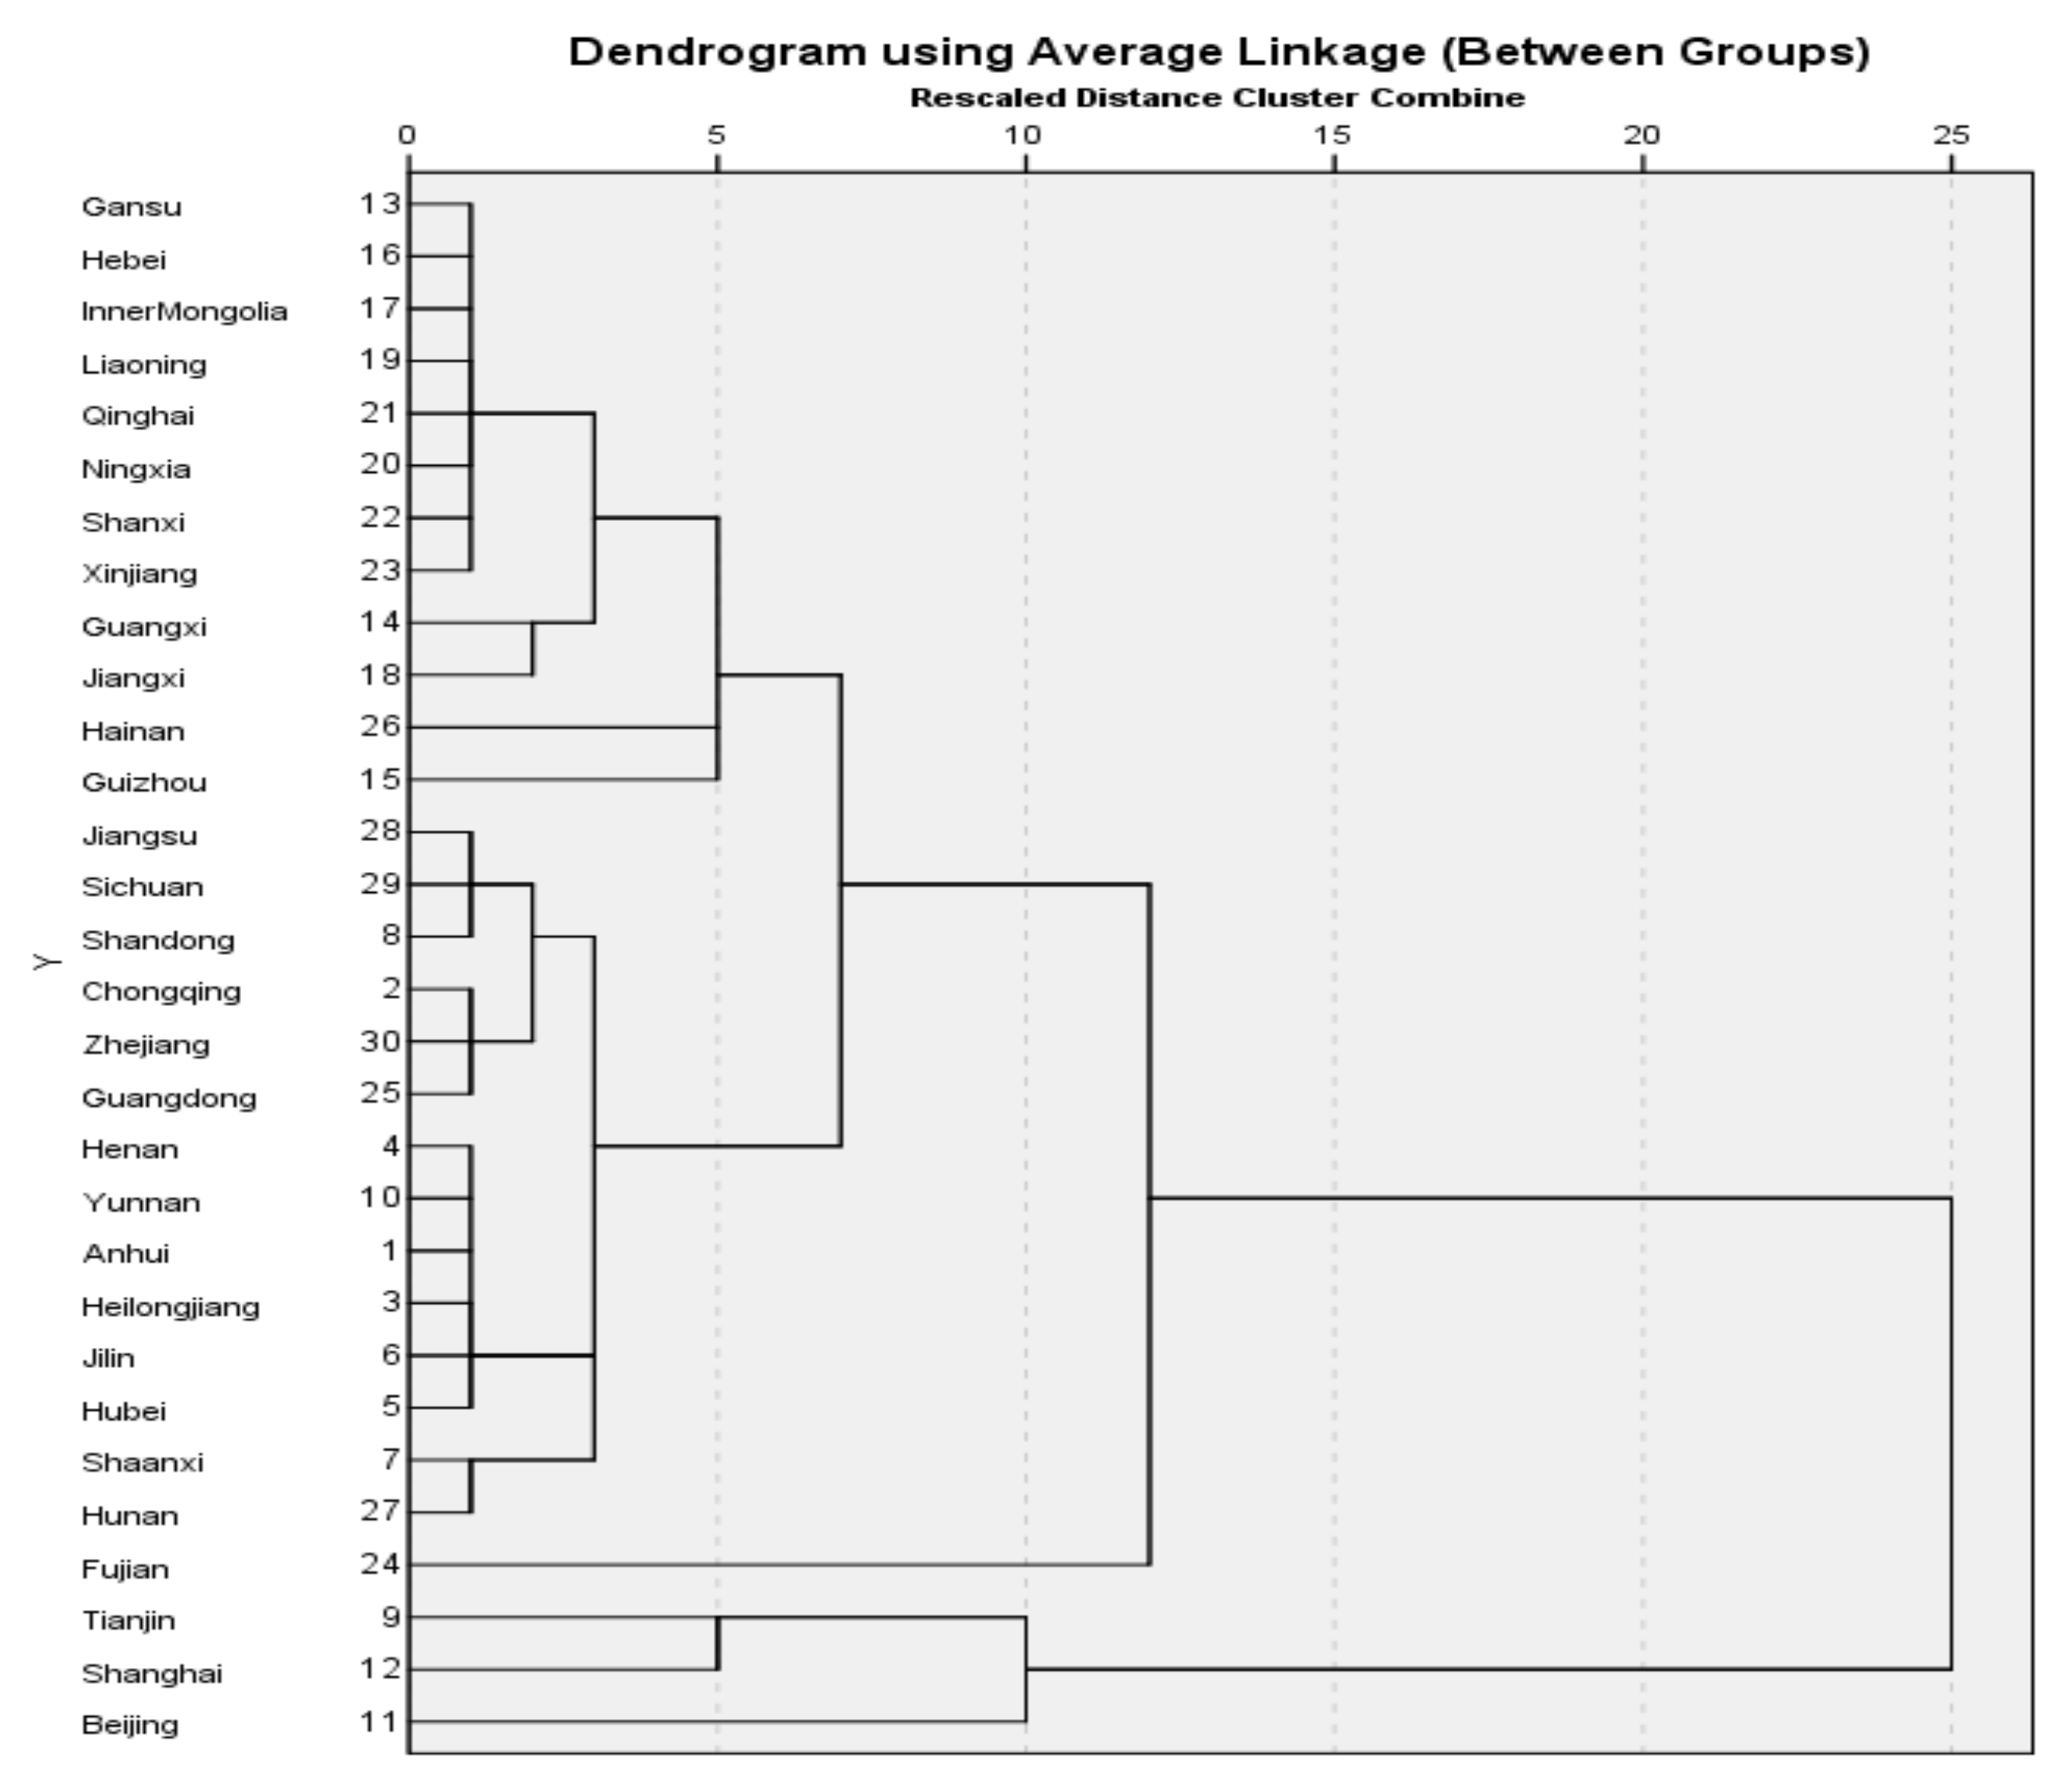
The hierarchical clustering and K-means clustering algorithm are used to classify China’s 30 provinces into four groups. According to hierarchical clustering results (see Figure 4), this paper adopts k = 4 as the best clustering number. The clustering results are shown in Table 3.
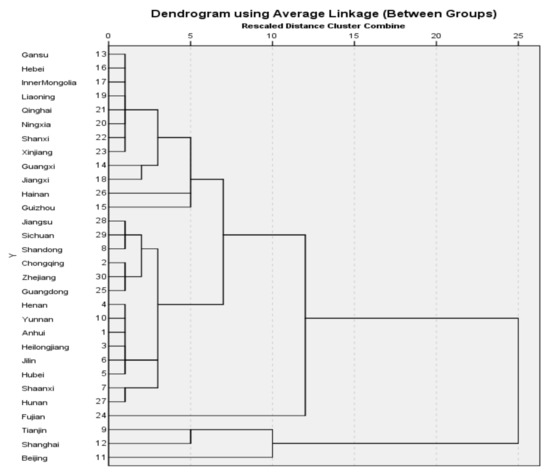
Figure 4.
Hierarchical clustering results.
Table 3.
Clustering results of 30 provinces in China.
Additionally, this paper calculates the average contribution value of each driving factor to the carbon productivity in each group, and the mean value of carbon productivity (denoted by CP) and its growth rate (denoted by RCP) in each group, as shown in Table 4.
Table 4.
Mean values of clustering variables in the four groups.
3.3.2. Analysis of the Growth Potential of Provincial Carbon Productivity
The results of carbon productivity’s growth potential in 30 provinces are reported in this sub-section (see Table 5). Moreover, the measures to improve carbon productivity in different types of provinces are discussed.
Table 5.
Carbon productivity growth potential of 30 provinces in China.
Group 1 includes Beijing, Shanghai, and Tianjin, which are characterized by the highest level and growth rate of carbon productivity in China. In these three municipalities, industrial structure and economic activity play a leading role in carbon productivity growth. The influence of industrial structure optimization and economic activity expansion on promoting carbon productivity is stronger than that of energy intensity on hindering carbon productivity. This group has significantly raised the national average level of carbon productivity. The Blue Book of Industrialization: China’s Industrialization Progress Report (1995–2015) states that Beijing, Shanghai, and Tianjin represent the post-industrialization stage; in 2017, the industrial structure proportions of the three municipalities were 0.4:19.0:80.6, 0.4:29.1:70.5, and 1.2:40.8:58.0, respectively. Since Beijing, Shanghai, and Tianjin have reached a high level of economic development and industrialization, these three provinces can take the lead in exploring ways to improve China’s carbon productivity in the post-industrial period. Table 5 shows that Beijing’s carbon productivity is highest among group 1, with 2.16 million yuan/100 tons. Taking this as the target, the growth potential of carbon productivity in Shanghai and Tianjin are 33.16% and 41.5%, respectively. Compared to other provinces, the potential for an increase in carbon productivity in these two regions is low. Considering the regional characteristics in group 1, carbon productivity can be elevated in service sectors such as transportation, storage, and post industries. Differing from Beijing and Shanghai, Tianjin still has a high proportion of secondary industry. Therefore, Tianjin should increase carbon productivity by improving industrial energy efficiency and promoting high-tech industries.
Group 2 covers Chongqing, Fujian, Guangdong, Jiangsu, Shandong, Sichuan, and Zhejiang, with higher carbon productivity and slower carbon productivity growth. Table 5 shows that Guangdong has the maximum carbon productivity in group 2, with 12,700 tons/100 million yuan. To reach this target maximum, the carbon productivity growth potentials of Chongqing, Fujian, Zhejiang, Sichuan, Shandong, Jiangsu, and Zhejiang are less than 40%, especially in Fujian, which is only 8.66%. Chongqing, Zhejiang, Sichuan, Shandong, and Jiangsu’s potential for carbon productivity improvement is 28.35%, 16.54%, 26.77%, 30.71%, and 31.50%, respectively. These provinces are economically developed. In 2017, Chongqing’s GDP growth rate was 9.3%, ranking fourth in the country. The other six regions’ GDP ranked in the top 10 in China. Therefore, economic activity has the greatest effect on this group of carbon productivity. Economically developed regions, such as Guangdong, Zhejiang, Shandong, and Jiangsu have high-carbon productivity. These areas need to focus on tackling the contradiction between economic development and energy demand. Thus, they could develop a circular economy and build low-carbon cities.
Group 3 is characterized by low-carbon productivity and higher growth. This feature determines that group 3 should be a major focus for China to raise carbon productivity. This group includes Anhui, Heilongjiang, Henan, Hubei, Hunan, Jilin, Liaoning, Shaanxi, and Yunnan. The average annual growth rate of carbon productivity in this group is 4.56%, second only to group 1. Table 5 shows that Hunan has the highest carbon productivity, which is 0.77 million yuan/100 tons. Taking this value to be the target, the potentials for carbon productivity growth in Anhui, Heilongjiang, Henan, Hubei, Jilin, Liaoning, Shaanxi, and Yunnan are 28.21%, 32.05%, 8.97%, 1.28%. 25.64%, 42.31%, 21.79%, and 8.97%, respectively. The carbon productivity growth potentials of these regions are less than 50%, especially in Hubei, Henan, and Yunnan, which are no more than 10%. Areas rich in renewable energy, such as Yunnan, ought to optimize hydropower resources’ allocation, promote the transformation and upgrade of energy structures, and develop tourism to lead the tertiary industry. For these areas, renewable energy and tourism are important ways to stimulate economic vitality and improve carbon productivity.
Group 4 is composed of Gansu, Guangxi, Guizhou, Hainan, Hebei, Inner Mongolia, Jiangxi, Ningxia, Qinghai, Shanxi, and Xinjiang. This group’s typical feature is a slow rise in carbon productivity, and Xinjiang has even experienced negative growth. The average growth rate of national carbon productivity is 3.09%, while that of Hainan and Ningxia are 0.9% and 0.79%, respectively and in Xinjiang growth is −0.88%. Furthermore, this group’s carbon productivity is lower than other groups. There is substantial room to elevate carbon productivity in this group, but it is also difficult to achieve. This because Gansu, Guangxi, Guizhou, Hainan, Hebei, Inner Mongolia, Jiangxi, Ningxia, Qinghai, Shanxi, and Xinjiang are all developing regions. In 2017, the GDP of these 11 provinces accounted for only 18.39% of China. The industrial structure needs to be optimized in the 11 places, especially in Hainan, Xinjiang, and Ningxia, which are 22.0:22.3:55.7, 15.5:39.3:45.2, and 7.6:46.8:45.6, respectively in 2017. Typically, the industrial structure of Xinjiang has a negative influence on carbon productivity. In addition, the positive effects of economic activities on carbon production in these three provinces are not strong. The growth rate of carbon productivity is far lower than the national average. Table 5 shows that Hainan’s carbon productivity is the highest in this group, with 0.8 million yuan/100 tons, but this level is only the national average. Taking Hainan’s carbon productivity as the target, Gansu, Guangxi, Guizhou, Hebei, Inner Mongolia, Jiangxi, Ningxia, Qinghai, Shanxi, and Xinjiang’s carbon productivity growth potential are 48.75%, 10%, 57.5%, 47.5%, 70%, 11.25%, 86.25%, 53.75%, 70%, and 75%, respectively. Hainan, Gansu, Guizhou, Ningxia, Qinghai, and Xinjiang’s GDP ranked in the bottom 10 of the whole country. Hebei, Shanxi, and Inner Mongolia have heavy industrial structures. This group should bring its advantages into full play based on regional resource endowment to elevate the carbon productivity growth rate. Energy-dependent regions, such as Shanxi, Inner Mongolia, and Hebei, are rich in coal resources. The carbon emissions brought by the rapid development of the energy industry are major factors inhibiting carbon productivity elevation. Therefore, these provinces need to adopt advanced energy-saving technologies, improve energy efficiency, promote clean and efficient utilization of coal, and reduce energy intensity. The provinces in this group should seize the opportunity to maintain rapid economic growth. At the same time, they should also pay attention to enhancing low-carbon innovation to reduce carbon emissions.
In short, through the above analysis, the following results are obtained.
During 2001–2017, China’s carbon productivity continued to rise, and the difference in carbon productivity between provinces gradually widened. China’s carbon productivity showed an upward trend, and the growth accelerated sharply in the new normal. The annual growth rate of China’s carbon productivity grew greatly from 1.74% in 2001–2010 to 6.86% in 2010–2017. There are great variations in carbon productivity between provinces. In 2017, the highest provincial carbon productivity was 19.03 times the lowest provincial carbon productivity.
Economic activity and industrial structure are key to push up regional carbon productivity in China, while energy intensity is the main factor pulling it down. In the four (10th–13th) FYPPs, economic activity plays a leading role in improving carbon productivity. After entering the new normal, the improvement of China’s carbon productivity is mainly due to the optimization and upgrading of industrial structures. Since 2006, energy intensity became the major factor hindering carbon productivity growth in all provinces.
China’s 30 provinces are classified into four groups. Group 1 includes Beijing, Shanghai, and Tianjin, with the highest level and growth rate of carbon productivity. Group 2 covers Chongqing, Fujian, Guangdong, Jiangsu, Shandong, Sichuan, and Zhejiang, with higher carbon productivity and slower carbon productivity growth. Group 3 is characterized by low-carbon productivity and higher growth. This feature determines that group 3 should be a major focus for China to raise carbon productivity. This group includes Anhui, Heilongjiang, Henan, Hubei, Hunan, Jilin, Liaoning, Shaanxi, and Yunnan. Group 4 is composed of Gansu, Guangxi, Guizhou, Hainan, Hebei, Inner Mongolia, Jiangxi, Ningxia, Qinghai, Shanxi, and Xinjiang.
The potential for carbon productivity improvement varies greatly among provinces in the four groups. Beijing has the maximum carbon productivity in group 1, and the growth potential of those in Shanghai and Tianjin are 33.16% and 41.5%, respectively. Guangdong’s carbon productivity is the highest in group 2, and the carbon productivity growth potentials of other regions are less than 40%. Hunan has the highest carbon productivity in group 3, which is 0.77 million yuan/100 tons. The carbon productivity growth potentials of these regions are less than 50%. Hainan’s carbon productivity is the highest in group 4, and other provinces’ carbon productivity growth potential are 48.75%, 10%, 57.5%, 47.5%, 70%, 11.25%, 86.25%, 53.75%, 70% and 75%, respectively.
4. Conclusions
Carbon productivity can be used as an important indicator to measure a country’s efforts and effectiveness in coping with climate change. In order to better understand the change in China’s carbon productivity, this paper first conducts decomposition analysis to study the driving factors of carbon productivity. Then, this study further calculates the growth potential of carbon productivity in each province, so as to explore the growth target and promotion path of carbon productivity in each province. The main conclusions are as follows.
The study finds that economic activity, industrial structure, and energy intensity are the main driving factors of regional carbon productivity changes in China during 2001–2017. The former two factors increased China’s carbon productivity growth, whereas the latter reduced it. Thus, the policy should focus on optimizing and upgrading industrial structure and reducing energy intensity. Supply-side structural reform needs to be pushed up further, accelerating the conversion of new and old kinetic energy, and realizing the green and low-carbon economic transformation.
The study also shows that in China, there are differences in the growth potential of carbon productivity between provinces. This finding implies that China’s low-carbon policy should consider regional heterogeneity. Policies are needed to highlight the developmental advantages of each region, relying on resource endowments. Economically developed regions, such as Beijing and Shanghai, should focus on the promotion of carbon productivity in service sectors. Shanxi, Inner Mongolia, Shaanxi, Hebei, and other energy-dependent areas need to adopt advanced energy-saving technologies, promote clean and efficient utilization of coal, and reduce energy intensity. Sichuan and Yunnan can make full use of the advantages of renewable energy. Developing provinces should raise carbon productivity by optimizing and upgrading industrial structure, developing characteristic industries to increase added value and stimulate regional economic development.
In addition, due to the strong regional heterogeneity, the impact of these heterogeneities should be considered in the establishment of the national carbon market and the formulation of carbon prices in the future. Regional heterogeneity has led to significant differences in the transaction prices of different carbon market pilots. Therefore, in the process of establishing a unified national carbon market, it is necessary to consider regional heterogeneity, balance the economic development, carbon emissions, and emission reduction needs of each region, and repeatedly adjust the carbon price to achieve market stability.
Finally, China’s current regional carbon emission reduction research is facing the problem of insufficient data acquisition. The calculation of greenhouse gas emission statistics is the basis for determining national carbon emission reduction targets and for regional and industry decomposition. It is recommended to establish a carbon-emission-related statistical verification system in the future, regularly compile national and provincial greenhouse gas emission inventories, implement a carbon emission accounting and reporting system for key units, and further improve government assessment and promote scientific research.
This paper can also provide reference for developing countries in the stage of industrialization and urbanization. Economic activities, industrial structure, and energy intensity are important factors affecting carbon productivity. The annual growth rate of GDP in developing countries is high. The improvement of carbon productivity must first offset the carbon emissions brought by economic growth. Carbon emission reduction can be achieved through the optimization and upgrading of industrial structure and the reduction of energy intensity. In addition, regional heterogeneity is an important factor that a country needs to consider to improve carbon productivity. Due to the differences of economic development stage, scientific and technological level, resource endowment and other factors, the influencing factors of regional carbon productivity are also different. When implementing carbon emission reduction policies, regional heterogeneity should be considered and measures should be adapted to local conditions.
Author Contributions
M.N. and X.T. conceived and designed the research; M.N. drafted the manuscript and prepared figures and revised the manuscript; J.G., G.L. and C.H. discussed the results. All authors have read and agreed to the published version of the manuscript.
Funding
This research was funded by China’s National Climate Change Program 2019, No. 20190108; National Natural Science Foundation of China under grant No. 71801212.
Data Availability Statement
China Energy Statistics Yearbook. (http://www.stats.gov.cn, accessed on 21 August 2021); China Emission Accounts and Datasets (http://www.ceads.net.cn, accessed on 21 August 2021).
Conflicts of Interest
The authors declare no conflict of interest.
References
- Jnr, B.A. Examining the role of green IT/IS innovation in collaborative enterpriseimplications in an emerging economy. Technol. Soc. 2020, 62, 101301. [Google Scholar]
- Jnr, B.A.; Majid, M.A.; Romli, A. A generic study on Green IT/IS practice development in collaborative enterprise: Insights from a developing country. J. Eng. Mater. Technol. 2020, 55, 101555. [Google Scholar]
- Cao, Y.Y.; Chai, L.; Yan, X.L.; Liang, Y. Drivers of the Growing Water, Carbon and Ecological Footprints of the Chinese Diet from 1961 to 2017. Int. J. Environ. Res. Public Health 2020, 17, 1803. [Google Scholar] [CrossRef] [Green Version]
- Sarkodie, S.A. Environmental performance, biocapacity, carbon & ecological footprint of nations: Drivers, trends and mitigation options. Sci. Total Environ. 2021, 751, 141912. [Google Scholar]
- Kaya, Y.; Yokobori, K. Environment, Energy, and Economy: Strategies for Sustainability; United Nations University Press: Tokyo, Japan, 1999. [Google Scholar]
- Zheng, L.C.; Fu, J.F.; Cai, Z.C. Evaluate regional low-carbon economy competitiveness in China. In Proceedings of the World Automation Congress 2012, Puerto Vallarta, Mexico, 24–28 June 2012. [Google Scholar]
- McKinsey Global Institute. The Carbon Productivity Challenge: Curbing Climate Change and Sustaining Economic Growth. Available online: https://www.mckinsey.com/business-functions/sustainability/our-insights/the-carbon-productivity-challenge (accessed on 27 January 2021).
- NBSC (National Bureau of Statistics of China). Gross Regional Product. 2017. Available online: https://data.stats.gov.cn/easyquery.htm?cn=E0103 (accessed on 21 August 2021).
- Martin, R.; Muuls, M.; Wagner, U.J. The Impact of the European Union Emissions Trading Scheme on Regulated Firms: What Is the Evidence after Ten Years? Rev. Environ. Econ. Policy 2016, 10, 129–148. [Google Scholar] [CrossRef] [Green Version]
- Oestreich, A.M.; Tsiakas, I. Carbon Emissions and Stock Returns: Evidence from the EU Emissions Trading Scheme. J. Bank. Financ. 2015, 58, 294–308. [Google Scholar] [CrossRef]
- Pietzcker, R.C.; Osorio, S.; Rodrigues, R. Tightening EU ETS targets in line with the European Green Deal: Impacts on the decarbonization of the EU power sector. Appl. Energy 2021, 293, 116914. [Google Scholar] [CrossRef]
- Wen, H.X.; Chen, Z.R.; Nie, P.Y. Environmental and economic performance of China’s ETS pilots: New evidence from an expanded synthetic control method. Energy Rep. 2021, 7, 2999–3010. [Google Scholar] [CrossRef]
- Zhang, P.W.; Jia, G.S.; He, C.Q.; Mackhaphonh, N. Driving factors of carbon productivity changes in China’s construction industry. Resour. Sci. 2019, 41, 1274–1285. (In Chinese) [Google Scholar]
- Hu, X.C.; Liu, C.L. Carbon productivity: A case study in the Australian construction industry. J. Clean. Prod. 2016, 112, 2354–2362. [Google Scholar] [CrossRef]
- Long, R.Y.; Shao, T.X.; Chen, H. Spatial econometric analysis of China’s province-level industrial carbon productivity and its influencing factors. Appl. Energy 2016, 166, 210–219. [Google Scholar] [CrossRef]
- Lu, Z.N.; Yang, Y.; Wang, J. Factor decomposition of carbon productivity change in china’s main industries: Based on the Laspeyres decomposition method. Energy Procedia 2014, 61, 1893–1896. [Google Scholar]
- Li, S.J.; Wang, S.J. Examining the effects of socioeconomic development on China’s carbon productivity: A panel data analysis. Sci. Total Environ. 2019, 659, 681–690. [Google Scholar] [CrossRef] [PubMed]
- Du, K.R.; Li, J.L. Towards a green world: How do green technology innovations affect total-factor carbon productivity. Energy Policy 2019, 131, 240–250. [Google Scholar] [CrossRef]
- Cheng, Y.; Sun, Y.X.; Wang, X.J. Research on the impact of global scientific and technological innovation on carbon productivity and countermeasures. China Popul. Resour. Environ. 2019, 29, 31–40. (In Chinese) [Google Scholar]
- Long, R.Y.; Gan, X.; Chen, H.; Wang, J.Q.; Li, Q.W. Spatial econometric analysis of foreign direct investment and carbon productivity in China: Two-tier moderating roles of industrialization development. Resour. Conserv. Recycl. 2020, 155, 104677. [Google Scholar] [CrossRef]
- Zhang, C.; Wang, J.K.; Shi, W.Y.; Li, Y. Decomposition on the Fluctuation of China’s regional Carbon Productivity Growth. China Popul. Resour. Environ. 2014, 24, 41–47. (In Chinese) [Google Scholar]
- Ang, B.W.; Zhang, F.Q. A survey of index decomposition analysis in energy and environmental studies. Energy 2000, 25, 1149–1176. [Google Scholar] [CrossRef]
- Ang, B.W. Decomposition analysis for policymaking in energy: Which is the preferred method? Energy Policy 2004, 32, 1131–1139. [Google Scholar] [CrossRef]
- Ang, B.W. LMDI decomposition approach: A guide for implementation. Energy Policy 2015, 86, 233–238. [Google Scholar] [CrossRef]
- Liao, C.Y.; Wang, S.G.; Zhang, Y.Y.; Song, D.; Zhang, C.H. Driving forces and clustering analysis of provincial-level CO2 emissions from the power sector in China from 2005 to 2015. J. Clean. Prod. 2019, 240, 118026. [Google Scholar] [CrossRef]
- Wen, L.; Li, Z.K. Provincial-level industrial CO2 emission drivers and emission reduction strategies in China: Combining two-layer LMDI method with spectral clustering. Sci. Total Environ. 2020, 700, 134374. [Google Scholar] [CrossRef] [PubMed]
- Chen, G.J.; Hou, F.J.; Chang, K.L.; Zhai, Y.B.; Du, Y.Q. Driving factors of electric carbon productivity change based on regional and sectoral dimensions in China. J. Clean. Prod. 2018, 205, 477–487. [Google Scholar] [CrossRef]
- Lu, J.; Fan, W.; Meng, M. Empirical research on China’s carbon productivity decomposition model based on multi-dimensional factors. Energies 2015, 8, 3093–3117. [Google Scholar] [CrossRef]
- CNCGCC. The Second National Information Bulletin on Mitigating Global Climate Change of China; CNCGCC: Beijing, China, 2013. [Google Scholar]
- Jiang, J.J.; Ye, B.; Xie, D.J.; Tang, J. Provincial-level carbon emission drivers and emission reduction strategies in China: Combining multi-layer LMDI decomposition with hierarchical clustering. J. Clean. Prod. 2017, 169, 178–190. [Google Scholar] [CrossRef]
- Ang, B.W.; Choi, K.H. Decomposition of aggregate energy and gas emission intensities for industry: A refined Divisia index method. Energy J. 1997, 18, 59–73. [Google Scholar] [CrossRef]
- Shi, D. Regional Differences in China’s Energy Efficiency and Conservation Potentials. China Ind. Econ. 2006, 49–58. (In Chinese) [Google Scholar] [CrossRef]
- China Emission Accounts and Datasets (CEADs). Emission Inventories for 30 Provinces 2001–2017. Available online: http://www.ceads.net.cn (accessed on 5 January 2021).
- Li, S.S.; Luo, L.W. Factor Decomposition and Growth Motive Force of Carbon Productivity in China during “Twelfth Five-Year Plan”:Based on LMDI-PDA Method. Technol. Econ. 2018, 37, 77–86. (In Chinese) [Google Scholar]
Publisher’s Note: MDPI stays neutral with regard to jurisdictional claims in published maps and institutional affiliations. |
© 2021 by the authors. Licensee MDPI, Basel, Switzerland. This article is an open access article distributed under the terms and conditions of the Creative Commons Attribution (CC BY) license (https://creativecommons.org/licenses/by/4.0/).