Article

Chain Innovation Mechanism of the Manufacturing Industry in the Yangtze River Delta of China Based on Evolutionary Game

1
College of Economics and Management, Hefei University, Hefei 230601, China
2
College of Civil Engineering, Hefei University of Technology, Hefei 230009, China
*
Author to whom correspondence should be addressed.
Sustainability 2021, 13(17), 9729; https://doi.org/10.3390/su13179729
Submission received: 3 August 2021 / Revised: 25 August 2021 / Accepted: 27 August 2021 / Published: 30 August 2021
(This article belongs to the Topic Industrial Engineering and Management)

Abstract

:
It is of great theoretical and practical significance to achieve high-quality development that promotes the transformation of digestion, absorption, and re-innovation to an independent innovation model, actively participating in the restructuring of the industrial chain, and enhancing the status of the Yangtze River Delta in the global innovation chain. This study constructs a tripartite evolutionary game model of collaborative innovation led by the government, participated by upstream enterprises and downstream enterprises. Moreover, this article analyzes the strategic choices of the tripartite entities in the process of collaborative innovation, and the simulation analyzes the influencing factors of the government, upstream enterprises, and downstream enterprises’ collaborative innovation strategy selection. The results indicate that the government, upstream enterprises, and downstream enterprises have different degrees of influence on each other’s willingness to participate. In addition, the analysis proves that government policy support and financial support have different impacts on upstream enterprises and downstream enterprises.

1. Introduction

Faced with the “structural slowdown” of the global economy, the Chinese government has proposed a national development strategy that shifts from relying mainly on factors and investment to being driven by technological innovation [1,2]. The manufacturing industry is a field that gathers many new patents, new technologies, and new product applications [3,4,5]. The scientific and technological innovation capability of the manufacturing industry is the key to promoting high-quality economic development and plays an important role in building a modern economic system [6,7,8,9,10]. From the perspective of domestic development, regional integration in the Yangtze River Delta has become a national strategy [11,12]. The market segmentation brought about by local free competition and the consequences of independent governance have seriously affected the collaborative innovation in the development of science and technology, resulting in weak cooperation between manufacturing enterprises [13]. From the perspective of international prospects, for a long time, multinational enterprises in developed countries in Europe and the United States have mostly occupied the R&D link of the manufacturing industry chain, mastered the key core technologies, and formed core competitiveness by relying on their dominant position in the global value chain to occupy the commanding heights of international competition [4,14,15]. The current trade friction between China and the United States and the outbreak of the new crown pneumonia have caused the global economy to continue to downturn [16]. The cut-off of certain “stuck neck” technologies has caused the entire industrial chain to break, with the effect of “one sword sealing the throat” [17]. The situation that key core technologies, key links in the production process, and key components are controlled by others has not been completely reversed [18]. How to achieve the “1+1>2” synergistic innovation effect in different fields and drive high-quality economic development is a common problem facing the current manufacturing industry [19]. Therefore, the purpose of this research is to strengthen the collaborative innovation of upstream and downstream enterprises, cultivate innovative competitive advantages in the industry chain, and ultimately achieve high-quality economic development [20,21,22,23].
This paper is organized as follows: The literature review of industry chain innovation is reviewed in Section 2. In Section 3, evolutionary game model assumptions are proposed, and a payment matrix is constructed. The stability of the evolutionary game model of technological innovation is analyzed in Section 4. Simulation analysis is presented in Section 5. Section 6 is devoted to the conclusions.

2. Literature Review

Prior research mainly studied the concept and mechanism of collaborating innovation. For example, Shi et al. analyzed that chain innovation is a process in which an enterprise establishes an information-sharing mechanism with other upstream and downstream enterprises in the industrial chain, participates in research and development, and realizes the innovation of the entire industrial chain through technology transfer [24,25]. In addition, Turken and Geda pointed out industrial development itself was a process of dynamic integration of industrial chains, and its formation and development were embodied in the synergy of different industrial chains [26]. Skippari et al. suggested that research on collaborative innovation in the industrial chain was mainly based on the mechanism and process of collaborative innovation and was reflected in the interactive innovation between upstream and downstream enterprises in the industrial chain [27]. Wang and Hu demonstrated that vertical industrial chain cooperative innovation was a common innovation model and effective knowledge sharing and cooperation between upstream and downstream enterprises, which could help improve innovation efficiency [28]. Furthermore, Cao and Zhang concluded that industrial chain collaborative innovation would promote industrial optimization and upgrading [29].
Current studies mainly explore the vertical industrial chain cooperative from the innovation model. Effective knowledge sharing and cooperation between upstream and downstream enterprises can help improve innovation efficiency to promote industrial optimization and upgrading [30,31,32]. Based on their research, Ge et al. established a multistage game model between suppliers and manufacturers and analyzed the strategic commitments and opportunistic behaviors of suppliers and manufacturers to determine whether certain types of commitments would reduce the uncertainty of the company and increase profitability [33]. Shen et al. studied a supply chain that included upstream suppliers and downstream manufacturers and found that the manufacturer should be the leader in product investment [34]. Hong et al. presented a green supply chain collaborative innovation and found that organization–organization, organization–government, and organization–institution collaborative innovation have an obvious effect on innovation output efficiency [35]. Xu et al. explained the process of university–industry–research (U-I-R) collaborative innovation and realized that knowledge sharing and application promoted process optimization [36]. Lee and Miozzo proposed that knowledge-intensive business services firms should collaborate with universities and indicated that the cooperation between companies and universities was different from cooperation between companies [37]. Based on evolutionary game theory, Yang et al. built a model to evaluate the collaborative and evolutionary process of government–university–industry and analyzed that industry and university would adopt the collaborative and betrayal strategy [38]. Yu et al. examined an R&D collaboration alliance that consisted of an innovator and a marketer and demonstrated that a marketer chooses a contract strategy based on the trade-off between R&D efficiency and sales efficiency [39]. Raweewan and Ferrell applied game theory and offered a model to weigh the competition and cooperation strategies of cooperative enterprises [40]. Yu et al. investigated a Stackelberg differential game where the manufacturer as the leader determined the wholesale price and the retailer as the follower determined the retail price, and the results showed that the supply chain tended to share the revenue rather than cost sharing [41]. Soh and Subramanian examined a firm’s R&D collaborations with universities and revealed that young and older companies shifted their R&D focus according to their R&D priorities [42]. Dong and Li constructed a wind power industry upstream, midstream, and downstream performance indicator evaluation system, dynamically evaluated the coupling coordination degree of the three subsystems, and concluded that the wind power industry’s mid-upstream coupling coordination degree changed more than the mid-downstream and the three subsystems [43]. Zhang et al. established an R&D evolutionary game model for upstream and downstream and considered that the technology-sharing strategy selected by the R&D team was closely related to the technology-sharing coefficient and the benefits obtained by free-riding [44]. Liao et al. selected 74 companies in the upstream and downstream manufacturing industries of Taiwan’s network communications industry to test their supply chain innovation capabilities and competitive advantages, and the research results showed that supply chain collaborative value innovation can enhance corporate competitive advantages through supply chain capabilities [45]. Zhu and Dou constructed an evolutionary game model between government and enterprise in the green supply chain and demonstrated that enterprise costs, benefits, government subsidies and punishments affected the outcome of the game [46]. Sun et al. built an evolutionary game model of investment between manufacturers and suppliers and found that the input–output ratio of manufacturers, suppliers, and government subsidies would cause different evolutionary game results [47]. In addition, some studies introduce the government as a participant in the evolutionary game model. Liu et al. took carbon-fiber manufacturing enterprises, application enterprises, and governments as three game players and revealed that the appropriate allocation ratio was the key to industrial cooperation and innovation [48]. Hou and Li believed that the government was an advocate of IoT infrastructure construction in China. They established an evolutionary game model that included the government, manufacturers, and operators, and the results showed that each factor had a different impact on them [49]. Li et al. built a game model that included enterprises, academic institutions, and governments to explore the impact of government subsidies on innovation [50].
The literature reviews reveal that chain-integrated innovation refers to the supply-chain-oriented, vertical enterprise division of labor and collaborative innovation. The existing industry chain research has a certain reference value for the development of collaborative innovation; however, first, some scholars utilize upstream and downstream enterprises in the industry chain as the main players of the game [51]. Nevertheless, the stability of the game between upstream and downstream enterprises is greatly affected by government policies and financial support [52,53]. Second, numerous studies regard upstream enterprises and downstream enterprises to be in the same innovative position. However, Zhang et al. found that upstream enterprises pay more attention to R&D [44], and the literature fails to conduct evolutionary game research on collaborative innovation led by upstream enterprises.
The behavior selection of chain-integrated innovation is a dynamic, continuously evolving process. Evolutionary game theory is a theory that combines game theory with the dynamic evolution process [54,55,56]. It assumes bounded rationality and incomplete information, breaking through the assumption of complete rationality [57]. Therefore, the evolutionary game is very practical and important development of classical game theory [58]. The evolutionary stability strategy is realized through continuous learning and adjustment of the participating players, which reflect the dynamic process of behavior selection and conforms to the general behavior rules of evolution [59].
Therefore, it is very necessary to introduce the government as a participant in the evolutionary game model, considering the impact of policy and financial support on collaborative innovation [60]. By constructing a tripartite evolutionary game model that includes the participation willingness of the government, upstream enterprises, and downstream enterprises, this paper analyzes the collaborative innovation mechanism intervened by the government, led by the upstream enterprises, and in which the downstream enterprises participated. Moreover, this study solves the stable strategy of the tripartite evolutionary game in different situations and reveals the factors that influence the choice of manufacturing chain collaborative innovation strategy through numerical analysis.

3. Evolutionary Game Model Construction

3.1. Evolutionary Game Model Assumptions

Chain-integrated innovation is a form of collaborative innovation [61]. In addition to upstream enterprises and downstream enterprises that directly participate in the chain-integrated collaborative innovation, the government has played an important role in chain-integrated innovation [62,63,64,65]. While receiving the tax paid by enterprises for R&D income, the government also provides upstream and downstream enterprises with preferential policies for collaborative innovation and supervises the collaborative innovation process between enterprises [66]. For example, the government regularly assesses the collaborative innovation performance of upstream and downstream enterprises to determine whether to continue to provide funding in the future [67,68]. Based on this, the following assumptions are made:
Hypothesis 1 (H1).
Participating subject. In the process of enhancing the independent controllability of the manufacturing industry chain in the Yangtze River Delta, for the convenience of research, enterprises in the industry chain are simply divided into two parts: one part is upstream enterprises, whose participation can solve scientifically oriented issues of innovation. The other part is downstream enterprises, whose participation can solve industrialization-oriented issues of innovation. Therefore, there are three major agents in the innovation process of the manufacturing industry chain in the Yangtze River Delta (the government G , upstream enterprises T , and downstream enterprises D ). As the main body of industrial chain innovation, upstream enterprises and downstream enterprises can provide technological innovation services for society [69]. The upstream enterprises are mainly responsible for the output of collaborative innovation knowledge and technology [70], and the downstream enterprises are mainly responsible for providing the transformation of collaborative innovation achievement [71]. As the main body of supervision for collaborative innovation in the industrial chain, the government aims to provide policy support and public services for the society [72] and promote collaborative innovation and cooperation between upstream and downstream enterprises. There are cognitive differences between the government, upstream enterprises, and downstream enterprises, and they cannot be completely rational in the decision-making process. There is a problem of information asymmetry between the government, upstream enterprises, and downstream enterprises. Therefore, it is assumed that the government, upstream enterprises, and downstream enterprises are based on bounded rationality.
Hypothesis 2 (H2).
Cooperative strategy. In the process of profit distribution of the main body of the manufacturing industry chain in the Yangtze River Delta, upstream and downstream enterprises choose to maximize their interests based on the assumption of economic man [73]. Upstream and downstream enterprises can choose to cooperate or not. The strategy set is (collaboration, noncollaboration), where collaboration refers to the joint research and development of key technologies by upstream enterprises and downstream enterprises [74], and noncollaboration means that upstream enterprises and downstream enterprises separately carry out research and development of key common plans [75]. The government considers maximization based on the perspective of public interest [76]. It can choose to supervise upstream and downstream enterprises or not. Its strategy set is (supervision, nonsupervision), where government supervision means that the government creates conditions to actively promote the joint development of key common technology research and development by upstream and downstream enterprises [77], and nonsupervision means that the government is indifferent to the development of collaborative innovation between upstream and downstream enterprises.
Hypothesis 3 (H3).
Project benefits. Suppose the government chooses not to supervise upstream enterprises and downstream enterprises to obtain benefits as E 0 G , and upstream enterprises and downstream enterprises choose not to cooperate, then the initial benefits of upstream enterprises and downstream enterprises are E 0 T and E 0 D , respectively. Assuming that the government supervises upstream and downstream enterprises, the enthusiasm of enterprises in R&D is improved, and the increased revenues of the government, upstream, and downstream enterprises are Δ E 1 G , Δ E 1 T , and Δ E 1 D , respectively. If the upstream enterprises choose collaborative innovation and the downstream enterprises choose independent R&D, the benefit of the downstream enterprises’ independent R&D is Δ E 2 D . If the downstream enterprises choose collaborative innovation and the upstream enterprises choose independent R&D, the benefit of the upstream enterprises’ independent R&D is Δ E 2 T . The innovation chain is deployed around the industrial chain, and scientific and technological research is aimed at the middle- and high-end links [78]. It is assumed that the government rewards and supports upstream enterprises that actively participate in collaborative innovation Δ E 2 G .
Hypothesis 4 (H4).
Project cost. Although the government does not directly participate in the collaborative innovation process as the main body of supervision of corporate innovation behavior to attract corporate investment and protect public interests, the government provides supporting policies including financing, construction, and operation, and the cost is recorded as C 1 . As the actors of technology R&D, enterprises must invest a lot of energy, financial resources, and material resources. The cost of collaborative innovation input by upstream enterprises and downstream enterprises is C 2 and C 3 , respectively. If the government provides preferential policies for collaborative innovation of upstream and downstream enterprises, the cost of collaborative innovation of upstream and downstream enterprises is reduced by Δ C T and Δ C D , respectively.
Hypothesis 5 (H5).
Punishment mechanism. To avoid a breach of contract between upstream enterprises and downstream enterprises in the process of collaborative innovation, if upstream enterprises choose collaborative innovation and downstream enterprises choose not to conduct collaborative innovation, downstream enterprises need to pay certain penalties to upstream enterprises [79], which are recorded as M . If downstream enterprises choose collaborative innovation and upstream enterprises choose not to conduct collaborative innovation, the upstream enterprises need to pay certain penalties to the downstream company, which are recorded as N .
Hypothesis 6 (H6).
Net income. Assume that the net benefits of the government choosing to supervise collaborative innovation are higher than the net benefits of choosing not to supervise [80]; that is, Δ E 1 G C 1 Δ E 2 G > 0 . The net income of upstream enterprises choosing to carry out collaborative innovation is higher than the net income of not carrying out collaborative innovation; that is, Δ E 1 T + N Δ E 2 T C 2 > 0 . The net income of downstream enterprises choosing to carry out collaborative innovation is higher than the net income of not carrying out collaborative innovation; that is, Δ E 1 D + M Δ E 2 D C 3 > 0 .

3.2. Construction of Payment Matrix

In the game model, the government, upstream enterprises, and downstream enterprises make strategic choices according to their wishes. Given the probability of supervision upstream and downstream enterprises by the government x , the probability of nonsupervision would be ( 1 x ) . Assuming the probability of collaboration by upstream enterprises y , the probability of noncollaboration would be ( 1 y ) . Given the probability of collaboration by downstream enterprises z , the probability of noncollaboration would be ( 1 z ) , and x , y , z [ 0 , 1 ] . According to the above assumptions, the payout matrix of the evolutionary game of income distribution of technology R&D participants is shown in Table 1 and Table 2.

4. Stability Analysis of Technological Innovation Evolutionary Game Model

4.1. Construction of Income Expectation Function

According to the evolutionary game payment matrix of the collaborative innovation of the industrial chain, let the expected return of the government under supervised strategy be U G 1 , let the expected return of the government under nonsupervised strategy be U G 2 , and let the average expected return of the government be U ¯ G , then:
U G 1 = y z ( E 0 G + Δ E 1 G C 1 Δ E 2 G ) + y ( 1 z ) ( E 0 G + Δ E 1 G C 1 Δ E 2 G ) + ( 1 y ) z ( E 0 G + Δ E 1 G C 1 ) + ( 1 y ) ( 1 z ) ( E 0 G + Δ E 1 G C 1 )
U G 2 = y z E 0 G + y ( 1 z ) E 0 G + ( 1 y ) z E 0 G + ( 1 y ) ( 1 z ) E 0 G
U ¯ G = x U G 1 + ( 1 x ) U G 2
Let the expected return of the upstream enterprises under collaboration strategy be U T 1 , let the expected return of the upstream enterprise under noncollaboration strategy be U T 2 , and let the average return of the upstream enterprise be U ¯ T , then:
U T 1 = x z ( E 0 T + Δ E 1 T C 2 + Δ C T + Δ E 2 G ) + x ( 1 z ) ( E 0 T C 2 + Δ C T + Δ E 2 G + M ) + ( 1 x ) z ( E 0 T + Δ E 1 T C 2 ) + ( 1 x ) ( 1 z ) ( E 0 T C 2 + M )
U T 2 = x z ( E 0 T + Δ E 2 T N ) + x ( 1 z ) E 0 T + ( 1 x ) z ( E 0 T + Δ E 2 T N ) + ( 1 x ) ( 1 z ) E 0 T
U ¯ T = y U T 1 + ( 1 y ) U T 2
Let the expected return of the downstream enterprises under collaboration strategy be U D 1 , let the expected return of the downstream enterprises under noncollaboration strategy be U D 2 , and the average return of the downstream enterprises be U ¯ D , then:
U D 1 = x y ( E 0 D + Δ E 1 D C 3 + Δ C D ) + x ( 1 y ) ( E 0 D C 3 + Δ C D + N ) + ( 1 x ) y ( E 0 D + Δ E 1 D C 3 ) + ( 1 x ) ( 1 y ) ( E 0 D C 3 + N )
U D 2 = x y ( E 0 D + Δ E 2 D M ) + x ( 1 y ) E 0 D + ( 1 x ) y ( E 0 D + Δ E 2 D M ) + ( 1 x ) ( 1 y ) E 0 D
U ¯ D = z U D 1 + ( 1 z ) U D 2

4.2. Solving the Evolutionary Stability Strategy

Under the assumption of bounded rationality, the government, upstream enterprises, and downstream enterprises are repeated games that learn from each other, and the entire strategy process can be simulated by copying dynamic equations. Therefore, the replicator dynamic equation of the government can be written as:
F ( x ) = x ( 1 x ) ( Δ E 1 G C 1 y Δ E 2 G )
The replicator dynamic equation of upstream enterprises can be written as:
F ( y ) = y ( 1 y ) [ x ( Δ C T + Δ E 2 G ) + z ( Δ E 1 T Δ E 2 T M + N ) + M C 2 ]
The replicator dynamic equation of downstream enterprises can be expressed as:
F ( z ) = z ( 1 z ) [ x Δ C D C 3 + y ( Δ E 1 D Δ E 2 D + M N ) + N ]
Friedman proposed to construct the Jacobian matrix (J) of the system structure analysis, according to which the local stability of the evolutionary game can be judged, and then the system evolution stability strategy can be obtained. By combining Equations (10)–(12), together, a dynamic evolutionary game system for the tripartite game has been established, which can be expressed by Equation (13), then:
J = { ( 1 2 x ) ( Δ E 1 G C 1 y Δ E 2 G ) x ( 1 x ) Δ E 2 G 0 y ( 1 y ) ( Δ C T + Δ E 2 G ) ( 1 2 y ) [ x ( Δ C T + Δ E 2 G ) + z ( Δ E 1 T Δ E 2 T M + N ) + M C 2 ] y ( 1 y ) ( Δ E 1 T Δ E 2 T M + N ) z ( 1 z ) Δ C D z ( 1 z ) ( Δ E 1 D Δ E 2 D + M N ) ( 1 2 z ) [ x Δ C D C 3 + y ( Δ E 1 D Δ E 2 D + M N ) + N ] } .

4.3. Stability Analysis of Equilibrium

Let F ( x ) = F ( y ) = F ( z ) = 0 , and the eight equilibrium points for pure strategy solution of the dynamic system have been calculated: E 1 ( 0 , 0 , 0 ) , E 2 ( 0 , 0 , 1 ) , E 3 ( 0 , 1 , 0 ) , E 4 ( 0 , 1 , 1 ) , E 5 ( 1 , 0 , 0 ) , E 6 ( 1 , 0 , 1 ) , E 7 ( 1 , 1 , 0 ) , and E 8 ( 1 , 1 , 1 ) . The eigenvalues of the Jacobian matrix obtained from the equilibrium point are shown in Table 3.
Since there are many parameters involved in the coevolutionary game model of the manufacturing industry chain, the following three scenarios are used to analyze the evolutionary game.
Type 1. Δ C T + Δ E 2 G + M C 2 < 0 and Δ C D + N C 3 < 0 .
As shown in Type 1, when the sum of the cost reduction of the upstream enterprises’ collaborative innovation, the government’s rewards for upstream enterprises, and the penalties paid by downstream enterprises for independent R&D to the upstream enterprises is less than the cost of the upstream enterprises’ collaborative innovation (moreover, when the sum of the cost of collaborative innovation by downstream enterprises and the penalties paid by upstream enterprises for independent R&D to downstream enterprises is less than the cost of collaborative innovation by downstream enterprises), there are two ESSs in the Jacobian matrix. They are E 5 ( 1 , 0 , 0 ) and E 8 ( 1 , 1 , 1 ) , respectively, and the corresponding evolutionary stability strategy is (supervision, noncollaboration, and noncollaboration) and (supervision, collaboration, and collaboration), which can be clearly shown in Type 1 of Table 4.
Type 2. Δ C T + Δ E 2 G + Δ E 1 T + N Δ E 2 T C 2 < 0 and Δ C D + N C 3 > 0 .
As shown in Type 2, when the sum of the cost reduction of collaborative innovation of upstream enterprises, the government’s rewards for upstream enterprises, the benefits of upstream enterprises’ collaborative innovation, and the penalties paid by upstream enterprises for independent R&D to downstream enterprises is less than the sum of upstream enterprises’ individual R&D benefits and costs of collaborative innovation (moreover, when the sum of the cost reduction of collaborative innovation of downstream enterprises and the penalties paid by upstream enterprises for independent R&D to downstream enterprises is greater than the cost of collaborative innovation by downstream enterprises), there are two ESSs in the Jacobian matrix. They are E 6 ( 1 , 0 , 1 ) and E 8 ( 1 , 1 , 1 ) , respectively, and the corresponding evolutionary stability strategy is (supervision, noncollaboration, and noncollaboration) and (supervision, collaboration, and collaboration), which can be clearly shown in Type 2 of Table 4.
Type 3. Δ C T + Δ E 2 G + M C 2 > 0 or Δ C T + Δ E 2 G + Δ E 1 T + N Δ E 2 T C 2 > 0 and Δ C D + N C 3 < 0 .
As shown in Type 3, when the sum of the cost reduction of the upstream enterprises’ collaborative innovation, the government’s reward to the upstream enterprises, and the penalties paid by downstream enterprises for independent R&D to the upstream enterprises is greater than the cost of the upstream enterprises’ collaborative innovation, or when the sum of the cost reduction of the upstream enterprises’ collaborative innovation, the government’s reward to the upstream enterprises, the upstream enterprises’ collaborative innovation benefits, and the penalties paid by upstream enterprises for independent R&D to downstream enterprises is greater than the sum of upstream enterprises’ individual R&D benefits and the cost of collaborative innovation (moreover, when the sum of the cost of collaborative innovation by downstream enterprises and the penalties paid by upstream enterprises for independent R&D to downstream enterprises is less than the cost of collaborative innovation of downstream enterprises), there is an ESS in the Jacobian matrix; that is, E 8 ( 1 , 1 , 1 ) , and the corresponding evolutionary stability strategy is (supervision, collaboration, and collaboration), which can be clearly shown in Type 3 of Table 4.

5. Simulation Analysis

There are differences in resource advantages between provinces and cities in the Yangtze River Delta of China; therefore, each province and city has its own industrial characteristics [81]. Shanghai is rich in scientific and technological resources; by that scale, the manufacturing industry reaches 924.321 billion yuan in 2020, occupying an advantage in the high-end equipment manufacturing industry [82]. Jiangsu’s advanced manufacturing industry is developing rapidly. In 2020, the province’s strategic emerging industries will account for 37.8% of the industrial output value above the designated size, and the output value of high-tech industries will account for 46.5% of the industrial output value above the designated size [83]. Zhejiang’s emerging industries are growing rapidly. In 2020, the total profits of high-tech, strategic emerging, and digital economy core industries are 414.7 billion yuan, 242.9 billion yuan, and 84.1 billion yuan, respectively [84]. In 2020, the added value of Anhui’s manufacturing industry exceeds one trillion yuan, and technological transformation investment ranks second in the Yangtze River Delta [85].
In the process of game collaboration, manufacturing enterprises have to bear certain penalties for their breach of contract to restrict the behavior of upstream and downstream enterprises. Based on the actual situation of collaborative innovation in the manufacturing industry chain in the Yangtze River Delta, the following assumptions are made on the parameter values of the evolutionary game matrix of the industrial chain collaborative innovation (unit: million yuan).
The increase in revenue from the government’s participation in the collaborative innovation of the industrial chain is denoted as Δ E 1 G = 40 , the increase in revenue from the participation of upstream enterprises in collaborative innovation is denoted as Δ E 1 T = 50 , and the increase in revenue from downstream enterprises’ participation in collaborative innovation is denoted as Δ E 1 D = 50 . Moreover, the profit obtained by the upstream enterprises for independent R&D is denoted as Δ E 2 T = 30 , the penalties paid by upstream enterprises for independent R&D to downstream enterprises is denoted as N = 5 , the profit obtained by the downstream enterprises for independent R&D is denoted as Δ E 2 D = 25 , and the penalties paid by downstream enterprises for independent R&D to the upstream enterprises is denoted as M = 5 . The government’s reward for upstream enterprises that actively participate in collaborative innovation is recorded as Δ E 2 G = 8 , the cost of the government participation in industrial chain innovation is recorded as C 1 = 5 , the cost of upstream enterprises’ inputs for collaborative innovation is recorded as C 2 = 24 , and the cost of downstream enterprises’ inputs for collaborative innovation is recorded as C 3 = 20 . When the government participates in the collaborative innovation of the industrial chain, the extent of cost reduction of upstream enterprises is Δ C T = 4 , and the extent of cost reduction of downstream enterprises is Δ C D = 4 .
To clearly illustrate the evolution paths of the government, upstream enterprises, and downstream enterprises in different situations, Matlab R2016a has been used to simulate the dynamic evolution process. According to the results, the participants’ willingness to participate, the government’s reward and punishment mechanism, and the distribution of benefits are discussed.

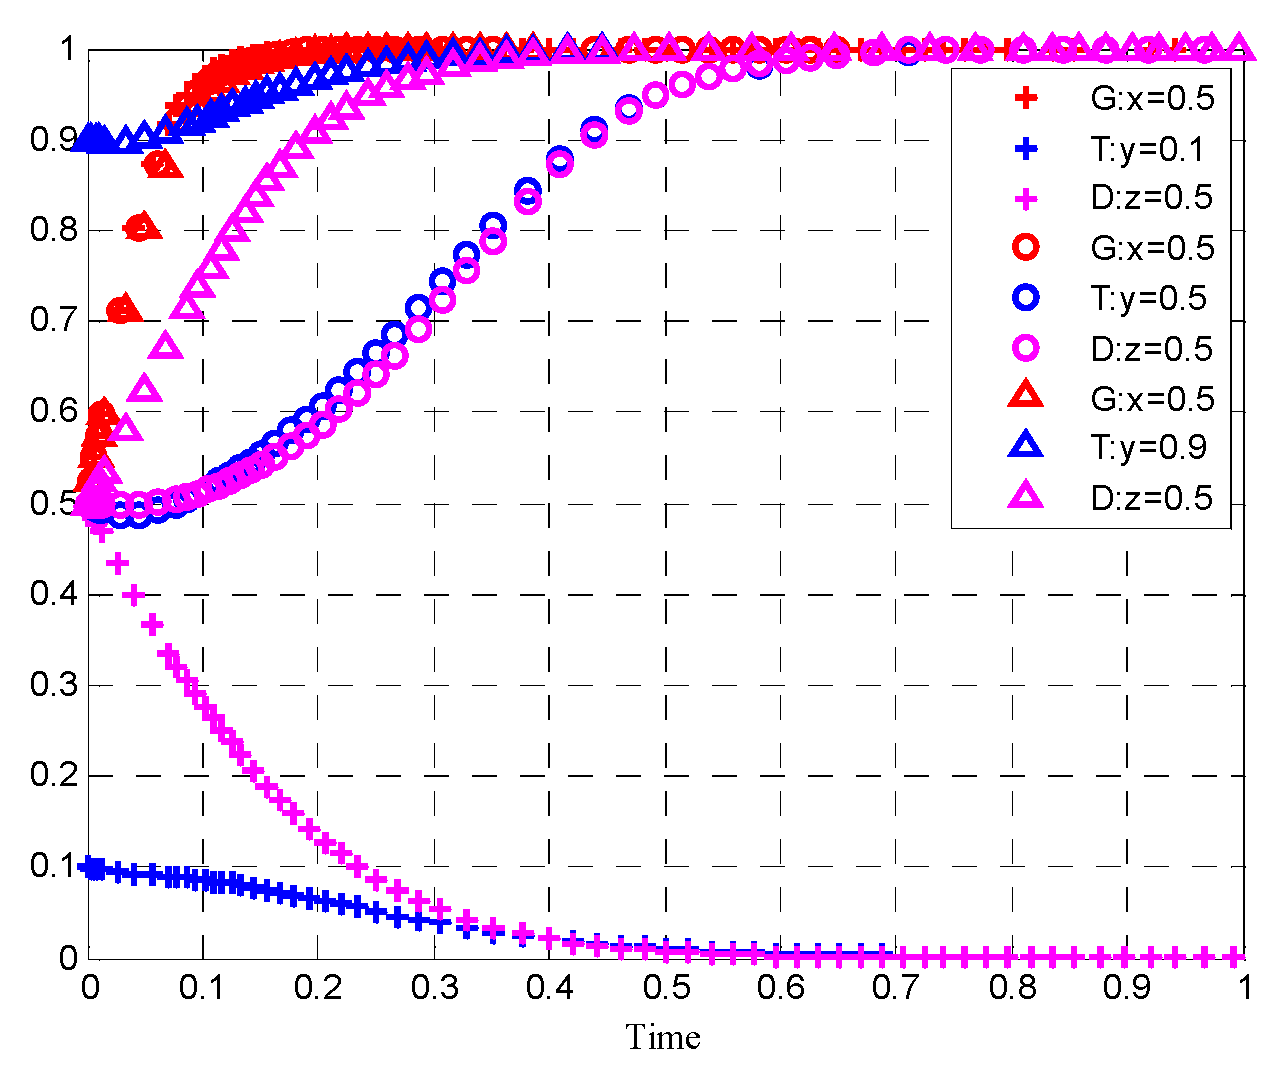
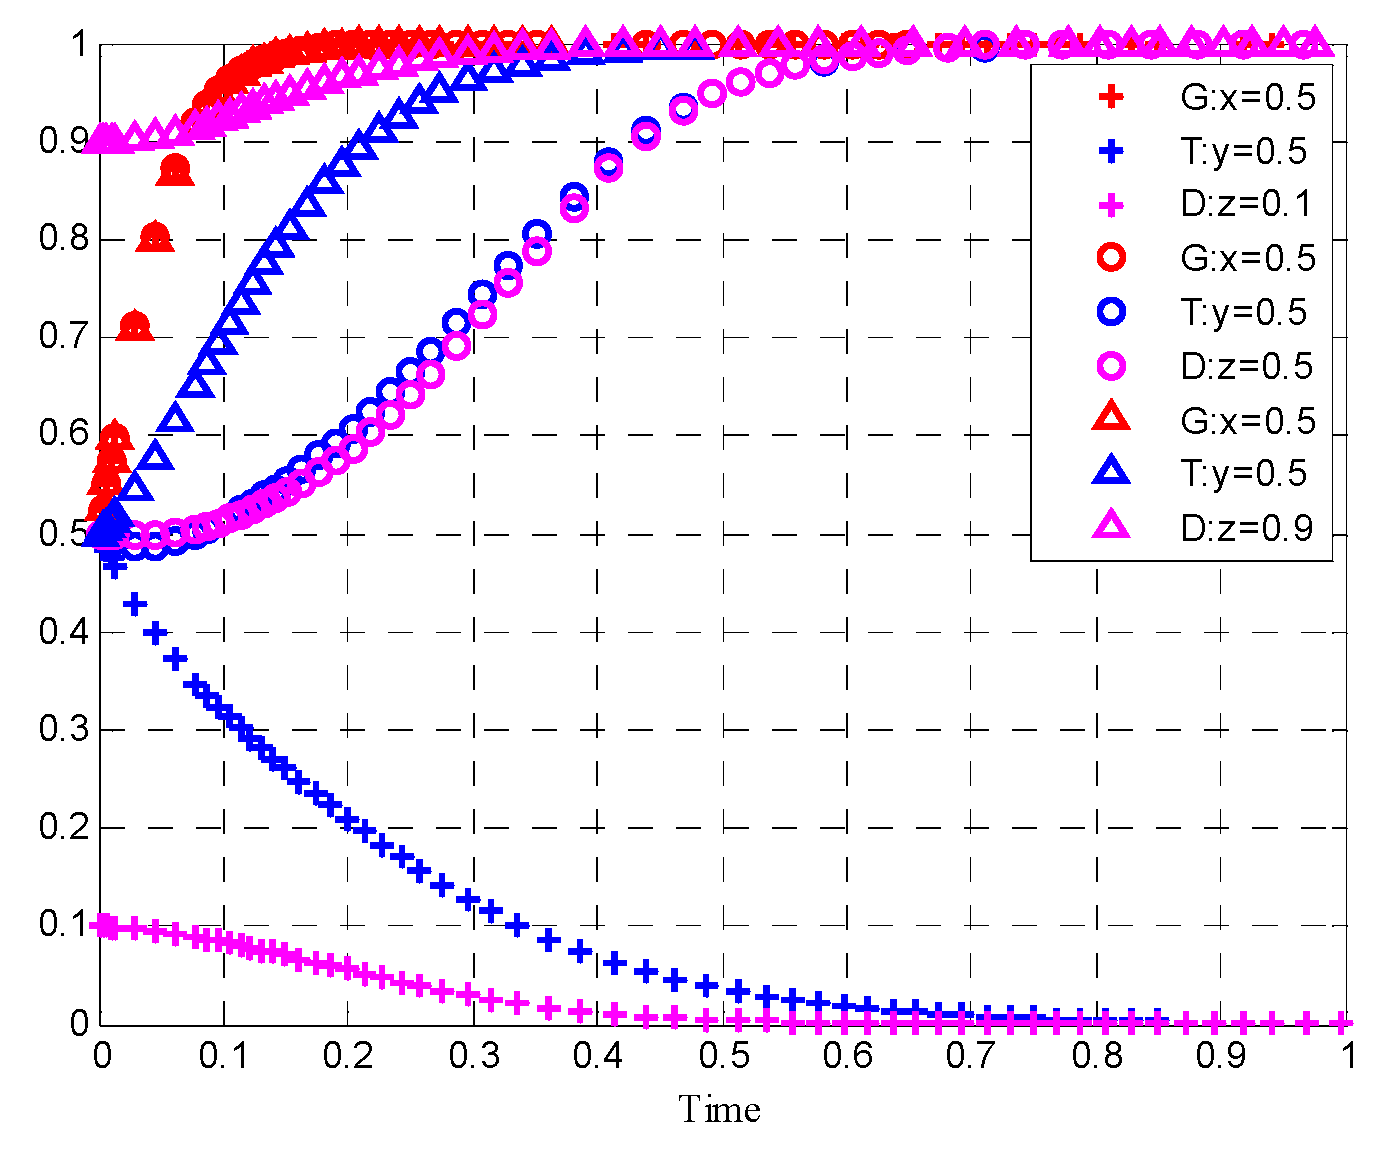
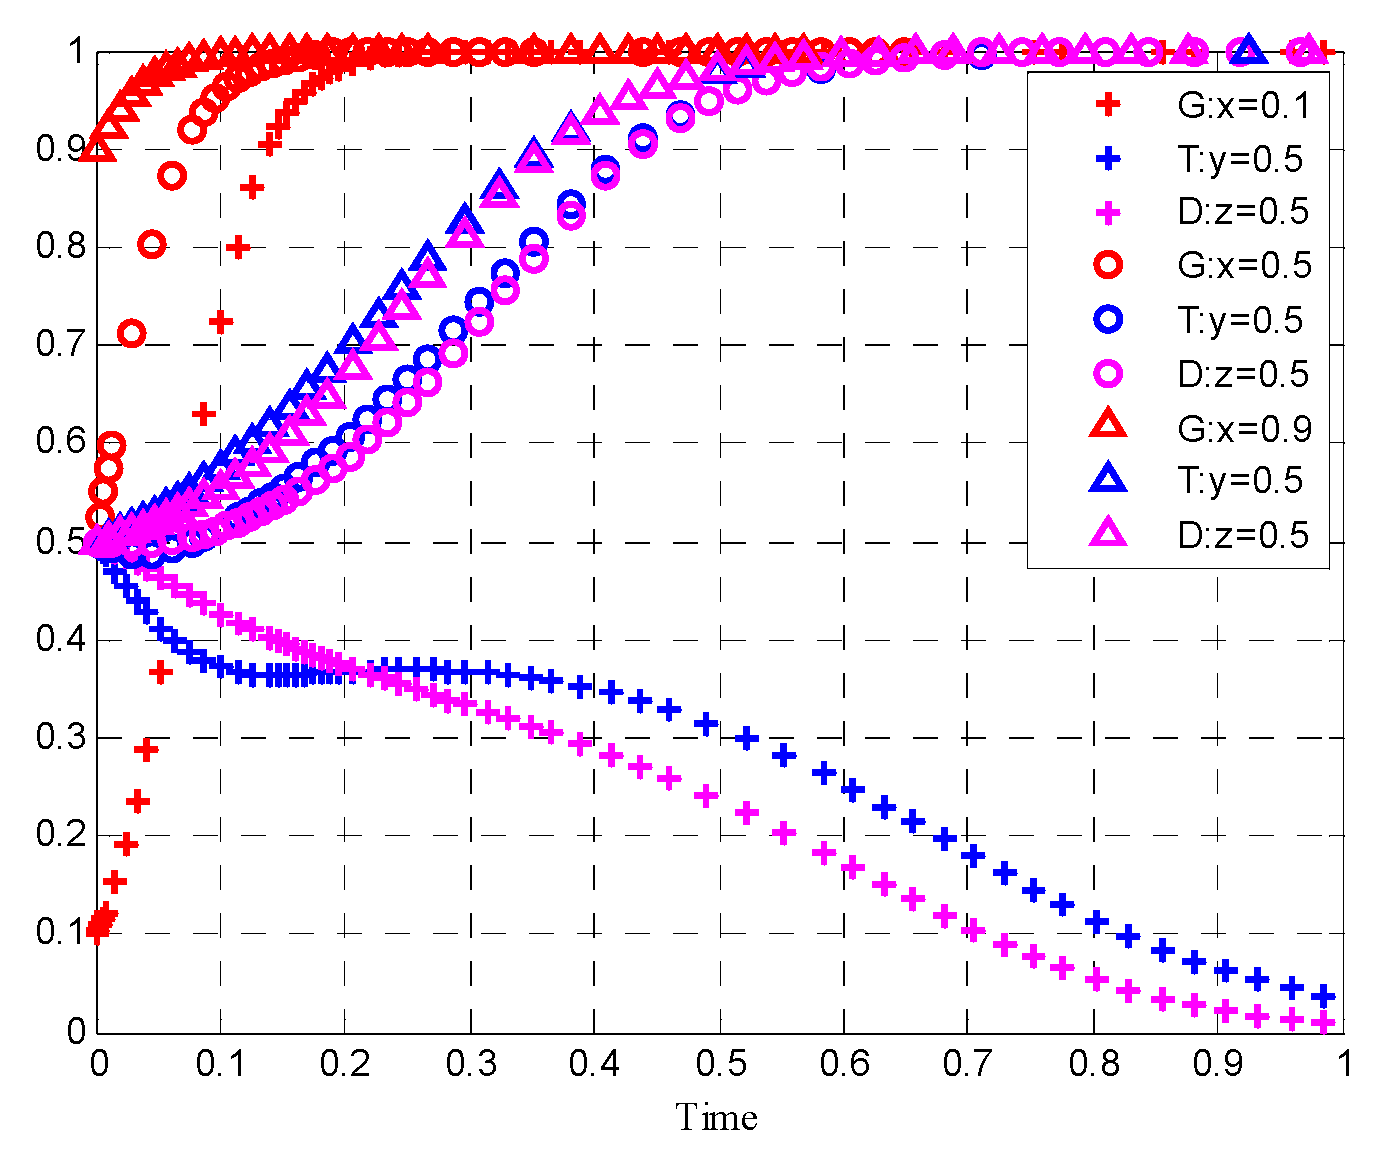
5.1. Analysis of the Dynamic Evolution of Participants’ Initial Willingness

In Figure 1, when other parameters remain unchanged, assuming that the initial willingness of the government, upstream enterprises, and downstream enterprises to participate is x = y = z = 0.3 , the government’s willingness to participate is very strong and converges to 1 in a short period, and the willingness of upstream enterprises and downstream enterprises not to participate in collaborative innovation declines rapidly. The acceleration of downstream enterprises affected by market behavior has exceeded the rate of convergence of upstream enterprises, and ultimately upstream and downstream enterprises have converged to zero. When the initial participation willingness of the government, upstream enterprises, and downstream enterprises rises x = y = z = 0.5 , the government converges to 1 at a faster rate. In the initial stage, the speed of convergence between upstream and downstream enterprises is slow, but as the government participates in the collaborative innovation of the industrial chain, upstream and downstream enterprises gradually converge to 1, and the final stable point is (1,1,1). When the initial participation willingness of the government, upstream enterprises, and downstream enterprises rises x = y = z = 0.7 , the government converges to 1 more quickly, while upstream enterprises and downstream enterprises also converge to 1 at a relatively faster rate. The final stable point is (1,1,1). The simulation results show that as the government, upstream enterprises, and downstream enterprises increase their initial willingness to participate, the government’s tendency to participate in the collaborative innovation of the industrial chain gradually increases. At the same time, upstream enterprises and downstream enterprises have changed from not participating in collaborative innovation to participating in collaborative innovation at a slow pace. When the government plays its leading role, it actively guides and encourages upstream and downstream enterprises to participate in collaborative innovation at a faster rate, as shown in Figure 1.
In Figure 2, assuming that the willingness to participate by the government and downstream enterprises remains unchanged when the willingness of upstream enterprises to participate is 0.1, the government converges to 1 at a faster rate, the upstream enterprises converge to 0 at a slow rate, and the downstream enterprises converge to 0 relatively quickly. The balance point is (1,0,0). When the willingness of upstream enterprises to participate is 0.5, the government converges to 1 at the same speed, and upstream enterprises and downstream enterprises are relatively slow to converge to 1, and the final equilibrium point is (1,1,1). As upstream enterprises’ willingness to participate increases to 0.9, the speed of government convergence to 1 is almost unchanged, while upstream enterprises quickly converge to 1 faster than downstream enterprises, and the final equilibrium point converges to (1,1,1). The simulation results show that as the initial willingness of upstream enterprises to participate increases, upstream enterprises and downstream enterprises gradually increase their willingness to participate. When upstream enterprises’ willingness to participate in collaborative innovation is large enough, both upstream and downstream enterprises ultimately choose to conduct collaborative innovation. Upstream enterprises are more affected by their own willingness to participate in collaborative innovation, while the government’s willingness to participate in collaborative innovation is not affected by upstream enterprises, as shown in Figure 2.
In Figure 3, Assuming that the willingness to participate by the government and upstream enterprises remains unchanged when the willingness to participate by downstream enterprises is 0.1, upstream enterprises and downstream enterprises converge to 0 at a slow rate, and the government converges to 1 at a faster rate. The final equilibrium point is (1,0,0). When the willingness of downstream enterprises to participate is increased to 0.5, both upstream enterprises and downstream enterprises converge to 1, but the speed is relatively slow, and the final equilibrium point of the three agents is (1,1,1). When the willingness of downstream enterprises to participate increases to 0.9, upstream enterprises and downstream enterprises converge to 1 at a relatively fast speed, and the government’s convergence to 1 speed remains unaffected. The simulation results show that as the initial willingness of downstream enterprises to participate increases, upstream enterprises and downstream enterprises gradually increase their willingness to participate, and ultimately both choose to engage in collaborative innovation, but the government’s willingness to participate in collaborative innovation is not affected by downstream enterprises, as shown in Figure 3.
In Figure 4, assuming that the participation willingness of upstream enterprises and downstream enterprises remains unchanged, when the government participation willingness is 0.1, upstream enterprises and downstream enterprises converge to 0 at a slow speed, the government converges to 1, and the final equilibrium point is (1,0,0). When the government’s willingness to participate increases to 0.5, both upstream and downstream enterprises converge to 1 at a relatively slow rate, and the final equilibrium point of the three agents is (1,1,1). When the government’s willingness to participate increases to 0.9, upstream enterprises and downstream enterprises converge to 1 at a relatively fast rate, upstream enterprises converge faster than downstream enterprises, and the government’s rate of convergence to 1 is gradually increased. The simulation results show that as the government’s initial willingness to participate increases, upstream enterprises and downstream enterprises gradually increase their willingness to participate, upstream enterprises are more affected by the government’s willingness to participate, and downstream enterprises are more affected by market behavior. At the same time, when the government’s willingness to participate is large enough, both upstream enterprises and downstream enterprises ultimately choose to carry out collaborative innovation, as shown in Figure 4.

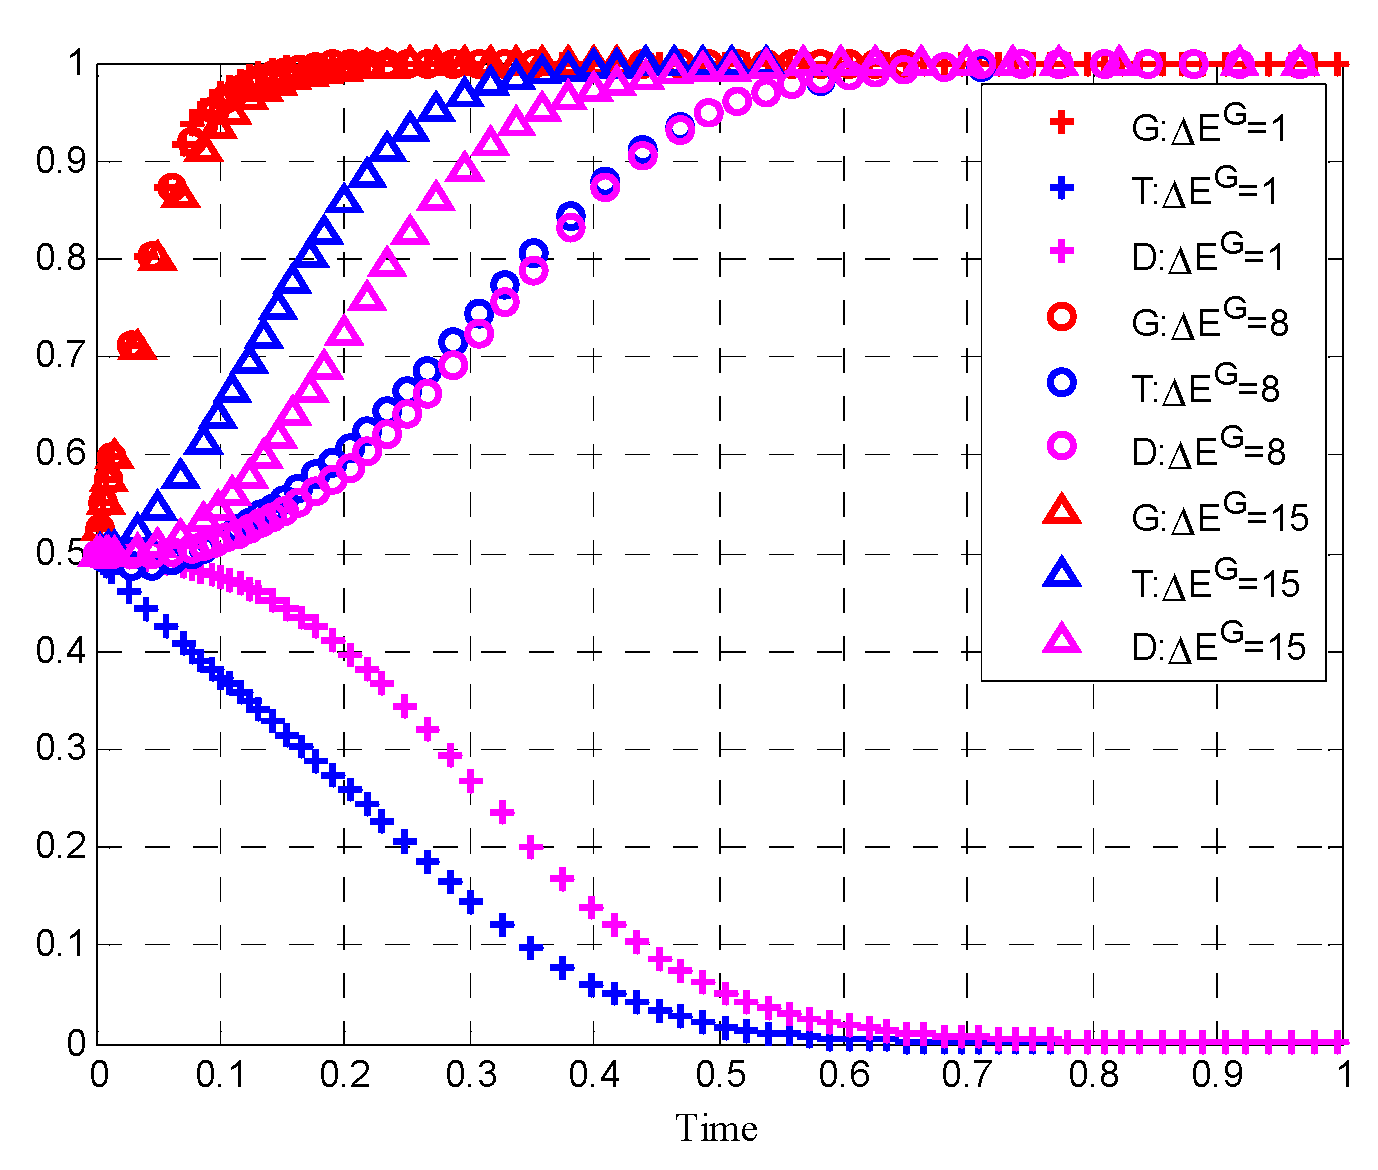
5.2. The Influence of Government Support on Collaborative Innovation in the Industrial Chain

Under the circumstance that other parameters remain unchanged, the government provides policy support to reduce the cost of collaborative innovation in the industrial chain, and the impact on the collaborative innovation strategy of upstream and downstream enterprises is shown in Figure 5. For example, the “Measures for the Parallel Management of Average Fuel Consumption of Passenger Car Enterprises and New Energy Vehicle Credits” was implemented, and the government vigorously promoted the “double credit policy” for new energy vehicles to subsidize research and innovation. Assuming that the government’s support is small and the cost reduction of upstream and downstream enterprises is Δ C T = Δ C D = 1 , then both upstream and downstream enterprises converge to zero, and the convergence rate of downstream enterprises is higher than that of upstream enterprises. With the increase in government policy support Δ C T = Δ C D = 4 , upstream enterprises and downstream enterprises both converge to 1, and the convergence rate of upstream enterprises is slightly higher than that of downstream enterprises. However, when government policy support is sufficiently high, upstream enterprises and downstream enterprises both converge to 1 at a faster rate, and downstream enterprises are more willing to converge to 1. Simulation results show that government policy support has an impact on upstream and downstream enterprises. With the increase in government support, both upstream and downstream enterprises choose to participate in collaborative innovation, and downstream enterprises are more significantly affected by government policies.
Under the circumstance that other parameters remain unchanged, the influence of the government’s financial support on the collaborative innovation strategy of upstream and downstream enterprises is shown in Figure 6. Assuming that the government’s financial support is 1, upstream enterprises and downstream enterprises both converge to 0, but upstream enterprises decline faster than downstream enterprises. With the increase in government funding support, upstream enterprises and downstream enterprises both converge to 1, and upstream enterprises converge faster than downstream enterprises. This means that government funding support has a greater impact on upstream enterprises than downstream enterprises.

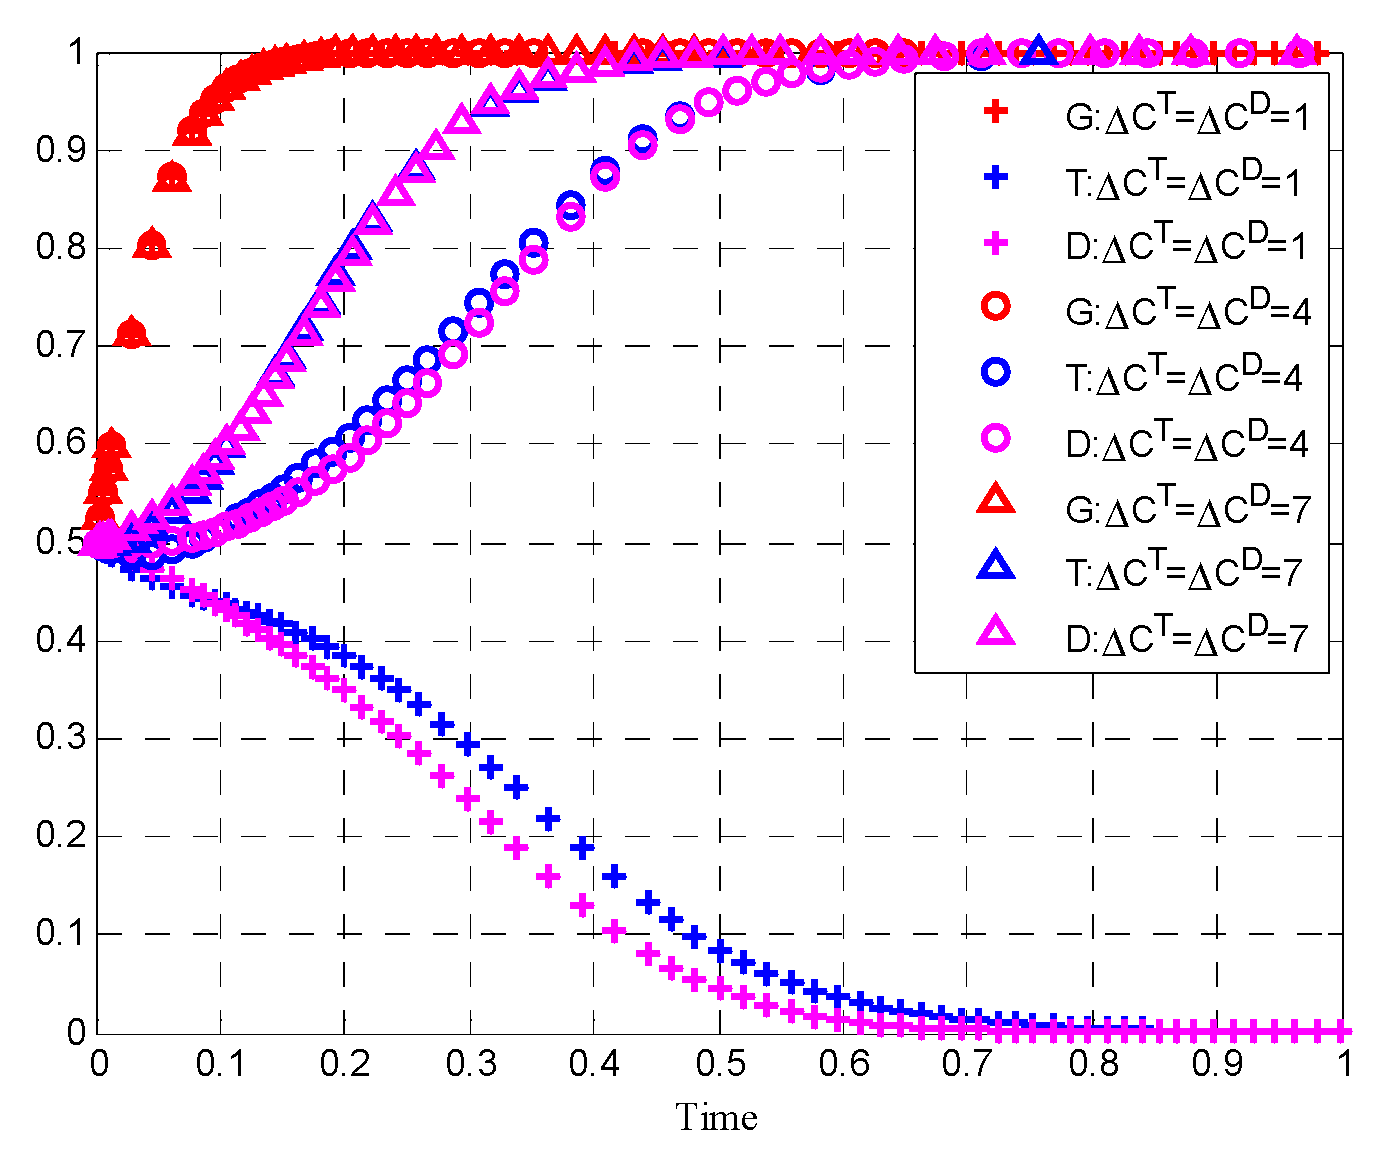
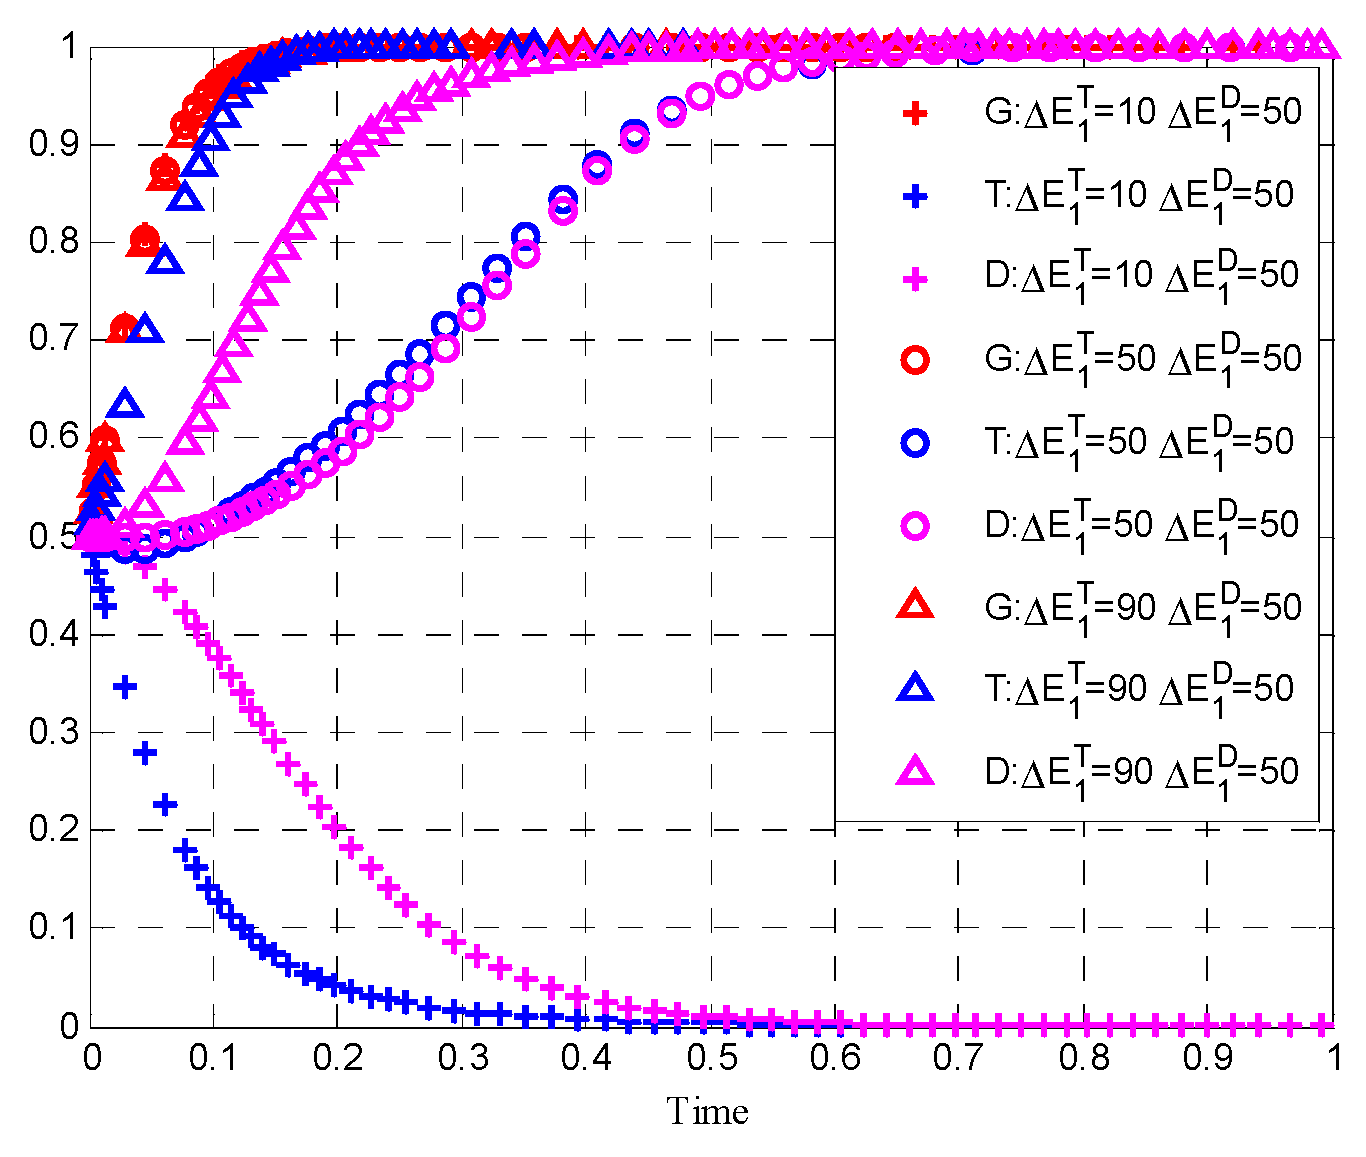
5.3. The Impact of Penalties on Collaborative Innovation in the Industrial Chain

Under the condition that other parameters remain unchanged, by increasing the penalties on upstream enterprises that do not choose collaborative innovation, the following policy simulation results were obtained, as shown in Figure 7. Assuming that the default penalty for upstream enterprises is low at 1, both upstream enterprises and downstream enterprises converge to 0, and downstream enterprises decline faster than upstream enterprises. With the increase in upstream enterprises’ default penalties, both upstream enterprises and downstream enterprises converge to 1, and the convergence rate of upstream enterprises is slightly higher than that of downstream enterprises. Similarly, under the condition that other parameters remain unchanged, the dynamic evolution process of downstream enterprises default penalty on the collaborative innovation of the industrial chain is shown in Figure 8. Assuming that the downstream enterprises’ default penalty is low at 1, both upstream enterprises and downstream enterprises converge to 0, and downstream enterprises decline faster than upstream enterprises. As the penalty for breach of contract by downstream enterprises is raised to 5, both upstream enterprises and downstream enterprises converge to 1, and upstream enterprises converge slightly faster than downstream enterprises. However, as the penalty for breach of contract by downstream enterprises is increased to 9, upstream enterprises and downstream enterprises both converge to 1, and downstream enterprises have a slightly higher rate of convergence than upstream enterprises.
The results indicate that the increase in the penalty on upstream and downstream enterprises has a significant impact on the tripartite result. When the default cost is small, upstream enterprises may not participate in collaborative innovation, and downstream enterprises gradually decrease their willingness to participate. In the end, they tend not to participate in collaborative innovation. When the cost of default for upstream enterprises increases, the willingness of upstream enterprises to participate continues to increase, which drives downstream enterprises’ willingness to participate. When the cost of default for downstream enterprises increases, downstream enterprises are initially not willing to participate, but as upstream enterprises’ willingness to participate increases to a certain extent, downstream enterprises’ willingness to participate increases rapidly, and they all choose to carry out collaborative innovation in the end.

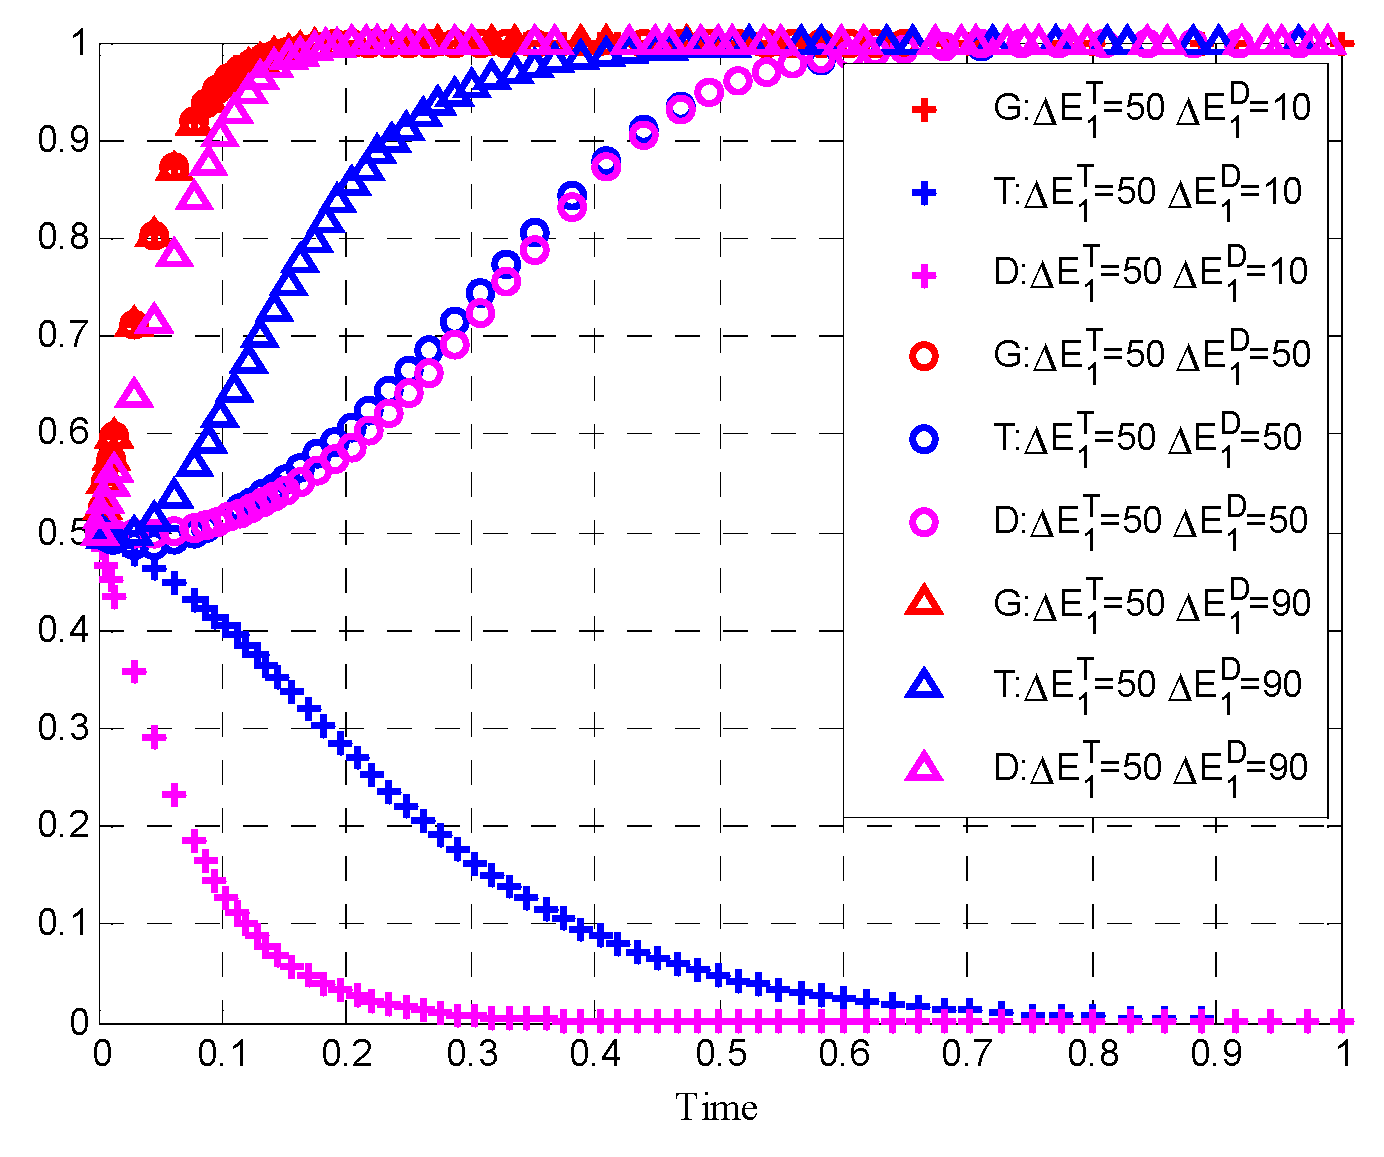
5.4. Impact of Changes in Collaborative Benefits on Collaborative Innovation in the Industrial Chain

In the case of other parameters unchanged, Figure 9 shows the impact of changes in the collaborative benefits of upstream companies on the collaborative innovation of the industrial chain. Assuming that the benefit of upstream enterprises’ collaborative innovation is low at 10, both upstream enterprises and downstream enterprises converge to 0, and upstream enterprises decline faster than downstream enterprises. With the increase in the collaborative benefits of upstream enterprises, compared with downstream enterprises, upstream enterprises converge to 1 at a faster rate, and the final equilibrium point is (1,1,1). Under the condition that other parameters remain unchanged, the impact of changes in downstream enterprises’ collaborative benefits on the collaborative innovation of the industrial chain is shown in Figure 10. Assuming that the downstream enterprises’ collaborative innovation income is low at 10, both upstream enterprises and downstream enterprises converge to 0, and downstream enterprises decline faster than upstream enterprises. With the increase in the collaborative benefits of downstream enterprises, compared with upstream enterprises, downstream enterprises converge to 1 at a faster rate, and the final equilibrium point is (1,1,1). The simulation results show that the willingness of enterprises to participate is significantly affected by changes in returns. When the collaborative benefits are relatively low, upstream enterprises and downstream enterprises tend not to participate in collaborative innovation. As the collaborative benefits of upstream enterprises increase, the willingness of upstream enterprises to participate in collaborative innovation increases rapidly, which in turn drives downstream enterprises to participate in collaborative innovation. At the same time, with the improvement of the collaborative benefits of downstream enterprises, the enthusiasm of downstream enterprises to participate in collaborative innovation increases, thereby driving upstream enterprises to participate in collaborative innovation, and ultimately, both upstream and downstream enterprises choose collaborative innovation.

5.5. Discussion

The tripartite evolutionary game model involving government, upstream companies, and downstream companies were constructed and simulated, using manufacturing data from Shanghai, Jiangsu, Zhejiang, and Anhui provinces. The game model matrix parameter values were assigned, and simulation results were drawn. The government’s willingness to participate in collaborative innovation is significantly higher than that of upstream and downstream companies and has a greater impact on upstream companies and downstream companies, which is related to the government’s promulgation of support and punishment policies. The willingness of upstream companies and downstream companies to participate in collaborative innovation influences each other, and downstream companies are more sensitive to the willingness of upstream companies to participate in collaborative innovation, penalties, and benefits distribution. Zhang et al. built an evolutionary game model to study the technology-sharing strategy and demonstrated that synergy benefits, compensation mechanism, and reward amounts affect the technology sharing of upstream and downstream technical teams [44]. Comparing the other similar study [44], the mutual influence between the government, upstream companies, and downstream companies that converge to 0 or 1 have undergone an in-depth analysis.

6. Conclusions

Based on the assumption of bounded rationality, the evolutionary game theory is used to construct a payment matrix for collaborative innovation games led by the government and in which upstream enterprises and downstream enterprises participated. The evolutionary game process of collaborative innovation between the government, upstream enterprises, and downstream enterprises is systematically analyzed and combined with numerical simulation. Finally, the collaborative innovation strategic behavior and influencing factors of the government, upstream companies and downstream companies are analyzed, and conclusions are drawn. The study innovatively expands the scope of evolutionary game research and enriches the research perspective of manufacturing industry chain innovation.
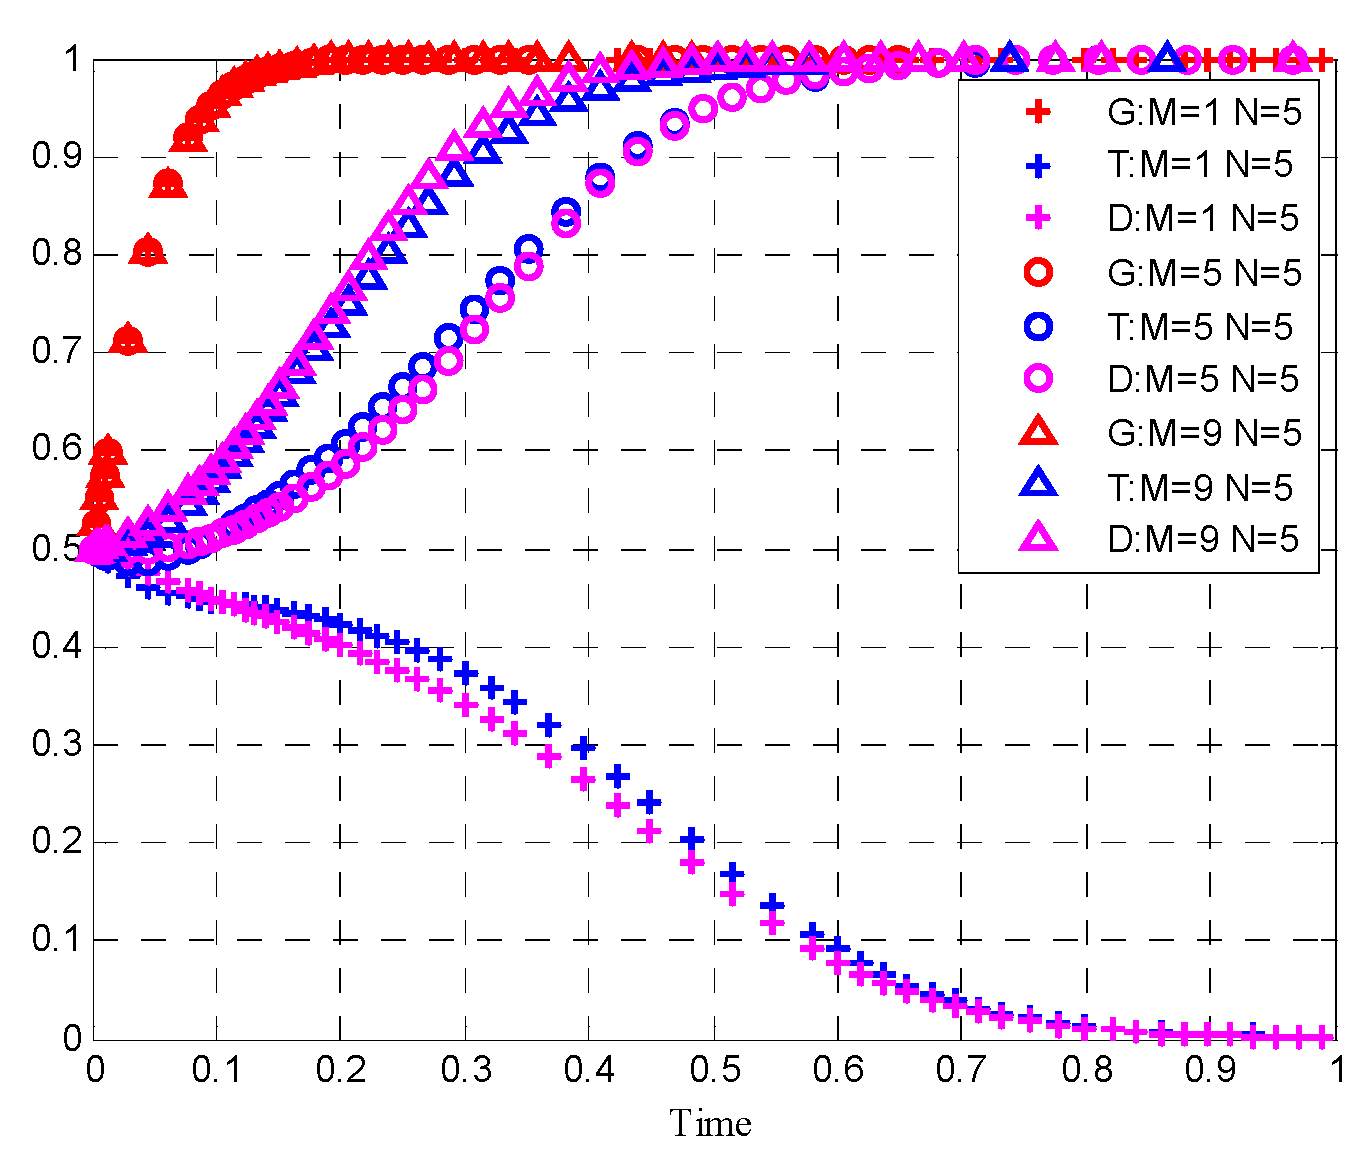
  • The government, upstream enterprises, and downstream enterprises have different degrees of influence on each other’s willingness to participate. This is mainly reflected in two aspects: First, the government’s willingness to participate has a greater impact on upstream enterprises, while downstream enterprises are less affected by the government. For example, the new energy automobile industry has shifted from the financial subsidy funded by application promotion to the postsubsidy era that focuses on R&D. Second, upstream enterprises and downstream enterprises have different influence on each other, and downstream enterprises are more sensitive to upstream enterprises’ willingness to participate in collaborative innovation. With the increase in R&D investment of upstream manufacturing enterprises in the Yangtze River Delta, innovation resources have been brought together, which has led to an increase in the number of downstream enterprises participating.
  • Upstream enterprises are more affected by government funding support, and downstream enterprises are more affected by government policy support. The government provides R&D funding support to upstream enterprises to attract more upstream enterprises to participate in collaborative innovation. Achievement transformation, tax incentives, and other policies have reduced the cost of downstream enterprises participating in collaborative innovation, have increased the conversion rate of new technologies, and have also attracted more downstream enterprises to participate in collaborative innovation.
  • Penalties and benefits distribution has a more significant impact on downstream enterprises compared with upstream enterprises. Upstream enterprises focus on R&D and pursue social value, while downstream enterprises are more affected by the market and pursue their interests.
The study has some limitations, such as the absence of a quantitative empirical analysis of the upstream and downstream industrial chains of the manufacturing industry in the Yangtze River Delta. Additionally, in addition to the initial willingness of participants, government support, penalties, and synergistic benefits, the manufacturing industry chain in the Yangtze River Delta is affected by many other factors. In the future, the influencing factors of the manufacturing industry chain will be fully considered, and the quantitative empirical method will be used for further study.

Author Contributions

Conceptualization, N.Y.; methodology, N.Y.; formal analysis, N.Y.; writing—original draft preparation, N.Y.; writing—review and editing, C.Z.; supervision, C.Z.; funding acquisition, N.Y. All authors have read and agreed to the published version of the manuscript.

Funding

This research was funded by Anhui Province Social Science Innovation and Development Research Project, grant number 2020CX061, and Anhui Province Social Science Innovation and Development Research Project, grant number 2019CX062.

Institutional Review Board Statement

Not applicable.

Informed Consent Statement

Not applicable.

Data Availability Statement

The data are available upon the request from the corresponding author.

Conflicts of Interest

The authors declare no conflict of interest.

References

  1. Chen, Y.; Liu, Y. How biased technological progress sustainably improve the energy efficiency: An empirical research of manufacturing industry in China. Energy 2021, 230, 120823. [Google Scholar] [CrossRef]
  2. Bai, Y.; Song, S.; Jiao, J.; Yang, R. The impacts of government R&D subsidies on green innovation: Evidence from Chinese energy-intensive firms. J. Clean. Prod. 2019, 233, 819–829. [Google Scholar]
  3. Chen, Y.; Wang, M.; Feng, C.; Zhou, H.; Wang, K. Total factor energy efficiency in Chinese manufacturing industry under industry and regional heterogeneities. Resour. Conserv. Recycl. 2021, 168, 105255. [Google Scholar] [CrossRef]
  4. Hu, D.; Jiao, J.; Tang, Y.; Han, X.; Sun, H. The effect of global value chain position on green technology innovation efficiency: From the perspective of environmental regulation. Ecol. Indic. 2021, 121, 107195. [Google Scholar] [CrossRef]
  5. Ying, L.; Li, M.; Yang, J. Agglomeration and driving factors of regional innovation space based on intelligent manufacturing and green economy. Environ. Technol. Innov. 2021, 22, 101398. [Google Scholar] [CrossRef]
  6. Li, F.; Liu, W.; Bi, K. Exploring and visualizing spatial-temporal evolution of patent collaboration networks: A case of China’s intelligent manufacturing equipment industry. Technol. Soc. 2021, 64, 101483. [Google Scholar] [CrossRef]
  7. Lin, S.; Lin, R.; Sun, J.; Wang, F.; Wu, W. Dynamically evaluating technological innovation efficiency of high-tech industry in China: Provincial, regional and industrial perspective. Socio-Econ. Plan. Sci. 2021, 74, 100939. [Google Scholar] [CrossRef]
  8. Durana, P.; Zauskova, A.; Vagner, L.; Zadnanova, S. Earnings Drivers of Slovak Manufacturers: Efficiency Assessment of Innovation Management. Appl. Sci. 2020, 10, 4251. [Google Scholar] [CrossRef]
  9. Kovacova, M.; Segers, C.; Tumpach, M.; Michalkova, L. Big Data-driven Smart Manufacturing: Sustainable Production Processes, Real-Time Sensor Networks, and Industrial Value Creation. Econ. Manag. Financ. Mark. 2020, 15, 54–60. [Google Scholar]
  10. Riley, C.; Vrbka, J.; Rowland, Z. Internet of Things-enabled Sustainability, Big Data-driven Decision-Making Processes, and Digitized Mass Production in Industry 4.0-based Manufacturing Systems. J. Self-Gov. Manag. Econ. 2021, 9, 42–52. [Google Scholar]
  11. Tan, S.; Hu, B.; Kuang, B.; Zhou, M. Regional differences and dynamic evolution of urban land green use efficiency within the Yangtze River Delta, China. Land Use Policy 2021, 106, 105449. [Google Scholar] [CrossRef]
  12. Yu, X.; Wu, Z.; Zheng, H.; Li, M.; Tan, T. How urban agglomeration improve the emission efficiency? A spatial econometric analysis of the Yangtze River Delta urban agglomeration in China. J. Environ. Manag. 2020, 260, 110061. [Google Scholar] [CrossRef]
  13. Dai, X.; Sun, Z. Does firm innovation improve aggregate industry productivity? Evidence from Chinese manufacturing firms. Struct. Chang. Econ. Dyn. 2021, 56, 1–9. [Google Scholar] [CrossRef]
  14. Cheng, M.; Shao, Z.; Gao, F.; Yang, C.; Tong, C.; Yang, J.; Zhang, W. The effect of research and development on the energy conservation potential of China’s manufacturing industry: The case of east region. J. Clean. Prod. 2020, 258, 120558. [Google Scholar] [CrossRef]
  15. Bos, J.W.B.; Economidou, C.; Sanders, M.W.J.L. Innovation over the industry life-cycle: Evidence from EU manufacturing. J. Econ. Behav. Organ. 2013, 86, 78–91. [Google Scholar] [CrossRef]
  16. Bin, G. Technology acquisition channels and industry performance: An industry-level analysis of Chinese large- and medium-size manufacturing enterprises. Res. Policy 2008, 37, 194–209. [Google Scholar] [CrossRef]
  17. Obradović, T.; Vlačić, B.; Dabić, M. Open innovation in the manufacturing industry: A review and research agenda. Technovation 2021, 102, 102221. [Google Scholar] [CrossRef]
  18. Wang, W.; Yu, B.; Yan, X.; Yao, X.; Liu, Y. Estimation of innovation’s green performance: A range-adjusted measure approach to assess the unified efficiency of China’s manufacturing industry. J. Clean. Prod. 2017, 149, 919–924. [Google Scholar] [CrossRef]
  19. Li, L. China’s manufacturing locus in 2025: With a comparison of “Made-in-China 2025” and “Industry 4.0”. Technol. Forecast. Soc. Chang. 2018, 135, 66–74. [Google Scholar] [CrossRef]
  20. Duan, Y.; Liu, S.; Cheng, H.; Chin, T.; Luo, X. The moderating effect of absorptive capacity on transnational knowledge spillover and the innovation quality of high-tech industries in host countries: Evidence from the Chinese manufacturing industry. Int. J. Prod. Econ. 2021, 233, 108019. [Google Scholar] [CrossRef]
  21. Yang, Z.; Lin, Y. The effects of supply chain collaboration on green innovation performance:An interpretive structural modeling analysis. Sustain. Prod. Consum. 2020, 23, 1–10. [Google Scholar] [CrossRef]
  22. Huiling, L.; Dan, L. Value chain reconstruction and sustainable development of green manufacturing industry. Sustain. Comput. Inform. Syst. 2020, 28, 100418. [Google Scholar] [CrossRef]
  23. Luo, Q.; Miao, C.; Sun, L.; Meng, X.; Duan, M. Efficiency evaluation of green technology innovation of China’s strategic emerging industries: An empirical analysis based on Malmquist-data envelopment analysis index. J. Clean. Prod. 2019, 238, 117782. [Google Scholar] [CrossRef]
  24. Yin, S.; Zhang, N.; Li, B.; Dong, H. Enhancing the effectiveness of multi-agent cooperation for green manufacturing: Dynamic co-evolution mechanism of a green technology innovation system based on the innovation value chain. Environ. Impact Assess. Rev. 2021, 86, 106475. [Google Scholar] [CrossRef]
  25. Yin, S.; Zhang, N.; Li, B. Enhancing the competitiveness of multi-agent cooperation for green manufacturing in China: An empirical study of the measure of green technology innovation capabilities and their influencing factors. Sustain. Prod. Consum. 2020, 23, 63–76. [Google Scholar] [CrossRef]
  26. Turken, N.; Geda, A. Supply chain implications of industrial symbiosis: A review and avenues for future research. Resour. Conserv. Recycl. 2020, 161, 104974. [Google Scholar] [CrossRef]
  27. Skippari, M.; Laukkanen, M.; Salo, J. Cognitive barriers to collaborative innovation generation in supply chain relationships. Ind. Mark. Manag. 2017, 62, 108–117. [Google Scholar] [CrossRef]
  28. Wang, C.; Hu, Q. Knowledge sharing in supply chain networks: Effects of collaborative innovation activities and capability on innovation performance. Technovation 2020, 94–95, 102010. [Google Scholar] [CrossRef]
  29. Cao, M.; Zhang, Q. Supply chain collaborative advantage: A firm’s perspective. Int. J. Prod. Econ. 2010, 128, 358–367. [Google Scholar] [CrossRef]
  30. Chen, L.; Zhao, X.; Tang, O.; Price, L.; Zhang, S.; Zhu, W. Supply chain collaboration for sustainability: A literature review and future research agenda. Int. J. Prod. Econ. 2017, 194, 73–87. [Google Scholar] [CrossRef]
  31. Kapoor, R.; McGrath, P.J. Unmasking the interplay between technology evolution and R&D collaboration: Evidence from the global semiconductor manufacturing industry, 1990–2010. Res. Policy 2014, 43, 555–569. [Google Scholar]
  32. Cao, M.; Zhang, Q. Supply chain collaboration: Impact on collaborative advantage and firm performance. J. Oper. Manag. 2011, 29, 163–180. [Google Scholar] [CrossRef]
  33. Ge, Z.; Hu, Q.; Goh, C.-H.; Zhao, R. Action-dependent commitment in vertical collaborations: The effect of demand-creating innovations in a supply chain. Transp. Res. Part E Logist. Transp. Rev. 2021, 147, 102164. [Google Scholar] [CrossRef]
  34. Shen, B.; Xu, X.; Chan, H.L.; Choi, T.-M. Collaborative innovation in supply chain systems: Value creation and leadership structure. Int. J. Prod. Econ. 2021, 235, 108068. [Google Scholar] [CrossRef]
  35. Hong, J.; Zheng, R.; Deng, H.; Zhou, Y. Green supply chain collaborative innovation, absorptive capacity and innovation performance: Evidence from China. J. Clean. Prod. 2019, 241, 118377. [Google Scholar] [CrossRef]
  36. Xu, J.; Hou, Q.; Niu, C.; Wang, Y.; Xie, Y. Process optimization of the University-Industry-Research collaborative innovation from the perspective of knowledge management. Cogn. Syst. Res. 2018, 52, 995–1003. [Google Scholar] [CrossRef]
  37. Lee, H.-F.; Miozzo, M. Which types of knowledge-intensive business services firms collaborate with universities for innovation? Res. Policy 2019, 48, 1633–1646. [Google Scholar] [CrossRef]
  38. Yang, Z.; Chen, H.; Du, L.; Lin, C.; Lu, W. How does alliance-based government-university-industry foster cleantech innovation in a green innovation ecosystem? J. Clean. Prod. 2021, 283, 124559. [Google Scholar] [CrossRef]
  39. Yu, X.; Lan, Y.; Zhao, R. Strategic green technology innovation in a two-stage alliance: Vertical collaboration or co-development? Omega 2021, 98, 102116. [Google Scholar] [CrossRef]
  40. Raweewan, M.; Ferrell, W.G. Information sharing in supply chain collaboration. Comput. Ind. Eng. 2018, 126, 269–281. [Google Scholar] [CrossRef]
  41. Yu, B.; Wang, J.; Lu, X.; Yang, H. Collaboration in a low-carbon supply chain with reference emission and cost learning effects: Cost sharing versus revenue sharing strategies. J. Clean. Prod. 2020, 250, 119460. [Google Scholar] [CrossRef]
  42. Soh, P.-H.; Subramanian, A.M. When do firms benefit from university–industry R&D collaborations? The implications of firm R&D focus on scientific research and technological recombination. J. Bus. Ventur. 2014, 29, 807–821. [Google Scholar]
  43. Dong, F.; Li, W. Research on the coupling coordination degree of “upstream-midstream-downstream” of China’s wind power industry chain. J. Clean. Prod. 2021, 283, 124633. [Google Scholar] [CrossRef]
  44. Zhang, H.; Wang, M.; Cheng, Z.; Wan, L. Technology-sharing strategy and incentive mechanism for R&D teams of manufacturing enterprises. Phys. A Stat. Mech. Appl. 2020, 555, 124546. [Google Scholar]
  45. Liao, S.-H.; Hu, D.-C.; Ding, L.-W. Assessing the influence of supply chain collaboration value innovation, supply chain capability and competitive advantage in Taiwan’s networking communication industry. Int. J. Prod. Econ. 2017, 191, 143–153. [Google Scholar] [CrossRef]
  46. Zhu, Q.-H.; Dou, Y.-J. Evolutionary Game Model between Governments and Core Enterprises in Greening Supply Chains. Syst. Eng.-Theory Pract. 2007, 27, 85–89. [Google Scholar] [CrossRef]
  47. Sun, H.; Wan, Y.; Zhang, L.; Zhou, Z. Evolutionary game of the green investment in a two-echelon supply chain under a government subsidy mechanism. J. Clean. Prod. 2019, 235, 1315–1326. [Google Scholar] [CrossRef]
  48. Liu, X.; Fang, Z.; Zhang, N.; Liu, K.; Jingfeng, Z. An evolutionary game model and its numerical simulation for collaborative innovation of multiple agents in carbon fiber industry in China. Sustain. Comput. Inform. Syst. 2019, 24, 100350. [Google Scholar] [CrossRef]
  49. Hou, J.; Li, B. The Evolutionary Game for Collaborative Innovation of the IoT Industry under Government Leadership in China: An IoT Infrastructure Perspective. Sustainability 2020, 12, 3648. [Google Scholar] [CrossRef]
  50. Li, J.; Ren, H.; Zhang, C.; Li, Q.; Duan, K. Substantive Innovation or Strategic Innovation? Research on Multiplayer Stochastic Evolutionary Game Model and Simulation. Complexity 2020, 2020, 9640412. [Google Scholar]
  51. De Jesus Pacheco, D.A.; Ten Caten, C.S.; Jung, C.F.; Navas, H.V.G.; Cruz-Machado, V.A. Eco-innovation determinants in manufacturing SMEs from emerging markets: Systematic literature review and challenges. J. Eng. Technol. Manag. 2018, 48, 44–63. [Google Scholar] [CrossRef]
  52. Wei, J.; Wang, C. Improving interaction mechanism of carbon reduction technology innovation between supply chain enterprises and government by means of differential game. J. Clean. Prod. 2021, 296, 126578. [Google Scholar] [CrossRef]
  53. Tian, Y.; Wang, Y.; Xie, X.; Jiao, J.; Jiao, H. The impact of business-government relations on firms’ innovation: Evidence from Chinese manufacturing industry. Technol. Forecast. Soc. Chang. 2019, 143, 1–8. [Google Scholar] [CrossRef]
  54. Chen, H.; Wang, J.; Miao, Y. Evolutionary game analysis on the selection of green and low carbon innovation between manufacturing enterprises. Alex. Eng. J. 2021, 60, 2139–2147. [Google Scholar] [CrossRef]
  55. Fan, K.; Hui, E.C.M. Evolutionary game theory analysis for understanding the decision-making mechanisms of governments and developers on green building incentives. Build. Environ. 2020, 179, 106972. [Google Scholar] [CrossRef]
  56. Zhang, Y.; Chen, W.; Mi, Y. Third-party remanufacturing mode selection for competitive closed-loop supply chain based on evolutionary game theory. J. Clean. Prod. 2020, 263, 121305. [Google Scholar] [CrossRef]
  57. Chen, W.; Hu, Z.-H. Using evolutionary game theory to study governments and manufacturers’ behavioral strategies under various carbon taxes and subsidies. J. Clean. Prod. 2018, 201, 123–141. [Google Scholar] [CrossRef]
  58. Sheng, J.; Zhou, W.; Zhu, B. The coordination of stakeholder interests in environmental regulation: Lessons from China’s environmental regulation policies from the perspective of the evolutionary game theory. J. Clean. Prod. 2020, 249, 119385. [Google Scholar] [CrossRef]
  59. Sigmund, K.; Nowak, M.A. Evolutionary game theory. Curr. Biol. 1999, 9, R503–R505. [Google Scholar] [CrossRef] [Green Version]
  60. Yuyin, Y.; Jinxi, L. The effect of governmental policies of carbon taxes and energy-saving subsidies on enterprise decisions in a two-echelon supply chain. J. Clean. Prod. 2018, 181, 675–691. [Google Scholar] [CrossRef]
  61. Lv, B.; Qi, X. Research on partner combination selection of the supply chain collaborative product innovation based on product innovative resources. Comput. Ind. Eng. 2019, 128, 245–253. [Google Scholar] [CrossRef]
  62. Liu, C.; Li, L. Place-based techno-industrial policy and innovation: Government responses to the information revolution in China. China Econ. Rev. 2021, 66, 101600. [Google Scholar] [CrossRef]
  63. Silva, M.E.; Silvestre, B.S.; Del Vecchio Ponte, R.C.; Cabral, J.E.O. Managing micro and small enterprise supply chains: A multi-level approach to sustainability, resilience and regional development. J. Clean. Prod. 2021, 311, 127567. [Google Scholar] [CrossRef]
  64. Zheng, W.; Zhang, J. Does tax reduction spur innovation? Firm-level evidence from China. Financ. Res. Lett. 2021, 39, 101575. [Google Scholar] [CrossRef]
  65. Lin, B.; Luan, R. Are government subsidies effective in improving innovation efficiency? Based on the research of China’s wind power industry. Sci. Total Environ. 2020, 710, 136339. [Google Scholar] [CrossRef]
  66. Zu, Y.; Chen, L.; Fan, Y. Research on low-carbon strategies in supply chain with environmental regulations based on differential game. J. Clean. Prod. 2018, 177, 527–546. [Google Scholar] [CrossRef]
  67. Kang, K.-N.; Park, H. Influence of government R&D support and inter-firm collaborations on innovation in Korean biotechnology SMEs. Technovation 2012, 32, 68–78. [Google Scholar]
  68. Wang, X.; Li, Z.; Shaikh, R.; Ranjha, A.R.; Batala, L.K. Do government subsidies promote financial performance? Fresh evidence from China’s new energy vehicle industry. Sustain. Prod. Consum. 2021, 28, 142–153. [Google Scholar] [CrossRef]
  69. Zhang, S.; Yang, D.; Qiu, S.; Bao, X.; Li, J. Open innovation and firm performance: Evidence from the Chinese mechanical manufacturing industry. J. Eng. Technol. Manag. 2018, 48, 76–86. [Google Scholar] [CrossRef]
  70. Wang, Y.; Pan, J.-F.; Pei, R.-M.; Yi, B.-W.; Yang, G.-L. Assessing the technological innovation efficiency of China’s high-tech industries with a two-stage network DEA approach. Socio-Econ. Plan. Sci. 2020, 71, 100810. [Google Scholar] [CrossRef]
  71. Feng, P.; Ke, S. Self-selection and performance of R&D input of heterogeneous firms: Evidence from China’s manufacturing industries. China Econ. Rev. 2016, 41, 181–195. [Google Scholar]
  72. Zhao, X.; Xue, Y.; Ding, L. Implementation of low carbon industrial symbiosis systems under financial constraint and environmental regulations: An evolutionary game approach. J. Clean. Prod. 2020, 277, 124289. [Google Scholar] [CrossRef]
  73. Liu, T.; Li, K.-W. Analyzing Chinas productivity growth: Evidence from manufacturing industries. Econ. Syst. 2012, 36, 531–551. [Google Scholar] [CrossRef]
  74. Kumar, G.; Meena, P.; Difrancesco, R.M. How do collaborative culture and capability improve sustainability? J. Clean. Prod. 2021, 291, 125824. [Google Scholar] [CrossRef]
  75. Zhou, H.; Li, L. The impact of supply chain practices and quality management on firm performance: Evidence from China’s small and medium manufacturing enterprises. Int. J. Prod. Econ. 2020, 230, 107816. [Google Scholar] [CrossRef]
  76. Wang, L.; Szirmai, A. Capital inputs in the Chinese economy: Estimates for the total economy, industry and manufacturing. China Econ. Rev. 2012, 23, 81–104. [Google Scholar] [CrossRef]
  77. Liu, D.; Chen, T.; Liu, X.; Yu, Y. Do more subsidies promote greater innovation? Evidence from the Chinese electronic manufacturing industry. Econ. Model. 2019, 80, 441–452. [Google Scholar] [CrossRef]
  78. Zeng, W.; Li, L.; Huang, Y. Industrial collaborative agglomeration, marketization, and green innovation: Evidence from China’s provincial panel data. J. Clean. Prod. 2021, 279, 123598. [Google Scholar] [CrossRef]
  79. Wei, S.; Zhang, Z.; Ke, G.Y.; Chen, X. The more cooperation, the better? Optimizing enterprise cooperative strategy in collaborative innovation networks. Phys. Stat. Mech. Appl. 2019, 534, 120810. [Google Scholar] [CrossRef]
  80. Hong, J.; Liao, Y.; Zhang, Y.; Yu, Z. The effect of supply chain quality management practices and capabilities on operational and innovation performance: Evidence from Chinese manufacturers. Int. J. Prod. Econ. 2019, 212, 227–235. [Google Scholar] [CrossRef]
  81. Wu, W.; Zhang, T.; Xie, X.; Huang, Z. Regional low carbon development pathways for the Yangtze River Delta region in China. Energy Policy 2021, 151, 112172. [Google Scholar] [CrossRef]
  82. 2020 Shanghai Statistical Communiqué on National Economic and Social Development. Available online: http://tjj.sh.gov.cn/tjgb/20210317/234a1637a3974c3db0cc47a37a3c324f.html (accessed on 25 august 2021).
  83. 2020 Statistical Communiqué on National Economic and Social Development of Jiangsu Province. Available online: http://tj.jiangsu.gov.cn/art/2021/3/10/art_4031_9698925.html (accessed on 25 august 2021).
  84. 2020 Statistical Communiqué on the National Economic and Social Development of Zhejiang Province. Available online: http://tjj.zj.gov.cn/art/2021/2/28/art_1229129205_4524495.html (accessed on 25 august 2021).
  85. Statistical Communiqué on the 2020 National Economic and Social Development of Anhui Province. Available online: https://www.ah.gov.cn/zfsj/tjgb/2020n/553965781.html (accessed on 25 august 2021).
Figure 1. The dynamic evolution process of the initial participation willingness of the three agents.
Sustainability 13 09729 g001
Figure 2. The dynamic evolution process of upstream enterprises’ initial willingness to participate.
Sustainability 13 09729 g002
Figure 3. The dynamic evolution process of initial participation willingness of downstream enterprises.
Sustainability 13 09729 g003
Figure 4. The dynamic evolution process of the government’s initial willingness to participate.
Sustainability 13 09729 g004
Figure 5. The dynamic evolution process of government policy support.
Sustainability 13 09729 g005
Figure 6. The dynamic evolution process of government funding support.
Sustainability 13 09729 g006
Figure 7. The dynamic evolution process of upstream enterprises’ default penalties.
Sustainability 13 09729 g007
Figure 8. The dynamic evolution process of downstream enterprises’ default penalties.
Sustainability 13 09729 g008
Figure 9. The dynamic evolution process of changes in upstream enterprises’ collaborative benefits.
Sustainability 13 09729 g009
Figure 10. The dynamic evolution process of downstream enterprises’ collaborative benefits.
Sustainability 13 09729 g010
Table 1. The payment matrix of the evolutionary game of industrial chain collaborative innovation with government participation.
StrategyDownstream Enterprises
Collaboration   ( z ) Noncollaboration   ( 1 z )
Upstream enterprisesCollaboration ( y ) E 0 G + Δ E 1 G C 1 Δ E 2 G E 0 G + Δ E 1 G C 1 Δ E 2 G
E 0 T + Δ E 1 T C 2 + Δ C T + Δ E 2 G E 0 T C 2 + Δ C T + Δ E 2 G + M
E 0 D + Δ E 1 D C 3 + Δ C D E 0 D + Δ E 2 D M
Noncollaboration ( 1 y ) E 0 G + Δ E 1 G C 1 E 0 G + Δ E 1 G C 1
E 0 T + Δ E 2 T N E 0 T
E 0 D C 3 + Δ C D + N E 0 D
Table 2. The payment matrix of the evolutionary game of industrial chain collaborative innovation without government participation.
StrategyDownstream Enterprises
Collaboration   ( z ) Noncollaboration   ( 1 z )
Upstream enterprisesCollaboration ( y ) E 0 G E 0 G
E 0 T + Δ E 1 T C 2 E 0 T C 2 + M
E 0 D + Δ E 1 D C 3 E 0 D + Δ E 2 D M
Noncollaboration ( 1 y ) E 0 G E 0 G
E 0 T + Δ E 2 T N E 0 T
E 0 D C 3 + N E 0 D
Table 3. The eigenvalues of the Jacobian matrix.
Equilibrium PointEigenvalues λ1Eigenvalues λ2Eigenvalues λ3
E 1 ( 0 , 0 , 0 ) Δ E 1 G C 1 C 2 + M C 3 + N
E 2 ( 0 , 0 , 1 ) Δ E 1 G C 1 Δ E 1 T + N Δ E 2 T C 2 ( C 3 + N )
E 3 ( 0 , 1 , 0 ) Δ E 1 G C 1 Δ E 2 G ( C 2 + M ) Δ E 1 D C 3 Δ E 2 D + M
E 4 ( 0 , 1 , 1 ) Δ E 1 G C 1 Δ E 2 G ( Δ E 1 T + N Δ E 2 T C 2 ) ( Δ E 1 D C 3 Δ E 2 D + M )
E 5 ( 1 , 0 , 0 ) ( Δ E 1 G C 1 ) Δ C T + Δ E 2 G + M C 2 Δ C D + N C 3
E 6 ( 1 , 0 , 1 ) ( Δ E 1 G C 1 ) Δ C T + Δ E 2 G + Δ E 1 T Δ E 2 T + N C 2 ( Δ C D + N C 3 )
E 7 ( 1 , 1 , 0 ) ( Δ E 1 G C 1 Δ E 2 G ) ( Δ C T + Δ E 2 G + M C 2 ) Δ C D C 3 + Δ E 1 D Δ E 2 D + M
E 8 ( 1 , 1 , 1 ) ( Δ E 1 G C 1 Δ E 2 G ) ( Δ C T + Δ E 2 G + Δ E 1 T Δ E 2 T + N C 2 ) ( Δ C D C 3 + Δ E 1 D Δ E 2 D + M )
Table 4. Local stability of equilibrium point.
E1E2E3E4E5E6E7E8
Type 1λ1++++
λ2+/−+++/−+
λ3++++
StabilityUnstable pointSaddle pointSaddle pointUnstable pointESSUnstable pointUnstable pointESS
Type 2λ1++++
λ2+/−++/−+/−+/−
λ3+/−+/−+++
StabilityUnstable pointSaddle pointSaddle pointUnstable pointUnstable pointESSUnstable pointESS
Type 3λ1++++
λ2+/−++/−++
λ3++++
StabilityUnstable pointSaddle pointSaddle pointUnstable pointUnstable pointUnstable pointUnstable pointESS
Publisher’s Note: MDPI stays neutral with regard to jurisdictional claims in published maps and institutional affiliations.

