Article

Service Quality and Satisfaction in the Context of Varying Levels of Restaurant Image and Customer Orientation during the COVID-19 Pandemic

1
School of Economics and Management, Shanghai University of Political Science and Law, Shanghai 201602, China
2
Department of International Trade, Dongguk University, Seoul 04620, Korea
*
Author to whom correspondence should be addressed.
Sustainability 2021, 13(17), 9694; https://doi.org/10.3390/su13179694
Submission received: 17 July 2021 / Revised: 18 August 2021 / Accepted: 26 August 2021 / Published: 29 August 2021
(This article belongs to the Section Economic and Business Aspects of Sustainability)

Abstract

:
Extant hospitality literature has tended to view the dimensions of service quality as primarily complementary or differential in nature. However, studies of the similarities and differences between the two types of service quality have been limited. This study investigates how restaurant image and customer orientation affect the relative importance of both process and outcome service quality in customer satisfaction, focusing on restaurants during the COVID-19 pandemic. Using a moderated moderation process and macro-based approach (M = 3), our findings show that process service quality impacts restaurant satisfaction; however, they also reveal that outcome service quality has a stronger main effect on restaurant satisfaction than process service quality. In particular, the findings show that the negative impact of the relationship between process (or outcome) service quality and restaurant image on restaurant satisfaction is insignificant when customer orientation is low. On the other hand, the same relationship has an even stronger positive effect on restaurant satisfaction when customer orientation is high. These findings have implications for restaurants’ efforts to develop and improve service quality, and bolster customer orientation, helping them identify more effective strategic approaches during and after the COVID-19 pandemic.

1. Introduction

Since higher levels of service quality are critical selling points in the international tourism and hospitality context, researchers have focused on measurement- and management-based approaches to improving service quality [1,2]. One notable approach in this vein has sought to assess the impact of process and outcome quality on restaurant choice. While several studies have focused on the importance of overall service quality or perceived quality, we view these two types of service quality as an extension of the SERVQUAL measurement approach [3]. Because consumer perceptions of the relative importance of service attributes vary [4], our main research question is: how can we effectively evaluate these two types of service quality and how can we effectively manage them during the pandemic?
Traditional service quality studies have mainly focused on two (technical vs. functional) [5] or three (interaction, outcome, and physical) types of service quality [6,7]. However, research comparing process and outcome service quality in the restaurant service sector during the COVID-19 pandemic in China remains scarce. For example, customers often witness well-organized service. Since customers put a premium on restaurant services that are directly related to their willingness to spend time and money [8], both process and outcome service quality should relate to satisfaction. However, the theoretical service quality–satisfaction linkage should vary due to the conditional differences that affect it both, directly and indirectly.
Scholars have begun to consider the importance of different types of service quality in supporting business performance including the different approaches restaurants use to improve their service quality. We expect the service quality–satisfaction link during service encounters to substantially impact both the conditional effects through the role of moderators and the extent to which those effects are incorporated into customer satisfaction. Based on this reasoning, we consider how two types of service quality affect customer satisfaction at different levels of customer orientation and restaurant image, specifically in the context of the Chinese restaurant industry during the COVID-19 pandemic. Since the COVID-19 outbreak has significantly impacted consumer behavior and produced behavioral changes in consumption [9], our approach is particularly relevant to efforts to sustain long-term restaurant management during and after the pandemic.
While the service quality literature has covered well-established marketplaces, the COVID-19 pandemic has made it necessary for marketers seeking to improve customer satisfaction to understand how Chinese consumers determine what types of service quality are critical in the context of physical distancing and lockdowns. In China, food consumption in restaurants is an exciting means of celebration and establishing social connections [10]; therefore, improving restaurants’ ability to facilitate these connections is crucial. Furthermore, the retail market value of China’s full-service restaurants will reach EUR 390 billion by 2019 [11]. Although these evaluations are positive, the COVID-19 pandemic has had a significantly negative impact on the restaurant business. From a theoretical perspective, the environmental impact appears to be a unifying theory or ample evidence that reflects this complexity and the nature of the two types of service quality. From a practical perspective, further studies regarding restaurant service quality are essential to improve our understanding of the ways restaurants should manage service quality, satisfaction, and other relevant factors during the COVID-19 era.
Restaurants can improve customer orientation by investing in initiatives to enhance customer service. Restaurant image is also an important quality indicator [12]. We expect that customers will evaluate the service quality–satisfaction linkage differently based on these two constructs. Applying a moderated moderation perspective to the service quality–satisfaction formation, we theorize that customer orientation and restaurant image levels are key elements in increasing satisfaction. Two primary factors influencing service quality–satisfaction formation—customer orientation and restaurant image—play an essential role in synthesizing the proposed link. Thus, this study seeks to understand how customer orientation and restaurant image affect the relative importance of both process and outcome service quality in determining restaurant customer satisfaction, particularly in the context of the COVID-19 pandemic.

2. Conceptual Background

The service marketing literature has emphasized the importance of service quality as a core element that impacts customer satisfaction and subsequent action [13,14,15]. In particular, customer evaluations depend on the nature of true services: this raises the question, what types of service quality are important to customers? The evaluations indicate that notions of service quality vary between different service types and service industries. In addition, customers are likely to evaluate two specific dimensions of service quality: process and outcome service quality [16]. These two types of service quality comprise the full customer experience and include both service functionality and the emotional components of service experiences [17].
Another important focus of this study is the role of restaurant image and customer orientation. People view the image of a restaurant as a facilitator of customer motivation or behavior because restaurant customers rely heavily on tangible cues [18]. In restaurant selection, maintaining a unique restaurant image is a critical task for restaurant managers [19,20].
Meanwhile, a low perceived restaurant image level can create quality and satisfaction problems. Our argument links to customer perceptions of the dissonance between restaurant operations and actual restaurant image [21]. To narrow the gap, managers must cultivate and manage distinct restaurant images during the restaurant consumption period. In so doing, they positively impact service quality and satisfaction.
Customer orientation is also a primary concern in the service literature. The notion’s basic premise is that customer-oriented service organizations outperform their competitors by exceeding customers’ needs and providing good services to which both value and satisfaction are consistently ascribed [6]. Even though several studies have found that the relationship between customer orientation and service performance has nonsignificant or negative effects [22,23], favorable customer outcomes result from well designed and executed marketing implementations that allow service firms to acquire and assimilate available customer information.
Although strategy and service studies have demonstrated the advantages of customer orientation, the indirect role of customer orientation remains unknown. Researchers have viewed customer orientation as a cornerstone in the theoretical linkage between service quality, satisfaction, and firm performance [6,24]. However, we argue that these links are likely influenced by the indirect role of customer orientation, particularly in the moderated moderation role. If this is the case, researchers can better understand changes in the service quality–satisfaction linkage through the level of proposed moderators.

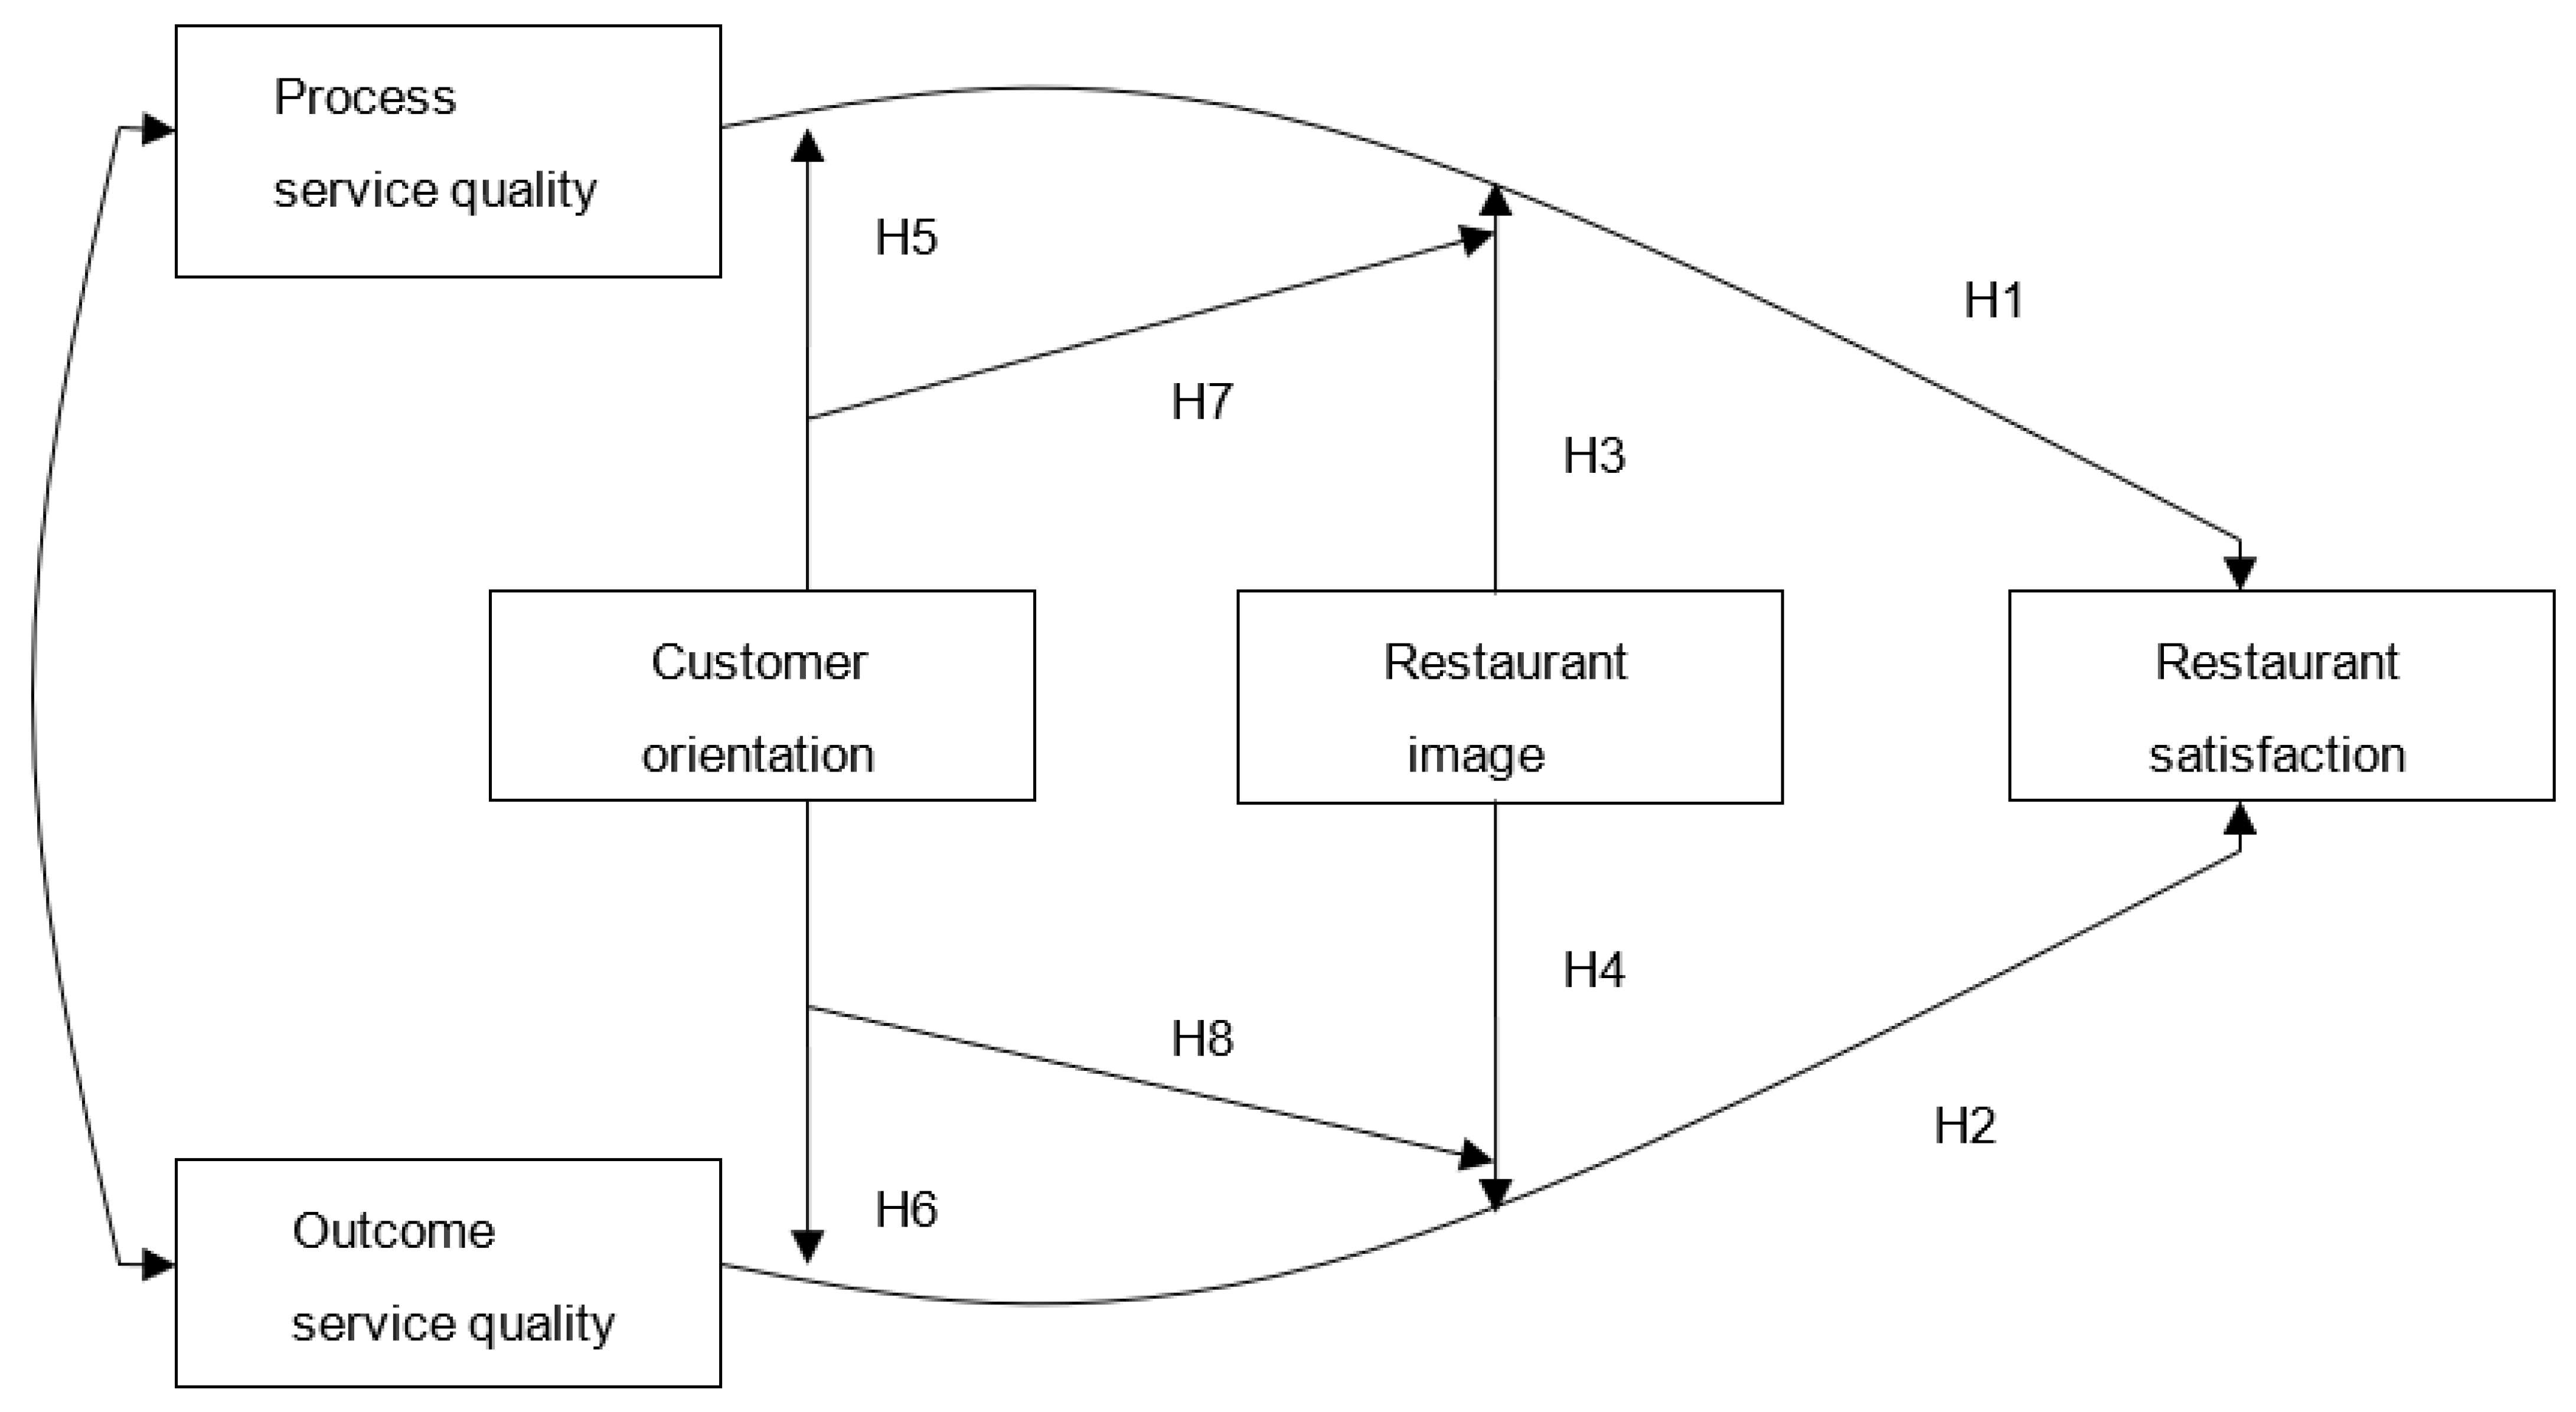
2.1. Research Model and Hypotheses

The conceptual model proposes that two types of service quality—process and outcome service quality—directly affect customer satisfaction. As shown in Figure 1, customer orientation and restaurant image play moderating roles in the relationships between two types of service quality and satisfaction. We provide a theoretical rationale for the hypothesized relationships among these constructs.

2.2. Service Quality and Customer Satisfaction

While services are mainly intangible and require interaction with customers, process service quality can substantially affect customer satisfaction, particularly in the restaurant sector [13,15]. The service literature defines process service quality as the manner in which outcomes transfer to customers [25]. In particular, the process dimensions of quality include physical quality and relational quality [26]. These dimensions highlight the influence of people’s cognition and emotions, serving as a source of behavioral guidance. In line with these observations, this study conceptualizes process service quality as the evaluation of the service delivery process, which reflects customers’ cognitive and emotional experiences of restaurant service quality. The service literature generally defines outcome service quality as what customers receive during exchanges [25]. This definition refers to what customers are left with after service delivery [6,26]. Thus, we conceptualize outcome service quality as the customer’s evaluation of the service experience after the completion of restaurant service delivery.
Investigating how the effects of process and outcome service quality on customer satisfaction differ will elucidate the roles these two types of service quality play in the overall service performance. Outcome quality in the restaurant sector might, for example, refer to the taste of food or the speed of food delivery, while process quality would include factors such as the responsiveness of the restaurant staff.
While most researchers agree that these definitions of service quality are acceptable, no consensus has been reached regarding the definition of customer satisfaction [27,28]. Since every customer has different service expectations, this indicates that “satisfaction” may mean different things for different customers [29]. In line with these observations, this study conceptualizes customer satisfaction as the perceived degree of contentment regarding a customer’s prior experience with a particular restaurant.
Process and outcome service quality positively affect customer satisfaction, particularly in the restaurant context. Customers, however, are more likely to seek delicious, clean, and well-trained restaurants related to their feelings and social connections [30]. The way a restaurant operates can provide an insight into the customers’ evaluations of the restaurant process and physical evidence [31,32], and can provide a link to the generation of initial customer satisfaction levels. Furthermore, reliable high-level services can influence customers’ positive emotional evaluations of restaurant outcome quality. Thus, we propose the following two hypotheses:
Hypothesis 1.
Process service quality has a direct, positive effect on customer satisfaction.
Hypothesis 2.
Outcome service quality has a direct, positive effect on customer satisfaction.

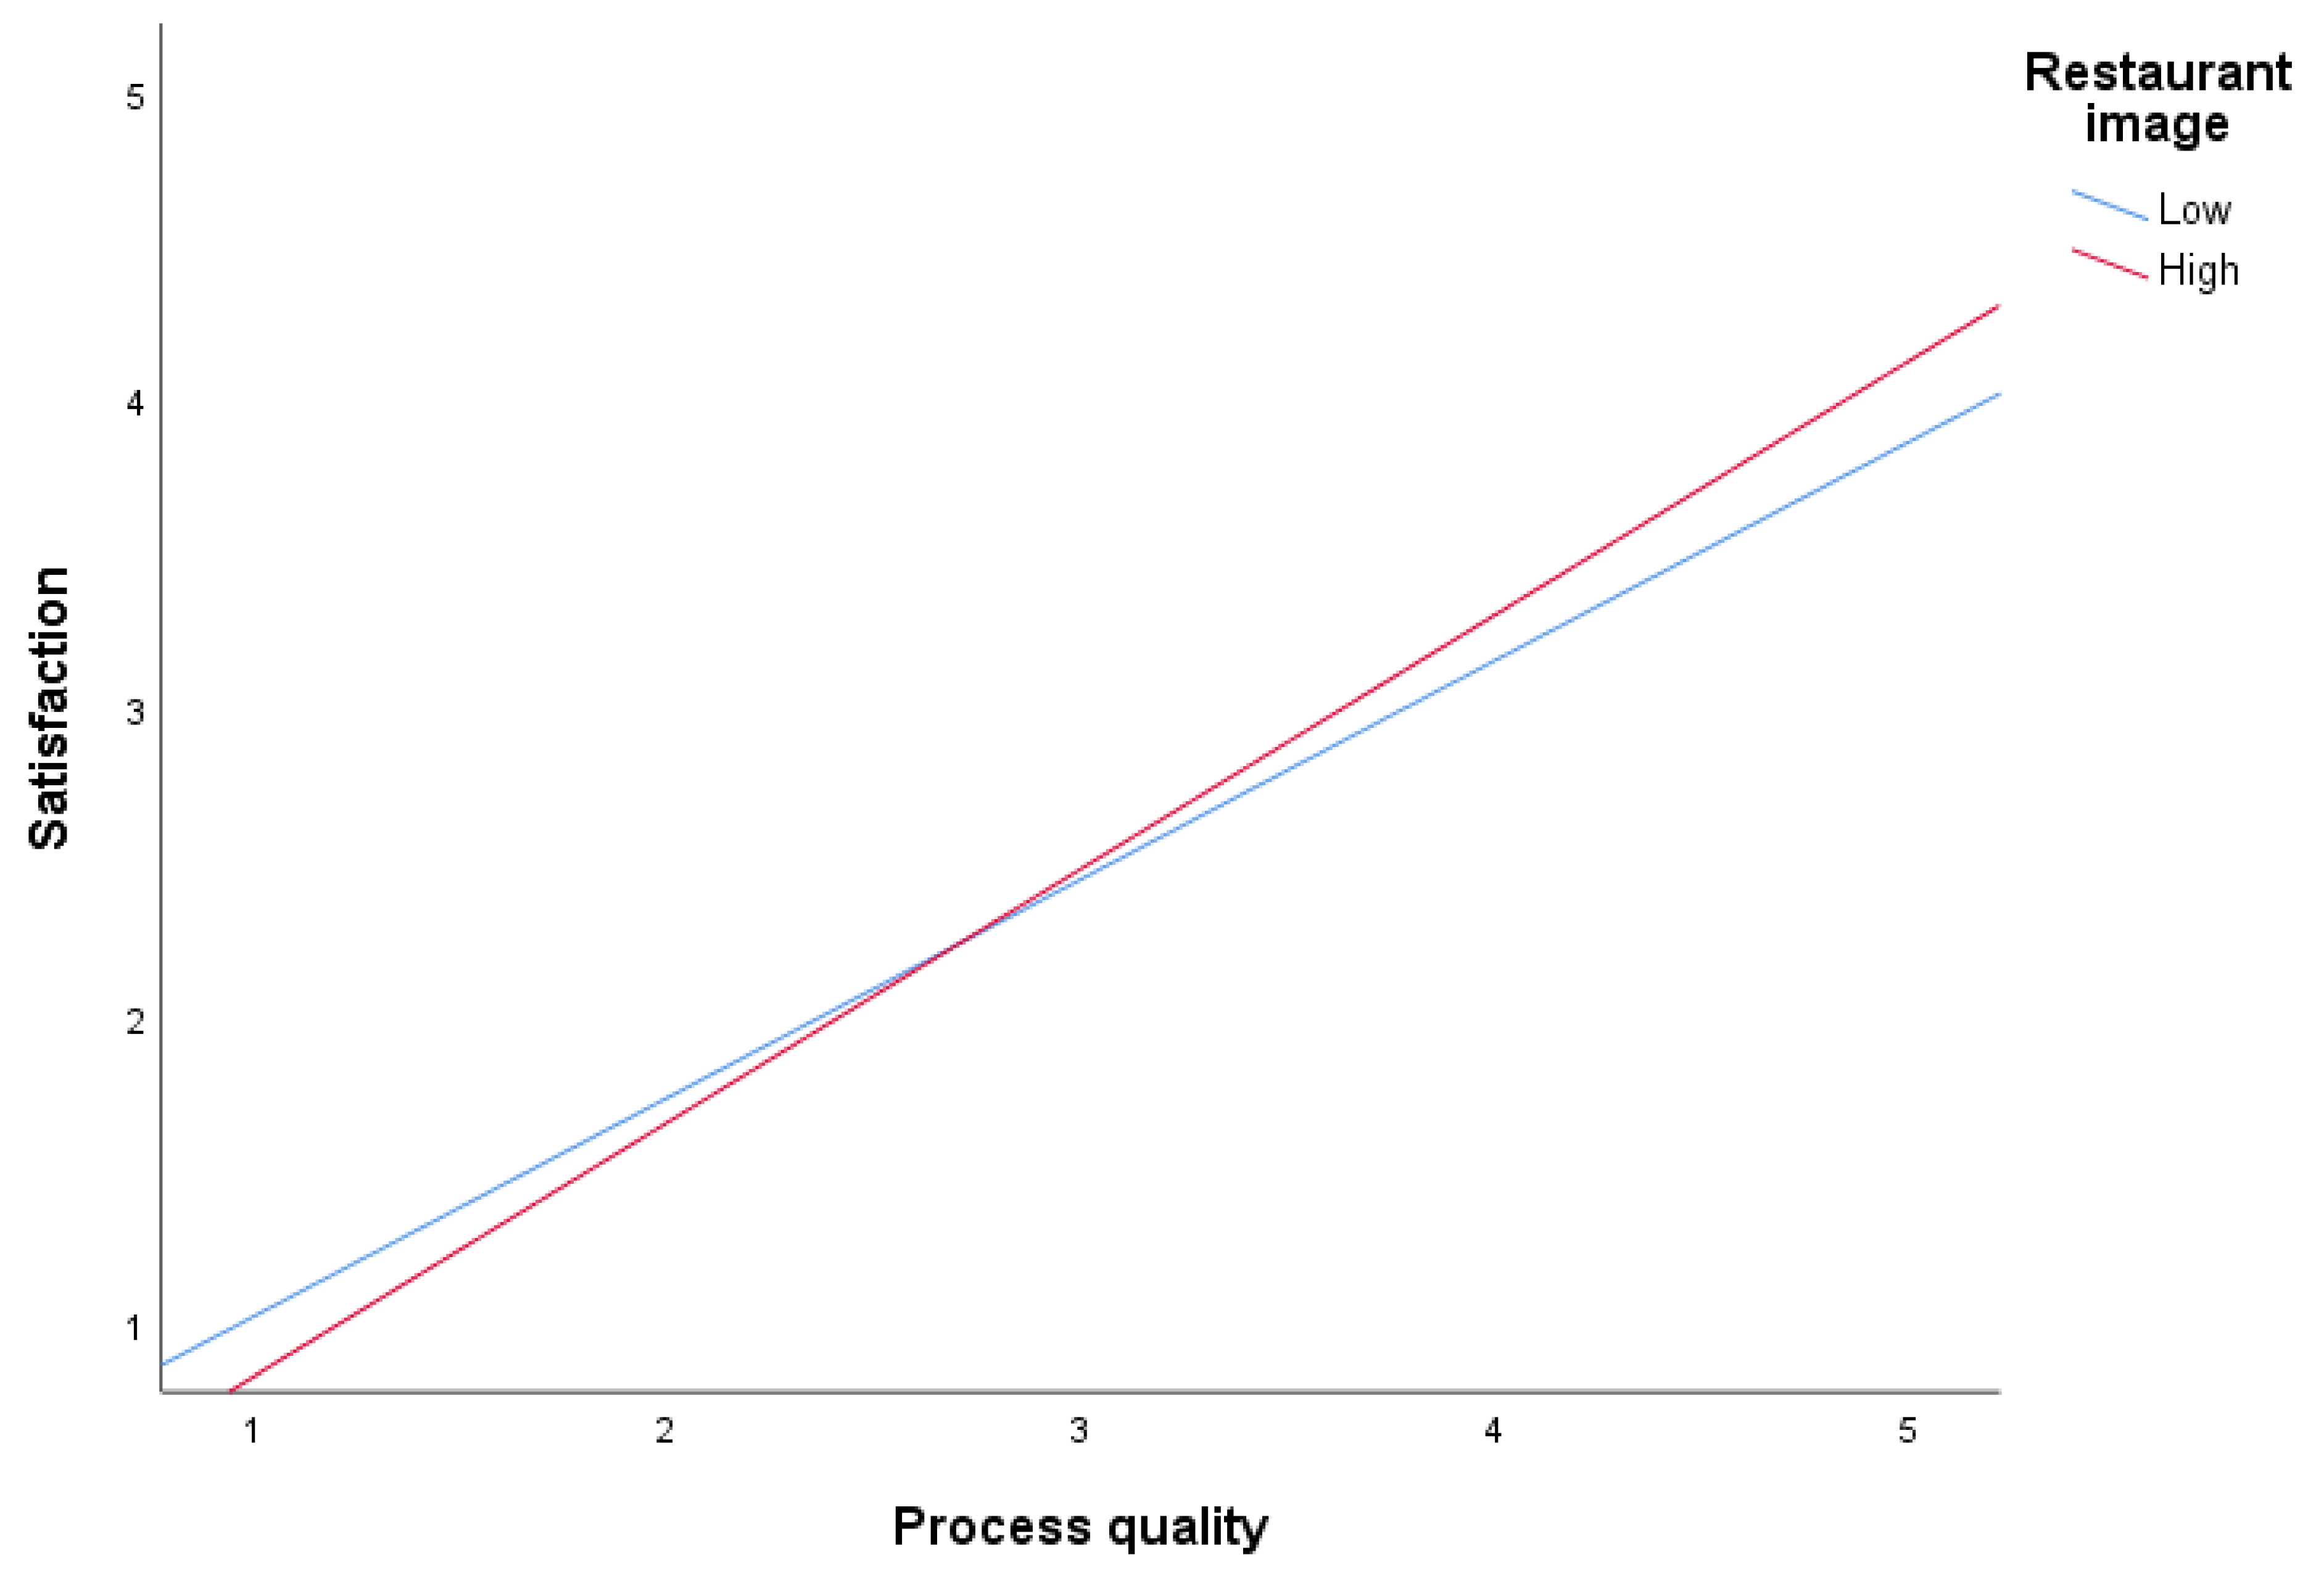
2.3. The Moderating Role of Restaurant Image

Restaurant image stems from the concept of the store image, which emphasizes customers’ perceptions of a store’s image in terms of functional attributes [33]. Still, the complex nature of image means that it has numerous definitions [18]. The main focus of image-related literature has been on individuals’ subjective perceptions [34,35]. Similarly, overall image refers to customers’ general perceptions of (or beliefs regarding) a restaurant as reflected in the relationships held in customers’ memories [36,37]. We therefore conceptualize restaurant image as the sum of a customer’s beliefs, ideas, and impressions of a particular restaurant.
Restaurant image is a predictor of restaurant choice (or consumer behavior) [38,39], a key construct for better understanding restaurant service quality [20,40], and a predictor of customer satisfaction [18,33]. Maintaining a favorable image spurs customer activity, but there is still a theoretical causal direction between image and quality. More specifically, while most studies have investigated the dimensions of service quality as determinants of restaurant image, several have focused on the causal impacts of image and service quality [41,42,43,44].
All these findings have advantages and disadvantages when it comes to addressing the causal direction, but one of our key potential contributions is the theoretical linkage to restaurant image. This linkage stems from the fact that the positive impacts of service quality and image play vital roles in improving customer satisfaction [20,45]. Consistent with this evidence, we argue that the link between service quality (both process and outcome quality) and customer satisfaction is stronger when customers have favorable restaurant images. More specifically, if customers have positive feelings about process and outcome service quality, these two types of service quality can influence their satisfaction with the restaurant. In turn, a favorable restaurant image can also enhance the service quality–satisfaction linkage. Thus, our third and fourth hypotheses are as follows:
Hypothesis 3.
The relationship between process service quality and customer satisfaction is stronger when customers have strongly positive restaurant images.
Hypothesis 4.
The relationship between outcome service quality and customer satisfaction is stronger when customers have strongly positive restaurant images.

2.4. The Moderated Moderation Role of Customer Orientation

Researchers have emphasized the need to better understand customer orientation as an important point of leverage for the economic success of service-based organizations [24,46,47]. This implies that service firms obtain various types of information about customer needs and preferences and, in turn, act on that information [48]. Customer orientation is not new, but research regarding the concept remains limited, particularly in the service context [49]. Customer orientation has been defined as an employee’s disposition or tendency to meet customer needs in an on-the-job context [50]. In this study, we define customer orientation as the specialized activities employees engage in to identify, analyze, understand, and address customer needs [47]. This definition reflects Vargo and Lusch’s service-dominant logic [51,52], which holds that service is related to the provision of benefits and assistance.
The service literature has revealed that employees’ behaviors directly impact customers’ service perceptions [53]. More specifically, employee-related factors in service contexts are closely related to customers’ service quality assessments. This relationship exists because customer orientation is an intangible service [54]. The service literature has also shown that service quality mediates the relationship between customer orientation and customer satisfaction [47,48]. However, one can argue that customer orientation could enhance the relationship between service quality and customer satisfaction. The way employees treat customers from the start of the service to the end is crucial for business performance [55], and employees’ customer activities can increase or decrease the relationship between the two constructs. For example, several restaurants have recently updated their overall processes and improved their service quality by offering health-oriented services. A restaurant’s favorable process can make customers feel comfortable and lead them to evaluate the overall restaurant performance before making payments. For example, if employees’ direct customer focus meets the needs and desires of customers, there should be enhancements in cognitive and affective linkages. Kelly and Hoffman [56] have supported this argument, demonstrating that employees’ positive affect and activity led to favorable service assessments, and bolstered business success (e.g., satisfaction and loyalty). Thus, we propose the following hypotheses:
Hypothesis 5.
The relationship between process service quality and customer satisfaction is stronger at higher levels of customer orientation.
Hypothesis 6.
The relationship between outcome service quality and customer satisfaction is stronger at higher levels of customer orientation.

2.5. The Moderated Moderation of Customer Orientation

In this study, we focus on three-way moderating effects (or moderated moderation effects) between these constructs. This approach is possible because customers may judge customer orientation and store image differently at any given time. For example, some customers may feel comfortable when restaurant employees deliver customer-oriented services. In contrast, other customers may keep their distance from a restaurant because employees’ favorable behavior is obvious. However, customer orientation can critically influence the restaurant image. From a cognitive perspective, customers evaluate overall restaurant image before they order their meal. Customers can first perceive high (or low) customer orientation if they have favorable (or unfavorable) restaurant images. Superb customer treatment by employees can also dilute poor restaurant images. The affective nature of customer care and employees’ real-time interactions with customers often make customer orientation a key determinant in the service context. This study posits that the effects of both H3 and H4 will differ based on customer orientation levels.
We have already made arguments addressing hypotheses H3, H4, H5, and H6. We postulate the three-way moderating effects based on these four moderating effects, deriving insight into the ways these moderated moderations can be applied and understood [57]. Consistent with this approach, the restaurant images of customers who prefer customer-focused services and receive favorable treatment should improve. This conditional effect is linked to H3 and H4 because the restaurant images that are formed based on customers’ judgments also reinforce customer cognitions and affections [58].
Customer orientation should also relate indirectly to the effects of process service quality. The coping framework that addresses the connection between cognition and arousal [59] supports our argument. Hence, the direct impact of customer orientation positively enhances H3. This logic also applies to H4, which addresses the moderating effect of restaurant image between outcome service quality and customer satisfaction. Therefore, our final two hypotheses are as follows:
Hypothesis 7.
The positive moderating effect of restaurant image on the relationship between process service quality and customer satisfaction is stronger as customer orientation improves.
Hypothesis 8.
The positive moderating effect of restaurant image on the relationship between outcome service quality and customer satisfaction is stronger as customer orientation improves.

3. Methodology

3.1. Data Collection

In this study, we used a questionnaire to collect data from the restaurant service sector. The participants included customers who experienced a particular restaurant service between August and December 2020 in China. We chose this service sector because customers had direct contact and experience with the restaurants. The wide variety of restaurant services allowed for variations in the relevant independent and dependent variables. The key factors that contribute to customer satisfaction in Chinese restaurants include food, service process, physical surroundings, image, and service (speed, friendliness, and care) [20,60]. In addition to the core factor of taste, these varied factors make the sector well suited for testing the proposed model.
We screened the participants before administering the questionnaire to ensure they understood the study. A professional online research firm (with a panel of more than one million consumers) conducted the survey. We used random sampling to select research participants, including the criterion of a minimum of six months of experience at restaurants with at least two visits during the COVID-19 pandemic.
The online research firm distributed self-administered surveys to 450 respondents. To boost response rates, we provided all respondents with a coffee voucher. After accounting for sample bias and missing data, a total of 316 questionnaires were completed, representing a 69.2% response rate. Approximately 61% of the respondents were female and 68% were younger than 31.
Following Armstrong and Overton’s suggestion (1977), we assessed non-response bias using a series of t-tests that compared early (responses to the initial survey) and late (responses to the follow-up survey) respondents on all key constructs. The results revealed no significant differences in the key variables between the early and late respondents.

3.2. Measurements

We measured the 5 factors using 17 questions (responses on five-point Likert scales; strongly disagree 1, strongly agree 5) adapted from published scales (see Table 1). In other words, we made slight wording changes to fit the Chinese restaurant context. We measured two moderating constructs: customer orientation, using four items adapted from Saxe and Weitz [61], and restaurant image, four items adapted from Stern, Bush, and Hair [62]. We also measured two types of service quality: process service quality, using four items adapted from Dabholkar et al. [63] and Parasuraman et al. [64]; and outcome service quality, using three items adapted from Ma et al. [65] and Yoo et al. [44]. Meanwhile, we measured customer satisfaction using two items adapted from Ragunathan and Irwin [66].
All survey questions were originally written in English and translated into Chinese. To ensure that the translations were accurate, we used the translation and back-translation method. We consulted with three researchers regarding the survey’s wording and comprehensibility to ensure that the Chinese language reflected the language spoken by the Chinese population at the specific time of the survey. Overall, the fit between the back-translated versions and the original version was acceptable, indicating that the translation of the Chinese survey was high quality.

3.3. Control Variable

This study controlled for restaurant type because it may moderate the relationship between service quality and satisfaction. For example, Kim and Moon [32] found that, as a situational factor, restaurant type can have a moderating effect on restaurant customers’ cognition and emotions. To address this issue, we checked the restaurant type when completing each survey: (1) Chinese restaurant and (2) Western restaurant. There are various Asian restaurants in China, but we did not consider these restaurants because Chinese customers are more likely to visit Western-originated restaurants [10].

4. Results

4.1. Measurement Model

We followed Anderson and Gerbing’s guidelines [67] for assessing the measurement model and hypotheses testing, and we conducted an exploratory and confirmatory factor analysis (CFA) to test for convergent validity. We also considered the item-total correlation and target values below other item-total correlations for deletion from a statistical perspective. Next, based on the initial CFA results, we identified all the items that loaded less than 0.50 on their intended constructs as candidates for deletion, and ultimately dropped one original customer orientation scale item from the original item pool.
We subjected the resulting pool of customer orientation, restaurant image, process service quality, outcome service quality, and customer satisfaction items to an exploratory factor analysis using the principal factor as the extracted method. We followed this with a varimax rotation. These analyses identified five factors corresponding to how we had initially measured these constructs.
Next, we conducted a confirmatory factor analysis (CFA) using AMOS 23.0 on the resultant pool of items. The measurement model suggested a good fit to the data, χ²(109) = 235.026, p < 0.01, Comparative Fit Index (CFI) = 0.95, Non-Normed Fit Index (NNFI) = 0.95 and root mean square error of approximation (RMSEA) = 0.061. Table 1 summarizes the results of the CFA with factor loadings and t-values.
All factor loadings were relatively high and significant, providing strong evidence for convergent validity [68]. The high average variance extracted (AVE) for all four constructs [68] provided support for their convergent validity. All AVEs exceeded the recommended level of 0.50, rating from 0.54 (customer orientation) to 0.62 (satisfaction).
We assessed the discriminant validity by calculating the shared variances between pairs of constructs and verifying that they were lower than the average variances extracted for the individual constructs [69]. As shown in Table 2, the shared variances between the pairs of all possible scale combinations indicated that the extracted variances were higher than the associated shared variances in all cases.

4.2. Analysis of the Proposed Hypotheses

We tested the hypotheses using the moderated moderation process [57]. In doing so, we developed two models: the “main-effects model” (excluding interaction terms) and the “interaction model” (including the interaction effects). We also used the Johnson-Neyman technique to test the three-way interaction using the macro process suggested by Hayes [57].
Table 3 summarizes the testing results for the hypotheses regarding the control, main, moderation, and moderated moderation effects. A test of the control effect of the restaurant type revealed no significant effects. As already established, both process (ß = 2.40, p < 0.05) and outcome service quality (ß = 1.78, p < 0.05) had a statistically significant impact on customer satisfaction, supporting H1 and H2. Interestingly, the moderating impacts of restaurant image on the two types of service quality were quite different. The moderating effect of restaurant image on the process service quality–customer satisfaction linkage was significant (ß = 1.70, p < 0.05), whereas the moderating effect of restaurant image on the outcome service quality–customer satisfaction linkage was not significant (ß = 0.76, p > 0.05). These findings support H3, but not H4.
Regarding the H3 results, the effect of the outcome service quality–customer satisfaction linkage depended on the impacts of the restaurant image. As shown in Figure 2, we found that the proposed relationship increases when restaurant image is highly positive. On the other hand, our analysis showed that the same relationship decreases when both satisfaction and process service quality are low. These moderating effects on restaurant image are consistent with previous studies even though the restaurants we analyzed were coping with the COVID-19 pandemic.
Both H5 and H6 proposed that customer orientation moderates the service quality–customer satisfaction linkage. Our analyses showed that both process (ß = 1.65, p < 0.05) and outcome service quality (ß = 1.04, p < 0.01) played important roles in moderating the proposed relationship, supporting H5 and H6. However, the moderating effects of customer orientation differed among service quality types. Specifically, for process service quality, we found that the proposed relationship increases when customer orientation is high (see Figure 3). On the other hand, our analyses showed that when outcome service quality and satisfaction are high, the proposed relationship appears somewhat stronger when customer orientation is low (see Figure 4). The latter is interesting in the context of the COVID-19 pandemic because the interaction is possible when outcome service quality and satisfaction are extremely high. Despite this unexpected finding, when outcome service quality and satisfaction are relatively low, the proposed relationship appears stronger when customer orientation is high.

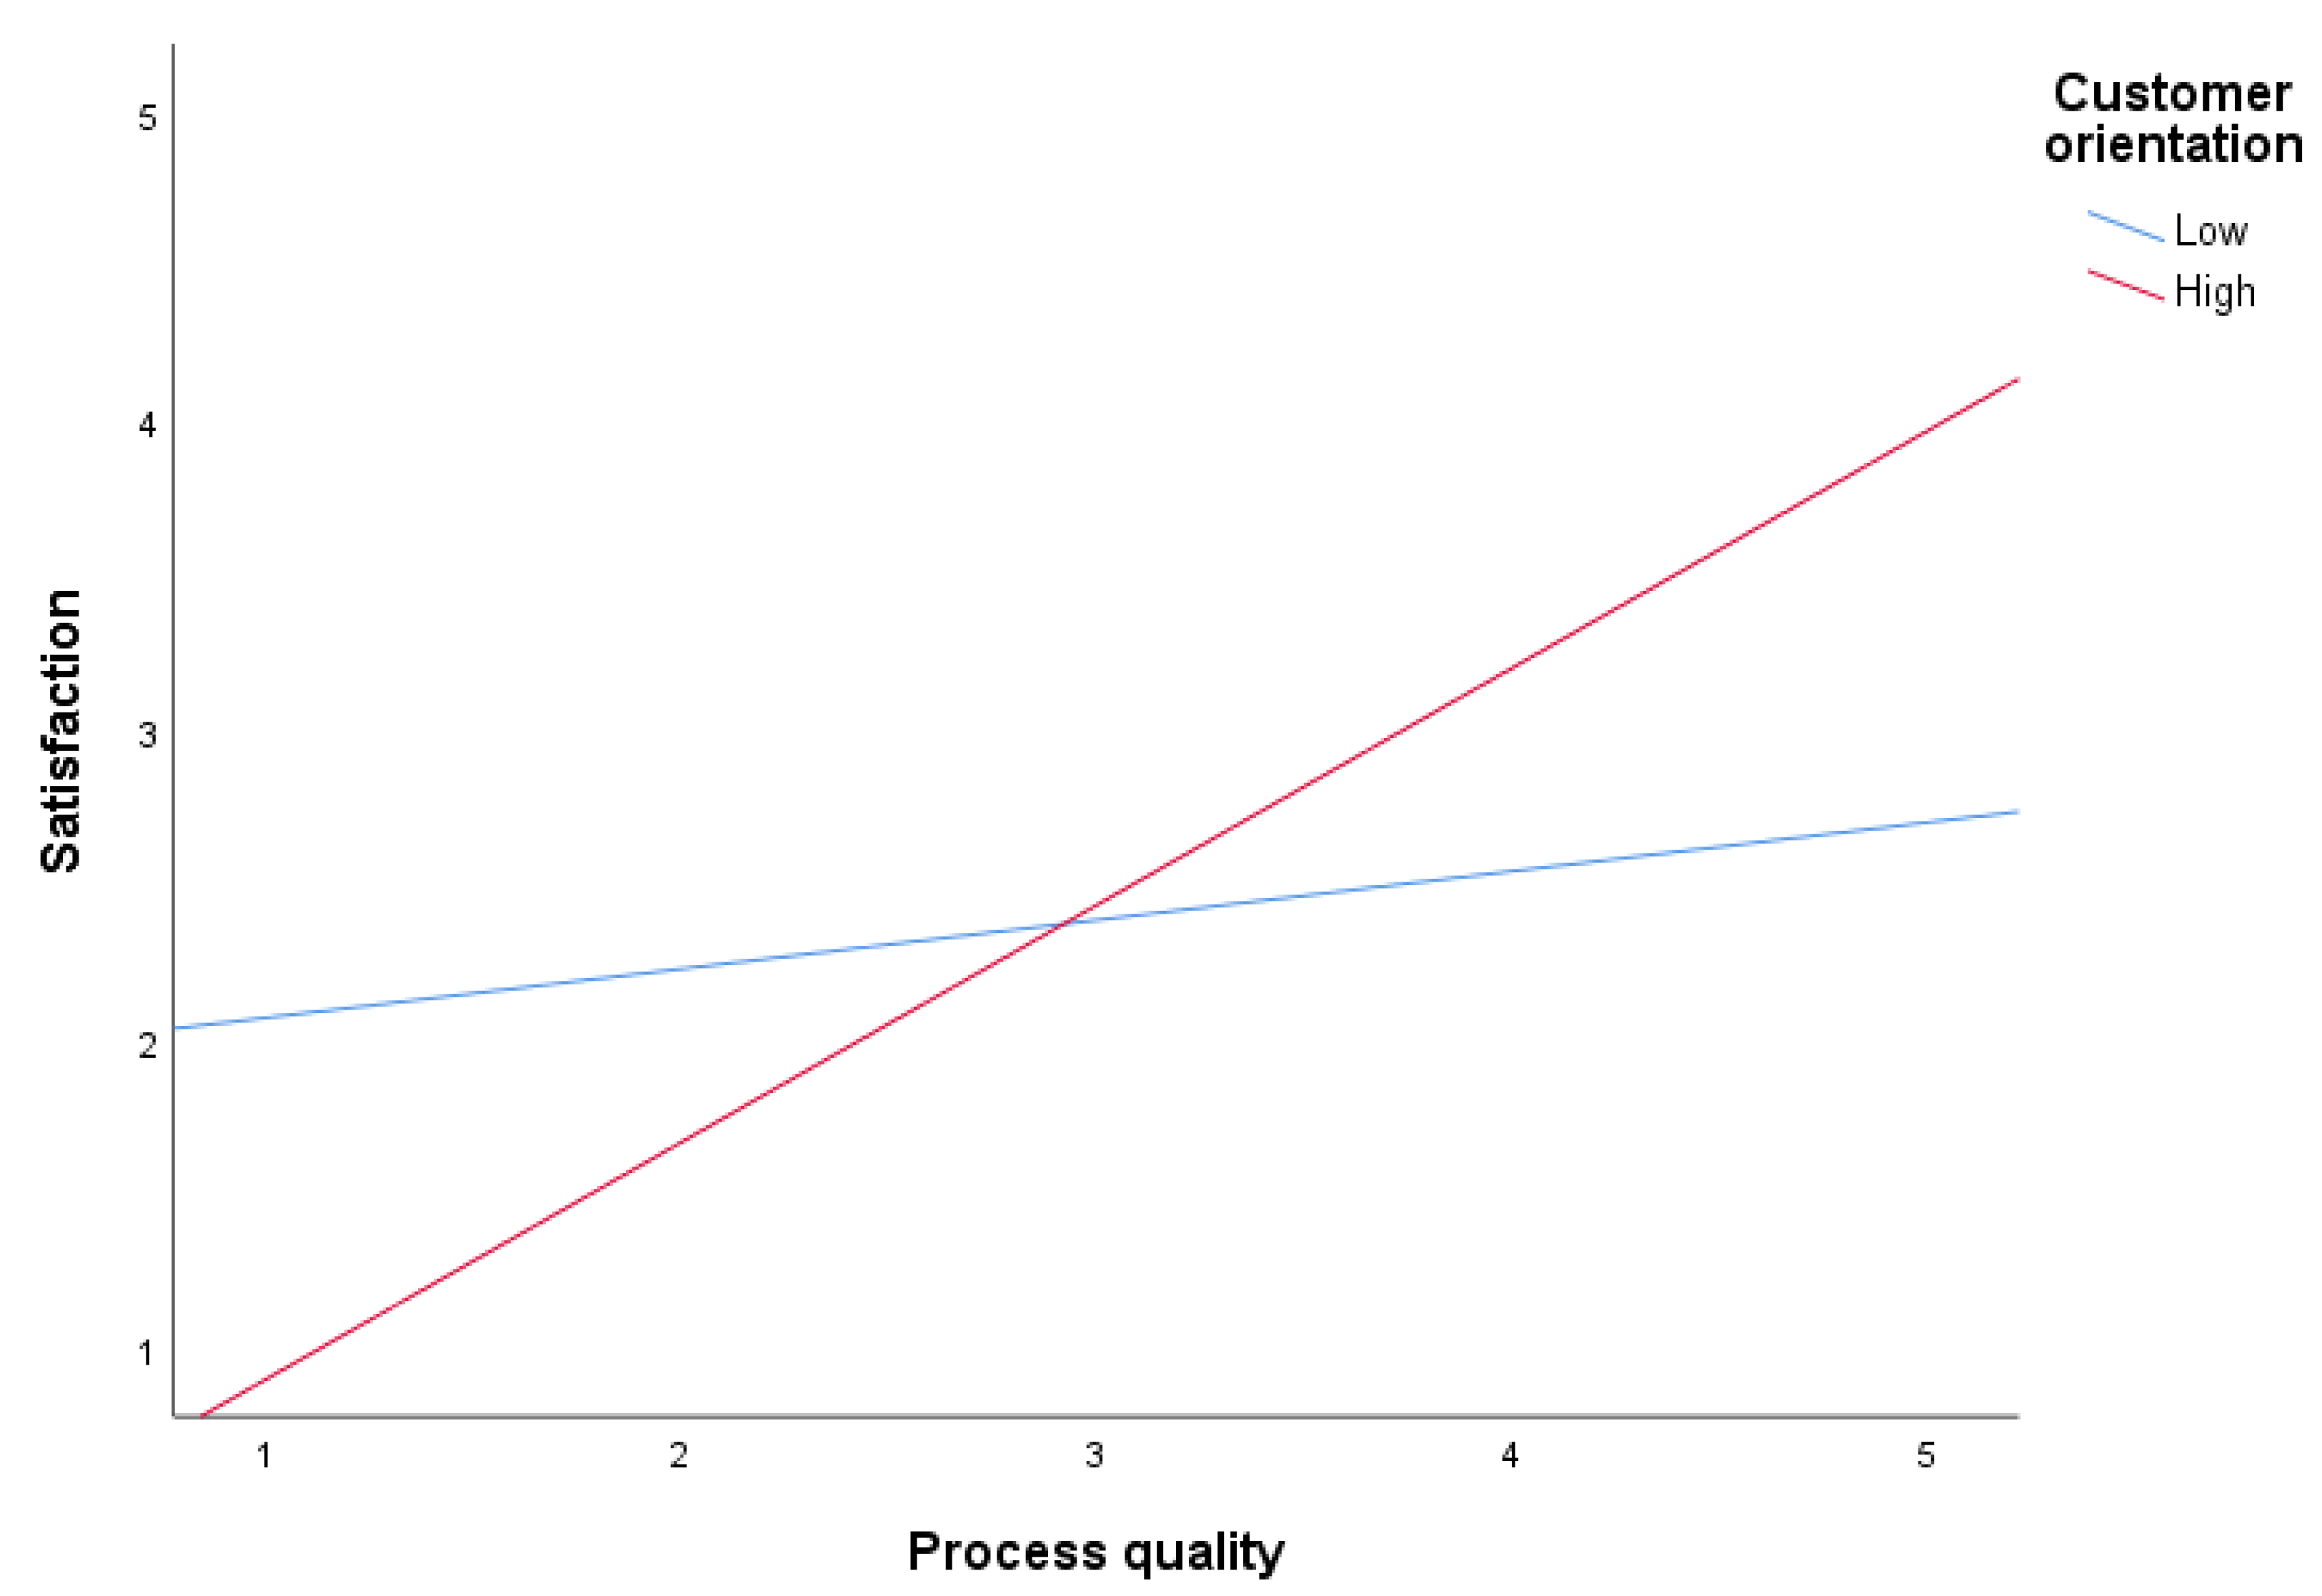
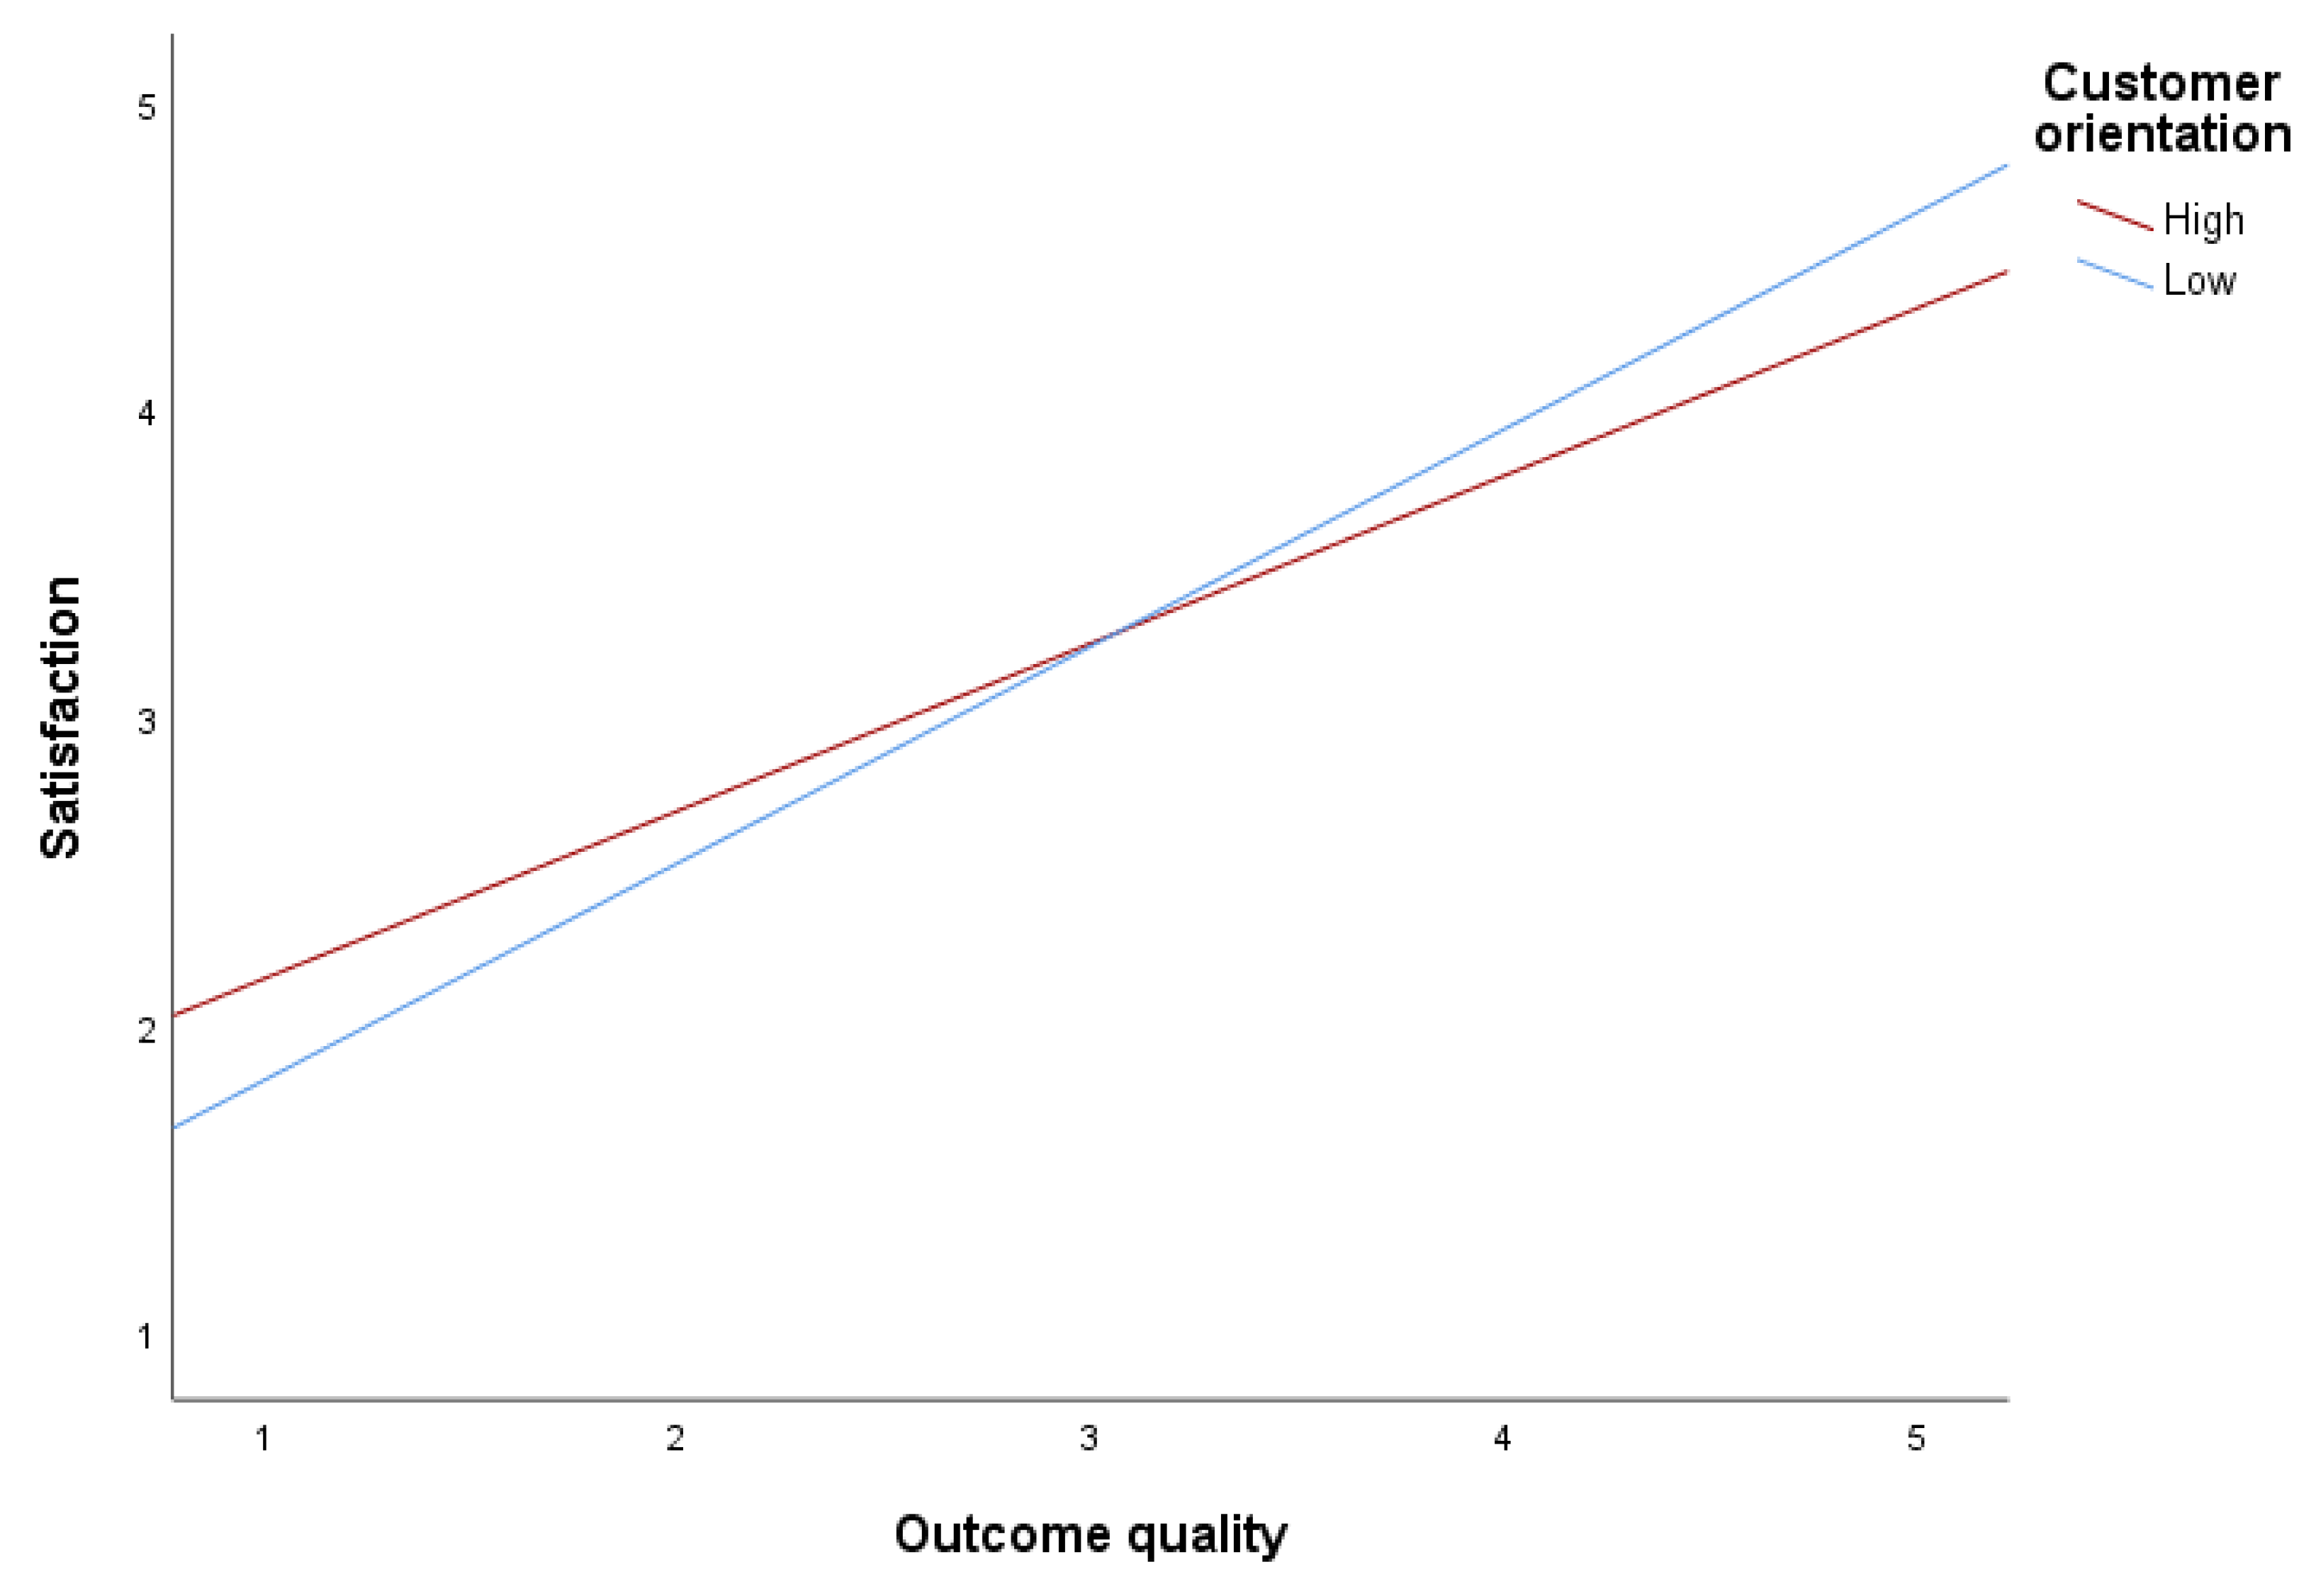
4.3. Moderated Moderation Effects of Customer Orientation

We tested H7 and H8, which focused on the moderated moderation role of customer orientation. As shown in Table 3, our analyses significantly supported these hypotheses for both types of service quality (H7: ß = 1.29, p < 0.01; H8: ß = 0.53, p < 0.05). To further investigate the moderated moderation effects, we checked the conditional effects (Table 4). In the case of low customer orientation levels, we found no significant difference in the conditional effects between process (or outcome) service quality and restaurant image. However, at high levels of customer orientation, the conditional effects between process (or outcome) service quality and restaurant image differed significantly. In short, our analyses showed that the moderating effects of restaurant image on the relationship between service quality and satisfaction are positively enhanced when customer orientation is high.

5. Discussion

The positive relationships between process and outcome service quality and restaurant satisfaction are consistent with previous studies [13,15,70,71]. While process service quality impacts restaurant satisfaction, our analysis showed that the main effect of outcome service quality on restaurant satisfaction is stronger than process service quality. As shown in Table 3, the t-value for the outcome service quality–restaurant satisfaction linkage is higher than that of the process service quality–restaurant satisfaction linkage. These results indicate that the standard error is low in the outcome service quality–restaurant satisfaction linkage, meaning the correlation between outcome service quality and restaurant satisfaction is high. These findings suggest that the outcome elements of service quality are easier to evaluate and more relevant than the process elements.
In this study, we also aimed to provide ample evidence of the difference between process and outcome service quality during the COVID-19 pandemic. We found that the main effect of process service quality on customer satisfaction is stronger than the outcome service quality. Traditional service literature has emphasized the importance of outcome service quality over process service quality [72]. In contrast, our analyses provide substantial evidence of the two constructs’ differential effects on customer satisfaction during the COVID-19 pandemic.
Our findings indicate that restaurant image and customer orientation have significant, direct, and positive effects on restaurant satisfaction. In addition to helping customers solve their problems, improving the service value is likely to foster positive restaurant images. This approach may address customers’ needs for control so that value-oriented customer support becomes a key determinant of satisfaction, resulting in repeat purchases or behavioral intentions [59]. Faced with health concerns and restaurant operation features, customers perceive customer-oriented efforts to provide essential services as a critical and fundamental value in the era of the COVID-19 pandemic. Our argument aligns with the notion that reliable and comfortable restaurant services are the most effective means of optimizing customer experiences [73].
Our study’s findings also highlight the differential effect of customer orientation on the relationship between process (or outcome) service quality and restaurant image on restaurant satisfaction. We found that the negative impact of the relationship between process (or outcome) service quality and restaurant image on restaurant satisfaction was insignificant when customer orientation was low. On the other hand, the same relationship had an even stronger positive effect on restaurant satisfaction when customer orientation was high. Meanwhile, we found no significant difference in the impact of the original relationship between outcome service quality and restaurant image on restaurant satisfaction. In contrast, the conditional effect between outcome service quality and restaurant image at the value of customer orientation was significantly positive when customer orientation was high. The more customers know about a restaurant’s customer-oriented service, the easier it becomes for them to recognize the value of customer-oriented behaviors in their satisfaction evaluations [74,75].
This study’s findings have important implications for practitioners. Restaurant practitioners need to be aware of the ways customer satisfaction has changed as restaurant image has contributed to customer orientation during the COVID-19 pandemic. In addition to focusing on improving restaurant images, practitioners need to increasingly orient toward fulfilling customer needs [76]. In particular, healthy food menus that meet the customer’s needs during and after the COVID-19 pandemic have a positive effect on restaurant satisfaction.
Efforts to improve restaurant images by providing customers with various restaurant services and cultivating goodwill can help restaurants differentiate their service offerings and provide a foundation for improving satisfaction. Although establishing a favorable restaurant image creates the potential for positive behavioral intentions, restaurants can unlock these behavioral intentions by tapping into the diverse abilities of their staff and their trust-based services. As Kim et al. [77] pointed out, “restaurant authenticity” remains a challenging goal for many restaurants. Our findings show that restaurants should act transparently with their customers and supply them with various selections. Such enhanced transparency and improved choice will allow restaurants to leverage their levels of process (or outcome) service quality and improve customer satisfaction.

Limitations and Direction for Future Research

This study helps explain why the moderated moderation effects vary for the two types of service quality; however, it has certain limitations that offer avenues for future research. First, we identified two types of service quality, and our research approach may not provide the same insight regarding three types of service quality (e.g., interactivity, outcome, and environmental service quality). Alternatively, research comparing our findings with pre-COVID-19, COVID-19, and post-COVID-19 pandemic findings could produce even more insights. Thus, researchers can draw corresponding conclusions and recommendations from the key findings of this study.
Second, considering some of the study’s variables in more specific contexts might generate additional insights. For example, researchers might consider restaurant type (e.g., fast food vs. fine dining) and eating type (eating in vs. eating out) as alternative moderators. Examining more specific contexts could enable researchers to consider more intricate moderation or moderated moderation effects.
Third, recent studies have emphasized the importance of boundary conditions for service quality and customer satisfaction [78,79,80]. For example, customer satisfaction might depend on the duration of the experience (short vs. long-term) or the happiness of others in the context of restaurant visit. Thus, investigations into the boundary conditional level may generate additional insights that would help researchers identify better ways to increase service quality and satisfaction.
Finally, the current restaurant image construct may not capture all aspects of restaurants, which may vary between operators (restaurant owner, fast food, franchise, chef-centric restaurant, etc.). We encourage researchers to undertake additional studies examining the effects of these operating entities and restaurant image.

6. Conclusions

This study’s findings underscore the importance of customer orientation as a means for improving customer satisfaction in the restaurant sector. The study also shows that customer orientation has implications for the evaluations of two types of service quality. Finally, we show that customer orientation differs based on restaurant image levels. Our findings highlight the value of considering moderated moderation effects in analyzing the dynamics of the service quality–restaurant satisfaction linkage. While this study presents a limited level of restaurant image as a moderator, practitioners who take this into account in their service management could redesign their restaurants to improve the images of their restaurants during and after the COVID-19 pandemic.

Author Contributions

Conceptualization, H.-Y.H. and H.P.; methodology, H.-Y.H.; software, H.-Y.H.; validation, H.-Y.H. and H.P.; formal analysis, H.-Y.H.; investigation, H.P.; resources, H.-Y.H.; data curation, H.-Y.H.; writing—original draft preparation, H.-Y.H.; writing—review and editing, H.P.; visualization, H.-Y.H.; supervision, H.-Y.H.; project administration, H.-Y.H. All authors have read and agreed to the published version of the manuscript.

Funding

This research received no external funding.

Institutional Review Board Statement

Not applicable.

Informed Consent Statement

Not applicable.

Data Availability Statement

Not applicable.

Conflicts of Interest

The authors declare no conflict of interest.

References

  1. Chow, I.H.; Lau, V.P.; Lo, T.W.; Sha, Z.; Yun, H. Service quality in restaurant operations in China: Decision- and experiential-oriented perspectives. Hosp. Manag. 2007, 26, 698–710. [Google Scholar] [CrossRef]
  2. Wall, E.A.; Berry, L.L. The combined effects of the physical environment and employee behavior on customer perception of restaurant service quality. Cornell Hosp. Q. 2007, 48, 59–69. [Google Scholar] [CrossRef]
  3. Parasuraman, A.; Zeithaml, V.A.; Berry, L.L. SERVQUAL: A multiple-item scale for measuring consumer perceptions of service quality. J. Retail. 1988, 64, 12–40. [Google Scholar]
  4. Levitt, T. The Marketing Imagination; Free Press: New York, NY, USA, 1986. [Google Scholar]
  5. Eisingerich, A.B.; Bell, S.J. Does enhancing customers’ service knowledge matter? J. Serv. Res. 2008, 10, 256–268. [Google Scholar] [CrossRef]
  6. Brady, M.K.; Cronin, J.J. Some new thoughts on conceptualizing perceived service quality: A hierarchical approach. J. Mark. 2001, 65, 34–49. [Google Scholar] [CrossRef] [Green Version]
  7. Yi, Y.; La, S. The relative effects of three dimensions of service quality on CS: A comparative study of existing vs. potential customers. Korean Mark. Rev. 2003, 18, 67–97. [Google Scholar]
  8. Kim, D.; Park, S. Customers’ responses to crowded restaurant environments: Cross-cultural differences between American and Chinese. J. Hosp. Leis. Mark. 2007, 16, 137–157. [Google Scholar] [CrossRef]
  9. Lebrun, A.; Su, C.; Bouchet, P. A more sustainable management of domestic tourists in protected natural parks: A new trend in sport tourism after the COVID-19 pandemic? Sustainability 2021, 13, 7750. [Google Scholar] [CrossRef]
  10. EUSME Center. The Food & Beverage Market in China; China-Britain Business Council: Beijing, China, 2015. [Google Scholar]
  11. Mintel. Full-Service Restaurants in China-January-2015; Mintel: London, UK, 2015. [Google Scholar]
  12. Collins-Dodd, C.; Lindley, T. Store brands and retail differentiation: The influence of store image and store brand attitude on store own brand perceptions. J. Retail. Consum. Serv. 2003, 10, 345–352. [Google Scholar] [CrossRef]
  13. Bitner, M.J. Servicescapes: The impact of physical surroundings on customers and employees. J. Mark. 1992, 56, 57–71. [Google Scholar] [CrossRef]
  14. Chemg, C.; Chen, C.; Hsu, F.; Hu, H. Enhancing service quality improvement strategies of fine-dining restaurants: New insights from integrating a two-phase decision-making model of IPGA and DEMATEL analysis. Int. J. Hosp. Manag. 2012, 31, 1155–1166. [Google Scholar] [CrossRef]
  15. Ryu, K.; Han, H. Influence of the quality of food, service, and physical environment on customer satisfaction and behavioral intention in quick-casual restaurants: Moderating role of perceived price. J. Hosp. Tour. Res. 2010, 34, 310–329. [Google Scholar] [CrossRef]
  16. Noone, B.; Kimes, S.; Mattila, A.; Wirtz, J. The effect of meal pace on customer satisfaction. Cornell Hotel. Restaur. Adm. Q. 2007, 48, 231–245. [Google Scholar] [CrossRef] [Green Version]
  17. Berry, L.L.; Carbone, L.P.; Haeckel, S.H. Managing the total customer experience. Sloan Manag. Rev. 2002, 43, 85–89. [Google Scholar]
  18. Ryu, K.; Han, H.; Kim, T. The relationships among overall quick-casual restaurant image, perceived value, customer satisfaction, and behavioral intentions. Int. J. Hosp. Manag. 2008, 27, 459–469. [Google Scholar] [CrossRef]
  19. Kivela, J.; Inbakaran, R.; Reece, J. Consumer research in the restaurant environment, Part 1: A conceptual model of dining satisfaction and return patronage. Int. J. Contemp. Hosp. Manag. 1999, 11, 205–222. [Google Scholar] [CrossRef]
  20. Ryu, K.; Lee, H.; Kim, W. The influence of the quality of the physical environment, food, and service on restaurant image, customer perceived image, customer perceived value, customer satisfaction, and behavioral intentions. Int. J. Contemp. Hosp. Manag. 2012, 24, 200–223. [Google Scholar] [CrossRef]
  21. Burt, S.; Carralero-Encinas, J. The role of store image in retail internationalization. Int. Mark. Rev. 2000, 17, 433–453. [Google Scholar] [CrossRef] [Green Version]
  22. Agarwal, S.; Erramilli, K.M.; Dev, C.D. Market orientation and performance in service firms: Role of innovation. J. Serv. Mark. 2003, 17, 68–82. [Google Scholar] [CrossRef]
  23. Sandvik, I.L.; Sandvik, K. The impact of market orientation on product innovativeness and business performance. Int. J. Res. Mark. 2003, 20, 355–376. [Google Scholar] [CrossRef]
  24. Kirca, A.H.; Jayachandran, S.; Bearden, W.O. Market orientation: A meta-analytic review and assessment of its antecedents and impact on performance. J. Mark. 2005, 69, 24–41. [Google Scholar] [CrossRef] [Green Version]
  25. Mohr, L.A.; Bitner, M.J. The role of employee effort in satisfaction with service transactions. J. Bus. Res. 1995, 32, 239–252. [Google Scholar] [CrossRef]
  26. Grönroos, C. A service quality model and its marketing implications. Eur. J. Mark. 1984, 18, 36–44. [Google Scholar] [CrossRef]
  27. Spreng, R.A.; Mackoy, R.D. An empirical examination of a model of perceived service quality and satisfaction. J. Retail. 1996, 72, 201–214. [Google Scholar] [CrossRef]
  28. Yi, Y. A critical review of consumer satisfaction. In Review of Marketing; Zeithaml, V.A., Ed.; American Marketing Association: Chicago, IL, USA, 1990; pp. 68–123. [Google Scholar]
  29. Anderson, R.E.; Srinivasan, S.S. E-satisfaction and e-loyalty: A contingency framework. Psychol. Mark. 2003, 20, 123–138. [Google Scholar] [CrossRef]
  30. Ryu, K.; Jang, S. Influence of restaurants’ physical environments on emotion and behavioral intention. Serv. Ind. J. 2008, 28, 1151–1165. [Google Scholar] [CrossRef]
  31. Harris, L.C.; Ezeh, C. Servicescape and loyalty intentions: An empirical investigation. Eur. J. Mark. 2008, 42, 390–422. [Google Scholar] [CrossRef]
  32. Kim, W.G.; Moon, Y.J. Customers’ cognitive, emotional, and actionable response to the servicescape: A test of the moderating effect of the restaurant type. Int. J. Hosp. Manag. 2009, 28, 144–156. [Google Scholar] [CrossRef]
  33. Bloemer, J.; Ruyter, K. On the relationship between store image, store satisfaction and store loyalty. Eur. J. Mark. 1998, 32, 499–513. [Google Scholar] [CrossRef]
  34. Castro, C.B.; Armario, M.; Ruiz, M. The influence of market heterogeneity on the relationship between a destination’s image and tourists’ future behavior. Tour. Manag. 2007, 28, 175–187. [Google Scholar] [CrossRef]
  35. Hartman, K.B.; Spiro, R. Recapturing store image in customer-based store equity: A construct conceptualization. J. Bus. Res. 2005, 58, 1112–1120. [Google Scholar] [CrossRef]
  36. Keller, K.L. Conceptualizing, measuring, and managing customer-based brand equity. J. Mark. 1993, 57, 1–22. [Google Scholar] [CrossRef]
  37. Baloglu, S.; Brinberg, D. Affective images of tourism destinations. J. Travel Res. 1997, 35, 11–15. [Google Scholar] [CrossRef]
  38. Grewal, D.; Krishnan, R.; Baker, J.; Borin, N. The effect of store name, brand name and price discounts on consumers’ evaluations and purchase intentions. J. Retail. 1998, 74, 331–352. [Google Scholar] [CrossRef] [Green Version]
  39. Prendergast, G.; Man, H.W. The influence of store image on store loyalty in Hong Kong’s quick service restaurant industry. J. Foodserv. Bus. Res. 2002, 5, 45–59. [Google Scholar] [CrossRef]
  40. Baker, J.; Greqal, D.; Parasuraman, A. The influence of store environment on quality inferences and store image. J. Acad. Mark. Sci. 1994, 22, 328–339. [Google Scholar] [CrossRef]
  41. Cretu, A.E.; Brodie, R.J. The influence of brand image and company reputation where manufacturers market to small firms: A customer value perspective. Ind. Mark. Manag. 2007, 36, 230–240. [Google Scholar] [CrossRef]
  42. Han, H.; Hyun, S.S. Impact of hotel-restaurant image and quality of physical-environment, service, and food on satisfaction and intention. Int. J. Hosp. Manag. 2017, 63, 82–92. [Google Scholar] [CrossRef]
  43. Lee, C.; Lee, Y.; Lee, B. Korea’s destination image formed by the 2002 World Cup. Annu. Tour. Res. 2005, 32, 839–858. [Google Scholar] [CrossRef]
  44. Yoo, B.; Donthu, N.; Lee, S. An examination of selected marketing mix elements and brand equity. J. Acad. Mark. Sci. 2000, 28, 195–211. [Google Scholar] [CrossRef]
  45. Cronin, J.J.; Brady, M.K.; Hult, G.T.M. Assessing the effects of quality, value, and satisfaction on consumer behavioral intentions in service environments. J. Retail. 2000, 76, 193–218. [Google Scholar] [CrossRef]
  46. Bove, L.L.; Johnson, L.W. A customer-service worker relationship model. Int. J. Serv. Ind. Manag. 2000, 11, 491–511. [Google Scholar] [CrossRef]
  47. Ha, H.; John, J. Role of customer orientation in an integrative model of brand loyalty in services. Serv. Ind. J. 2010, 30, 1025–1046. [Google Scholar] [CrossRef]
  48. Chang, T.; Chen, S. Market orientation, service quality and business profitability: A conceptual model and empirical evidence. J. Serv. Mark. 1998, 12, 246–264. [Google Scholar] [CrossRef]
  49. Hennig-Thurau, T. Customer orientation of service employees: Its impact on customer satisfaction, commitment, and retention. Int. J. Serv. Ind. Manag. 2004, 15, 460–478. [Google Scholar] [CrossRef]
  50. Brown, T.J.; Mowen, J.C.; Donavan, D.T.; Licata, J.W. The customer orientation of service workers: Personality trait effects on self-and supervisor performance ratings. J. Mark. Res. 2002, 39, 110–119. [Google Scholar] [CrossRef]
  51. Vargo, S.L.; Lusch, R.F. The four service marketing myths: Remnants of a goods-based, manufacturing model. J. Serv. Res. 2004, 6, 324–335. [Google Scholar] [CrossRef] [Green Version]
  52. Vargo, S.L.; Lusch, R.F. Service-dominant logic: Continuing the evolution. J. Acad. Mark. Sci. 2008, 36, 1–10. [Google Scholar] [CrossRef]
  53. Bitner, M.J.; Booms, B.H.; Tetreault, M.S. The service encounter: Diagnosing favorable and unfavorable incidents. J. Mark. 1990, 54, 71–84. [Google Scholar] [CrossRef]
  54. Kim, H.; Qu, H. Effects of employees’ social exchange and the mediating role of customer orientation in the restaurant industry. Int. J. Hosp. Manag. 2020, 89, 102577. [Google Scholar] [CrossRef]
  55. Kelley, S.W. Developing customer orientation among service employees. J. Acad. Mark. Sci. 1992, 20, 27–36. [Google Scholar] [CrossRef]
  56. Kelly, S.W.; Hoffman, K.D. An investigation of positive affect, prosocial behaviors and service quality. J. Retail. 1997, 73, 407–427. [Google Scholar] [CrossRef]
  57. Hayes, A.F. Introduction to Mediation, Moderation, and Conditional Process Analysis: A Regression-Based Approach; Guilford Press: New York, NY, USA, 2013. [Google Scholar]
  58. Hemmington, N.; King, C. Key dimensions of outsourcing hotel food and beverage services. Int. J. Contemp. Hosp. Manag. 2000, 12, 256–261. [Google Scholar] [CrossRef]
  59. Brady, M.K.; Robertson, C.J.; Cronin, J.J. Managing behavioral intentions in diverse cultural environments: An investigation of service quality, service value, and satisfaction for American and Ecuadorian fast-food customers. J. Int. Manag. 2001, 7, 129–149. [Google Scholar] [CrossRef]
  60. Johns, N.; Pine, R. Consumer behavior in the food service industry: A review. Int. J. Hosp. Manag. 2002, 21, 119–134. [Google Scholar] [CrossRef]
  61. Saxe, R.; Weitz, B.A. The SOSO scale: A measure of the customer orientation of salespeople. J. Mark. Res. 1982, 19, 343–351. [Google Scholar] [CrossRef]
  62. Stern, B.L.; Bush, R.F.; Hair, J.F. The self-image/ store image matching process: An empirical test. J. Bus. 1977, 50, 63–69. [Google Scholar] [CrossRef]
  63. Dabholkar, P.A.; Thorpe, D.I.; Rentz, J.O. A measure of service quality for retail stores: Scale development and validation. J. Acad. Mark. Sci. 1996, 24, 3–16. [Google Scholar] [CrossRef]
  64. Parasuraman, A.; Berry, L.L.; Zeithaml, V.A. Refinement and reassessment of the SERVQUAL scale. J. Retail. 1991, 67, 420–450. [Google Scholar]
  65. Ma, J.; Harvey, M.E.; Hu, M.Y. Assessing the multimensional and hierarchical structure of SERVQUAL. Psychol. Rep. 2007, 101, 378–391. [Google Scholar] [CrossRef]
  66. Ragunathan, R.; Irwin, J.R. Walking the hedonic product treadmill: Default contrast and mood-based assimilation in judgments of predicted happiness with a target product. J. Consum. Res. 2001, 28, 355–368. [Google Scholar] [CrossRef]
  67. Anderson, J.C.; Gerbing, D.W. Structural equation modeling in practice: A review and recommended two-step approach. Psychol. Bull. 1988, 103, 411–423. [Google Scholar] [CrossRef]
  68. Bagozzi, R.P.; Yi, Y. On the evaluation of structural equation models. J. Acad. Mark. Sci. 1988, 16, 74–94. [Google Scholar] [CrossRef]
  69. Fornell, C.; Larcker, D.F. Evaluating structural equations models with unobservable variables and measurement error. J. Mark. Res. 1981, 18, 39–50. [Google Scholar] [CrossRef]
  70. Kim, H. Service orientation, service quality, customer satisfaction, and customer loyalty: Testing a structural model. J. Hosp. Mark. Manag. 2011, 20, 619–637. [Google Scholar] [CrossRef]
  71. Su, L.; Swamson, S.R.; Chen, X. The effects of perceived service quality on repurchase intentions and subjective well-being of Chinese tourists: The mediating role of relationship quality. Tour. Manag. 2016, 52, 82–95. [Google Scholar] [CrossRef]
  72. Bell, S.J.; Auh, S.; Smalley, K. Customer relationship dynamics: Service quality and customer loyalty in the context of varying levels of customer expertise and switching costs. J. Acad. Mark. Sci. 2005, 33, 169–183. [Google Scholar] [CrossRef]
  73. Luo, Y.; Xu, X. Comparative study of deep learning models for analyzing online restaurant reviews in the era of the COVID-19 pandemic. Int. J. Hosp. Manag. 2021, 94, 102849. [Google Scholar] [CrossRef]
  74. Stock, R.M.; Hoyer, W.D. An attitude-behavior model of salespeople’s customer orientation. J. Acad. Mark. Sci. 2005, 33, 536–552. [Google Scholar] [CrossRef]
  75. Westbrook, R.A.; Oliver, R.L. The dimensionality of consumption emotion patterns and consumer satisfaction. J. Consum. Res. 1991, 18, 84–91. [Google Scholar] [CrossRef]
  76. Rust, R.T.; Moorman, C.; Dickson, P.R. Getting return on quality: Revenue expansion, cost reduction, or both? J. Mark. 2002, 66, 7–24. [Google Scholar] [CrossRef]
  77. Kim, J.; Song, H.; Youn, H. The chain of effects from authenticity cues to purchase intentions: The role of emotions and restaurant image. Int. J. Hosp. Manag. 2020, 85, 102354. [Google Scholar] [CrossRef]
  78. Dagogo-Jack, S.W.; Beck, J.T.; Kaju, A. The effect of duration metrics on consumer satisfaction. Psychol. Mark. 2020, 37, 441–456. [Google Scholar] [CrossRef]
  79. Viglia, G.; Maras, M.; Schumann, J.; Navarro-Martines, D. Paying before or paying after? Timing and uncertainty in pay-what-you-want pricing. J. Serv. Res. 2020, 22, 1525–1538. [Google Scholar] [CrossRef] [Green Version]
  80. Moisieiev, D.; Dimitriu, R.; Jain, S.P. So happy for your loss: Consumer schadenfreude increases choice satisfaction. Psychol. Mark. 2020, 37, 1525–1538. [Google Scholar] [CrossRef]
Figure 1. Conceptual model.
Sustainability 13 09694 g001
Figure 2. Moderating effect of restaurant image: H3.
Sustainability 13 09694 g002
Figure 3. Moderating effect of customer orientation: H5.
Sustainability 13 09694 g003
Figure 4. Moderating effect of customer orientation: H6.
Sustainability 13 09694 g004
Table 1. Results of the CFA analysis.
ConstructsFactor LoadingComposite ReliabilityAverage Variance Extracted
Customer Orientation
Employees go beyond the normal call of duty to please customers.0.790.880.88
Employees understand what service attributes customers value most.0.72
Employees are given adequate resources to meet customer needs.0.68
Employees understand the customers’ real problems.0.74
Restaurant Image
I have a favorable attitude toward the restaurant.0.730.900.58
I trust the restaurant’s image.0.77
I have overall goodwill toward the restaurant.0.76
The restaurant carries a wide selection of different kinds of services.0.80
Process Service Quality
The physical facilities of the restaurant are visually appealing.0.780.890.55
When you have a problem, the restaurant shows a sincere interest in solving it.0.71
Employees of the restaurant are always willing to help you.0.74
The restaurant has operating hours that are convenient for all its customers.0.73
Outcome Service Quality
The restaurant is of high quality.0.760.880.56
The likelihood that the restaurant is reliable is very high.0.72
The restaurant has delicious food.0.78
Satisfaction
Overall, I am satisfied with specific experiences with the restaurant.0.760.910.62
I am satisfied with my decision to experience this restaurant.0.82
Table 2. Discriminant validity (N = 547).
12345MSD
1.Customer orientation0.543.380.84
2. Restaurant image 0.220.583.520.78
3. Process service quality 0.250.270.553.710.88
4. Outcome service quality0.240.320.190.563.550.91
5. Satisfaction0.380.350.290.410.623.670.82
Note: The diagonal entries (in bold italics) represent that the average variance extracted by the dimension.
Table 3. Moderated moderation results (Process model = 3).
CoefficientSEtLLCIULCI
Constant6.7023.7251.7980.64314.047
Restaurant type0.0620.1150.542−0.1640.289
Process service quality (PRSQ: H1)2.402 *1.0892.2060.2554.549
Restaurant image (RI)6.199 **2.4062.5761.45410.943
Customer orientation (CO)6.548 **2.5912.5271.43911.657
PRSQ * RI (H3)1.701 *0.6722.5320.3763.026
PRSQ * CO (H5)1.651 *0.7052.3420.2613.040
RI * CO4.794 **1.5533.0871.7327.855
PRSQ * RI * CO (H7)1.294 **0.4133.1340.4802.108
Constant2.928 *1.5061.9450.0405.896
Restaurant type0.0810.0521.5600.0210.184
Outcome service quality (OSQ: H2)1.782 *0.5952.9920.6082.956
Restaurant image (RI)3.122 **1.1312.7590.8915.353
Customer orientation (CO)2.703 **0.8473.1931.0344.372
OSQ * RI (H4)0.7630.4391.7360.1031.631
OSQ * CO (H6)1.041 **0.3213.2470.4091.674
RI * CO1.372 *0.6032.2730.1822.561
OSQ * RI * CO (H8)0.534 *0.2292.3820.0820.985
Notes: *, p < 0.05; **, p < 0.01.
Table 4. Test of conditional process (or outcome) service quality * restaurant image interaction at value(s) of customer orientation.
Customer OrientationEffectFp-Value
PRSQ * RI
Low−0.4071.7680.185
High0.886 **10.2540.001
OSQ * RI
Low−0.2301.1290.289
High0.303 **16.9080.000
Notes: *, p < 0.05; **, p < 0.01.
Publisher’s Note: MDPI stays neutral with regard to jurisdictional claims in published maps and institutional affiliations.

