1. Introduction
Land application of wastewater has increased since the amendments to the Federal Water Pollution Act of 1972 set the goal to eliminate the discharge of pollutants to navigable waters. This reuse of wastewater protects surface waters from fecal, chemical, and physical pollution; enriches the soil with organic matter; and recycles inorganic nutrients. Wastewater reuse through irrigation saves water and reduces treatment costs, waste hazards, and health risk in the environment. Due to the presence of human pathogens, irrigation practices have severe limitations if reclaimed wastewater is used for food crops because of food safety and food-borne illnesses.
Pathogenic microorganisms are considered one of the highest risk factors for surface water quality and human health [
1] because of direct and indirect exposures to potential pathogens in wastewater. Reclaimed water produced from domestic wastewater contains many bacterial, viral, and parasitic human pathogens. One goal in wastewater treatment is to reduce the disease-causing agents to acceptable levels. In drinking water, the number of total coliforms should be <1/100 mL. The most commonly used fecal bacterial indicator,
Escherichia coli, indicates the presence of fecal contamination from sewage, animal manure, or wildlife.
Water from precipitation and irrigation moves into the soil where some will run off or evaporate and some is used by plants through evapotranspiration as a part of the hydrologic cycle. The remaining water can infiltrate the soil until it reaches field capacity, which is the water remaining after the soil drains freely. The excess water usually drains away into groundwater in one to two days [
2]. The drainage rate is governed by the soil texture. Silt loam and silty clay loam soils are rated as moderately permeable. The movement of water through the soil slows down in cold temperatures as the viscosity of water increases [
3].
The pathway for water movement is built by macropores in soil [
4]. Macropore flow can significantly reduce the retention time of bacteria and viruses in soil, thus resulting in the contamination of groundwater. Smith and others [
4] concluded that any soil type with macrospores that receives enough water to saturate the pores has the potential to transport bacteria vertically. Macropores can be formed by earthworms. Williams and others [
5] monitored a contaminated soil subjected to earthworm digestion over 21 days. They found that anecic earthworms such as
Lumbricus terrestris significantly aided vertical movement of
E. coli in soil, whereas epigeic earthworms such as
Dendrobaena veneta significantly aided the lateral movement within the soil.
To prevent groundwater from being contaminated by pathogenic microorganisms in reclaimed water, soil absorption processes are necessary. Because bacteria and viruses have an electrical charge, they can be immobilized as they are adsorbed by soil particles [
6]. The retention and reduction of bacterial numbers in soil are complicated processes that involve soil entrapment, nutrients, temperature, moisture content, soil compaction, clay minerals, humic fraction, and toxic components.
Soil must be deep enough and unsaturated to filter pathogens from treated wastewater. It has been reported [
7,
8,
9] that 0.6 to 1.2 m of unsaturated soil below an on-site wastewater treatment system is sufficient to remove most bacteria and viruses. The main bacterial removal mechanisms as wastewater moves through unsaturated soil are filtration and retention. Bacterial in the size range from 0.2 to 5 μm are entrapped if the soil pores are smaller than this range. The movement of
E. coli in soil columns decreases with increasing dry bulk density. Specifically, the presence of macropores and degree of compaction impact the transportation of
E. coli [
10,
11].
Temperature impacts the survival of
E. coli in the soil environment. The highest survival of
E. coli is in the coldest soils [
12,
13,
14]. Biotic factors affect
E. coli survival in the soil. Die-off rates of
E. coli have been shown to be rapid in native soils as compared to pre-sterilized soils. Predation and competition in native soil and wastewater influence
E. coli survival [
12,
15]. Indigenous soil microbes can have adverse effects on
E. coli due to predation and more favorable growth conditions. Sunlight facilitates coliform inactivation on soil surfaces more in the summer than in the winter [
13,
16].
In general, E. coli can potentially move through the soil to groundwater or subsurface drains under wet, cold, and dark winter conditions. Thus, the goal of this study was to examine E. coli movement in reuse of reclaimed wastewater scenarios during winter conditions. The specific objective was to determine if winter reuse of undisinfected wastewater moves bacteria to groundwater or surface water through subsurface drainage, thus posing a public health risk. E. coli vertical movement was examined in relation to soil temperature, moisture, and depth of saturation at the study site.
2. Materials and Methods
The study site is located within the Deer Creek State Park, which lies on the eastern edge of a till plain in south central Ohio (39.6301° N, 83.2510° W). This region is mainly woodland, and the wastewater treatment plant and irrigation field are in an open meadow area. The system was designed and constructed by the U.S. Army Corps of Engineers in the 1970s.
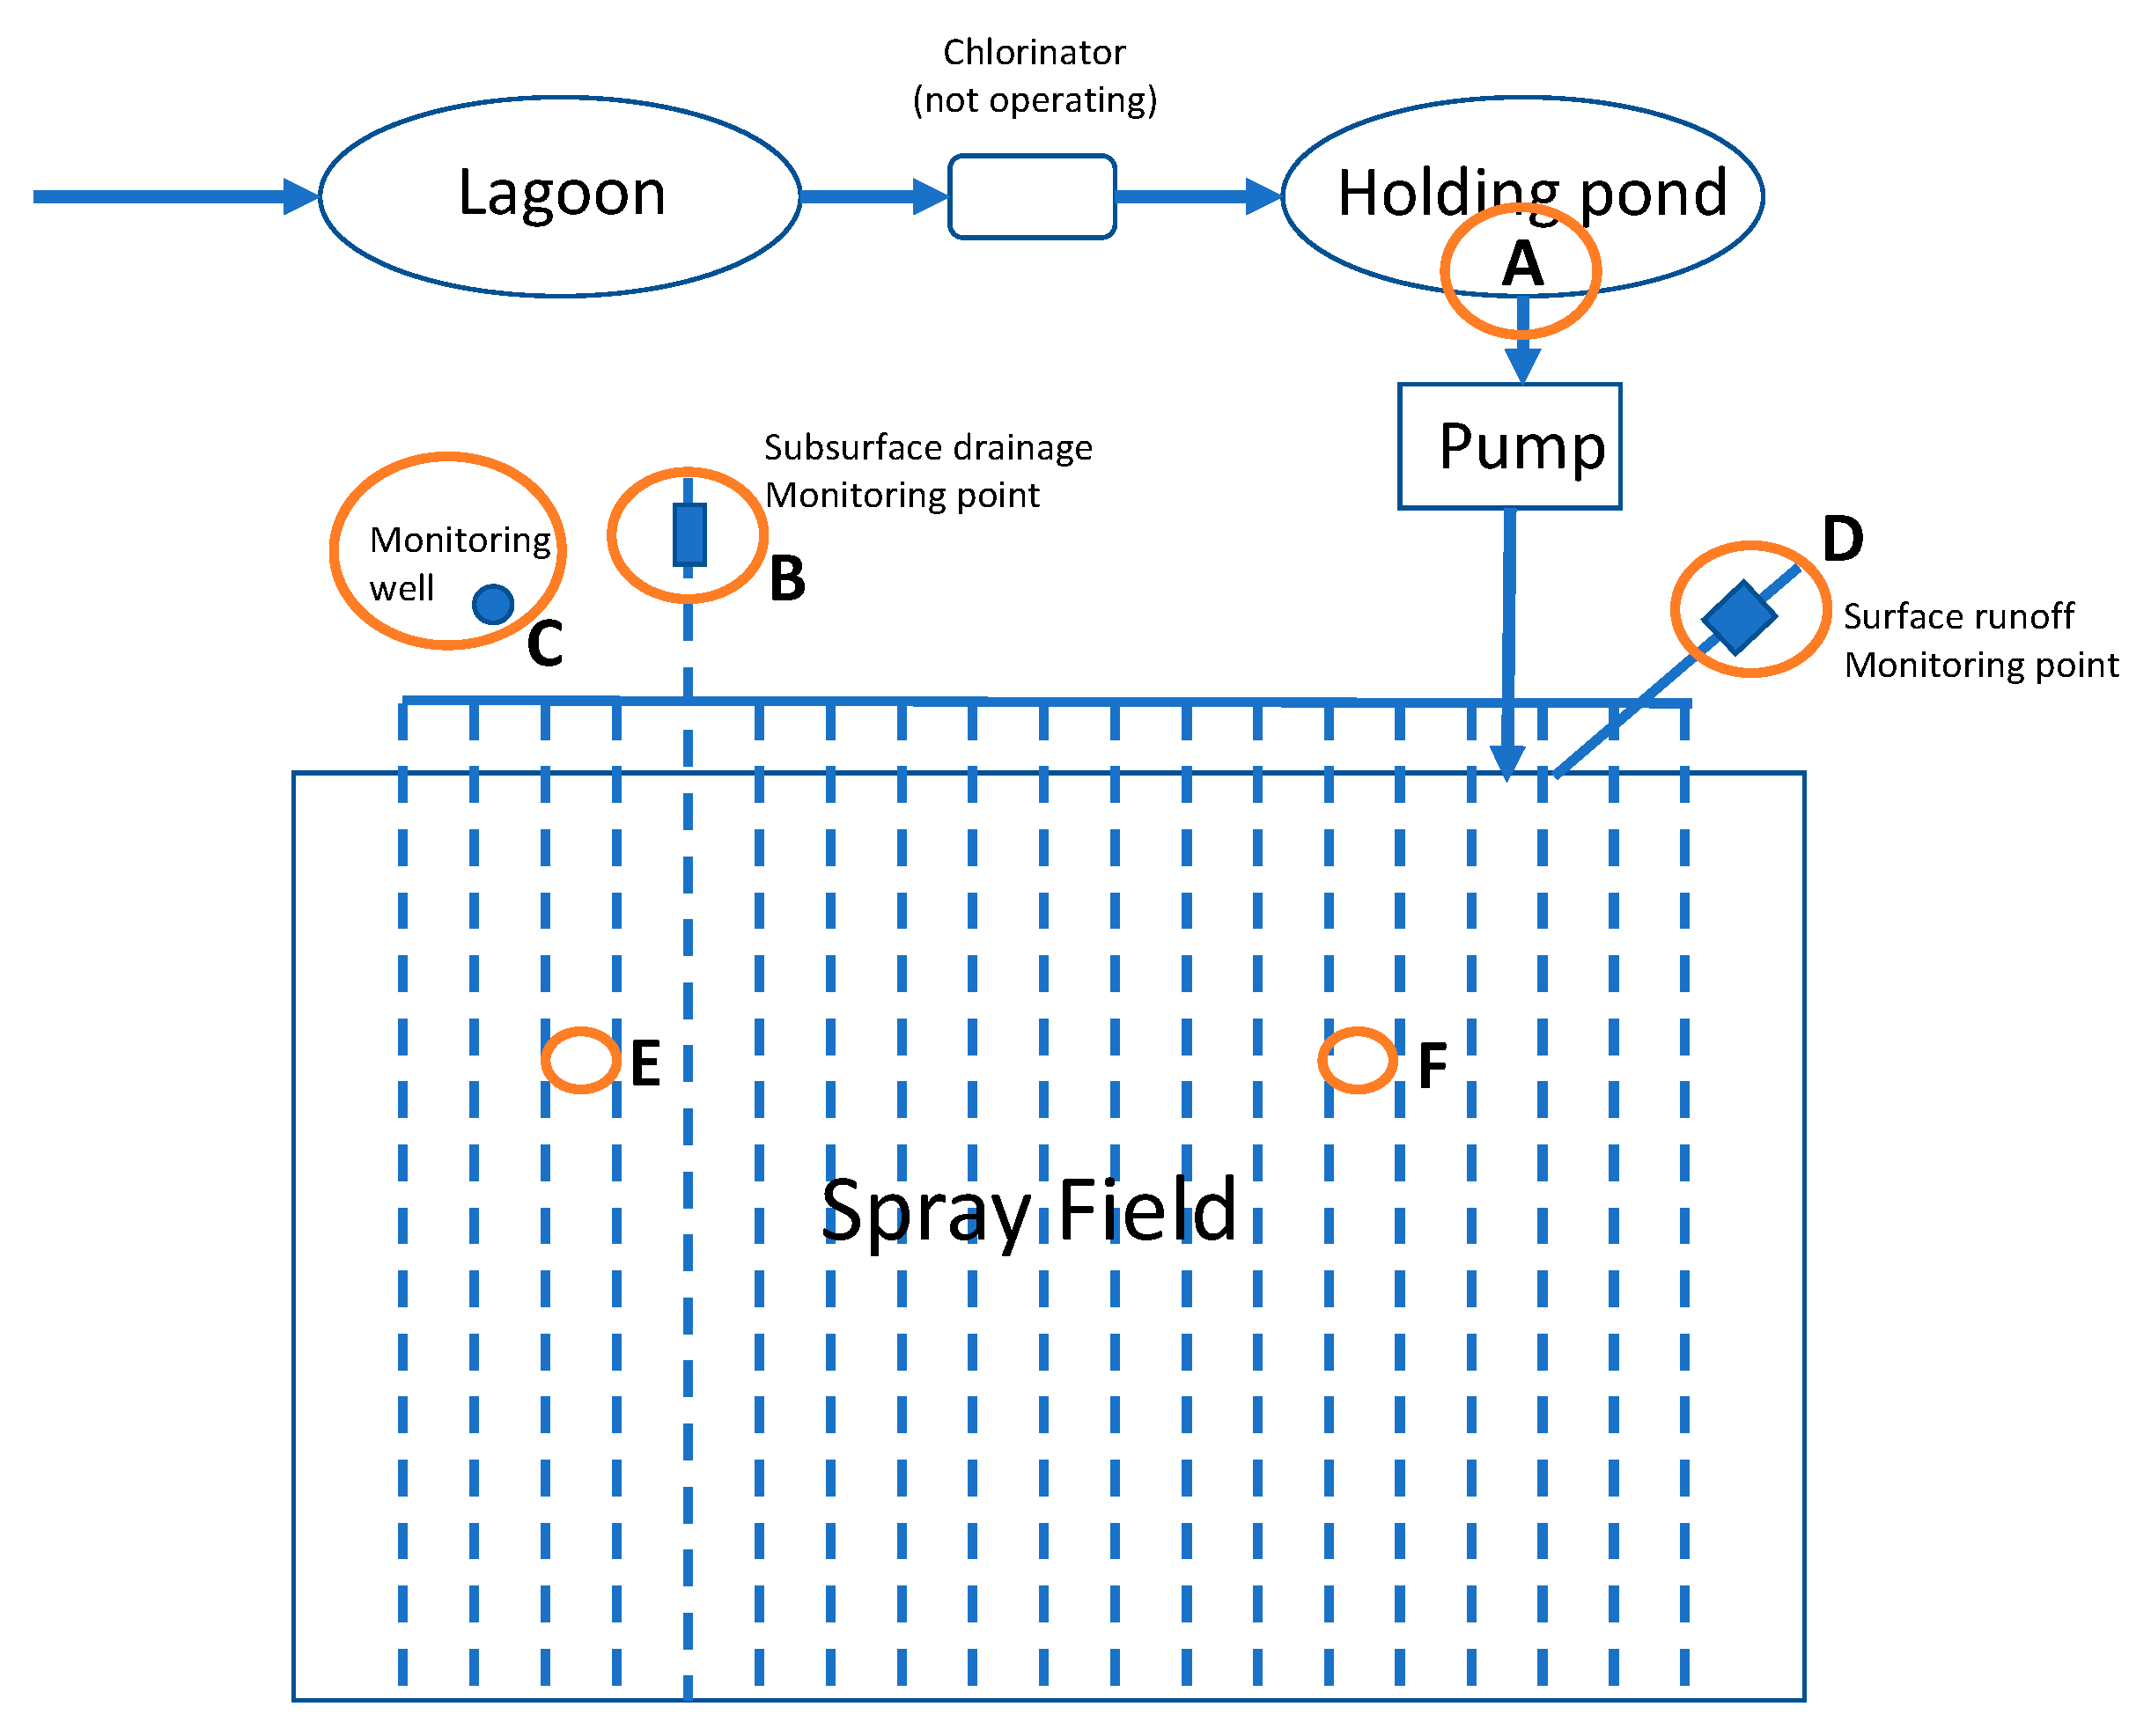
The wastewater comes from the visitor lodge and cabins, campgrounds, and a golf course. A bar screen serves as the pre-treatment system to remove large solids before discharge into a sewage lagoon (stabilization pond) that provides secondary treatment to remove suspended solids, organic matter, and microorganisms. A holding pond follows the sewage lagoon and wastewater is pumped from there to the spray irrigation field. A chlorination facility is positioned between the treatment lagoon and the holding pond, but the chlorinator was not in use during the study period. The wastewater treatment and irrigation system are outlined in
Figure 1. The sewage lagoon is designed to operate between the depths of 0.9 m to 1.5 m by a decanting device. The lagoon hydraulic retention time ranges from 73 to 61 days. The retention time of the holding pond is no more than 28 days [
17].
The spray field is a mowed, grass meadow to the east of the lagoon system. This 48,562 m2 spray field is equipped with 16 lines each having 14 sprayers on 45 cm risers equipped with impact drive sprinklers (Rain Bird 29B-TNT, Rain Bird Corp., Azura, AZ, USA). The system is divided into four irrigation zones with 12,141 m2 tracts. The irrigation changes from zone to zone at 15-min intervals.
2.1. Sampling Locations and Sample Collection Methods
The sampling locations are shown in
Figure 1. Samples were collected at the holding pond (sampling site A) and from the subsurface drain outlet (site B). Soil moisture sensors (Decagon EC-5 sensors coupled with Em50 data loggers, ICT International, Armidale, Australia) and temperature sensors (HOBO TMC20-HD sensors coupled with HOBO U-series 4-channel dataloggers Onset, Bourne, MA, USA) were installed in the spray field.
Groundwater samples and depths were measured in a monitoring well (site C), and surface runoff was sampled at a collection weir (site D). Samples were placed in sterile Nasco Whirl-Pak® (Madison, WI, USA) sampling bags with the volume of ~800 mL and stored on ice in a dark cooler for testing within 2 h. The study site was less than a 45-min drive from the lab.
Irrigation water samples were collected directly from the holding pond (
Figure 1A) and in metal pans placed in the irrigation field. Three 33 cm × 23 cm stainless pans were used to collect wastewater samples distributed in the field. Wastewater samples from the holding pond were collected with a graduated dipper with a handle length of 30 cm and 500 mL bowl. Water and wastewater samples were collected at the time of irrigation.
2.2. Sample Analysis Methods
Water samples were tested for E. coli by membrane filtration method (USEPA Method 1103.1). Water samples of 100 mL were filtered through sterile filter membranes (47 mm diameter and 0.45 µm pore size), and the membranes were transferred to a modified m-TEC media. The plates were incubated for 2 h at 35 °C followed by 22 h at 44.5 °C. Magenta colored colonies were counted as E. coli and the colony counts were converted to colony forming units (CFU) per 100 mL original sample.
The soil survey for the area was conducted by USDA and is published on the Web Soil Survey system [
18]. The area includes three soil series, Miamian-Lewisburg (MIB) silt loams, Crosby (CrA) silt loam, and Kokomo (Ko) silty clay loam.
Table 1 shows the series and properties of soil. The loamy soils are expected to retain at most 0.35 m
3 water/m
3 soil.
2.3. Soil Conditions
Soil temperature and moisture sensors were installed in March 2013 to conduct yearlong monitoring of the soil conditions. The soil sensors were placed at depths of 15, 30, 46, and 61 cm.
Daily climatology data including maximum and minimum air temperatures and precipitation were retrieved from NOAA National Climatic Data Center [
19] at Circleville, OH, USA located 34.8 km (21.6 miles) southeast of the park.
To monitor performance of the irrigation system, the US Army Corp of Engineers installed groundwater monitoring wells. The monitoring well, with 15 cm diameter and 4.3 m depth, was located 15 m outside of the irrigation field. The depth of groundwater was measured by 101 P7 Water Level Meter (Solinst©, Georgetown, ON, Canada).
The subsurface drainage system under the entire field was installed with 32 PVC perforated pipes, 15 cm diameter and 186 m length, and installed a depth of 76 to 107 cm. All subsurface drainage pipes discharged to a central flume for sample collection (sampling site B).
To test for trends in soil conditions changing with time the daily means of the temperatures and soil moisture were compared using a two tailed paired t-test.
3. Results
Lagoon-treated wastewater was irrigated at the Deer Creek State Park on an open, flat meadow site. No wastewater was irrigated December 2012 through March 2013 winter season, and this period served as a control. Winter irrigation started on 23 October 2013 and continued through 22 March 2014. Beginning in the 1970s, wastewater was irrigated only during the summer because of concerns over equipment failure due to freezing in the winter. For this project, wastewater was irrigated during the winter of 2014 for the first time and equipment failures were not experienced.
The counts of
E. coli in subsurface drainage water during the winters of 2013 and 2014 are shown
Table 2 and
Table 3. When sprayed through the air and onto the plant surfaces, the
E. coli in wastewater is exposed to sunlight as a natural inactivation process. During daytime irrigation cycles, spray irrigation effluent was collected in sterilized metal pans for 2 to 3 h and tested for
E. coli. The wastewater in pan exposed to 2 to 3 h of sunlight experienced up to 3-log
E. coli reductions (
Table 4).
Impact of Soil Conditions on E. coli Removal
During the non-irrigated season (December 2012 to March 2013),
E. coli counts were detected in two out of six subsurface drainage samples. Precipitation events for the non-irrigated season are shown in
Table 2. On 7 February 2013, the water table was within the depth of the subsurface drainage system and
E. coli was detected in the drainage water. Five days later, as the groundwater dropped below the drainage system,
E. coli was still detected. However, once the groundwater depth stayed below the subsurface drainage system, even with precipitation,
E. coli could not be detected in the subsurface drainage water, even though the drain continued to flow throughout the winter. With no human wastewater inputs of
E. coli during this time, the fecal source in these two samples during the non-irrigated period may be wildlife (e.g., deer, racoons, and other animals).
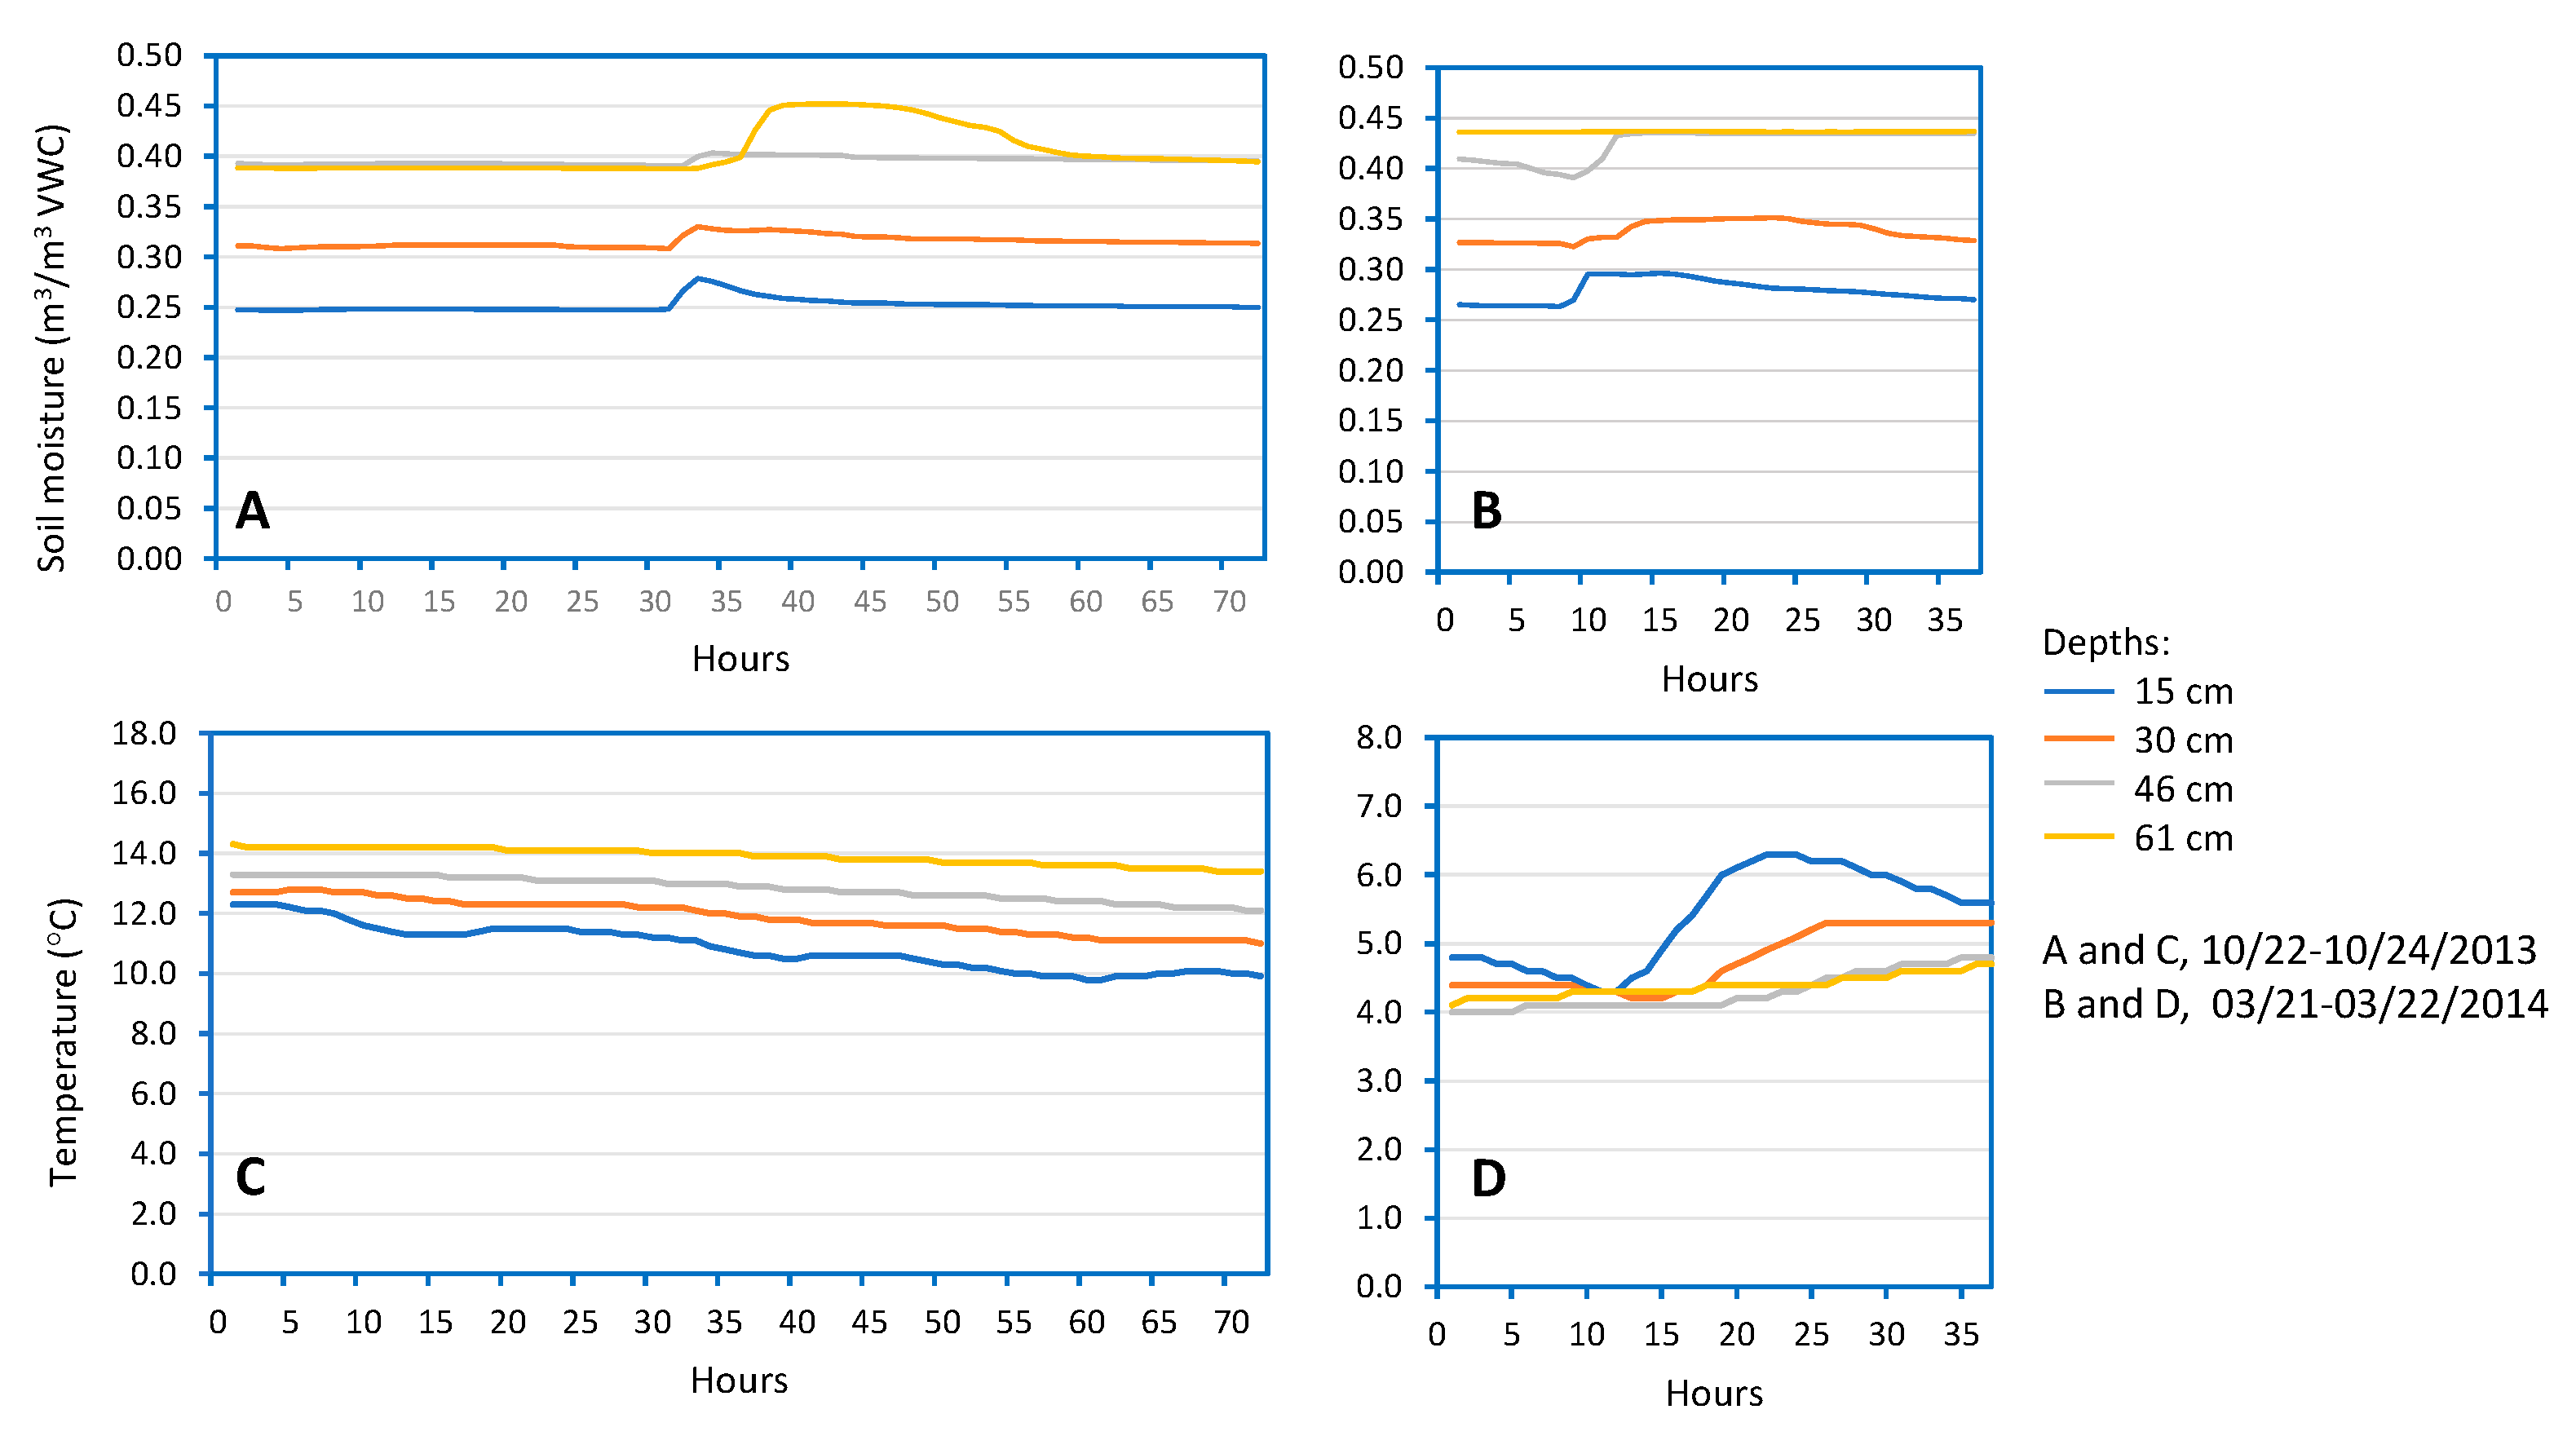
Soil temperature and moisture content were monitored in the irrigation field at Deer Creek State Park during the winter irrigation season. The temperature and moisture were measured at four depths before and after the irrigation practices. The data showed an increasing trend of moisture and temperature with soil depth. The moisture and soil temperature were significantly positively related (with adjusted R2 value is at least 0.99 and p-value = 0.0016) at the same depth of soil.
The soil moisture increased in response to the application of 4.5–5 cm treated wastewater in the fall (October 23) and in the spring (March 22) (
Figure 2). The shallow (15 cm) soil temperature was 10 °C in the fall and after a cold winter rose to 5 °C in the spring.
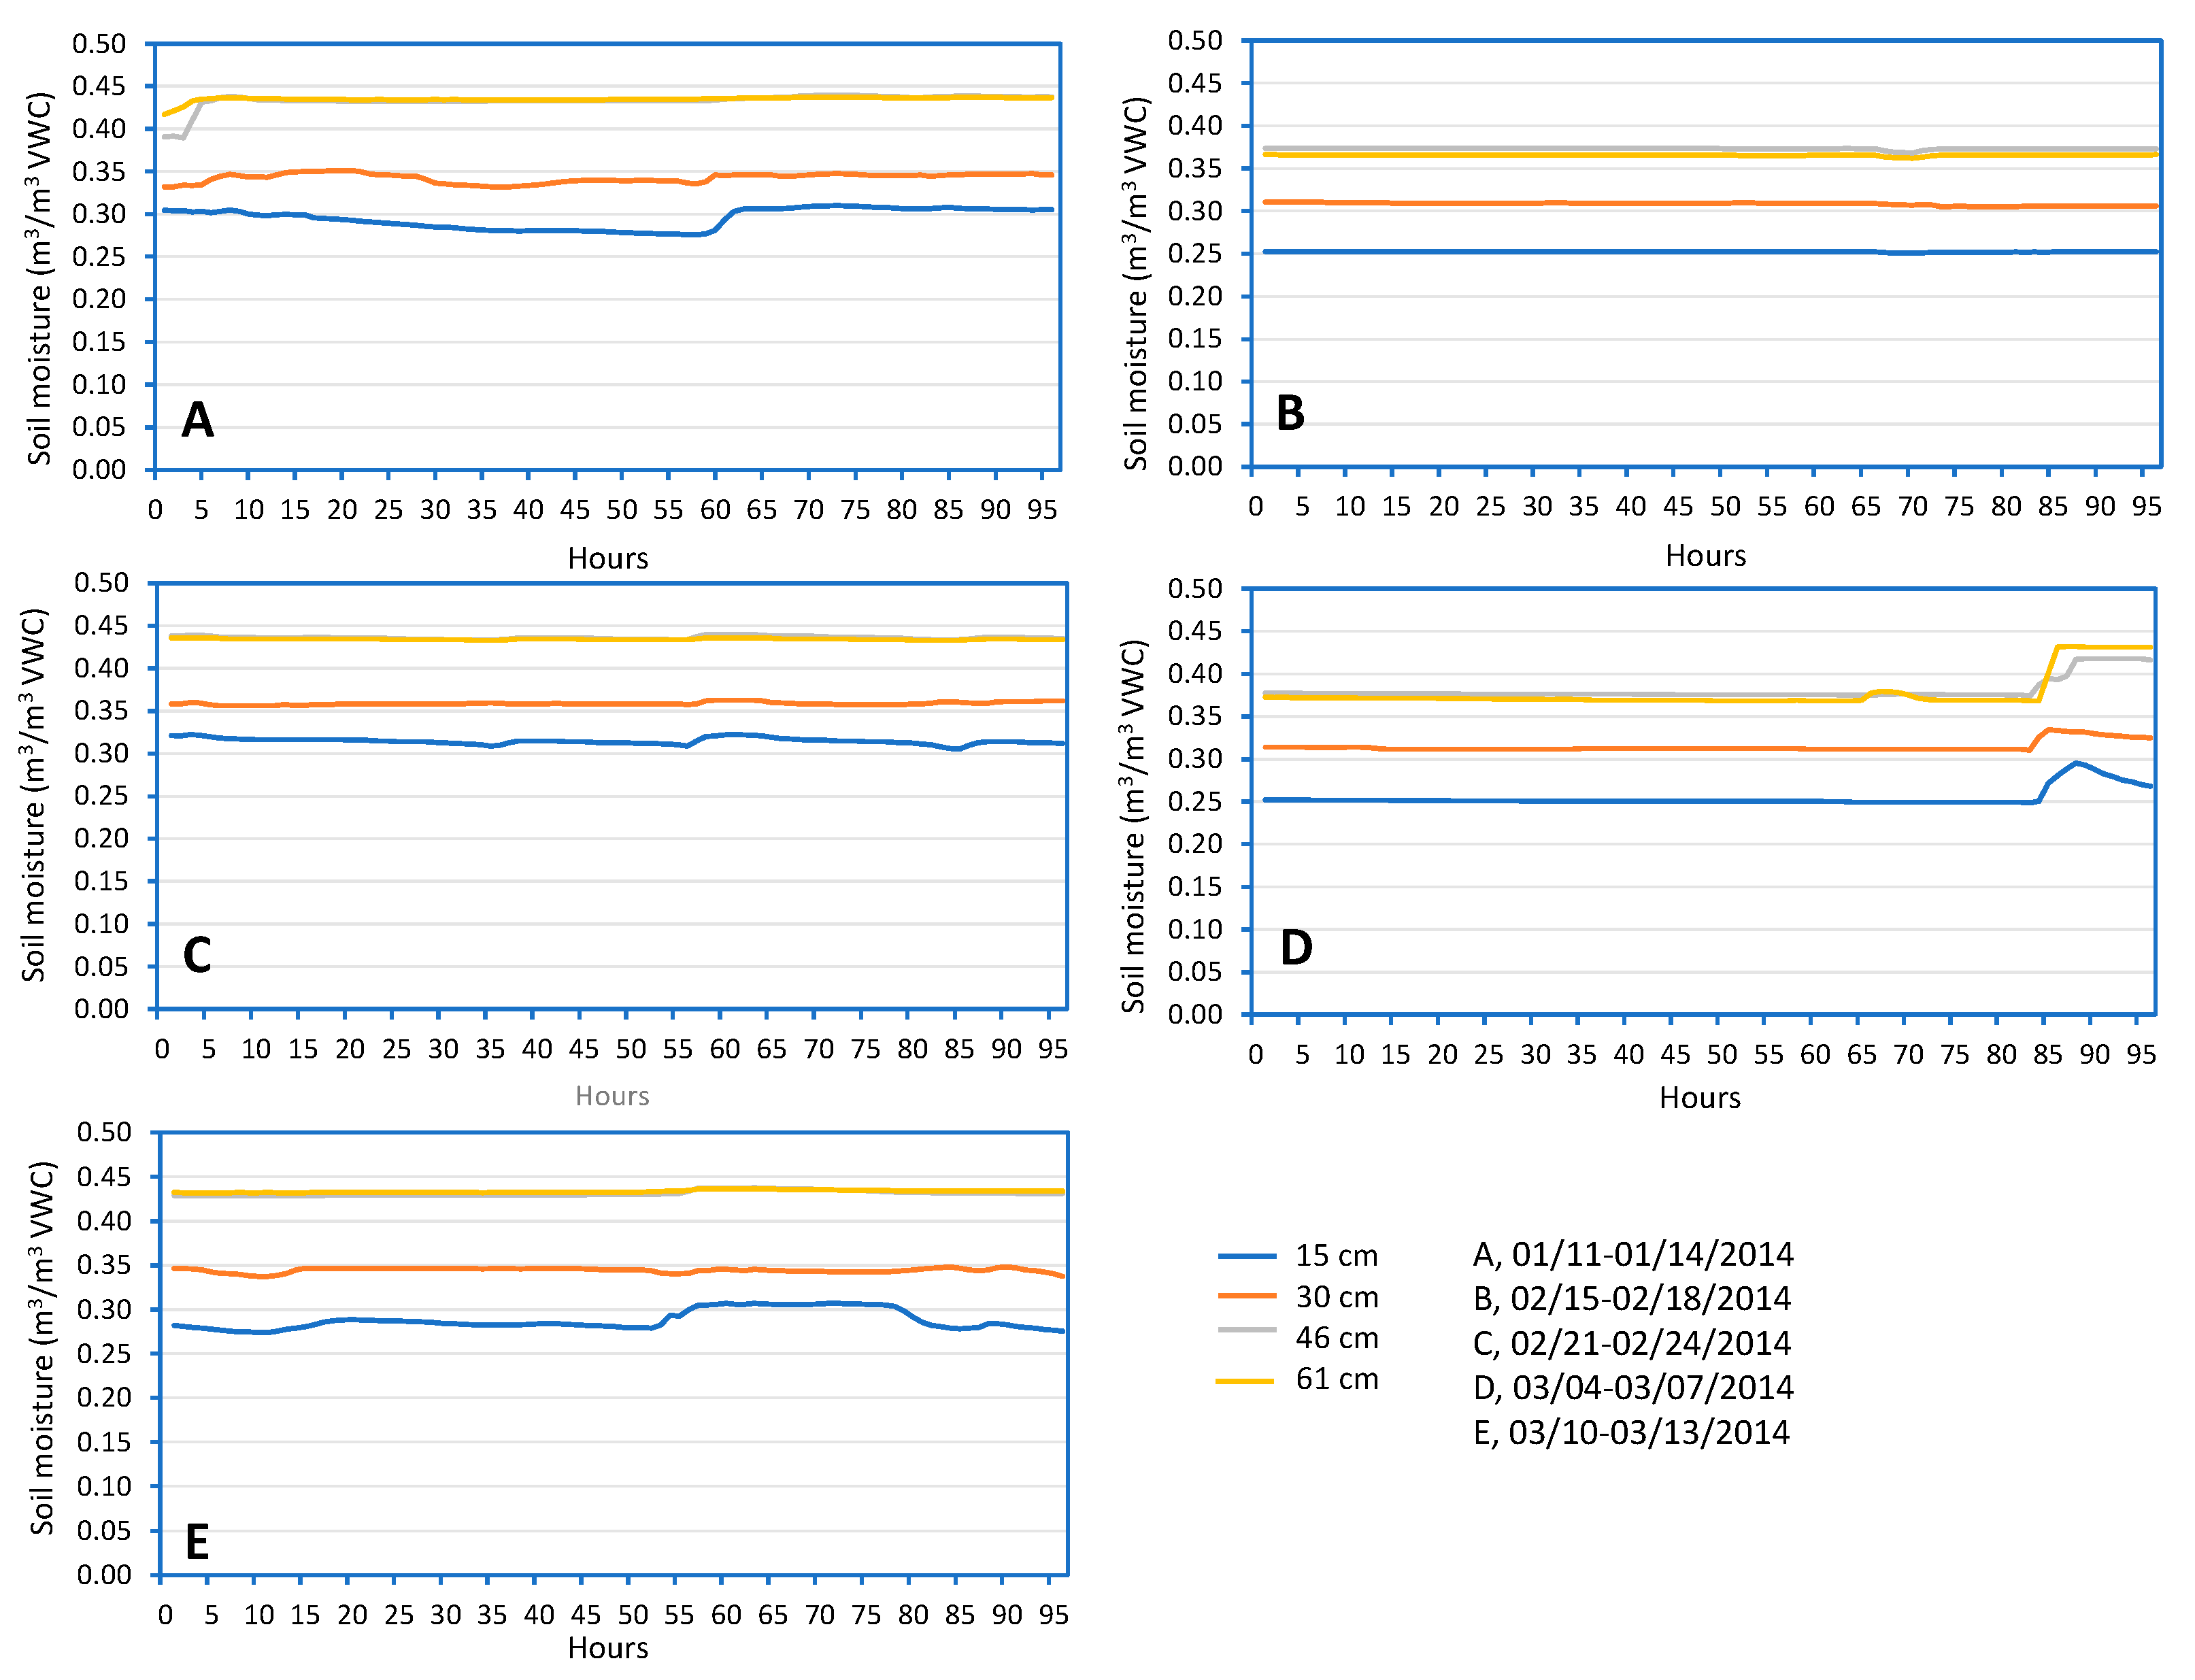
Throughout the winter the shallow soil temperature dropped below 1.5 °C and was as low as 0.3 °C during January, February, and the beginning of March. During these winter months irrigation of 4.5–6 cm of treated wastewater did not change soil moisture at the site (
Figure 3).
With warmer weather and more sunlight in the fall and spring, evapotranspiration was drying out the surface soil between precipitation and irrigation events. The drier soil attenuated the movement of wastewater, allowing for natural inactivation of bacteria. When the shallow soil temperature dropped to near freezing and with less sunlight in the winter, evapotranspiration was minimal, and the soil stayed moist near field capacity. The addition of precipitation and irrigated wastewater did not change the soil moisture. With the soil at field capacity, wastewater drained through the moist soil. With cold soil temperature (less than 1.5 °C) natural inactivation was limited, and E. coli was moved through the soil to the drainage system.
During the winter irrigation season
E. coli was detected three times in the subsurface drainage (
Table 3). Irrigation water applied on the day of the sampling in combination with precipitation (
Table 5) that occurred in the 3 days, washing bacteria to the subsurface drainage system. Even seven days later
E. coli was detected.
The wastewater irrigated in October and again in January contained very low counts of
E. coli because natural inactivation in the lagoon facilitated die-off. Some
E. coli was detected in the drainage system when the water table rose above the level of the drain. Starting in mid-February,
E. coli counts in the wastewater effluent increased by 3-log (
Table 5). High
E. coli counts were initially attenuated, but within a week high numbers of
E. coli were moving through the cold, wet soil to the subsurface drainage system.
By the end of March, soil temperatures were beginning to rise, the groundwater table had dropped below the level of the drains, and more sunlight was starting to provide natural inactivation in the wastewater lagoon. E. coli counts in the irrigated wastewater dropped and were not detected in the subsurface drainage system.
In this field site, E. coli was not detected (<2 CFU/100 mL) in the groundwater, 15 m away from the irrigation field during the irrigation and non-irrigation season. This finding indicates that the horizontal movement of bacteria was limited on the relatively flat land.
4. Discussion
In this project, the main goal was to investigate the movement of
E. coli in the soil and infiltration through the unsaturated soil column when treated wastewater was applied on soil surface.
E. coli counts in the reclaimed wastewater were already low due to the natural die-off processes in the lagoon system, which functioned as a stabilization pond. During daytime irrigation,
E. coli was exposed to sunlight facilitating die-off and the movement of the remaining
E. coli into the soil was very limited. At least a 2-log reduction in
E. coli counts was observed when the wastewater was exposed to sunlight for 2 to 3 h, but the bacteria infiltrated into the soil relatively quickly, reducing the chance for natural removal. Standridge [
16] concluded that the effect of sunlight on coliform inactivation was most noticeable in late June, when the bacteria were completely removed from samples after 1–2 h of exposure. While this experiment in the present work was conducted during late autumn and winter, when the sun irradiation is not as strong as in June,
E. coli numbers were still somewhat reduced through natural decay.
In the field study,
E. coli was not detected in the groundwater, 15 m away from the irrigation field both in irrigation and non-irrigation season. The Ohio Department of Health [
20] recommendation is supported by this finding that all components of sewage treatment system should be at least 15 m away from any water supply source.
The irrigation practice of as much as 5 cm over two hours on the soil did not change soil moisture and temperature conditions substantially at the monitored depths. Irrigation at this rate, in combination with precipitation, did contribute to saturated soil conditions by raising the water table in the irrigation field. The irrigation rate of about 2.5 cm/hour at the Deer Creek State Park is similar to a high intensity rainstorm. Slower and more frequent irrigation would help to slow the movement of reused wastewater through wet, cold soil.
The low soil temperatures recorded in this study appeared to enhance survival and movement of
E coli. These findings were similar to a microcosm study, where Vidovic and others [
12] looked at
E. coli survival in soils at −21, 4 and 22 °C. They found the highest survival of
E. coli in the coldest soils. Noble and others [
13] examined survival of
E. coli in sewage and stormwater runoff. They found bacteria were inactivated more rapidly at 20 °C than at 14 °C.
During cold, wet soil conditions
E. coli moved through 76 to 107 cm to the subsurface drain. Peterson and Ward [
7] studied the movement of common wastewater bacteria in a coarse soil that was irrigated with reclaimed wastewater. They found that 60 to 120 cm of unsaturated soil below an on-site wastewater treatment system was sufficient to remove most bacteria and viruses in the test soils. Karathanasis and others [
8] studied the movement of fecal coliforms through 30, 45, and 60 cm in undisturbed soil monoliths in the laboratory. They found movement of bacteria through 30 cm of coarse textured soil and that removal improved with 60 cm thickness. This study suggests that 60 cm depth is sufficient for
E. coli removal in winter in this meadow system, and summertime irrigation should need less depth for comparable removal. Regardless of the season, supplemental disinfection should be practiced.
5. Conclusions
In summary, the outcome of this study can fill the knowledge gap about survival and movement of potential enteric bacterial pathogens in subsurface soil and ground water when wastewater is applied on soil during cold and wet conditions. Winter reuse of undisinfected wastewater does pose a public health risk to surface water through subsurface drainage. This project went on to help understand how soil conditions impact E. coli movement in cold, wet soil conditions.
This study investigated the removal of E. coli as a function of the soil temperature, moisture, and depth of soil saturation. When soil temperature was coldest in February, the soil remained wet and irrigation practices did not change the soil conditions significantly during cold weather when evapotranspiration is limited. As a result, the irrigated wastewater drained quickly through the wet and cold soil and had lower E. coli removal, allowing their movement to subsurface drainage.
Wastewater irrigation practices during the winter do not change the soil temperature and moisture in a short period, but high soil moisture content tends to provide a better pathway for E. coli movement through the soil. Greater depth to water tables shows higher E. coli removal efficiency as the unsaturated soil condition enhances natural inactivation processes. E. coli traveled downward to subsurface drainage in response to winter irrigation, and the likely driving force of this movement was the presence of macropores combined with the hydraulic force provided by irrigation water and precipitation.
Temperature appears to be the most important factor in limiting natural inactivation, allowing the movement of E. coli in wastewater to the subsurface drainage systems. The irrigation of undisinfected wastewater to sites with subsurface drainage is not an appropriate practice for winter as it provides the opportunity to move E. coli too quickly through the soil to allow for natural die-off. To protect public health, treated wastewater should be disinfected year-round and lower winter irrigation rates should be considered in an effort to control slow movement of any remaining pathogens through wet, cold soil.
Author Contributions
Conceptualization, K.M. and O.H.T.; methodology, G.D., K.M., J.L., and O.H.T.; formal analysis, G.D. and K.M.; investigation, G.D.; resources, K.M. and J.L.; writing—original draft preparation, G.D.; writing—review and editing, K.M., J.L., and O.H.T.; visualization, G.D.; supervision, K.M.; project administration, K.M.; funding acquisition, K.M. All authors have read and agreed to the published version of the manuscript.
Funding
This research was funded by the Ohio Water Development Authority. Salary and partial research support to K.M. were provided by state and federal (USDA-NIFA) funds appropriated to the Ohio Agricultural Research and Development Center. Additional research support from the Baas Memorial Endowment Fund is gratefully acknowledged.
Institutional Review Board Statement
Not applicable.
Informed Consent Statement
Not applicable.
Data Availability Statement
Acknowledgments
We thank the operators at the Deer Creek State Park, for their support in operating the irrigation system through the winter and for their assistance in sample collection.
Conflicts of Interest
The authors declare no conflict of interest. The funders had no role in the design of the study; in the collection, analyses, or interpretation of data; in the writing of the manuscript; or in the decision to publish the results.
References
- US EPA. 5.11 Fecal Bacteria. Water: Monitoring and Assessment. 2012. Available online: Archive.epa.gov/water/archive/web/html/vms511.html (accessed on 3 March 2021).
- USDA. Soil Quality Indicators. Natural Resources Conservation Service. 2008. Available online: www.nrcs.usda.gov/Internet/FSE_DOCUMENTS/nrcs142p2_053288.pdf (accessed on 22 February 2021).
- Pallardy, S.G. Absorption of water and ascent of sap. In Physiology of Woody Plants, 3rd ed.; Elsevier: Amsterdam, The Netherlands, 2008; pp. 287–323. [Google Scholar] [CrossRef]
- Smith, M.S.; Thomas, G.W.; White, R.E.; Ritonga, D. Transport of Escherichia coli through intact and disturbed soil columns. J. Environ. Qual. 1985, 14, 87–91. [Google Scholar] [CrossRef]
- Williams, A.P.; Roberts, P.; Avery, L.M.; Killham, K.; Jones, D.L. Earthworms as vectors of Escherichia coli O157:H7 in soil and vermicomposts. FEMS Microbiol. Ecol. 2006, 58, 54–64. [Google Scholar] [CrossRef] [PubMed] [Green Version]
- Tyler, E.J.; Laak, R.; McCoy, E.; Sandhu, S.S. The soil as a treatment system. In Proceedings of the Second National Home Sewage Treatment Symposium, Chicago, IL, USA, 12–13 December 1977; ASAE: St. Joseph, MI, USA, 1977; pp. 22–37. [Google Scholar]
- Peterson, T.C.; Ward, R.C. Bacterial Transport in Coarse Soils Beneath On-site Wastewater Treatment Systems. Colo. State Univ. Tech. Bull. 1987, 4, 23–25. [Google Scholar]
- Karathanasis, A.D.; Mueller, T.G.; Boone, B.; Thompson, Y.L. Effect of soil depth and texture on fecal bacteria removal from septic effluents. J. Water Health 2006, 4, 395–404. [Google Scholar] [CrossRef] [PubMed]
- Chen, G.S. Typhimurium and E. coli O157:H7 retention and transport in agricultural soil during irrigation practices. Eur. J. Soil Sci. 2012, 63, 239–248. [Google Scholar] [CrossRef]
- Miles, R.J.; Rubin, R.; West, L. Fecal coliform distribution under pressure dosed onsite wastewater systems. In Proceedings of the Eleventh Individual and Small Community Sewage Systems Conference, Warwick, RI, USA, 20–24 October 2007; ASABE: St. Joseph, MI, USA, 2007; p. 6, ASABE Publication Number 701P1107. [Google Scholar]
- Artz, R.R.E.; Townend, J.; Brown, K.; Towers, W.; Killham, K. Soil macropores and compaction control the leaching potential of Escherichia coli O157:H7. Environ. Microbiol. 2005, 7, 241–248. [Google Scholar] [CrossRef] [PubMed]
- Vidovic, S.; Block, H.C.; Korber, D.R. Effect of soil composition, temperature, indigenous microflora, and environmental conditions on survival of Escherichia coli 0157:H7. Can. J. Microbiol. 2007, 53, 822–829. [Google Scholar] [CrossRef] [PubMed]
- Noble, R.T.; Lee, I.M.; Schiff, K.C. Inactivation of indicator micro-organisms from various sources of faecal contamination in seawater and freshwater. J. Appl. Microbiol. 2004, 96, 464–472. [Google Scholar] [CrossRef] [PubMed] [Green Version]
- Cools, D.; Merckx, R.; Vlassak, K.; Verhaegen, J. Survival of E. coli and Enterococcus spp. derived from pig slurry in soils of different texture. Appl. Soil Ecol. 2001, 17, 53–62. [Google Scholar] [CrossRef]
- Bradford, S.A.; Segal, E. Fate of indicator microorganisms under nutrient management plan conditions. J. Environ. Qual. 2009, 38, 1728–1738. [Google Scholar] [CrossRef] [Green Version]
- Standridge, J.H. Effects of sunlight on coliform in water samples. Opflow 1986, 12, 6–7. [Google Scholar] [CrossRef]
- U.S. Corps of Engineers. Operation and Maintenance Manual On-Land Wastewater Facilities of Deer Creek State Park; U.S. Corps of Engineers: Washington, DC, USA, 1973. [Google Scholar]
- USDA. Web Soil Survey, Pickaway County, Ohio. Available online: Websoilsurvey.sc.egov.usda.gov/App/HomePage.htm (accessed on 22 April 2014).
- NOAA. National Climate Data Center, Circleville, Ohio. Available online: http://gis.ncdc.noaa.gov/map/viewer/#app=cdo&cfg=cdo&theme=daily&layers=111&node=gis (accessed on 23 May 2014).
- Ohio Department of Health. Ohio Administrative Code Chapter 3701-29: Sewage Treatment System Rules. 23–26. 2014. Available online: https://defiancecohealth.org/wp-content/uploads/2014/02/Defiance-County-Supplement-to-3701-29-of-the-OAC.pdf (accessed on 22 May 2014).
| Publisher’s Note: MDPI stays neutral with regard to jurisdictional claims in published maps and institutional affiliations. |
© 2021 by the authors. Licensee MDPI, Basel, Switzerland. This article is an open access article distributed under the terms and conditions of the Creative Commons Attribution (CC BY) license (https://creativecommons.org/licenses/by/4.0/).


